Embed Size (px)
Citation preview

Implementation of
Nonlinear Site Response
Tools for Surface Free-field
Motion Simulations
Pedro ArduinoLong ChenUniversity of Washington

Problem Statement
Free Field Analysis
Rock outcrop motion
elastic halfspace
soil
Surface motion
Bedrock “within” motion

Free-Field Analysis
Numerical solution1D – 2C
Bedrock
1D – 3C
Layer 1
Layer 2
Layer 3
Compliant Rock
1D – 1C

> Computational framework
– Equivalent linear, FEM (e.g OpenSees, Plaxis), FD (Flac)
– Total stress or Effective Stress
> Appropriate finite elements
– Coupled formulation (u-P most common for effective stress)
– Robustness and efficiency (e.g. SSP-UPBrick element)
> Appropriate constitutive model
– Formulation (e.g. multi-yield, bounding surface, hypoplasticity)
– Implementation (explicit, implicit)
> Boundary conditions
– Rock compliance
– Absorbing boundaries
> Pre and post processors
> Capabilities to run in parallel for parametric analysis
Numerical solution
Ingredients

> Formulation
– Kinematic Hardening
> Nested surfaces
– Prevost, Elgamal
> Bounding surfaces
– Dafalias, Borja & Amies
– Manzari-Dafalias, PM4Sand
> Implementation
– Explicit
– Implicit
– Consistent tangent operator
Constitutive Models

> PM4Sand model is a 2D model proposed by Boulanger and
Ziotopoulou(2015). It follows the plasticity framework proposed by
Dafalias and Manzari (2004) and is based on bounding surface
plasticity and critical state concepts.
> The model has 3 primary parameters:– Relative Density (Dr)
– Shear modulus coefficient Go
– Contraction rate parameter hpo
> And 21 optional secondary parameters.
Constitutive Models
PM4Sand Model Description

PM4Sand - Model Description
Surfaces (Yield, Bounding, Dilatancy, Critical)

Model Validation
Element test - Mixed Driver
e
s
ss
s
sg

Model Validation
Element test using MixedDriverMonotonic tests
Undrained monotonic DSS loading responses for DR = 35, 55, and 75% with initial confining pressures
of 0.25,1,4 and 16atm, K0 = 1.0

Cyclic tests
Undrained cyclic DSS loading responses for DR = 55% with initial
confining pressure of 1 atm, using CD = 0.16
Undrained cyclic DSS loading responses for DR = 75% with initial
confining pressure of 1 atm, using CD = 0.16
Model Validation
Element test using MixedDriver

Cyclic stress ratios vs. number of cycles to reach 3% shear strain for DR = 35, 55 and 75% with vertical
consolidation stresses of 1, 4 and 8 atm. K0 = 0.5
Effect of Kσ
Model Validation
Element test using MixedDriver

Cyclic stress ratios vs. number of cycles to reach 3% shear strain for DR = 35, 55 and 75% with vertical
consolidation stress of 1 atm and initial static shear stress ratios of 0.0, 0.1,0.2, and 0.3. K0 = 0.5
Effect of Ka
Model Validation
Element test using MixedDriver

> Strain controlled undrained simple shear test
using SSPquadUP or SSPbrickUP elements– a. Consolidation phase
– b. Cyclic shear phase
Validation
Element test in FE framework (OpenSees)
Consolidation Cyclic Shear

Validation
Element test in OpenSees
Undrained monotonic DSS loading responses for DR = 55%
with initial vertical stress 1atm and K0 = 0.5
Undrained cyclic DSS loading responses for DR = 55% with
initial vertical stress 1atm and K0 = 0.5

Validation: 1D Free-Field Analysis:
Synthetic soil profiles
ID L2 [m]Liquefiable layer
N160
N5-T3 3.0 5
N5-T6 6.0 5
N10-T3 3.0 10
N10-T6 6.0 10
N20-T3 3.0 20
N20-T6 6.0 20
Schematic of N10_T3 case
PM4Sand
PM4Sand
Linear Elastic
L1
L2
L3
GeometryL1 : Crust (2.0 m)L2 : Liquefiable layerL3 : Linear elastic layer (1.0m)
MotionsM1 : GilroyM2 : Northridge M3 : Chi-chi

– SSPquadUP elements with size of 0.25m
– Boundary Conditions:
> Nodes on the bottom fixed in vertical displacement DOFs
> Input motion is applied using dashpot
> Nodes at the same elevation tied together for displacement DOFs, but not
tied for the pore pressure DOF
> Nodes above ground water table fixed in pore pressure DOF
– Model is verified with ProShake and DeepSoil using scaled motion
RSN766(PGA = 0.02g)
PM4Sand
PM4Sand
Linear Elastic
FLAC (Version 8.00)
LEGEND
25-Jul-18 18:25
step 8000078
Flow Time 9.8039E-01
Dynamic Time 3.9990E+01
-3.750E+00 <x< 4.250E+00
-9.996E-01 <y< 7.000E+00
Grid plot
0 2E 0
Material model
elastic
pm4sand
Grid plot
0 2E 0
0.000
1.000
2.000
3.000
4.000
5.000
6.000
-3.000 -2.000 -1.000 0.000 1.000 2.000 3.000 4.000
JOB TITLE : .
Validation:1D analysis
numerical model
Plaxis MeshOpenSeesMesh
Schematic of N10_T3 case
Flac Mesh

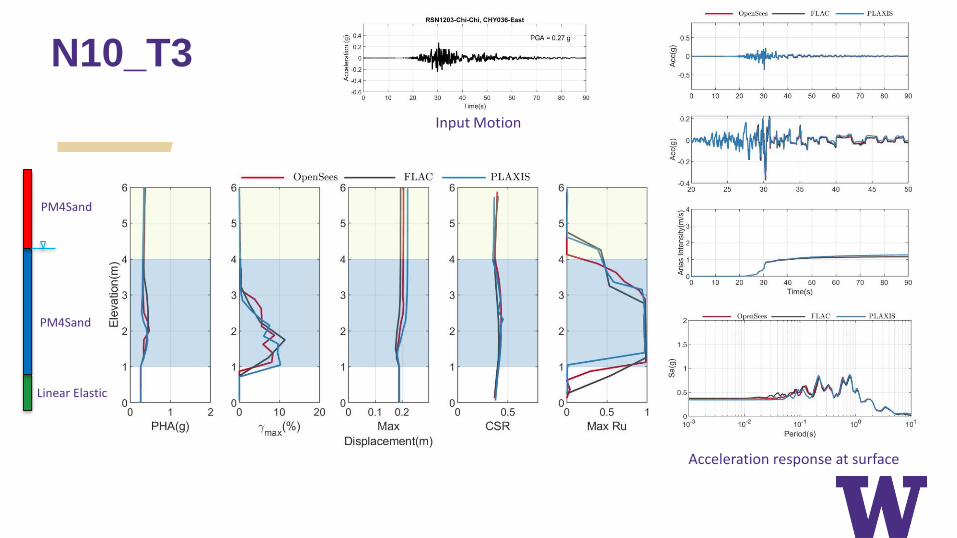
N10_T3
Acceleration response at surface
PM4Sand
PM4Sand
Linear Elastic
Input Motion

N10_T3
Acceleration response at surface
PM4Sand
PM4Sand
Linear Elastic
Input Motion
N10_T3
Acceleration response at surface
PM4Sand
PM4Sand
Linear Elastic
Input Motion

> N10T3 case is chosen
> Direction of gravitational acceleration is modified to
simulate constant slope
> Three motions are scaled to same PGAs, i.e. 0.1g,
0.2g and 0.3g.
Validation: 1D analysis
Sloping ground
𝑔 ∙ 𝑐𝑜𝑠(𝑠𝑙𝑜𝑝𝑒)
𝑔 ∙ 𝑠𝑖𝑛(𝑠𝑙𝑜𝑝𝑒)PM4Sand
PM4Sand
Linear ElasticLinear Elastic
PM4Sand
PM4Sand
3%
Ground Surface
3%

Validation: 1D analysis
Sloping ground
Comparison of PGA, max shear strain, max horizontal displacement, cyclic stress ratio and maximum excess pore pressure ratio profile between OpenSees and Flac(Gilory02 scaled to 0.3g).
Linear Elastic
PM4Sand
PM4Sand
3%
Comparison of lateral displacementat surface
Input Motion

Validation: 1D analysis
Sloping ground
Comparison of PGA, max shear strain, max horizontal displacement, cyclic stress ratio and maximum excess pore pressure ratio profile between OpenSees and Flac(NorthRidge scaled to 0.3g).
Linear Elastic
PM4Sand
PM4Sand
3%
Comparison of lateral displacementat surface
Input Motion

Validation: 1D analysis
Sloping ground
Comparison of PGA, max shear strain, max horizontal displacement, cyclic stress ratio and maximum excess pore pressure ratio profile between OpenSees and Flac(ChiChi scaled to 0.3g).
Linear Elastic
PM4Sand
PM4Sand
3%
Comparison of lateral displacementat surface
Input Motion

Comparison of lateral displacementat surface
1D analysis: sloping ground with
randomized properties for liquefiable layer
Linear Elastic
PM4Sand
PM4Sand
3%
Comparison of PGA, max shear strain, max horizontal displacement, cyclic stress ratio and maximum excess pore pressure ratio profile between deterministic and stochastic cases(Gilory02 scaled to 0.3g).
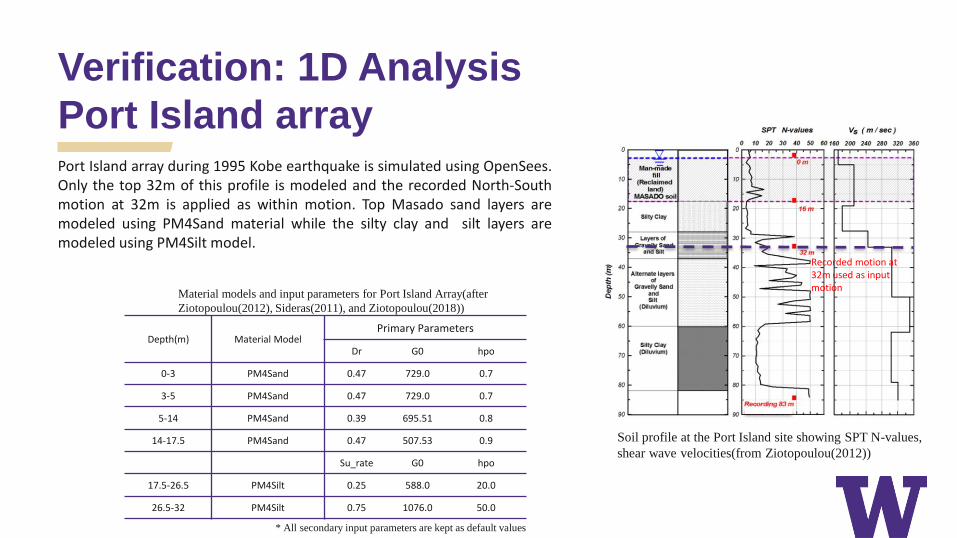
Verification: 1D Analysis
Port Island array
Soil profile at the Port Island site showing SPT N-values,
shear wave velocities(from Ziotopoulou(2012))
Port Island array during 1995 Kobe earthquake is simulated using OpenSees.Only the top 32m of this profile is modeled and the recorded North-Southmotion at 32m is applied as within motion. Top Masado sand layers aremodeled using PM4Sand material while the silty clay and silt layers aremodeled using PM4Silt model.
Recorded motion at 32m used as input motion
Depth(m) Material ModelPrimary Parameters
Dr G0 hpo
0-3 PM4Sand 0.47 729.0 0.7
3-5 PM4Sand 0.47 729.0 0.7
5-14 PM4Sand 0.39 695.51 0.8
14-17.5 PM4Sand 0.47 507.53 0.9
Su_rate G0 hpo
17.5-26.5 PM4Silt 0.25 588.0 20.0
26.5-32 PM4Silt 0.75 1076.0 50.0
Material models and input parameters for Port Island Array(after
Ziotopoulou(2012), Sideras(2011), and Ziotopoulou(2018))
* All secondary input parameters are kept as default values

Comparison of recorded and simulated response spectra at depth of 16m
Comparison of recorded and simulated response spectra at surface

Verification: 1D analysis
WildLife Array
Wildlife Liquefaction array(WLA) during 1987 Superstition Hills earthquake issimulated using OpenSees. Nonliquefiable layers are modeled usingPressureIndependMultiYield material and the material properties areadopted from Sideras(2011). Liquefiable layers are modeled using PM4Sandmaterial. PM4Sand material properties are listed below. All secondary
parameters are kept as default.
Soil profile at the WildLife site showing SPT N-values,
shear wave velocities(from Ziotopoulou(2012))

Comparison of recorded and simulated acceleration response spectra at surface
Comparison of recorded and simulated acceleration time history at surface

Resources: DesignSafe
Jupyter notebooks
Workflow:
a) Run OpenSeesb) Postprocess resultsc) Create reportd) Explore use of interactive
plots

Resources: SimCenter
Site Response App

Broad Band Platform
Site Response module
+

Broad Band Platform
Site Response module
.stl file.src file

Broad Band Platform
Site Response module
𝛾
𝜏
𝐺1
Nonlinear soil response
Model parameters related to laboratory evidence
log(𝛾)
𝐺/𝐺
𝑚𝑎𝑥
OpenSees model of soil layer
Layer 1
Layer 2
Layer 3
Bedrock
Surface

Broad Band Platform
Site Response module
Bash file
wo
rkfl
ow
Updated BBP

Thanks