Embed Size (px)
Citation preview
International Research Journal of Engineering and Technology (IRJET) e-ISSN: 2395 -0056
Volume: 03 Issue: 08 | Aug-2016 www.irjet.net p-ISSN: 2395-0072
© 2016, IRJET | Impact Factor value: 4.45 | ISO 9001:2008 Certified Journal | Page 49
Implementation of Lean in Automotive Component Manufacturing
Process Ramesh Babu K1, Jayachitra R2, Abinanth M3
1 PG Scholar, Dept. of Mechanical Engineering, PSG college of Technology, Tamilnadu, India 2Assistant Professor, Dept. of Mechanical Engineering, PSG college of Technology, Tamilnadu, India
3 PG Scholar,, Dept. of Mechanical Engineering, PSG college of Technology, Tamilnadu, India
---------------------------------------------------------------------***------------------------------------------------------------------
Abstract - Lean manufacturing appears to hold considerable promise for addressing a range of simultaneous, competitive demands including high levels of process and product quality, low cost and reductions in lead times. This addresses the application of lean manufacturing concepts to the continuous production sector with a focus on the Automotive Component manufacturing industry. The goal of this is to investigate how lean manufacturing tools can be adapted from the discrete to the continuous manufacturing environment. This paper presents lean manufacturing as a leading manufacturing paradigm applied in many sectors. The fundamental focus on lean production is the systematic elimination of non-value added activity and waste from the production process. The implementation of lean principles and methods results in improved system and surrounding performance. Value stream mapping is used to first map the current state used to identify sources of waste and to identify lean tools to eliminate this waste. The future state map is then developed for a system with lean tools applied to it. To quantify the benefits gained from using lean tools and techniques in the value stream mapping, a detailed simulation model is developed and a designed experiment is used to analyze the outputs of the simulation model for different lean configurations. This paper demonstrates the implementation of lean philosophy through layout modification.
Key Words: Lean Manufacturing, Value Stream Mapping, VSM, Bottleneck, Line balancing 1. INTRODUCTION
As the demand for new product requirement in the modern automotive field is increasing day-by-day with latest technology up gradation like noiseless motion (EPA noise requirements), friction free conversion of power transmission and capable of transmitting load and speed is drastically increasing to compete with the world leaders.
Our Scope is concerned with manufacturing of inverted tooth chains. To implement a methodology in manufacturing of Inverted toothed chains so as to enhance current customer’s demand of 0.65Lakh units/month and to extract new customers with customer delight as our quality policy.
Improve productivity and increase profits through lean manufacturing.
The ultimate goal of lean manufacturing is to reduce waste in manpower, inventory, time to market, to become highly responsive to customer demand while producing quality products in a more efficient and economical manner [11]. It is well known that seven types of waste generally occur [9] as listed in Table 1.
TABLE I: SEVEN TYPES OF WASTES
Waste Description
Over production
Producing too much or too soon, resulting in poor flow of information or products
Unnecessary inventory
Excessive storage and delay of information or products, resulting in excess inventory, leading to a high holding cost and poor customer service
Waiting Long periods of inactivity of people, information or products, resulting in poor flow and long lead times
Excessive transportation
Excessive movement of people, information or products, resulting in wasted time and cost
Defects
Frequent errors in paperwork, material, final product quality problems, resulting in scrap and/or rework, as well as poor delivery performance
Ineffective Motion
Process is not well designed so that the operator will waste much more time for excess motions to handle the process
Inappropriate processing
Process itself is inappropriate caused by using the wrong set of tools, procedures or systems
International Research Journal of Engineering and Technology (IRJET) e-ISSN: 2395 -0056
Volume: 03 Issue: 08 | Aug-2016 www.irjet.net p-ISSN: 2395-0072
© 2016, IRJET | Impact Factor value: 4.45 | ISO 9001:2008 Certified Journal | Page 50
Visualizing the flow creates the ability to see where, when, and how both the information and product flows through, and consequently recognize and eliminate the source of waste. Unfortunately, many manufacturers have failed to fully understand this in their initial excitement and eagerness to start with the lean approaches. The implementation of these approaches involves more than just applying individual concepts like Kanban, layout planning, visual control, and takt time calculations [1]. Typically, such organizations sporadically carry out these activities without linking their efforts to a systematic framework.
A critical assessment of many lean tools suggests that a key weakness is the absence of a visual nature, i.e., the ability of people with knowledge of lean techniques to explain the current dynamics of the organization and to communicate an action plan that would be understood by all key stakeholders. There is a need to develop a more systematic means to help guide these lean tools and activities. Value stream mapping (VSM) is vigorously capable of undertaking this role. It not only highlights process inefficiencies, Transactional and communication mismatches, but also guides the improvement area.
2. LITERATURE SURVEY
The concepts required for the project were gathered and studied from various journals published in the field of lean manufacturing techniques, for improving productivity and quality.
2.1 Lean
The new uprising in the manufacturing goods and service sector has created great challenges for the industries. Customer driven and highly competitive market has rendered the old method of managerial approach is inadequate to cope with these challenges. These factors formed a big challenge for companies to look for new tools to move up the ladder in a global competitive growing market. To become more profitable many manufacturers have started to turn into lean manufacturing principles to elevate their performance.
The basic idea behind a lean manufacturing system, which has been practiced for many years in Japan, are waste elimination, cost reduction and employee empowerment. The Japanese philosophy of doing business is totally different than that of the US. The traditional belief in the west is that, the only way to make profit is to add it to the manufacturing cost in order to come up with a desired selling price [7]. On the contrary, Japanese believes that customers are generated of the selling price. The more quality one is built into the product and more service one offers, the more the price customers will pay.
The lean manufacturing discipline is to work in every facet of value stream by eliminating waste in order to reduce costs,
generate capital, and bring in more sales in order to be competitive in a growing global market.
The term lean as Womack defines it denotes a system it utilize less inputs, to create the same output created by the traditional mass production system, with increase product variety[8]. This business philosophy goes by different names, Agile manufacturing, just in time manufacturing, synchronous manufacturing, world class manufacturing and continuous flow are the terms used parallel with lean manufacturing.
Lean focuses on abolishing or reducing wastes (or “muda”, the Japanese word for waste) and on maximizing or fully utilizing activities that add value from the customer’s perspective. From customer’s perspective, value is equivalent to anything that the customer is willing to pay for product or service that follows. So elimination of waste is the basic principle of lean manufacturing. For companies this would involve any of these following [7],[10],[11].
Material: Convert all raw materials to end products. Avoid excess raw materials and scrap.
Inventory: Keep Constant flow to the customer and to have idle material.
Overproduction: Produce the exact quantity as per customers demand, and when they need it.
Labour: Get rid of unwanted footprints.
Complexity: Try to solve problems in an uncomplicated way rather than complex way.
Energy: Maximize the utilization of equipment and people in most productive way. Avoid unnecessary operations and excess power utilization.
Space: Reorganize equipment, people and workstations to get a better space.
Defects: Make every effort to eliminate waste.
Transportation: Get rid of transportation of information and material that does not add value to the product.
Time: Avoid long setups, delays and unexpected machine downtime.
Unnecessary Motion: Avoid excessive bending or stretching and frequently lost items.
The most significant source of waste is inventory. Work–in-process and finished goods inventory does not add value to the product and they should be reduced or eliminated. When inventory is reduced, hidden problems can appear and actions can be taken immediately. There are many ways to reduce the amount of inventory, one of which is reducing lot size. Lot size can be reduced by reducing the set up time, so as to make the cost per unit constant as the economic order quantity formula states [4].

International Research Journal of Engineering and Technology (IRJET) e-ISSN: 2395 -0056
Volume: 03 Issue: 08 | Aug-2016 www.irjet.net p-ISSN: 2395-0072
© 2016, IRJET | Impact Factor value: 4.45 | ISO 9001:2008 Certified Journal | Page 51
At Toyota Shingo developed the concept of single minute exchange of die (SMED) to reduce the set up time [10]. For instance, set up time in punching presses can be reduced from hours to less than ten minutes. Another method to reduce inventory is by minimizing machine down time, this can be achieved through Preventive maintenance.
Transportation time is another source of waste. Moving parts from one end of the facility to another involves time, energy and people; this can be minimized by utilizing cellular layout or U-shaped Assembly lines to ensure continuous flow of production. Another source of waste is defected and scrap. Total productivity maintenance is one way to eliminate defects and scrap. Manufacturing parts that are fault-free from the beginning has profound consequences for productivity [3].
There is no doubt that elimination of waste is an essential ingredient for survival in today’s growing market. Companies must strive to create high-quality, and low cost products that can get to the customers in the shortest time possible. There are sets of tools that were developed at Toyota and that can be utilized to eliminate or at least reduce the source of waste.
2.2 Lean Manufacturing Tools and Techniques
Once companies identify the major sources of waste, tools such as continuous improvement, just-in-time production, production smoothing and others will guide the company to eliminate the waste.
2.2.1 Cellular Manufacturing: Cellular manufacturing is a concept that increases the mix of the products with minimum waste. A cell consists of equipment and workstations that are arranged in an order that maintains a smooth and continuous flow of materials and components through the process. It also has operators well trained to operate in that cell.
One of the advantages of cell is one-piece flow concept, which states that each product moves through process one unit at a time without sudden interruption, as per the demand of the customers. Extending the product mix is another advantage of cellular manufacturing. When customers demand a high variety of products as well as faster delivery rates, it is important to have flexibility in the process to accommodate their needs. This flexibility can be achieved through grouping similar products into families that can be processed on the same equipment in the same sequence. This will also shorten the time required for change over between products. Other benefits include:
Improved productivity and Better space utilization
Enhanced flexibility and visibility
Inventory reduction (WIP) and Lead time reduction
Reduced Transport and material handling.
Identification of causes of defects
2.2.2 Continuous Improvement: Continuous improvement is another fundamental principle of lean manufacturing. Kaizen, which is the Japanese word for a continuous endeavour for perfection. Kaizen is a systematic approach to gradual, orderly, continuous improvement. In manufacturing settings improvement can take place in many forms such as reduction of inventory, reduction of defective parts. One of the effective continuous improvement tools is 5S.
5S is a first, modular step toward serious waste reduction. 5S consists of the Japanese words Seiri (Sort), Seiton (Straighten), Seiso (Sweep and clean), Seiketsu (Systemize), and Shitsuke (Standardize). The underlying concept is to look for waste and try to eliminate it. Waste could be in the form of scrap, defects, raw materials, unneeded items, old broken tools, and obsolete jigs and fixtures.
2.2.3 Just-in-Time: It is a management idea that attempts to eliminate the sources of manufacturing waste by producing the right part in right place and at the right time. This addresses the waste such as work-in-process material, defects, and poor scheduling of parts delivered. [6]. Inventory and material flow systems are typically classified as either push (traditional) or pull (just-in-time) system. Customer demand is the driving force behind both systems. However the major difference is in how each system handles customer demand. Just-in-time is a tool that enables the internal process of a company to adapt to sudden changes in the demand pattern by producing the right product at the right time and in right quantities. Moreover, just-in-time is a critical tool to manage the external activities of a company such as purchasing and distribution.
Benefits of JIT are [6].
Eliminating unnecessary work-in-process, this results in reduction of inventory cost.
Since units are produced only when required, quality problem can be detected early.
Since inventory is reduced, the waste of storage place will be reduced.
Preventing excess production can uncover hidden problems.
2.2.4 Production Smoothing: In lean manufacturing system it is important to move to a higher degree of process control in order to strive to reduce waste. Another tool to accomplish this is production smoothing. Heijunka, the Japanese word for production smoothing, is where the manufacturers try to keep the production level as constant as possible from day to day [11]. Heijunka is a concept adapted from the Toyota production system, where in order to decrease production cost it was necessary to build no more cars and parts that the number that could be sold. To accomplish this, the production schedule should be smooth so as to effectively produce the right quantity of parts and efficiently utilize man power. If the
International Research Journal of Engineering and Technology (IRJET) e-ISSN: 2395 -0056
Volume: 03 Issue: 08 | Aug-2016 www.irjet.net p-ISSN: 2395-0072
© 2016, IRJET | Impact Factor value: 4.45 | ISO 9001:2008 Certified Journal | Page 52
production level is not constant this will lead to waste(Work-in-process inventory) at the workplace.
2.2.5 Standardization of work: A very important principle of waste elimination is the standardization of work actions. Standardized work basically ensures that each job is organized and is carried out in the most effective manner, no matter who is performing the job, the same level of quality to be achieved. At Toyota every worker follows the same processing steps all the time needed to finish a job, order of steps to follow the job and parts on hand. By doing this one ensures that the line is balanced, unwanted work-in-process inventory is minimized and non-value added activities are reduced. A tool that is used to standardize work is called “takt” time. Takt (German for rhythm or beat) time refers to how often a part should be produced in a product family based on the actual customer demand. The target is to produce at a pace not higher than the takt time (Mid-America Manufacturing Technology Centre press release, 2000). Takt time is calculated based on the following formula [2].
2.2.6 Other Waste Reduction Techniques: Some of the other waste reduction tools include zero defects, setup reduction, and line balancing. The goal of zero defects is to ensure that the products are fault-free all the way, through continuous improvement of the manufacturing process [4]. Human beings almost invariably will make errors. When errors are made and are not caught, then defective parts will appear at the end of the process. However, if errors can be prevented before they happen then defective parts can be avoided. One of the tools that the zero-defect principle uses is poka-yoke. Poka-yoke, which was developed by Shingo, is an autonomous defect control system that is put on a machine that inspects all parts to make sure that there are zero defects. The goal of poka-yoke is to observe the defective parts at the source, detect the cause of the defect, and to avoid moving the defective part to the next workstation [2].
3. Objective
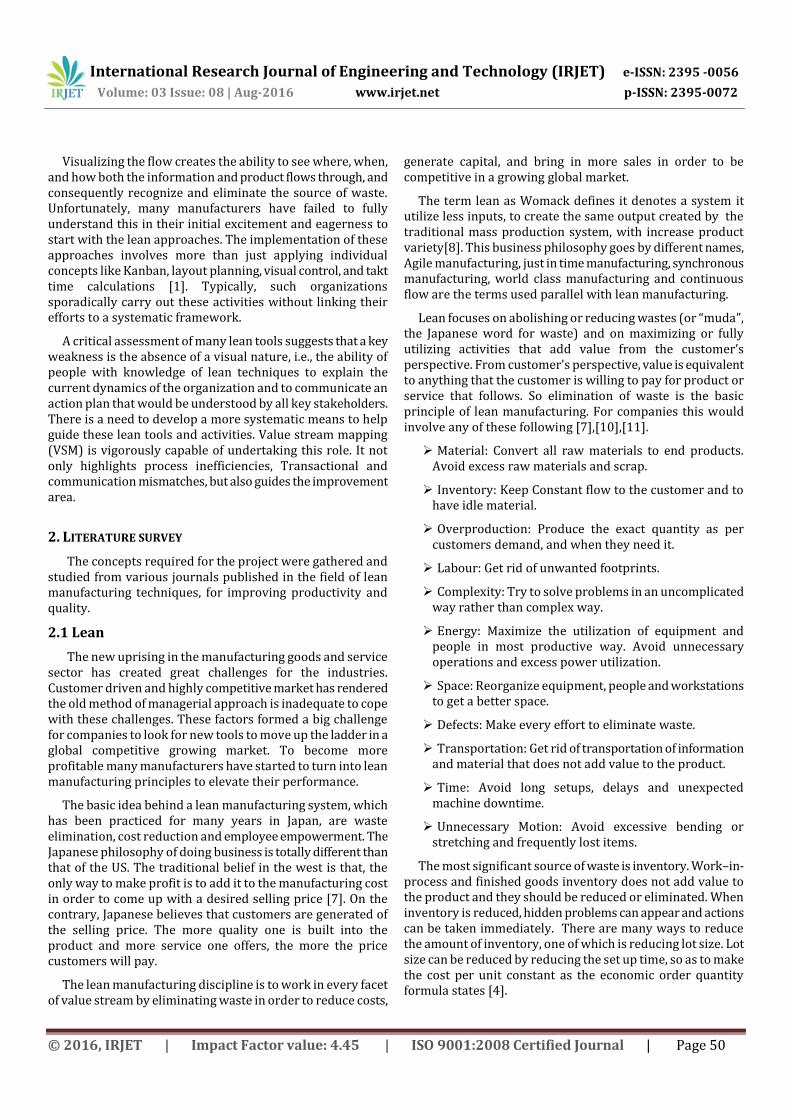
The objective of our project is to demonstrate systematically how lean manufacturing tools used appropriately so that industry can eliminate waste. Hence better inventory control, better product quality, and better overall financial and operational procedure can be achieved. To study of opportunities for continuous improvement (KAIZEN) in an assembly line. From the fig.1 is to explain the Objective of lean implementation.
Fig. 1 Objective Flowchart
4. METHODOLOGY
Getting started with an effective program to implement lean manufacturing requires careful planning, design and execution of the business changes needed to achieve the desired improvement goals. Implementation should not begin unless top management is solidly championing the effort with an understanding that many business processes must be changed. Starting with a pilot product line or other contained area of the business is a big help to “proof” your concept and methodology. Organize and plan for Lean manufacturing with executive champion.
Conduct extensive education
Value stream map administrative, engineering and production processes.
Develop concept for lean manufacturing pilot
Establish improvement targets
Develop time-phased implementation Plan
Present lean manufacturing pilot concept and plan to management
Obtain management approval and commitment
Train all employees involved in pilot
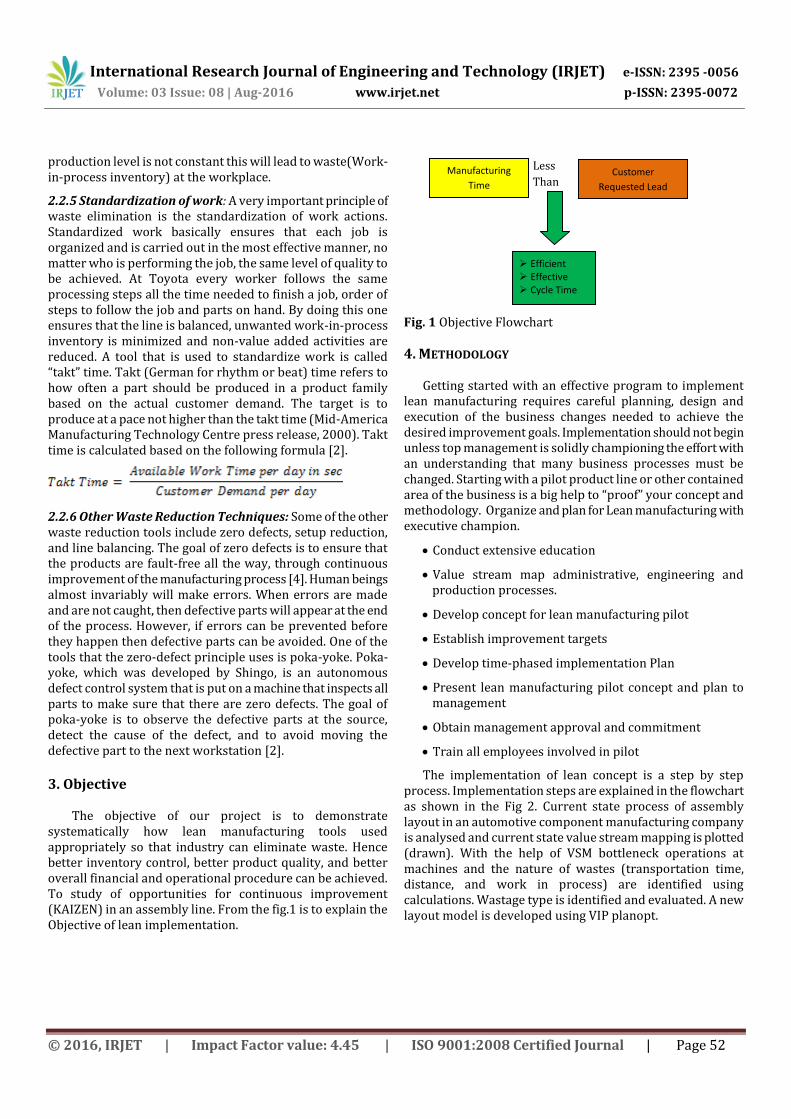
The implementation of lean concept is a step by step process. Implementation steps are explained in the flowchart as shown in the Fig 2. Current state process of assembly layout in an automotive component manufacturing company is analysed and current state value stream mapping is plotted (drawn). With the help of VSM bottleneck operations at machines and the nature of wastes (transportation time, distance, and work in process) are identified using calculations. Wastage type is identified and evaluated. A new layout model is developed using VIP planopt.
Manufacturing
Time
Efficient Effective Cycle Time
Customer
Requested Lead
Time
Less
Than
Or
Equal
International Research Journal of Engineering and Technology (IRJET) e-ISSN: 2395 -0056
Volume: 03 Issue: 08 | Aug-2016 www.irjet.net p-ISSN: 2395-0072
© 2016, IRJET | Impact Factor value: 4.45 | ISO 9001:2008 Certified Journal | Page 53
Fig. 2: Methodology Flowchart
4.1 Major Clients
Major clients include Original Equipment Manufacturers like
Harley Davidson
Polaris
Honda
TVS
Cannon etc.,
4.2 Product description
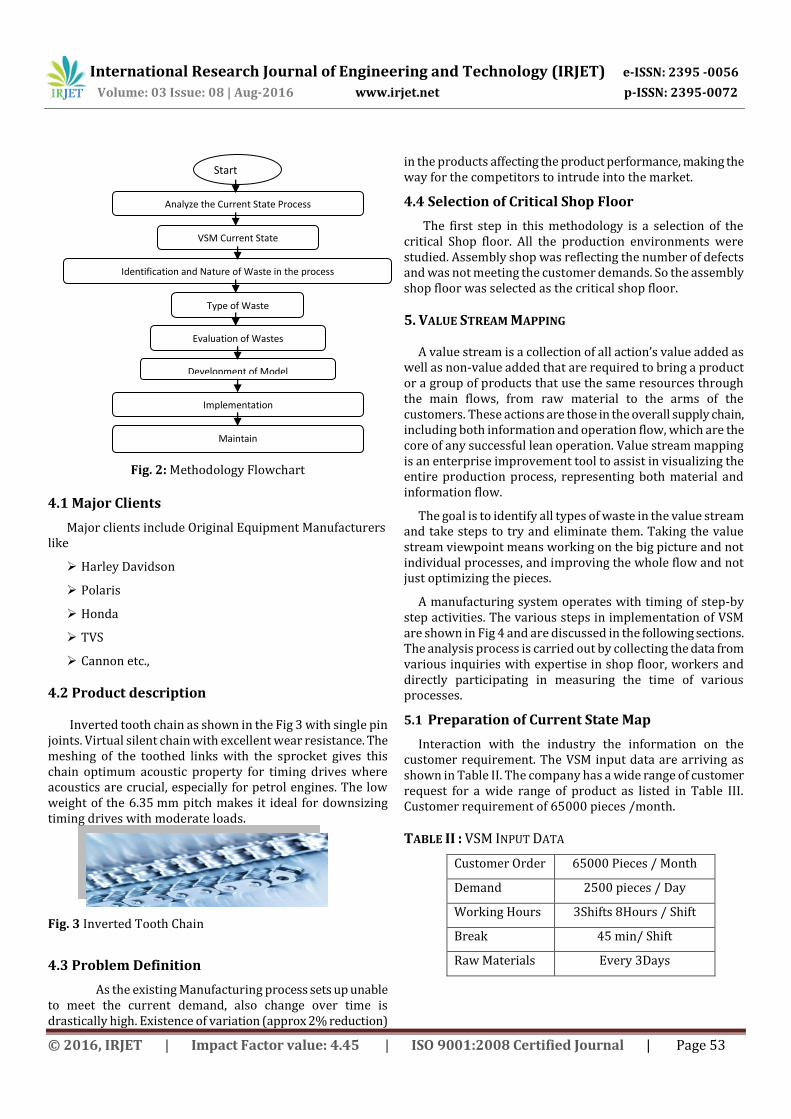
Inverted tooth chain as shown in the Fig 3 with single pin joints. Virtual silent chain with excellent wear resistance. The meshing of the toothed links with the sprocket gives this chain optimum acoustic property for timing drives where acoustics are crucial, especially for petrol engines. The low weight of the 6.35 mm pitch makes it ideal for downsizing timing drives with moderate loads.
Fig. 3 Inverted Tooth Chain
4.3 Problem Definition
As the existing Manufacturing process sets up unable to meet the current demand, also change over time is drastically high. Existence of variation (approx 2% reduction)
in the products affecting the product performance, making the way for the competitors to intrude into the market.
4.4 Selection of Critical Shop Floor
The first step in this methodology is a selection of the critical Shop floor. All the production environments were studied. Assembly shop was reflecting the number of defects and was not meeting the customer demands. So the assembly shop floor was selected as the critical shop floor.
5. VALUE STREAM MAPPING
A value stream is a collection of all action’s value added as well as non-value added that are required to bring a product or a group of products that use the same resources through the main flows, from raw material to the arms of the customers. These actions are those in the overall supply chain, including both information and operation flow, which are the core of any successful lean operation. Value stream mapping is an enterprise improvement tool to assist in visualizing the entire production process, representing both material and information flow.
The goal is to identify all types of waste in the value stream and take steps to try and eliminate them. Taking the value stream viewpoint means working on the big picture and not individual processes, and improving the whole flow and not just optimizing the pieces.
A manufacturing system operates with timing of step-by step activities. The various steps in implementation of VSM are shown in Fig 4 and are discussed in the following sections. The analysis process is carried out by collecting the data from various inquiries with expertise in shop floor, workers and directly participating in measuring the time of various processes.
5.1 Preparation of Current State Map
Interaction with the industry the information on the customer requirement. The VSM input data are arriving as shown in Table II. The company has a wide range of customer request for a wide range of product as listed in Table III. Customer requirement of 65000 pieces /month.
TABLE II : VSM INPUT DATA
Customer Order 65000 Pieces / Month
Demand 2500 pieces / Day
Working Hours 3Shifts 8Hours / Shift
Break 45 min/ Shift
Raw Materials Every 3Days
Start
Analyze the Current State Process
VSM Current State
Identification and Nature of Waste in the process
Type of Waste
Evaluation of Wastes
Development of Model
Implementation
Maintain
International Research Journal of Engineering and Technology (IRJET) e-ISSN: 2395 -0056
Volume: 03 Issue: 08 | Aug-2016 www.irjet.net p-ISSN: 2395-0072
© 2016, IRJET | Impact Factor value: 4.45 | ISO 9001:2008 Certified Journal | Page 54
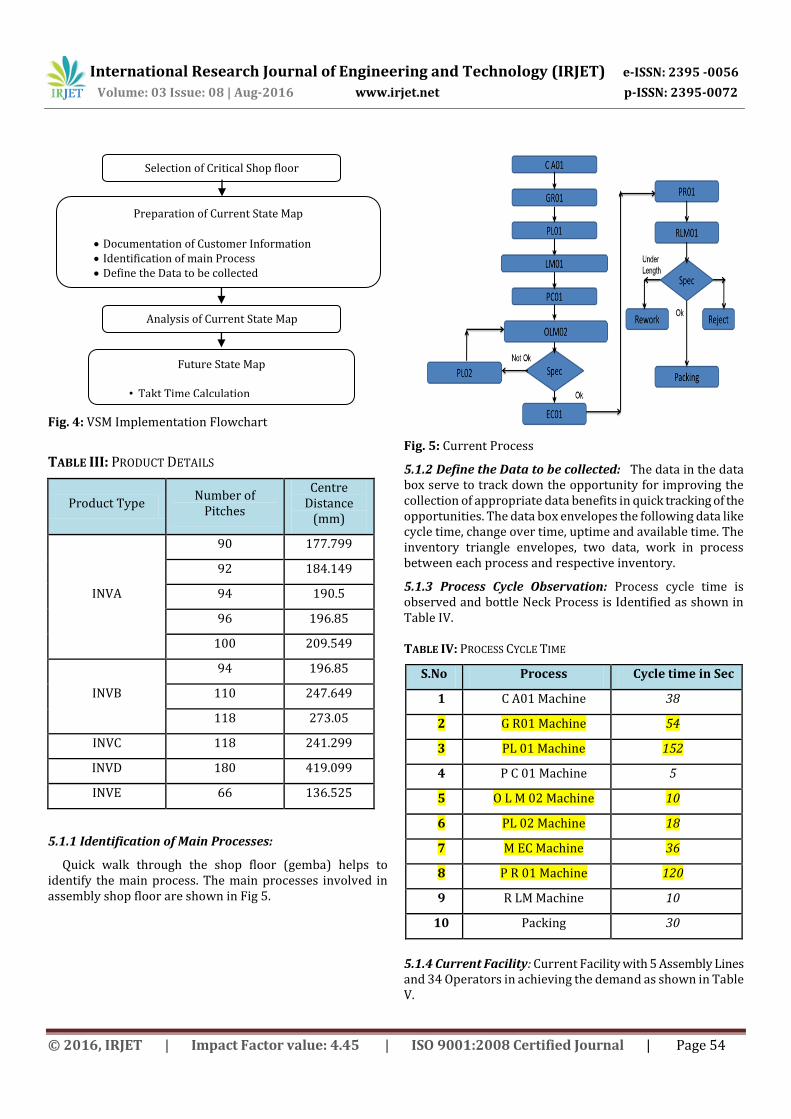
Fig. 4: VSM Implementation Flowchart
TABLE III: PRODUCT DETAILS
Product Type Number of
Pitches
Centre Distance
(mm)
INVA
90 177.799
92 184.149
94 190.5
96 196.85
100 209.549
INVB
94 196.85
110 247.649
118 273.05
INVC 118 241.299
INVD 180 419.099
INVE 66 136.525
5.1.1 Identification of Main Processes:
Quick walk through the shop floor (gemba) helps to identify the main process. The main processes involved in assembly shop floor are shown in Fig 5.
Fig. 5: Current Process
5.1.2 Define the Data to be collected: The data in the data box serve to track down the opportunity for improving the collection of appropriate data benefits in quick tracking of the opportunities. The data box envelopes the following data like cycle time, change over time, uptime and available time. The inventory triangle envelopes, two data, work in process between each process and respective inventory.
5.1.3 Process Cycle Observation: Process cycle time is observed and bottle Neck Process is Identified as shown in Table IV. TABLE IV: PROCESS CYCLE TIME
S.No Process Cycle time in Sec
1 C A01 Machine 38
2 G R01 Machine 54
3 PL 01 Machine 152
4 P C 01 Machine 5
5 O L M 02 Machine 10
6 PL 02 Machine 18
7 M EC Machine 36
8 P R 01 Machine 120
9 R LM Machine 10
10 Packing 30
5.1.4 Current Facility: Current Facility with 5 Assembly Lines and 34 Operators in achieving the demand as shown in Table V.
Selection of Critical Shop floor
Preparation of Current State Map
Documentation of Customer Information Identification of main Process Define the Data to be collected Map the Data
Future State Map
• Takt Time Calculation • Implementing the Lean Tool
Analysis of Current State Map

International Research Journal of Engineering and Technology (IRJET) e-ISSN: 2395 -0056
Volume: 03 Issue: 08 | Aug-2016 www.irjet.net p-ISSN: 2395-0072
© 2016, IRJET | Impact Factor value: 4.45 | ISO 9001:2008 Certified Journal | Page 55
TABLE V: CURRENT FACILITY
Description Assembly
Line OLM02 PL02 PR01 RLM
Machine 5 5 5 6 4
Man Power 5 5 5 15 4
5.2 TAKT Time: A Benchmark for Process Pace
Takt demonstrates the rate at which the customer buys the product. TAKT reflects the frequency at which the product has to come out of the manufacturer to meet the customer demand. Takt time is calculated by dividing available working time per day (in sec) with the customer demand per day.
Takt Time = 31.3 sec
Demand = 65000 pieces / month
Demand = 2500 pieces / month
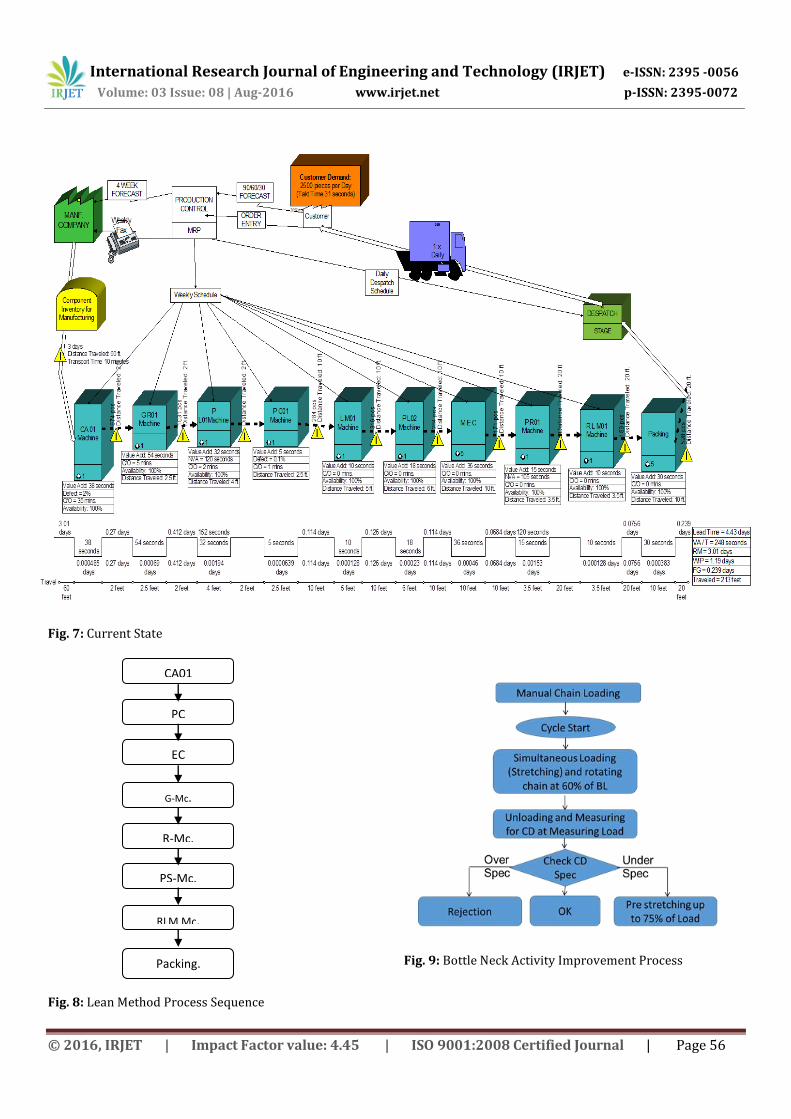
TAKT Time of 31 seconds represents, every piece has to be completed in every 31 seconds. The current state map sights as shown in Fig. 7, that GR01, PL01,MEC and PR01 processes takes more time than the Takt time and Work Balancing as shown in Fig. 6 and Table VI. In order to address the problem layout modification was carried out.
5.3 Process Improvement
Improvements in quality, flexibility and speed are commonly required. The following lists some of the ways that processes can be improved.
• Rearranging the layout to eliminate large amounts of inventory between operations
• Combining of Process, so as to eliminate post assembly processing and validation as shown in Fig. 8
• To improve the efficiency of the bottleneck activity as shown in Fig.9
• Minimize non-value adding activities (reduce lead time)
• Eliminating the batching and moving to one piece flow
TABLE VI: WORK BALANCING
S No Process
Cycle Time
(sec)
Value Added Time (sec)
Non- Value Added Time (sec)
1 CA01 Mc. 38 38
2 G R01 Mc. 54 54
3 PL 01 Mc. 152 32 120
4 PC 01 Mc. 5 5
5 OLM 02 Mc. 10 10
6 PL 02 Mc. 18 18
7 MEC Mc. 36 36
8 P R 01 Mc 120 15 105
9 R LM Mc 10 10
10 Packing 30 30
Work Time =248 sec
Takt Time = 31 sec
= 8 Operators
Fig. 6: Work Balancing
International Research Journal of Engineering and Technology (IRJET) e-ISSN: 2395 -0056
Volume: 03 Issue: 08 | Aug-2016 www.irjet.net p-ISSN: 2395-0072
© 2016, IRJET | Impact Factor value: 4.45 | ISO 9001:2008 Certified Journal | Page 56
Fig. 7: Current State
Fig. 8: Lean Method Process Sequence
Fig. 9: Bottle Neck Activity Improvement Process
CA01
PC
EC
R-Mc.
PS-Mc.
G-Mc.
RLM Mc.
Packing.

International Research Journal of Engineering and Technology (IRJET) e-ISSN: 2395 -0056
Volume: 03 Issue: 08 | Aug-2016 www.irjet.net p-ISSN: 2395-0072
© 2016, IRJET | Impact Factor value: 4.45 | ISO 9001:2008 Certified Journal | Page 57
5.4 Cycle Time Observation
5.4.1 Future State -1: After Process Improvement, Cycle time is observed as shown in Table VII. As in the table R-Machine time is more than the Takt time, still improvement can be made. VSM for future state 1 is drawn as shown in Fig. 10, Work Balancing is calculated as shown in Table VII and Fig.11 Table VII: Cycle Time Observation
S.No Process SPM No Of Pins /
min
Cycle time Sec
1 C A01
Machine 90 270 22
2 PC Machine 80 10
3 EC Machine 80 12
4 G- Machine 130 260 25
5 R-Machine 130 130 48
6 PS- Machine 18
7 R LM
Machine 10
8 Packing 30
175
TABLE VIII: WORK BALANCING
S No
Process
Cycle Time
(sec)
Value Added
Time (sec)
Non- Value Added
Time (sec)
1 CA01
Machine 22 22
2 PC Machine 10 10
3 EC
Machine 12 10 2
4 G- Machine 25 22 3
5 R-Machine 48 46 2
6 PS-
Machine 18 18
7 R LM
Machine 10 10
8 Packing 30 30
168
Work Time =168 sec
Takt Time = 31 sec
= 6 Operators
5.4.2 Future State -2: As in the table R-Machine time is more than the Takt time, still improvement can be made. So Twin Station was introduced and cycle time was observed as shown in Table IX. VSM for future state-2 is drawn as shown in Fig.13, Work Balancing is calculated as shown in Table X and Fig 12 TABLE IX: CYCLE TIME OBSERVATION
S.No Process SPM No Of Pins /
min
Cycle time in
Sec
1 C A01
Machine 90 270 22
2 PC Machine 80 10
3 EC Machine 80 12
4 G- Machine 130 260 25
5 R-Machine 130 260 25
6 PS- Machine 18
7 R LM
Machine 10
8 Packing 30
152
TABLE X: WORK BALANCING
S No
Process
Cycle Time
(sec)
Value Added Time (sec)
Non- Value Added
Time (sec)
1 CA01 Machine 22 22
2 PC Machine 10 10
3 EC Machine 12 10 2
4 G- Machine 25 22 3
5 R-Machine
(Twin Station) 25 22 2
6 PS- Machine 18 18
7 R LM Machine 10 10
8 Packing 30 30
144
Work Time =144 sec
Takt Time = 31 sec
= 5 Operators

International Research Journal of Engineering and Technology (IRJET) e-ISSN: 2395 -0056
Volume: 03 Issue: 08 | Aug-2016 www.irjet.net p-ISSN: 2395-0072
© 2016, IRJET | Impact Factor value: 4.45 | ISO 9001:2008 Certified Journal | Page 58
International Research Journal of Engineering and Technology (IRJET) e-ISSN: 2395 -0056
Volume: 03 Issue: 08 | Aug-2016 www.irjet.net p-ISSN: 2395-0072
© 2016, IRJET | Impact Factor value: 4.45 | ISO 9001:2008 Certified Journal | Page 59
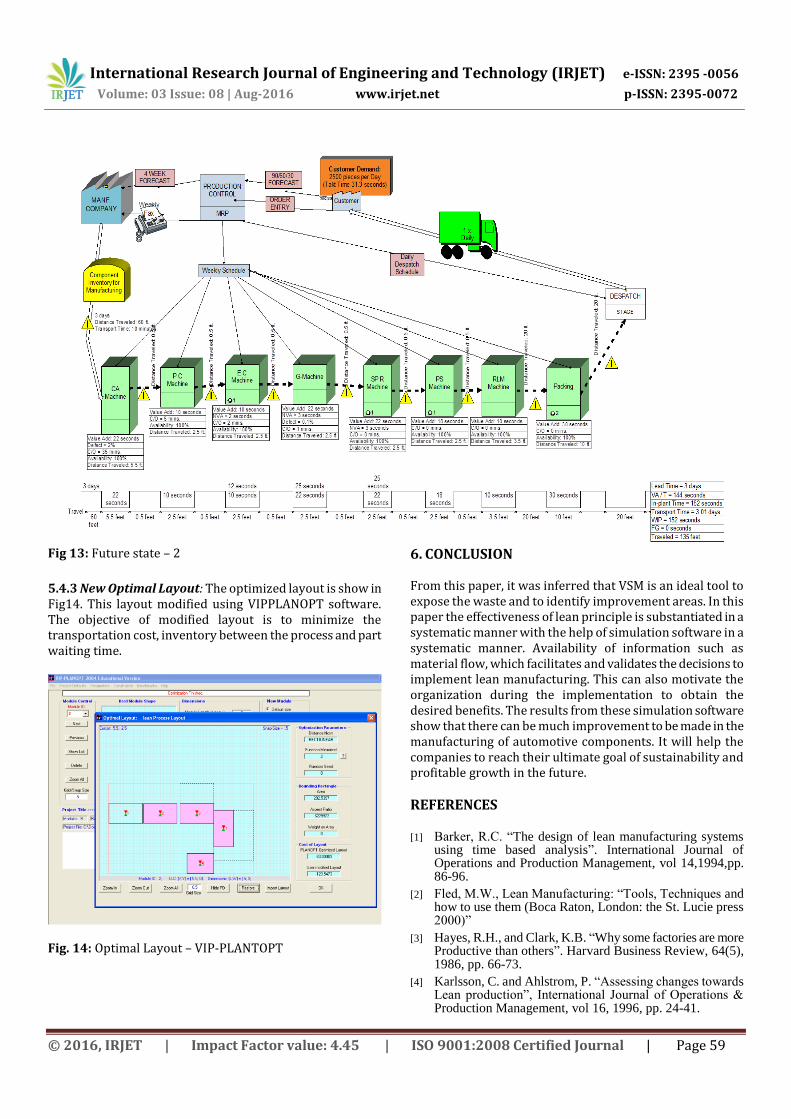
Fig 13: Future state – 2
5.4.3 New Optimal Layout: The optimized layout is show in Fig14. This layout modified using VIPPLANOPT software. The objective of modified layout is to minimize the transportation cost, inventory between the process and part waiting time.
Fig. 14: Optimal Layout – VIP-PLANTOPT
6. CONCLUSION
From this paper, it was inferred that VSM is an ideal tool to expose the waste and to identify improvement areas. In this paper the effectiveness of lean principle is substantiated in a systematic manner with the help of simulation software in a systematic manner. Availability of information such as material flow, which facilitates and validates the decisions to implement lean manufacturing. This can also motivate the organization during the implementation to obtain the desired benefits. The results from these simulation software show that there can be much improvement to be made in the manufacturing of automotive components. It will help the companies to reach their ultimate goal of sustainability and profitable growth in the future.
REFERENCES [1] Barker, R.C. “The design of lean manufacturing systems
using time based analysis”. International Journal of Operations and Production Management, vol 14,1994,pp. 86-96.
[2] Fled, M.W., Lean Manufacturing: “Tools, Techniques and how to use them (Boca Raton, London: the St. Lucie press 2000)”
[3] Hayes, R.H., and Clark, K.B. “Why some factories are more Productive than others”. Harvard Business Review, 64(5), 1986, pp. 66-73.
[4] Karlsson, C. and Ahlstrom, P. “Assessing changes towards Lean production”, International Journal of Operations & Production Management, vol 16, 1996, pp. 24-41.
International Research Journal of Engineering and Technology (IRJET) e-ISSN: 2395 -0056
Volume: 03 Issue: 08 | Aug-2016 www.irjet.net p-ISSN: 2395-0072
© 2016, IRJET | Impact Factor value: 4.45 | ISO 9001:2008 Certified Journal | Page 60
[5] Krafcik, J. “Triumph of the Lean production system”, Sloan Management Review 30, 1988, pp. 41–52.
[6] Nahmias, Steven, Production and Operations Analysis, 3rd ed., Irwin Publishing (1997).
[7] Ohno, Taiichi “Toyota Production System: Beyond Large-Scale Production”, Productivity Press, (1988), ISBN 0-915299-14-3.
[8] Roberto Panizzolo. “Applying the lessons learned from 27 lean manufacturing. The relevance of relationships management”, International Journal of Production Economics, Vol 55, 1998, pp. 223-240.
[9] Sullivan, W.G., McDonald, T., & Van Aken, E.M. “Equipment replacement decisions and lean manufacturing”, Robotics and Computer-Integrated Manufacturing, vol 18, 2002, pp. 255-265.
[10] Shingo, S. (1985). A Revolution in Manufacturing: the SMED System. Productivity Press, Cambridge, MA.
[11] Womack, J., Roos, D. and Jones, D.T. (1990). The Machine that Changed the World: The Story of Lean Production, Harper Perennial: New York, NY.
BIOGRAPHIES K. Ramesh Babu is a PG Scholar in Industrial Engineering at PSG College of Technology, Coimbatore, India. He have a working experience for above 12 years in the field of textile machine reconditioning and sub assembly. He also expert in reengineering Auto Loom machines and currently he is a manager in SPM department. R. Jayachitra is an Assistant Professor in Department of Mechanical Engineering at PSG College of Technology, Coimbatore, Tamil Nadu, India since 2004. Her areas of interest include Simulation of Manufacturing systems and Supply Chain Management. She has been a co-author of 17 research articles published in International and National journals. She also published about 40 papers in National and International conferences. She is the Editorial member of the National Journal of Technology. Abinanth. M is a PG Scholar in Industrial Engineering at PSG College of Technology, Coimbatore, India. His area of interest is Productivity Improvement and Lean implementation.