Embed Size (px)
Citation preview
Implementation of Agenda 2030: Trends and progress emerging at the regional level in Latin America and the Caribbean
Alicia Bárcena, Executive SecretaryJuly 10, 2017

Trends and progress emerging at the regional level in Latin America and the Caribbean, including in relation to the
theme of the HLPF

Six pillars for action and cooperation
1. Inter-institutional and intersectoral architecture at the highest level.
2. Building the SDGs into development plans and budgets, including investment.
3. Strengthening statistical capacities.4. Means of implementation: financing, technology,
trade, accountability.5. Strengthening the regional architecture:
observatories on gender equality, planning, energy.6. Spaces for dialogue between government, business
and citizens, enhancing coordination with UN system, regional entities and development banks

Political commitment: Intersectoral high level institutions in 19 of the 33 countries
*The information for Jamaica is as presented by the Planning Institute of Jamaica at the international seminar Challenges of Planning in Latin America and the Caribbean in the Framework of the 2030 Agenda of the Sustainable Development Goals, held in Santiago in November 2016.

Voluntary National Reviews 2016 2017 2018
1. Colombia2. Mexico3. Venezuela (Bolivarian
Republic of)
1. Argentina2. Belize3. Brazil4. Chile5. Costa Rica6. El Salvador7. Guatemala8. Honduras9. Peru10. Panama11. Uruguay
1. Jamaica2. Bahamas
14 countries out of 33 (close to 50%) in LAC will have presented their VNR as of 2017
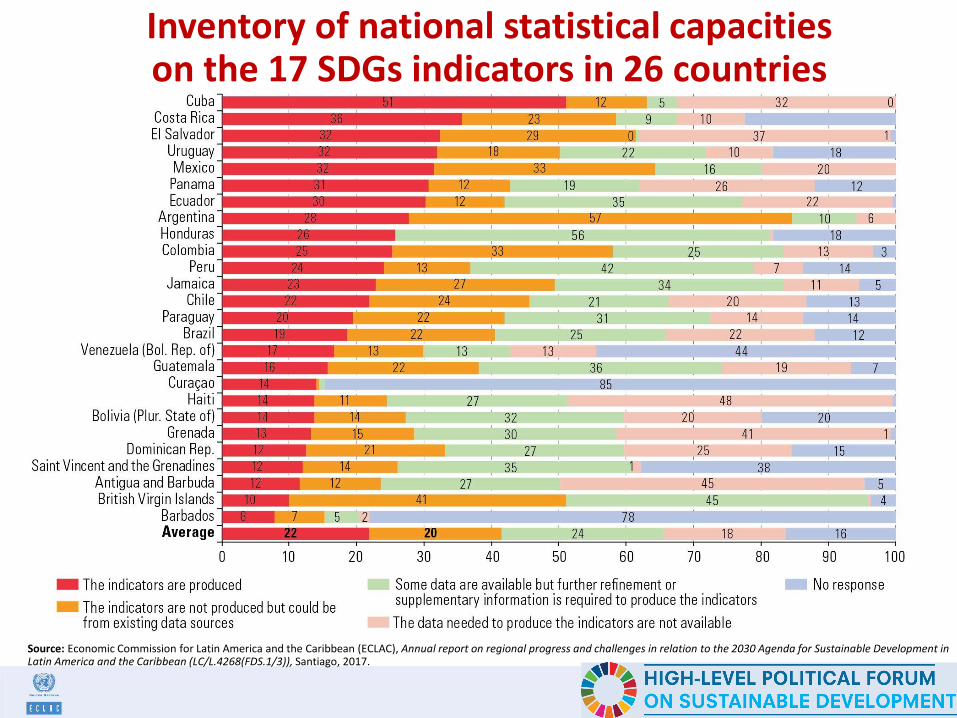
Inventory of national statistical capacities on the 17 SDGs indicators in 26 countries
Source: Economic Commission for Latin America and the Caribbean (ECLAC), Annual report on regional progress and challenges in relation to the 2030 Agenda for Sustainable Development in Latin America and the Caribbean (LC/L.4268(FDS.1/3)), Santiago, 2017.

Forum of the Countries of Latin America and the Caribbean
• Regional platform for data and statistics with observatories on gender equality, energy efficiency, digital technologies, infrastructure and cities
• Regional South-South cooperation and a peer learning platform

SDG 1: Poverty reduction and inequality trends haveflattened
LATIN AMERICA (19 COUNTRIES): POVERTY AND INDIGENCE, 1980-2015a
(Percentages)
Economic Commission for Latin America and the Caribbean (ECLAC), Annual report on regionalprogress and challenges in relation to the 2030 Agenda for Sustainable Development in Latin America and the Caribbean (LC/L.4268(FDS.1/3)),Santiago, 2017.
LATIN AMERICA AND OTHER REGIONS OF THE WORLD: GINI CONCENTRATION COEFFICIENT AROUND 2010
0.50
0.45
0.41
0.37
0.34 0.33 0.34
0.00
0.10
0.20
0.30
0.40
0.50
0.60
LatinAmericaand the
Caribbean(18)
Sub-saharanAfrica(39)
East Asiaand thePacific
(10)
North Africaand
Middle East(9)
South Asia(8)
WesternEurope andCentral Asia
(21)
OECD(22)

PREVALENCE OF HUNGER, 1990-2016 (Percentages)
World Latin America and the Caribbean
Lat.America/Caribbean South America CaribbeanCentral Ame
Source: ECLAC, FAO, ALADI (2016) “Food and nutrition security and the eradication of hunger CELAC 2025: Furthering discussion and regional cooperation”
SDG 2: Steady but uneven progress against hunger

SDG 5: Women are overrepresented in lowerincome quintiles
LATIN AMERICA (16 COUNTRIES): RELATIONSHIP BETWEEN MEN AND WOMEN (20-59 YEARS OLD) PER QUINTILE, WITH REGARDS TO THE RELATIONSHIP OBSERVED AT NATIONAL LEVEL, 2015
Source: Economic Commission for Latin America and the Caribbean (ECLAC), based on the BADEHOG database of House Surveys.
80
90
100
110
120
130
140
150
Bo
livia
(Plu
r.St
ate
of)
Bra
zil
Ch
ile
Co
lom
bia
Co
sta
Ric
a
Ecu
ado
r
El S
alva
do
r
Gu
atem
ala
Ho
nd
ura
s
Mex
ico
Pan
ama
Par
agu
ay
Pe
ru
Do
min
ican
Rep
ub
lic
Uru
guay
Ven
ezu
ela
(Bo
l.Rep
.of)
Quintile I
Quintile II
Quintile III
Quintile IV
Quintile V

SDG 14: Great vulnerability of coastal areas
TRENDS OF MEDIUM SEA LEVEL 2010-2040 2040-2070
Source: Economic Commission for Latin America and the Caribbean (ECLAC), on the basis of United Nations, The Sustainable Development Goals Report 2016, New York, 2016.

Source: ECLAC in the base of ECLAC and INFRALATAM databases. 1980 – 2006 in base of Calderón, César y Luis Servén, 2010, World Bank.
LATIN AMERICA: INVESTMENT IN INFRAESTRUCTURE BY SECTOR, 1980-2013(In GDP percentage)
Levels of investment in infrastructure are insufficient

Lessons learned, needs and gaps in relation to the means of implementation,
in Latin America and the Caribbean

A more complex global context• The world economy is expanding but not as expected.
Growth projections for 2017 are around 2.7%
• Continuous growth in the United States (about 2.0% in 2017) with positive impacts for remittances, tourism and trade in Mexico, Central America and the Caribbean
• Fiscal imbalances and lack of competitiveness in the Eurozone, plus high unemployment and slow growth of 1.7% in 2017 are acting as a drag on global trade
• Slowdown in China to a growth of 6.5% in 2017
• Great financial volatility
• The region is not growing enough: 1.1% of GDP for 2017
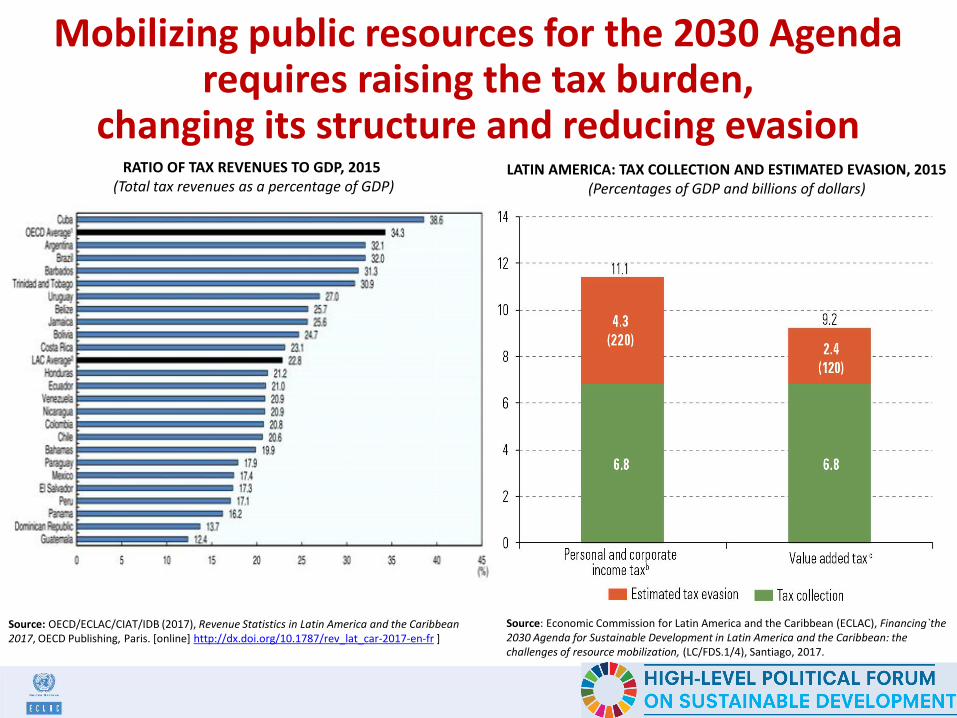
RATIO OF TAX REVENUES TO GDP, 2015(Total tax revenues as a percentage of GDP)
Source: OECD/ECLAC/CIAT/IDB (2017), Revenue Statistics in Latin America and the Caribbean2017, OECD Publishing, Paris. [online] http://dx.doi.org/10.1787/rev_lat_car-2017-en-fr ]
LATIN AMERICA: TAX COLLECTION AND ESTIMATED EVASION, 2015(Percentages of GDP and billions of dollars)
Mobilizing public resources for the 2030 Agenda requires raising the tax burden,
changing its structure and reducing evasion
Source: Economic Commission for Latin America and the Caribbean (ECLAC), Financing`the2030 Agenda for Sustainable Development in Latin America and the Caribbean: the challenges of resource mobilization, (LC/FDS.1/4), Santiago, 2017.

Illicit financial flows must be significantly reduced
LATIN AMERICA AND THE CARIBBEAN: TAX LOSSES ASSOCIATED WITH TRADE MISINVOICING, 2004-2013
(Billions of dollars and percentages of GDP)
Source: Economic Commission for Latin America and the Caribbean (ECLAC), Financing the 2030 Agenda for Sustainable Development in Latin America and the Caribbean: the challenges of resource mobilization, (LC/FDS.1/4), Santiago, 2017.
LATIN AMERICA AND THE CARIBBEAN: ESTIMATED VALUE OF TRADE MISINVOICING, 2004-2013
(Billions of dollars )
AIA
ANT
BHS
BRB
BLZ
DMA
GRD
GUY
JAM
MSR
KNA
LCA
VCTSURTTO
Average
0
10
20
30
40
50
60
70
80
0 10 20 30 40
As
a p
erce
nta
ge
of
tax
reve
nu
es
As a percentage of goods and services exports
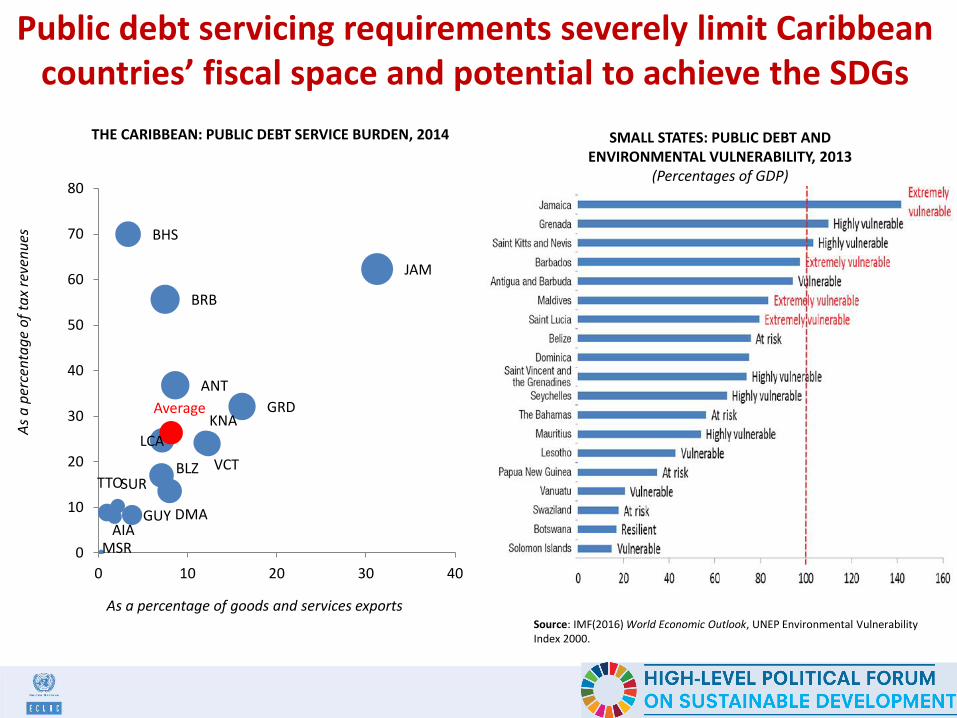
THE CARIBBEAN: PUBLIC DEBT SERVICE BURDEN, 2014
Public debt servicing requirements severely limit Caribbean countries’ fiscal space and potential to achieve the SDGs
Source: IMF(2016) World Economic Outlook, UNEP Environmental Vulnerability Index 2000.
SMALL STATES: PUBLIC DEBT AND ENVIRONMENTAL VULNERABILITY, 2013
(Percentages of GDP)

FDI and migrant remittances have become the fastest-growing component of financial flows
LATIN AMERICA AND THE CARIBBEAN: MAIN EXTERNAL FINANCING FLOWS, 1980-2015(Millions of dollars)
Source: Economic Commission for Latin America and the Caribbean (ECLAC), Financing the 2030 Agenda for Sustainable Development in Latin America and the Caribbean: the challenges of resource mobilization, (LC/FDS.1/4), Santiago, 2017.

Our region is far behind in knowledge generation and innovation
1990 2000 2015
Developed countriesa 87,9 75,9 43,9
Rest of the world 12,1 24,1 56,1
China 1,0 3,8 38,1
Republic of Corea 2,6 7,4 7,4
Latin America and the Caribbean 2,0 3,5 2,3
SHARE OF WORLD PATENT APPLICATIONS(Percentages)
Source: ECLAC in the base of data from the World Intellectual Patent Organization (WIPO).a Includes Europe, United Sates and Japan.

What to do?• Reinvigorate intraregional trade
• Attract FDI towards non-extractive sectors which favors links with local and regional suppliers
• Promote the Trade Facilitation Agenda
• Diversify, promote industrialization and innovation, and increase local and regional content of production and exports
• Regional coordination of fiscal policies and exchange-rate policies
• Act jointly for a better global and regional governance on financial issues

In short: to implement the 2030 Agenda• Global, regional and national governance:
₋ production of global public goods₋ reduction of power asymmetries in the global governance of monetary,
financial, trade, technological and environmental matters₋ institutional cooperation and coordination within and between countries₋ development of low-carbon regional production chains
• Build the SDGs into national development plans, budgets and business models.
• Measure what we collectively decide: new indicators
• Means of implementation: financing, technology, fair trade and access to information.
• Intersectoral and inter-institutional coordination and participation of all stakeholders, including business and civil society.
Coalitions between State, market and citizens