Embed Size (px)
Citation preview

Implementation Guidelines for an Effective Quality Assurance and Performance Improvement (QAPI)
System
AUDIO CONFERENCE
Date/Time:
Thursday, March 28, 2013, 10 a.m. – noon
Presenter: Demetria Haffenreffer, RN, MBA, president, Haffenreffer & Associates, Inc.
Packet Contents: Handout Credit Instructions CEU Affidavit Evaluation/Credit Form Post-Test
Dial-In Instructions:
Conference Phone Number: 866-380-9615 Participant Access Code: 325419#
You may dial the toll-free number no sooner than five minutes prior to the program.
LeadingAge New York/FLTC 13 British American Blvd. Suite 2 Latham, NY 12110 518.867.8385
1

QAPI Implementation
Demi Haffenreffer, RN MBA www.consultdemi.net
1
Today’s topics Review of implementation steps QAPI Plan
Identifying and setting measures Root cause analysis
Establishing and enabling Performance teams Designing a QAPI project
2
2

Implementation Conduct a Self-Assessment of your current
QAPI program Identify gaps Develop a plan based on gaps identified in Self-
Assessment Develop policies and guiding principles
Utilize resources available Establish measures
Those that will be monitored routinely Conduct training Identify projects
3
CMS Five Elements Design and Scope Governance and Leadership Feedback, Data Systems and
Monitoring Performance Improvement Projects Systematic Analysis and Systemic
Action
4
3
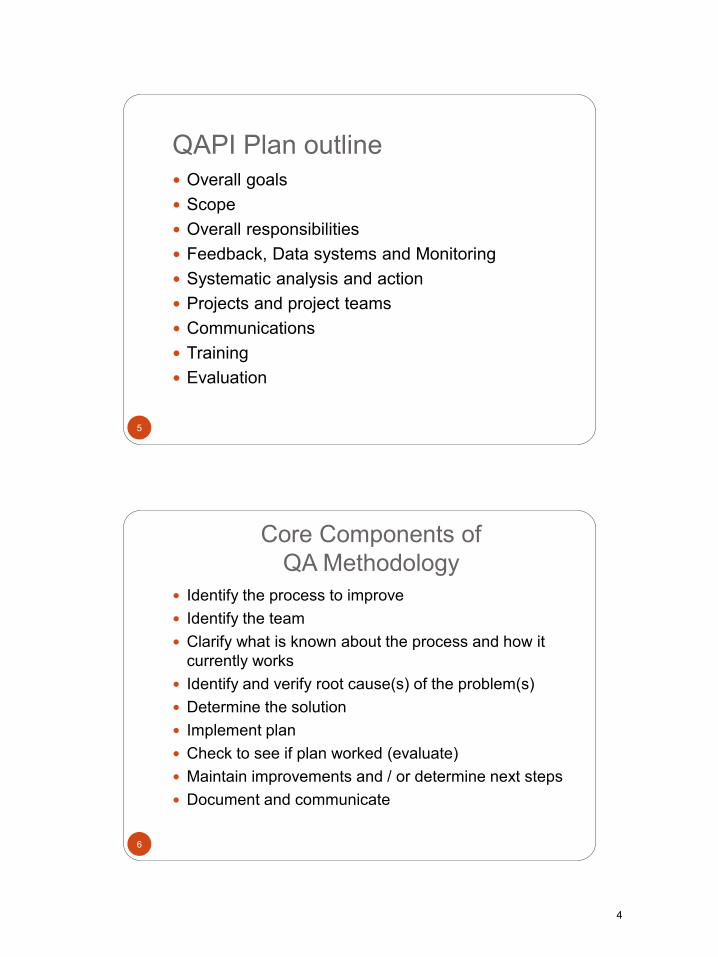
QAPI Plan outline Overall goals Scope Overall responsibilities Feedback, Data systems and Monitoring Systematic analysis and action Projects and project teams Communications Training Evaluation
5
Core Components of QA Methodology
Identify the process to improve Identify the team Clarify what is known about the process and how it
currently works Identify and verify root cause(s) of the problem(s) Determine the solution Implement plan Check to see if plan worked (evaluate) Maintain improvements and / or determine next steps Document and communicate
6
4

Using QA Methodology PDSA PDCA FOCUS PDSA or PDCA FADE (Focus, Analyze, Develop, Execute and
Evaluate) DMAIC (Define, Measure, Analyze, Improve,
Control There are more!
7
Quality Improvement Methods
8
5

Six Sigma – Key Dimensions
Process Map Analysis
Tools Organization
Methodology
Driven by customer
needs
Enabled by quality team.
Led by Senior Mgmt
Define Measure Analyze Improve Control
VendorVendorProcess BProcess BProcess AProcess ACustomerCustomer VendorVendorProcess BProcess BProcess AProcess ACustomerCustomer
Process variation
LSL USL
Upper/Lower specification
limits
Regression • • • • • • • • • • • • • • •
• • • • • • • • •
• • • • • •
05
101520253035
L K A F B C G R D0%
20%
40%
60%
80%
100%
Frequency Cumulative Frequency
Pareto Chart
9
Model for Improvement Set Aims: Time specific,
and measurable
Establish Measures:
Quantitative and well defined
Select Change: Select those that
will result in most improvement
Test the Change: Use PDSA to
test change first on a small scale –
then implement
10
6

F – Find something (process or system) to improve
O – Organize to improve the process
Steps
C – Clarify current knowledge of the process or system
U – Understand the sources of process variation
S – Select the process improvement
P D S A
Utilize PITS – Process Improvement Teams
Understand the current process
Where are the variations and the results – and why
11
CQI Problem Solving Methodology
Plan What are you
planning to change?
DO Pilot your test. What
were the results? Document.
Study What happened? What were the
results? What did you learn?
Act Revise plan / retest. Spread or expand
the test. Implement change.
12
7

Setting Measures / Indicators / Goals
13
Why Measure? Know how processes are performing Know if you are achieving results Identify areas for improvement Determine the effect of a change you made Provide data for decision making Management oversight Meet regulatory requirements Provide evidence of quality
14
8
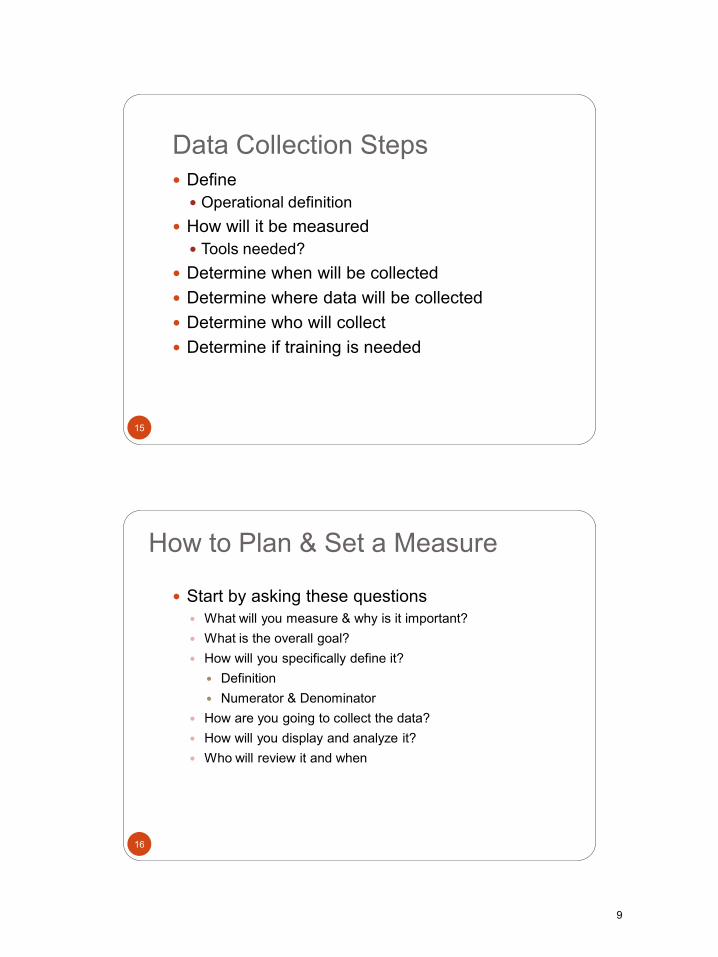
Data Collection Steps Define
Operational definition How will it be measured
Tools needed? Determine when will be collected Determine where data will be collected Determine who will collect Determine if training is needed
15
How to Plan & Set a Measure
Start by asking these questions What will you measure & why is it important? What is the overall goal? How will you specifically define it?
Definition Numerator & Denominator
How are you going to collect the data? How will you display and analyze it? Who will review it and when
16
9

Example of a Measure / Goal Definition
“All falls as defined by the RAI that occurred in the past month”
“All residents receiving an antipsychotic medication with only the diagnosis of Dementia”
“All residents with hospital readmissions who have been admitted within the last thirty days”
Overall Measure “Falls no greater than 25% of average daily census. No
major injuries (RAI definition)
“Will decrease current antipsychotic use in residents with dementia by 15% of current rate in 2013 (35%) – to 32%
“Will decrease current avoidable hospital readmission rate by 15% in 2013”
17
Example of a Measure / Goal Numerator
“Total number of falls”
“Total number of residents receiving antipsychotics with only the diagnosis of Dementia for the year (2012)”
“Total number of residents discharged to hospital within thirty days who were admitted within that thirty day period for the year (2012).”
Denominator
For falls = “Average daily census for the past 30 days X 100”
For Meds & Hospital readmissions: “Average daily census for the year (2012) X 100”
18
10
Example of a Measure / Goal
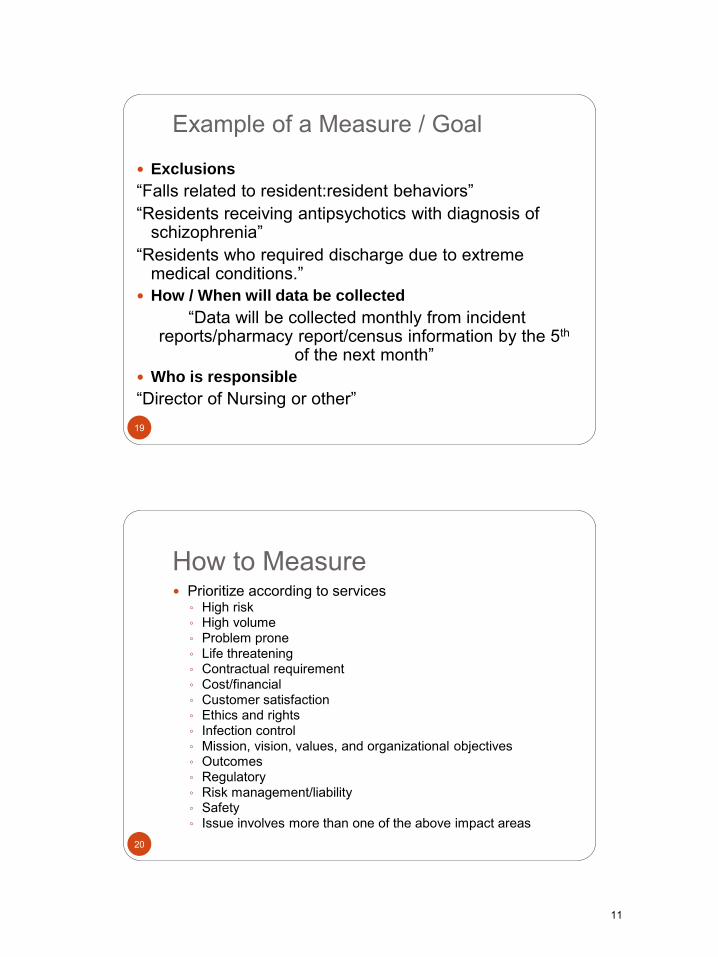
Exclusions
“Falls related to resident:resident behaviors” “Residents receiving antipsychotics with diagnosis of
schizophrenia” “Residents who required discharge due to extreme
medical conditions.” How / When will data be collected
“Data will be collected monthly from incident reports/pharmacy report/census information by the 5th
of the next month” Who is responsible
“Director of Nursing or other” 19
How to Measure Prioritize according to services
◦ High risk ◦ High volume ◦ Problem prone ◦ Life threatening ◦ Contractual requirement ◦ Cost/financial ◦ Customer satisfaction ◦ Ethics and rights ◦ Infection control ◦ Mission, vision, values, and organizational objectives ◦ Outcomes ◦ Regulatory ◦ Risk management/liability ◦ Safety ◦ Issue involves more than one of the above impact areas
20
11

What to Measure Admissions/Discharges Care Transitions (Services and information
flow across settings of care) Ethics and Compliance activities (OIG
Guidance) Restraint use Activity Programs Palliative Care and End of Life Resident Satisfaction Family Satisfaction
21
What to Measure Medical record review, closed and open –
Assessment timing and completion Medication use and management (including
medication errors) Pressure Ulcer rates Resident Safety Issues Sentinel events (such as death or serious
injury due to a fall, medication errors, or other facility identified events)
Resuscitation and its outcomes
22
12
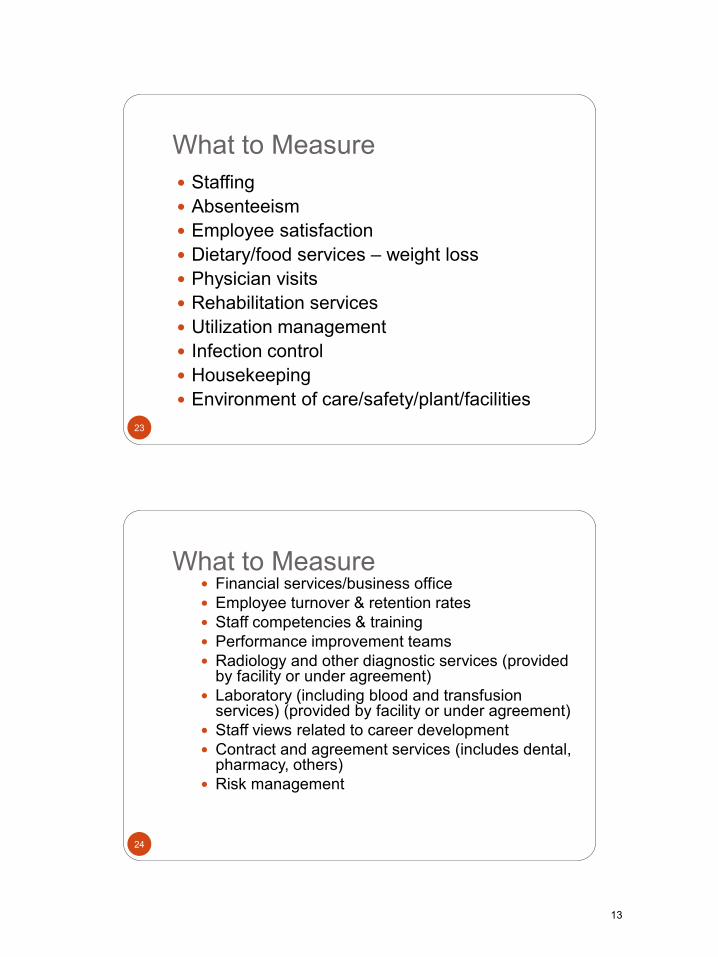
What to Measure Staffing Absenteeism Employee satisfaction Dietary/food services – weight loss Physician visits Rehabilitation services Utilization management Infection control Housekeeping Environment of care/safety/plant/facilities
23
What to Measure Financial services/business office Employee turnover & retention rates Staff competencies & training Performance improvement teams Radiology and other diagnostic services (provided
by facility or under agreement) Laboratory (including blood and transfusion
services) (provided by facility or under agreement) Staff views related to career development Contract and agreement services (includes dental,
pharmacy, others) Risk management
24
13
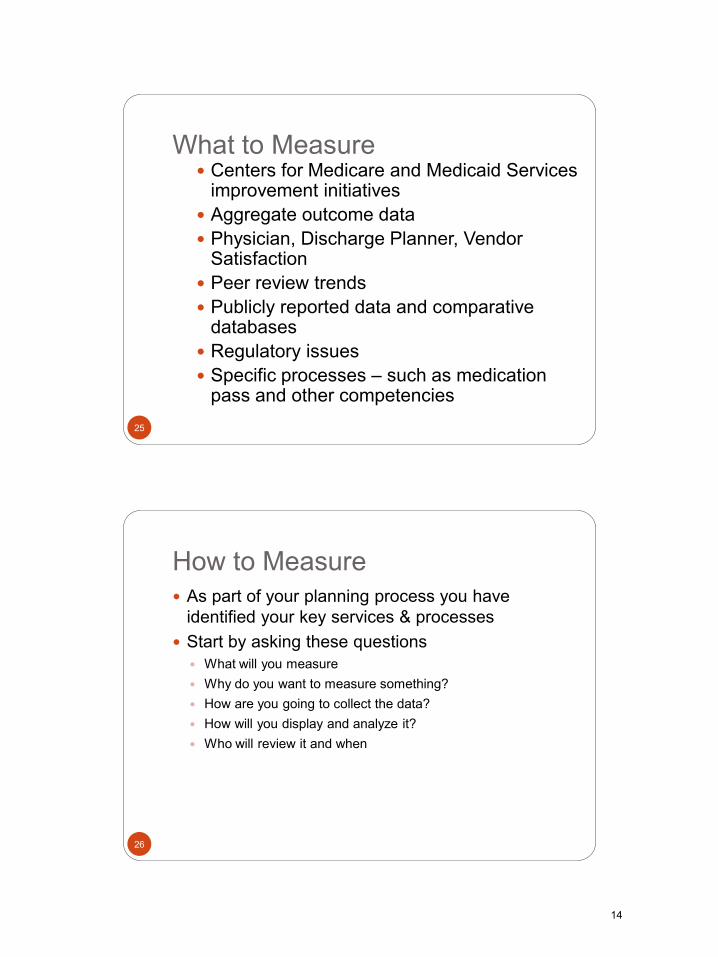
What to Measure Centers for Medicare and Medicaid Services
improvement initiatives Aggregate outcome data Physician, Discharge Planner, Vendor
Satisfaction Peer review trends Publicly reported data and comparative
databases Regulatory issues Specific processes – such as medication
pass and other competencies
25
How to Measure As part of your planning process you have
identified your key services & processes Start by asking these questions
What will you measure Why do you want to measure something? How are you going to collect the data? How will you display and analyze it? Who will review it and when
26
14

Types of Data
Process How something is occurring along the way, before
the outcome occurs. Outcome
The end result or output of a process. Observable
Observation of a process Count
Events counted and placed into categories There are others
27
Where to get Data Quality Indicators/Quality Measures Profile and Resident Level
Summary Publicly reported quality measures The QIS QCLI dictionary has indicators and measures for QIS
survey OSCAR/CASPER and other CMS databases and reports Complaints and survey history Facility internal clinical reports such as recent falls, other accidents,
skin breakdown, weight loss, reasons for discharges, infection control (e.g., overall infection rates), and medication errors
Other facility reports such as employee and resident satisfaction surveys, grievances, financial reports, employee retention and turnover reports, and corporate compliance and/or other risk management reports
Corporate scorecards, dashboards, or other data provisions Reports available from outside resources and organizations such as
Ombudsmen, Resident Advocates, AHCA, AAHSA, State Quality Programs, State QIOs, Advancing Excellence, and others
Outside the industry 28
15

How to Display what you Measure Flow charts Run Charts Pareto Charts Tables Graphs
29
Run Charts
30
16

How do you analyze and solve problems / improve systems
effectively within your organization?
31
Analyze What is it Why important What it includes How to
Implement
● Putting data in a structure that can be used to analyze and determine conclusions. A graphical picture allows one to identify at a glance any patterns, trends, or priorities that emerge ● Involves all departments & teams
● Processes and systems rarely operate in isolation and must always be considered in relation to other processes and systems that impact them. ● Finding the root cause will increase the likelihood of resolving the problem
● Root cause analysis ● Run charts ● Flow charts ● A QI methodology – see enable ● Data-driven decision making
● Develop policies ● Develop training ● Develop a strategic plan ● Implement QI teams ● Communicate findings
32
17

Multi-Causal Theory “Swiss Cheese”
diagram (Reason, 1991)
33
Root Cause Analysis
Root cause is the most basic reason for an undesirable condition or problem which if eliminated or corrected, would have prevented it from existing or occurring.
RCA helps you to determine: The series of events that actually happened What parts of your system worked well What parts of your system lined up to allow an error What meaningful steps your system can take to improve safety Prioritization of causes & therefore assists with prioritizing action
plans Resident specific and employee specific problems
34
18
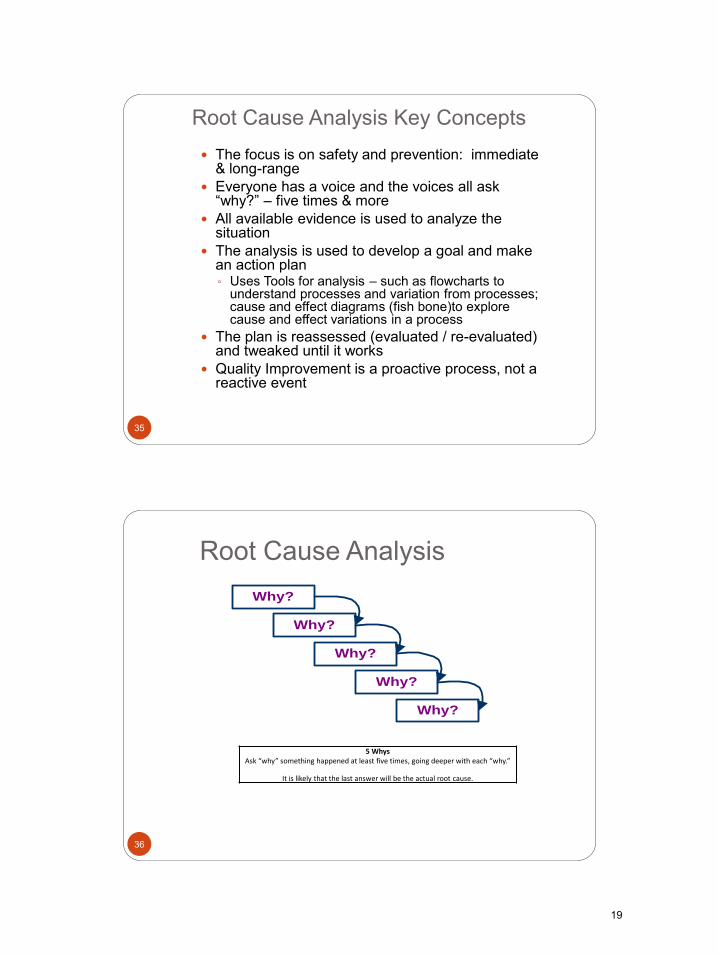
Root Cause Analysis Key Concepts The focus is on safety and prevention: immediate
& long-range Everyone has a voice and the voices all ask
“why?” – five times & more All available evidence is used to analyze the
situation The analysis is used to develop a goal and make
an action plan ◦ Uses Tools for analysis – such as flowcharts to
understand processes and variation from processes; cause and effect diagrams (fish bone)to explore cause and effect variations in a process
The plan is reassessed (evaluated / re-evaluated) and tweaked until it works
Quality Improvement is a proactive process, not a reactive event
35
5 Whys Ask “why” something happened at least five times, going deeper with each “why.”
It is likely that the last answer will be the actual root cause.
Why?
Why?
Why?
Why?
Why?
Root Cause Analysis
36
19

How to Construct a Flow Chart Bring people together who perform the process or are
affected by it Identify the beginning and end points Have each person walk through the process Determine symbols (optional) Ask clarifying questions
How is this done? How else is this done? Can you explain this in more detail? Does it always work this way? Is this done any other ways? What do you mean by______? Walk me through this part. Can you give me an example?
37
Flow Charting Tips Stay with the process Make sure no steps are missing There should be only one arrow out of a
process box Decision points have yes or no options Maintain a clear flow Suspend “WHY’s” at this point Expect that people are doing things
differently Reserve judgments Clarify and probe
38
20

Flow Chart
39
Figure 3: RCA/Causal Tree Diagram
40
21

Fish Bone
41
Problem definition
(the event)
Immediate cause
(Condition)
Immediate cause
(Action)
Action ActionCondition Condition
A CACC A C CCA
Caused by
Caused by Caused by
Causal Tree Diagram
42
22

Develop an Action Plan
Use a team What will keep this from happening again? Focus on the root causes Develop short range and long range goals Document the plan Implement – start small
43
Evaluation of the Results You have defined your goals earlier on, such as for a
resident: Those measures we already discussed How successful have we been? Do we need a new plan?
Develop a PIT?
44
23

Tips for Developing Effective Teams Develop a team charter Teach team members new skills Use team building exercises Encourage the team to follow the Manager-as-
Developer approach Consider a team facilitator Assign team member roles Rotate team assignments Establish a specific quality action plan Organize meetings Deliver quick wins Reward and celebrate
45
Celebrate
46
24
QAPI Example Medication Error Issues
47
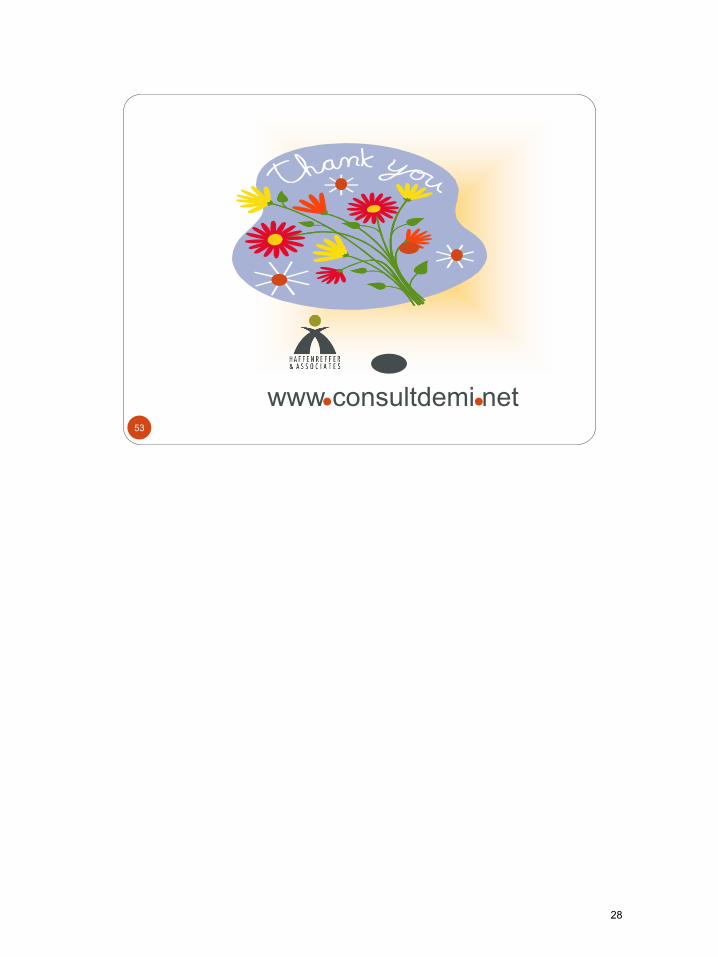
Medication Errors
48
25

Medication Errors Action Plan Action Item Responsible
Person(s)
Completion
Date
1. Implement competency checks on hire and annually
- Complete competency checks on all current medication aides
Staff Education 9/1/12
2. Place pictures of residents in all tackle boxes
Resident Coordinator 8/15/12
3. Add communication specifics related to resident meds and packaging to admission packet. - Enforce medication packaging in 30 days of admission
Executive Director in collaboration with Admission Coordinator
9/1/12
4. Contact pharmacy for Tallman lettering – review implementation date
Director of Nursing 8/15/12
5. Implement consistent med pass procedure
Director of Nursing 9/1/12 49
QUESTIONS?
50
26

Resources
Dana, B. (2006). Developing a Quality Management System (2nd edition). AHCA: DC* DeFeo, J & Barnard, W. (2004). Juran Institute’s Six Sigma. McGraw Hill: NY. Deming, E. (1986). Out of Crisis. Fox, N. (2007). The Journey of a Lifetime: Leadership Pathways to Culture Change in Long-Term Care. Eden Alternative.
51
Resources
Gawande, A. (2007). Better: A Surgeon’s Notes on Performance. Picador: NY.
Gawande, A (2010). The Checklist Manifesto: How to Get Things Right. Metropolitan Books: NY.
Senge, P. M. et al (1994). The Fifth Discipline Fieldbook. Doubleday: NY.
Senge, P. M. et al (2004). Presence: An Exploration of Profound Change in People, Organizations, and Society. Random House: NY.
52
27
www consultdemi net 53
28

CREDIT INSTRUCTIONS
Audio Conference: Implementation Guidelines for an Effective Quality Assurance and Performance Improvement (QAPI) System Date/Time: Thursday, March 28, 2013, 10 a.m. - noon Credit Available: 2 hours of Licensed Nursing Home Administrator (NAB) credit for up to four individuals from the same facility (no affiliates). Instructions for Obtaining Credit: Please complete and fax the following forms to 518.867.8386 or 518.867.8389 no later than April 11th:
CEU Affidavit
Evaluation/Credit Form
Post-Test Print the credit forms for each individual seeking credit. On each form, indicate the name of the person that your organization’s registration is under. Please note: Credit certificates will be issued approximately one month after the program if payment has been received in full. Credit Details: The FLTC is a certified sponsor of professional continuing education with the National Association of Boards of Examiners of Long Term Care Administrators (NAB). NAB has approved this program for 2 hours of continuing education credit. State licensure boards, however, have final authority on the acceptance of individual courses.
If you have any questions, please contact Linda Smith at
518.867.8385, ext. 154 or [email protected]
29

PLEASE FAX TO FLTC: 518.867.8386 OR 518.867.8389
CEU Affidavit
Audio Conference: Implementation Guidelines for an Effective Quality Assurance and Performance Improvement (QAPI) System Date/Time: Thursday, March 28, 2013, 10 a.m. - noon Credit: 2 hours of Licensed Nursing Home Administrator (NAB) credit
Organization: ________________________________________________________________________ Name of Registrant: ___________________________________________________________________ This form attests that _________________________________________________________________,
(Full name of person seeking credit)
____________________________________________, was in attendance for the full 2 hours of the (Title)
audio conference, Implementation Guidelines for an Effective Quality Assurance and Performance Improvement (QAPI) System. Witness: (Print) _______________________________________________________________________
(Staff in attendance, other than the person seeking credit)
(Signature) _______________________________________________ Date: ______________
30

PLEASE FAX TO FLTC: 518.867.8386 OR 518.867.8389
LNHA Evaluation/Credit Form
Audio Conference: Implementation Guidelines for an Effective Quality Assurance and Performance Improvement (QAPI) System Date/Time: Thursday, March 28, 2013, 10 a.m. - noon Credit: 2 hours of Licensed Nursing Home Administrator (NAB) credit
EVALUATION
1. How many other staff from your organization were listening to the audio conference with you? _______________
2. Please check the box that best describes your rating: Excellent Good Fair Poor
a. Overall rating
b. Presenter’s knowledge of material/topic
c. Learning objectives & content material
d. Usefulness of the knowledge/skill required
e. Appropriateness of topic content
3. Was participating in this seminar a wise business decision? Yes No
If not, why? ___________________________________________________________________________________
_____________________________________________________________________________________________
4. Is LeadingAge New York/FLTC your first choice for educational opportunities? Yes No
5. What new developments in the field do you believe will have an important future impact?
_____________________________________________________________________________________________
_____________________________________________________________________________________________
CREDIT INFORMATION - All fields MUST BE COMPLETED below in order for us to process your credit!
Name of Registrant for your Organization:______________________________________________________________
Name & Title of Person Seeking Credit:_________________________________________________________________
Organization: ____________________________________________________________________________________
Address: _________________________________________________________________________________________
City: _______________________________________________________State: ____________Zip: _________________
Telephone: ( ) ____________________________E-Mail: ______________________________________________
NYS NH Administrator License No.:____________________________________________________________________
I am also licensed in other states with license numbers as follows:___________________________________________
This program has been reviewed and approved by NAB/NCERS. NCERS strives to approve only quality programs whose content can reasonably contribute to the professional development of long-term care administrators. If you have any confidential comments concerning this program, which
you would like to make to NCERS administrators, please direct them to [email protected].
31
PLEASE FAX TO FLTC: 518.867.8386 OR 518.867.8389
Post-Test Audio Conference: Implementation Guidelines for an Effective Quality Assurance and Performance Improvement (QAPI) System Date/Time: Thursday, March 28, 2013, 10 a.m. - noon Credit: 2 hours of Licensed Nursing Home Administrator (NAB) credit Name of Registrant:__________________________________________________________________________ Name of Person Seeking Credit:________________________________________________________________
PLEASE CIRCLE THE CORRECT ANSWER:
1. For a root cause analysis you should ask why about 7 times.
a. True
b. False
2. The FOCUS model should be used to assist the team in developing and implementing a plan for improvement.
a. True
b. False
3. Feedback, data systems, and monitoring are an important part of a QAPI plan.
a. True
b. False
4. As part of your planning process, you need to identify your key services & processes.
a. True
b. False
5. Care transition is not an important area that your organization needs to measure.
a. True
b. False
6. “Systematic Analysis” and “Systemic Action” are part of the CMS five elements.
a. True
b. False
7. Evaluation is not part of the QAPI plan.
a. True
b. False
8. FADE represents Focus, Analyze, Divide, Execute and Evaluate.
a. True
b. False
9. Providing data for decision making is an important reason for setting measures.
a. True
b. False
10. The survey history is a good place to collect data.
a. True
b. False
32