Embed Size (px)
Citation preview

Document of
The World Bank FOR OFFICIAL USE ONLY
Report No: ICR00004545
IMPLEMENTATION COMPLETION AND RESULTS REPORT
TF 16842 AND TF 16846
ON A
GRANT
IN THE AMOUNT OF US$42.3 MILLION
TO THE
GOVERNMENT OF BENIN
FOR THE
BENIN GLOBAL PARTNERSHIP FOR EDUCATION PROGRAM
JANUARY 31, 2019
Education Global Practice
Africa Region
Pub
lic D
iscl
osur
e A
utho
rized
Pub
lic D
iscl
osur
e A
utho
rized
Pub
lic D
iscl
osur
e A
utho
rized
Pub
lic D
iscl
osur
e A
utho
rized

CURRENCY EQUIVALENTS
(Exchange Rate Effective: January 28, 2019)
Currency Unit = FCFA
FCFA 575 = US$1
FISCAL YEAR
July 1 - June 30
Regional Vice President: Hafez M. H. Ghanem
Country Director: Pierre Frank Laporte
Senior Global Practice Director: Jaime Saavedra Chanduvi
Practice Manager: Meskerem Mulatu
Task Team Leader(s): Yacinthe Gbaye
ICR Main Contributor: Axelle Latortue, Natasha Somji

ABBREVIATIONS AND ACRONYMS
AGETIP Agence d’exécution de travaux intérêt public
AGETUR Agence d’exécution des travaux urbains
CPS Country Partnership Strategy
DCM Delegated Contract Manager
DEO District Education Office
DP Development Partner
ECOWAS Economic Community of West African States
EMIS Education Management Information System
EFA-FTI Education for All-Fast Track Initiative
ESP Education Sector Plan
GA Grant Agreement
GDP Gross Domestic Product
GER Gross Enrollment Rate
GIZ Deutsche Gesellschaft für Internationale Zusammenarbeit
GPE Global Partnership for Education
GPIR Gross Primary Intake Rate
ICR Implementation Completion and Results Report
INFRE Institute of Teacher Training and Education Research (Institut National pour la Formation et la Recherche en Education)
INIFRCF National Institute of Engineering Training and Capacity Building of Trainers (Institut National d’Ingénierie de Formation et de Renforcement des Capacités des Formateurs)
INSAE National Institute of Statistics and Economic Analysis (Institut National de la Statistique et de l'Analyse)
ISR Implementation Status Results Report
IRI Intermediate Results Indicator
LEG Local Education Group
M&E Monitoring and Evaluation
MDG Millennium Development Goal
MEMP Ministry of Pre- and Primary School (Ministere de L’Enseignement Maternel et Primaire)
MESFTPRIJ Ministry of Secondary Education, Technical and Vocational Education, and Youth Integration (Ministère de l’Enseignement Secondaire, de la Formation Technique et Professionnelle, de la Reconversion et de l’Insertion des Jeunes)
OSEP l’Outil de Supervision et d’Encadrement Pédagogique
PAD Project Appraisal Document
PCR Primary Completion Rate
PDDSE Ten-Year Education Sector Development Plan (Plan décennal de développement du secteur de l'éducation)
PDO Project Development Objective
PTR Pupil Teacher Ratio
SMC School Management Committee
SSA Sub-Saharan Africa
TF Trust Fund
UATS Programme Monitoring Unit (Unité d’Appui Technique et de Suivi)
UNICEF United Nations Children’s Fund

TABLE OF CONTENTS
DATA SHEET ..............................................................................................................................1
I. PROJECT CONTEXT AND DEVELOPMENT OBJECTIVES ....................................................... 5
A. CONTEXT AT APPRAISAL .........................................................................................................5
B. SIGNIFICANT CHANGES DURING IMPLEMENTATION (IF APPLICABLE) ..................................... 12
II. OUTCOME .................................................................................................................... 15
A. RELEVANCE OF PDOs ............................................................................................................ 15
B. ACHIEVEMENT OF PDOs (EFFICACY) ...................................................................................... 16
C. EFFICIENCY ........................................................................................................................... 23
D. JUSTIFICATION OF OVERALL OUTCOME RATING .................................................................... 25
E. OTHER OUTCOMES AND IMPACTS (IF ANY) ............................................................................ 26
III. KEY FACTORS THAT AFFECTED IMPLEMENTATION AND OUTCOME ................................ 27
A. KEY FACTORS DURING PREPARATION ................................................................................... 27
B. KEY FACTORS DURING IMPLEMENTATION ............................................................................. 28
IV. BANK PERFORMANCE, COMPLIANCE ISSUES, AND RISK TO DEVELOPMENT OUTCOME .. 31
A. QUALITY OF MONITORING AND EVALUATION (M&E) ............................................................ 31
B. ENVIRONMENTAL, SOCIAL, AND FIDUCIARY COMPLIANCE ..................................................... 34
C. BANK PERFORMANCE ........................................................................................................... 35
D. RISK TO DEVELOPMENT OUTCOME ....................................................................................... 36
V. LESSONS AND RECOMMENDATIONS ............................................................................. 38
ANNEX 1. RESULTS FRAMEWORK AND KEY OUTPUTS ........................................................... 40
ANNEX 2. BANK LENDING AND IMPLEMENTATION SUPPORT/SUPERVISION ......................... 63
ANNEX 3. PROJECT COST BY COMPONENT ........................................................................... 65
ANNEX 4. EFFICIENCY ANALYSIS ........................................................................................... 66
ANNEX 5. BORROWER, CO-FINANCIER AND OTHER PARTNER/STAKEHOLDER COMMENTS ... 78
ANNEX 6. SUPPORTING DOCUMENTS .................................................................................. 92

The World Bank Benin Global Partnership for Education Program (P129600)
Page 1 of 95
DATA SHEET
BASIC INFORMATION
Product Information
Project ID Project Name
P129600 Benin Global Partnership for Education Program
Country Financing Instrument
Benin Investment Project Financing
Original EA Category Revised EA Category
Partial Assessment (B) Partial Assessment (B)
Organizations
Borrower Implementing Agency
Government of Benin Ministry of Preschool and Primary Education
Project Development Objective (PDO) Original PDO
The project development objective (PDO) is to improve: (i) access and equity; and (ii) quality of classroom instruction at the basic education level, with particular emphasis on deprived districts in the Recipient's territory.

The World Bank Benin Global Partnership for Education Program (P129600)
Page 2 of 95
FINANCING
Original Amount (US$) Revised Amount (US$) Actual Disbursed (US$)
World Bank Financing TF-16846
24,000,000 24,000,000 24,000,000
TF-16842
18,300,000 18,300,000 18,030,538
Total 42,300,000 42,300,000 42,030,538
Non-World Bank Financing
Borrower/Recipient 0 0 0
Total 0 0 0
Total Project Cost 42,300,000 42,300,000 42,030,538
KEY DATES
Approval Effectiveness MTR Review Original Closing Actual Closing
21-Mar-2014 30-Jun-2014 03-Jun-2016 30-Jun-2016 30-Apr-2018
RESTRUCTURING AND/OR ADDITIONAL FINANCING
Date(s) Amount Disbursed (US$M) Key Revisions
17-Sep-2015 9.59 Change in Results Framework Change in Components and Cost Change in Loan Closing Date(s) Reallocation between Disbursement Categories Change in Implementation Schedule
21-May-2017 36.57 Change in Results Framework Change in Loan Closing Date(s)
KEY RATINGS
Outcome Bank Performance M&E Quality
Moderately Unsatisfactory Moderately Satisfactory Modest

The World Bank Benin Global Partnership for Education Program (P129600)
Page 3 of 95
RATINGS OF PROJECT PERFORMANCE IN ISRs
No. Date ISR Archived DO Rating IP Rating Actual
Disbursements (US$M)
01 02-Dec-2014 Moderately Satisfactory Moderately Satisfactory 0
02 02-Jun-2015 Moderately Satisfactory Satisfactory 9.59
03 11-Dec-2015 Moderately Satisfactory Moderately Satisfactory 24.00
04 24-Jun-2016 Moderately Satisfactory Moderately Satisfactory 24.00
05 28-Dec-2016 Moderately Satisfactory Moderately Satisfactory 29.93
06 29-Jun-2017 Moderately Satisfactory Moderately Satisfactory 36.57
07 29-Dec-2017 Moderately Satisfactory Moderately Satisfactory 41.12
SECTORS AND THEMES
Sectors
Major Sector/Sector (%)
Education 100
Primary Education 83
Secondary Education 17
Themes
Major Theme/ Theme (Level 2)/ Theme (Level 3) (%) Human Development and Gender 100
Education 100
Access to Education 50
Education Financing 50
ADM STAFF
Role At Approval At ICR
Regional Vice President: Makhtar Diop Hafez M. H. Ghanem
Country Director: Ousmane Diagana Pierre Frank Laporte

The World Bank Benin Global Partnership for Education Program (P129600)
Page 4 of 95
Senior Global Practice Director: Tawhid Nawaz Jaime Saavedra Chanduvi
Practice Manager: Peter Nicolas Materu Meskerem Mulatu
Task Team Leader(s): Yacinthe Gbaye Yacinthe Gbaye
ICR Contributing Author: Natasha Ibrahim Somji

The World Bank Benin Global Partnership for Education Program (P129600)
Page 5 of 95
I. PROJECT CONTEXT AND DEVELOPMENT OBJECTIVES
A. CONTEXT AT APPRAISAL
Context
Country Context
1. Located in West Africa and bordered by Nigeria, Togo, Burkina Faso and Niger, Benin was a low-income
country at the time that Global Partnership for Education Program (P129600) was appraised in 2013. Benin had a
population of 10 million in 2013 and a per capita income of US$680 in 2010 and US$771 in 2016. The country had
experienced moderate economic growth since the onset of the global economic crisis in 2009 and since devastation
caused by torrential rains and severe flooding in 2010—the most severe in nearly 50 years, which had affected eight
percent of the population.
2. Benin’s economy relied heavily on the agricultural sector and re-export trade with Nigeria and neighboring
countries. Agriculture accounted for about 32 percent of GDP and provided nearly 70 percent of the country's
employment. Cotton was the most important primary export commodity, but its production had dropped, contributing
to an average growth rate of 3.1 percent per year between 2009 and 2012, well below the Sub-Saharan Africa (SSA)
average of 4.6 percent.
3. Although economic growth contributed to modest increases in per capita income and improvements in human
development, this increase was insufficient to significantly impact poverty rates. Benin ranked 166th out of 186
countries on the United Nations 2012 Human Development Index, and the national poverty rate was estimated at 35
percent in 2009, with significant urban-rural and regional disparities. In addition, the Government faced policy and
operational challenges linked to demographic changes: a relatively high rate of population growth (3.2 percent per
annum between 1992 and 2012) meant that the Government was struggling to keep up with an increasing demand for
social services.
4. Politically, a baseline of stability existed: since the establishment of a democratic system in 1990, presidential
elections were generally considered to be free and fair, and transfers of power had been peaceful. In March 2011, Dr.
Boni Yayi was re-elected to a second and final five-year Presidential term, and his alliance had won a majority in the
National Assembly, allowing for the continuation of the Government’s existing reform program.
Sector Context
5. The Government abolished pre-primary and primary school fees in 2006/07, funding a mechanism of school
grants managed by school directors in collaboration with School Management Committees (SMCs). In part, as a result
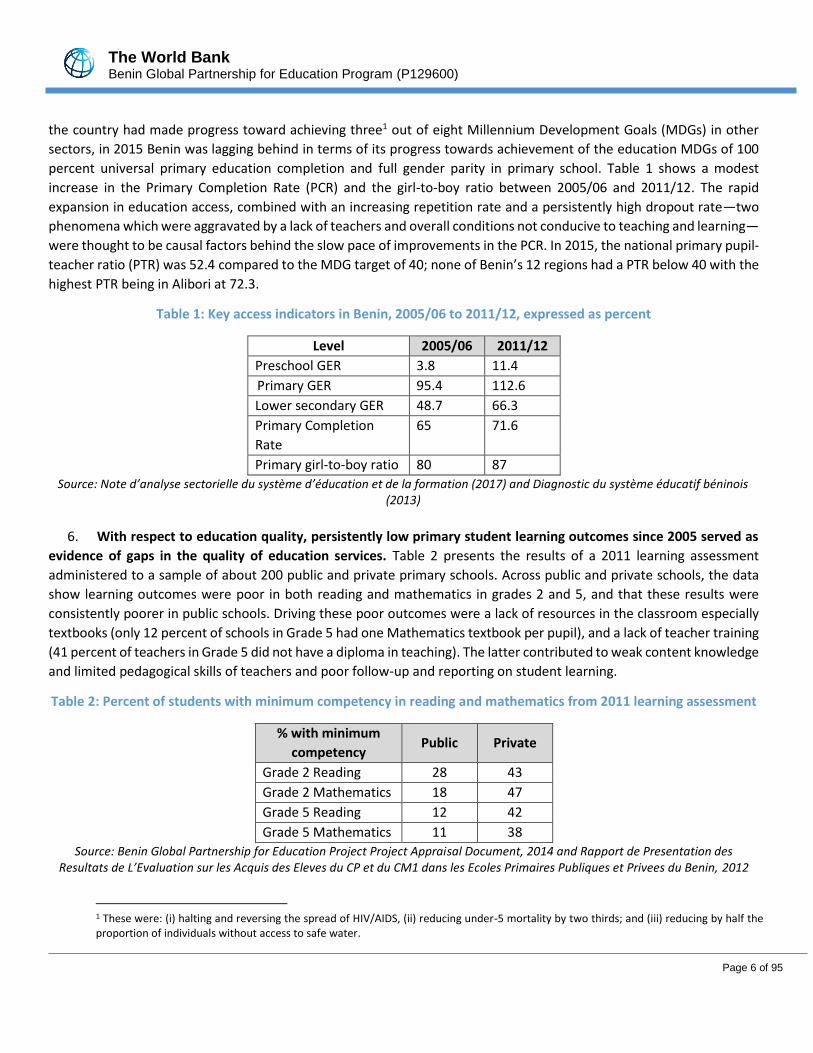
of this policy, prior to project preparation, there had been increases in access to education at all levels. Table 1 provides
key statistics related to access to education in Benin between 2005/06 and 2011/12. The table shows that the gross
enrollment rate (GER) at various levels of basic education improved substantially over this period. However, although
The World Bank Benin Global Partnership for Education Program (P129600)
Page 6 of 95
the country had made progress toward achieving three1 out of eight Millennium Development Goals (MDGs) in other
sectors, in 2015 Benin was lagging behind in terms of its progress towards achievement of the education MDGs of 100
percent universal primary education completion and full gender parity in primary school. Table 1 shows a modest
increase in the Primary Completion Rate (PCR) and the girl-to-boy ratio between 2005/06 and 2011/12. The rapid
expansion in education access, combined with an increasing repetition rate and a persistently high dropout rate—two
phenomena which were aggravated by a lack of teachers and overall conditions not conducive to teaching and learning—
were thought to be causal factors behind the slow pace of improvements in the PCR. In 2015, the national primary pupil-
teacher ratio (PTR) was 52.4 compared to the MDG target of 40; none of Benin’s 12 regions had a PTR below 40 with the
highest PTR being in Alibori at 72.3.
Table 1: Key access indicators in Benin, 2005/06 to 2011/12, expressed as percent
Level 2005/06 2011/12
Preschool GER 3.8 11.4
Primary GER 95.4 112.6
Lower secondary GER 48.7 66.3
Primary Completion
Rate
65 71.6
Primary girl-to-boy ratio 80 87
Source: Note d’analyse sectorielle du système d’éducation et de la formation (2017) and Diagnostic du système éducatif béninois (2013)
6. With respect to education quality, persistently low primary student learning outcomes since 2005 served as
evidence of gaps in the quality of education services. Table 2 presents the results of a 2011 learning assessment
administered to a sample of about 200 public and private primary schools. Across public and private schools, the data
show learning outcomes were poor in both reading and mathematics in grades 2 and 5, and that these results were
consistently poorer in public schools. Driving these poor outcomes were a lack of resources in the classroom especially
textbooks (only 12 percent of schools in Grade 5 had one Mathematics textbook per pupil), and a lack of teacher training
(41 percent of teachers in Grade 5 did not have a diploma in teaching). The latter contributed to weak content knowledge
and limited pedagogical skills of teachers and poor follow-up and reporting on student learning.
Table 2: Percent of students with minimum competency in reading and mathematics from 2011 learning assessment
% with minimum
competency Public Private
Grade 2 Reading 28 43
Grade 2 Mathematics 18 47
Grade 5 Reading 12 42
Grade 5 Mathematics 11 38
Source: Benin Global Partnership for Education Project Project Appraisal Document, 2014 and Rapport de Presentation des Resultats de L’Evaluation sur les Acquis des Eleves du CP et du CM1 dans les Ecoles Primaires Publiques et Privees du Benin, 2012
1 These were: (i) halting and reversing the spread of HIV/AIDS, (ii) reducing under-5 mortality by two thirds; and (iii) reducing by half the proportion of individuals without access to safe water.

The World Bank Benin Global Partnership for Education Program (P129600)
Page 7 of 95
7. Geographic and social inequities were pervasive in the provision and quality of education services, and the
gender gap progressively increased at higher levels of the education system. For example, at the time of project
appraisal, out of 77 districts nationally, around one-third of these had a GER below 95 percent and/or a PCR below 50
percent. These districts also had the highest rates of extreme poverty, high PTRs and accounted for more than one-
quarter of the primary school-aged population (6 -11 years old). In 13 of these 25 districts, access to education and girls’
participation was particularly low. Furthermore, although the gender gap in primary enrollment had narrowed, it
nevertheless progressively widened as students advanced through the education system, such that boys’ enrollment rate
in post-basic education was over 73 percent, while for girls it was about 50 percent. In addition, retention rates were
lower for girls, as evidenced by lower PCRs amongst them and by the fact that girls were 2.6 times less likely to reach
Grade 13 than were boys. At the lower secondary level, there were 23 districts with a GER among girls below 30 percent;
these districts represented 15.1 percent of students at the secondary level and had 20.6 percent of the total number of
schools.
8. Compounding these issues, the Government faced challenges in managing and overseeing the education
system. A 2011 education sector institutional and organizational audit highlighted some of these challenges, including
inter alia: (i) an administratively heavy system and slow decision-making processes affected by political decisions, that
hindered the efficient achievement of results in the sector and lowered staff motivation and morale; (ii) division of
responsibility for the sector spread among four ministries which dispersed the implementation of strategic decisions,
combined with an unclear division of roles and responsibilities within the administration—thereby reducing
accountability; (iii) a lack of functional buildings and equipment important for ensuring a more efficient administration
of the system; (iv) a number of outdated laws and unimplemented decrees; and (v) high teacher absenteeism coupled
with low effectiveness of the use of school time. In addition, an Education Management Information System (EMIS) had
not been fully established with only a computerized framework present, and teacher deployment was largely inefficient.
Teacher training particularly for in-service teachers was poor: in 2011, 80 percent of permanent teachers at the
secondary level had not participated in significant training and most of them were not trained in the subject that they
were teaching.
9. To address these issues, the Government’s strategy for the education sector was outlined in a Ten-Year
Education Plan (Plan Décennal de Développement du Secteur de l’Education – PDDSE) established in 2006, updated for
the 2013-15 period, and endorsed by the Local Education Group (LEG) and members of the Global Partnership for
Education (GPE) in February 2013. This strategy outlined sector priorities, which included: (i) improving service delivery
to increase access, equity, retention, and learning achievement in basic education, promotion of girls’ education, and
the recruitment and training of qualified teachers; (ii) strengthening the governance and efficiency of the education
system through better management and redeployment of teaching staff, more efficient financing and management of
schools, and better academic and administrative support; and (iii) re-orienting post primary education and training to
better respond to the skills needs of a more diversified economy. Operationalization of the PDDSE was estimated to cost
US$1,286 million between 2013 to 2015, of which donors – including this project – intended to commit US$1,247 million.
10. The Benin Global Partnership for Education Program (P129600) was a follow-on to a previous operation
financed by the GPE—the Education for All Fast Track Initiative (EFA-FTI) project (P110576) in the amount of US$76.1
million —implemented from December 2008 to June 2012. The EFA-FTI project had aimed to improve education access,
The World Bank Benin Global Partnership for Education Program (P129600)
Page 8 of 95
equity and retention, as well as teaching quality, literacy training, and management of the education system. The project
was successful in meeting and / or exceeding most of its PDO-level indicator targets particularly for improvements in the
PCR and the GER in preschool and primary education. Lessons learned from the EFA-FTI project informed the new
project’s design and highlighted several areas that would benefit from capacity strengthening within the Ministries in
charge of the education sector, notably: planning and budgeting, procurement, monitoring and evaluation (M&E), and
human resource management. Thus, the Benin GPE Program aimed to build upon some of the successful initiatives
financed under the EFA-FTI project including, in particular: (i) strengthening district inspectorates, school management
and information systems in order to increase accountability to achieve results; (ii) providing direct support to schools for
the acquisition of learning materials; and (iii) supporting community-run school canteens, given their higher cost-
efficiency relative to publicly-run canteens. The EFA-FTI project also instituted a pooled funding mechanism where,
instead of broad categorization of funding, funding could be traced using identifiable entities that were distinguishable
from one another. Donor coordination and support throughout the project cycle were also key to ensuring project
success.
Theory of Change (Results Chain)
11. The Benin GPE project’s (P129600) two overarching objectives were to improve: (i) access with equity; and (ii)
quality of classroom instruction at the basic level in the deprived districts2. To ensure that the project was equity-
enhancing, it targeted most interventions in the 25 most deprived districts in Benin at the primary level, and the 23 most
deprived districts at the lower secondary level – a total of 31 districts as 17 districts overlapped.3 Given that the selection
criteria for the most deprived districts were based on access indicators, interventions that targeted access were
administered only in the most deprived districts. In addition, recognizing the poor learning outcomes, the project also
aimed to improve quality outcomes with several quality interventions administered nationwide including pre-service
training of lower secondary teachers and strengthening school inspection and improving pedagogical management
through the use of student learning assessments. For the same reason, equity was combined with access within one
project objective as the project’s focus on administering access interventions only in the most deprived districts was
equity enhancing. Furthermore, equity could only be measured in terms of access as there was no baseline data on
learning outcomes to compare districts targeted by the project with districts in the rest of the country. The project was
designed around three complementary components that focused on investments in infrastructure and goods, while also
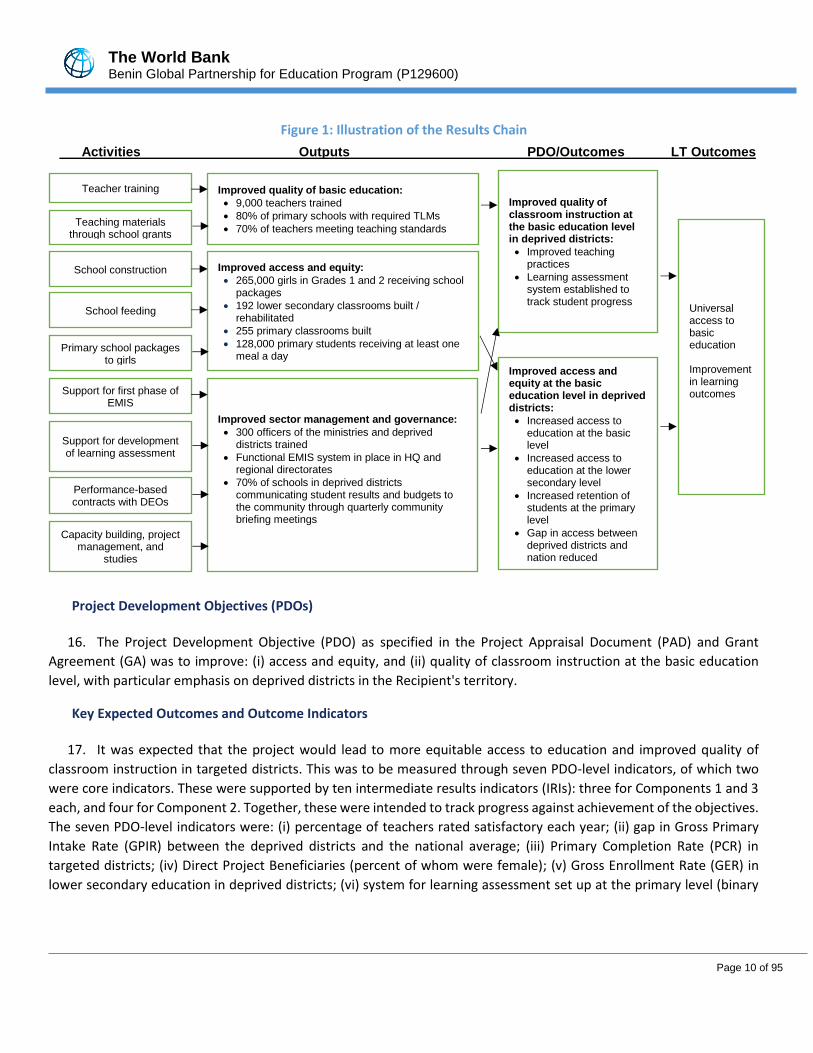
providing capacity-building support. Figure 1 provides an illustration of the results chain.
12. The first component aimed to improve the quality of basic education through two sub-components focused
on teacher training and school grants. In-service training was intended for existing primary school teachers and
pedagogical support staff to improve pedagogical skills and increase time of instruction, while pre-service training
intended to provide pedagogical skills and content knowledge for contract teachers at the lower secondary level who
did not have any pre-service training. In addition, the provision of school grants for the 2014/15 academic year was
intended to allow schools to purchase necessary teaching materials. Both the in-service training and school grants
supported under this new project were designed based on and aimed to build on the successful implementation of these
activities under the EFA-FTI project.
2 During appraisal, deprived districts that were to receive project interventions were selected using the following criteria: (i) for primary, if the GER was lower than 95 percent and / or completion rate less than 50 percent; (ii) for lower secondary, if GER for girls was lower than 30 percent. Based on these criteria, 25 deprived districts were selected at the primary level and 23 at the lower secondary level. 3 More details on the categorization of deprived districts can be found later in the document.

The World Bank Benin Global Partnership for Education Program (P129600)
Page 9 of 95
13. The second component aimed to improve access and equity of basic education through classroom
construction, school feeding, and primary school packages for girls. By investing in the construction of classrooms at
both the primary and lower secondary levels, the project aimed to increase access to education, while also reducing
student-classroom ratios in existing schools. School feeding interventions had been effective in increasing access and
were implemented in a cost-effective manner in the previous EFA-FTI project by using an existing informal system of
mothers who prepared and served lunchtime meals. Under the new project, this activity would be supported with non-
governmental organizations (NGOs) recruited to oversee the school canteens program. Finally, providing primary school
packages to girls aimed to lower costs for families and encourage girls to stay in school, thereby addressing gender
inequities in access to education. These interventions addressed equitable access to education and were thus directly
linked to the first objective of the PDO.
14. The third component aimed to improve sector management and governance. Benin’s progress towards
universal primary education had resulted in increased demand for higher levels of education. In addition, the increasing
decentralization of the education system had generated a stronger need for accountability and capacity building. As
such, activities which would address these challenges were featured in the project design: establishing a functional EMIS;
establishing performance-based contracts with District Education Offices (DEOs); supporting capacity building activities
for actors in the system: developing a learning assessment, building strong project management; and undertaking related
studies. These would be crucial inputs to address the aforementioned challenges.
15. Alongside other interventions in the sector, achievement of the PDO was expected to contribute to the
Government’s long-term objectives of improving human capital—identified as one of the necessary conditions for
laying the foundations for medium- and long-term economic growth in the Government’s Action Plan for the
Reduction of Poverty (2011-15). It would also contribute to the achievement of the PDDSE aims to increase access,
equity, retention, and improve learning achievement in basic education, promote girls’ education, recruit and train
qualified teachers; and strengthening governance of the education system. In addition, the objectives of the operation
were aligned with the World Bank’s 2013-2017 Country Partnership Strategy (CPS) for Benin, which aimed to support
improved governance and to promote human development outcomes. Finally, the project also contributed to GPE
objectives in Benin.
The World Bank Benin Global Partnership for Education Program (P129600)
Page 10 of 95
Figure 1: Illustration of the Results Chain
Project Development Objectives (PDOs)
16. The Project Development Objective (PDO) as specified in the Project Appraisal Document (PAD) and Grant
Agreement (GA) was to improve: (i) access and equity, and (ii) quality of classroom instruction at the basic education
level, with particular emphasis on deprived districts in the Recipient's territory.
Key Expected Outcomes and Outcome Indicators
17. It was expected that the project would lead to more equitable access to education and improved quality of
classroom instruction in targeted districts. This was to be measured through seven PDO-level indicators, of which two
were core indicators. These were supported by ten intermediate results indicators (IRIs): three for Components 1 and 3
each, and four for Component 2. Together, these were intended to track progress against achievement of the objectives.
The seven PDO-level indicators were: (i) percentage of teachers rated satisfactory each year; (ii) gap in Gross Primary
Intake Rate (GPIR) between the deprived districts and the national average; (iii) Primary Completion Rate (PCR) in
targeted districts; (iv) Direct Project Beneficiaries (percent of whom were female); (v) Gross Enrollment Rate (GER) in
lower secondary education in deprived districts; (vi) system for learning assessment set up at the primary level (binary
Teacher training
Teaching materials through school grants
School construction
School feeding
Primary school packages to girls
Support for first phase of EMIS
Support for development of learning assessment
Performance-based contracts with DEOs
Capacity building, project management, and
studies
Improved quality of basic education:
• 9,000 teachers trained
• 80% of primary schools with required TLMs
• 70% of teachers meeting teaching standards
Improved access and equity:
• 265,000 girls in Grades 1 and 2 receiving school packages
• 192 lower secondary classrooms built / rehabilitated
• 255 primary classrooms built • 128,000 primary students receiving at least one
meal a day
Improved sector management and governance:
• 300 officers of the ministries and deprived districts trained
• Functional EMIS system in place in HQ and regional directorates
• 70% of schools in deprived districts communicating student results and budgets to the community through quarterly community briefing meetings
Improved quality of classroom instruction at the basic education level in deprived districts:
• Improved teaching practices
• Learning assessment system established to track student progress
Improved access and equity at the basic education level in deprived districts:
• Increased access to education at the basic level
• Increased access to education at the lower secondary level
• Increased retention of students at the primary level
• Gap in access between deprived districts and nation reduced
Universal access to basic education Improvement in learning outcomes
Activities Outputs PDO/Outcomes LT Outcomes

The World Bank Benin Global Partnership for Education Program (P129600)
Page 11 of 95
indicator; core indicator); and (vii) utility of the learning assessment system (sub-indicator of indicator vi; core indicator).4
Indicators i, vi, and vii were linked to the objective of improved quality, while indicators ii, iii, v were linked to the
objective of improved equitable access. Indicator iv was linked to both objectives of the project.
Components5
18. Most of the project components were administered in a total of 31 districts (out of 77 total districts in Benin)
based on the following criteria: (i) at the primary level, districts with a GER lower than 95 percent and/or a completion
rate less than 50 percent were selected resulting in a total of 25 districts representing 22.7 percent of students and 25.3
percent of schools; and (ii) at the lower secondary level, districts with a GER for girls lower than 30 percent were selected,
which represented approximately 15.1 percent of students and 20.6 percent of schools. According to these criteria, 17
districts overlapped at the primary and lower secondary levels. Two sub-components were administered to the entire
country: pre-service training of lower secondary teachers (under Component 1) and strengthening school inspection and
improving pedagogical management through the use of student learning assessments (under Component 3).
19. Component 1: Improving the quality of basic education (estimated cost: US$8.20 million, revised cost
(restructuring September 2015): US$9.70 million, revised cost (restructuring May 2017): US$10.47, actual expenditure:
US$12.89 million). This component aimed to improve teaching practices and the quality of the learning environment in
Benin’s most deprived districts through two sub-components: (i) in-service and pre-service teacher training at both the
primary and lower secondary levels; and (ii) school grants in the amount of US$1,000 administered to all primary schools
in the deprived districts for the 2014/15 academic year. The project only funded school grants for the first year of the
project due to cost considerations; while initially school grants were intended to be provided every two years, given
overall project financing was limited and the project included a wide range of interventions, it was decided that these
grants would only be provided in the first year.
20. Component 2: Improving access and equity (estimated cost: US$25.30 million, revised cost (restructuring
September 2015): US$25.37 million, revised cost (restructuring May 2017): US$25.37, actual expenditure: US$23.14
million). This component financed: (i) the construction and equipping of classrooms in primary and lower secondary
schools in the deprived districts (including student desks, teacher desks, and latrines); and (ii) activities necessary to
improve retention and equity, including school feeding programs and actions aimed at promoting girls’ enrollment in the
targeted districts through administering school kits.
21. Component 3: Improving sector management and governance (estimated cost: US$8.80 million, revised cost
(restructuring September 2015): US$7.23 million, revised cost (restructuring May 2017): US$7.09, actual expenditure:
US$5.93 million). The objective of this component was to strengthen Benin’s capacity to implement and supervise its
education sector program through three sub-components: (i) rolling out the first phase of the EMIS; (ii) strengthening
school inspection and improvement of pedagogical management through the use of student learning assessments; and
(iii) capacity building, project management and studies.
4 For a full list of indicators, refer to Annex I.B. 5 For more details on project components, refer to Annex I.A.

The World Bank Benin Global Partnership for Education Program (P129600)
Page 12 of 95
B. SIGNIFICANT CHANGES DURING IMPLEMENTATION (IF APPLICABLE)
Revised PDOs and Outcome Targets
22. The PDO remained unchanged throughout the life of the project.
Revised PDO Indicators
23. In September 2015, a Level 2 restructuring was undertaken and some changes to PDO-level indicators were
introduced. Given the delay in project effectiveness which reduced implementation time to two years and three months,
shifts in indicator values were noted. A full summary of changes to the Results Framework is captured in Annex 1.B. At
the PDO-level, the changes noted were as follows:
• Gross Primary Intake Rate (GPIR) in the deprived districts (total and girls) was introduced as an indicator intended
to measure access, given that this this might be more accurately capture progress towards achievement of PDO
objectives than the Gap in GPIR between the deprived districts and the average national level (total and girls).
• Gap in GPIR between the deprived districts and the average national level (total and girls) was moved from a PDO-
level indicator to an IRI with revised endline targets. Comparing the intake rate in these districts to the national
rate would not adequately capture progress towards achievement of the PDO since the project could not directly
influence interventions and outcomes in the non-deprived districts. As such, the national average would not
provide an appropriate benchmark to assess the project’s impact. Thus, the implementation team made the
decision to reclassify this as an IRI, and, at the PDO-level, to track the GPIR (total and girls, see above). This indicator
would more reliably reflect progress in the deprived districts where the project was focusing on improving
equitable access to education.
• Endline targets were revised for:
o PCRs in targeted districts (total and girls) due to an increase in these rates observed during the period
between preparation and effectiveness. At the time of the September 2015 restructuring, endline targets
for this indicator had already been met. Hence, endline targets were revised upwards to ensure more
ambitious goal-setting for the project. The targets were increased from 50 percent (total, with 45 percent
for girls) to 56.5 percent (total, with 52.5 percent for girls).
o GERs in lower secondary education in targeted districts (total and girls) due to a decrease in these rates
observed during the period between project preparation and effectiveness, and an increase in the rate
amongst girls which surpassed endline targets. Therefore, under this restructuring endline targets were
revised. The target for total GER was revised downward from 52 percent to 48.5 percent to reflect trends in
achievement and the target for girls’ GER was revised upwards from 30 percent to 37.5 percent to reflect
observed trends and to encourage further achievement on this indicator.
Revised Components
24. As a result of cost savings due to shifts in the exchange rate and the Government’s decision to waive taxes on
construction activities, the implementation team decided to include an additional activity under Component 1, which was
the purchase and distribution of 21,000 grammar books to teachers. This was added as it was an effective way to reinforce

The World Bank Benin Global Partnership for Education Program (P129600)
Page 13 of 95
teacher trainings. The inclusion of this activity increased the funding for Component 1 from US$8.20 million to US$9.70
million.
Other Changes
25. There were two restructurings under the project. The first restructuring was approved on September 17, 2015
and the second restructuring was approved on May 21, 2017.
26. Under the first restructuring in September 2015, the following changes were made:
• Extension of project’s closing date by 11 months to May 31, 2017: Given the delay in project effectiveness which
reduced the project’s timeline by nine months, this restructuring was requested by Government in order to ensure
sufficient time to complete those activities considered critical for the achievement of the PDO. Consistent with
GPE’s requirement, the original operation was to be implemented over a period of three years. However, a lengthy
project preparation and approval process, as well as delays in completion of pre-conditions to the project’s signing
by the Government delayed the date of project effectiveness, reducing the project implementation period to two
years and three months. In addition, the Government anticipated that the upcoming rainy period would make
school construction and EMIS implementation activities difficult to complete by the original closing date. This
extension resulted in a change in the implementation schedule.
• Revision of activities supported under Component 1 of the project: Provision and distribution of grammar books
to teachers was included under Component 1 (see above).
• Revision of the project’s Results Framework to reflect recent and unanticipated trends in indicators. A full list of
the changes to the Results Framework during restructurings is provided in Annex 1.B. In addition to changes at the
PDO-level, changes at the intermediate-level were made including: (i) Introducing a new indicator on number of
G1 and G2 grammar books distributed to teachers in the deprived districts; (ii) Moving the PDO-level indicator on
Gap in GPIR between the deprived districts and the national average (total and girls) to the intermediate-level; (iii)
Dropping the indicator on the percentage of primary schools having purchased the required learning materials due
to the fact that the school grants program (which funded such purchases) was only supported under the project
in 2013/14; and (iv) Increasing endline targets for the number of teachers trained, number of officers of the
ministries and deprived districts trained, and primary students receiving at least one meal per day in the deprived
districts.
• Reallocation of US$1.868 million of grant proceeds from Category 2 to Category 1 of eligible expenditures:
Category 1 expenditures under the project included all non-construction activities, while Category 2 included all
construction-related activities. The exemption of taxes by the Government on school construction activities
resulted in a reduction in the cost of classroom construction. In addition, shifts in the exchange rate (from US$1 =
FCFA500 at the time of signing of the GA to US$1 = FCFA580 at restructuring) allowed planned activities under
Category 2 to be completed at a lower cost. Therefore, under the restructuring, US$1.868 was reallocated from
Category 2 to Category 1 to provide further funding for school canteens and the purchase and distribution of
grammar books to teachers under Component 1. This also changed the budget allocation across project
components (see Annex 3.A for more details).
• Introduction of changes to the Grant Agreement (GA) in terms of disbursement percentages under each trust fund
and inclusion of specific guidelines related to the disbursement of the trust funds: Project funds were provided
through two trust funds. To ensure that there was sufficient funding available in Category 2 of TF16846 to satisfy
The World Bank Benin Global Partnership for Education Program (P129600)
Page 14 of 95
withdrawal applications that were underway or that were anticipated at the time of restructuring, these changes
to the GA were necessary. The new guidelines also ensured that no withdrawals were made under TF16842 until
all funds were exhausted under TF16846. Funds under TF16846 were intended to be exhausted by the project’s
original closing date of June 30, 2016.
27. Under the second restructuring in May 2017, the following changes were made6:
• The project was extended by an additional 11 months, with a new closing date of April 30, 2018. This was done to
ensure that the project would be able to complete a number of key activities by the closing date including:
establishment of the learning assessment system; construction of additional schools (which was financed from the
cost savings resulting from exchange rate gains)7; school feeding activities; and establishment of the EMIS. This led
to a revision of the implementation schedule. Together, both restructurings extended the project by 22 months
from the original closing date of June 30, 2016 and the project implementation period-- from effectiveness to
closing – was a total of four years and one month.
• Costs were reallocated across components and categories of expenditure.8 This reallocation across components
shifted resources away from Component 2 and Component 3 and toward Component 1 in light of the fact that: (i)
at the time, 73 percent of undisbursed funds were allocated toward Component 3 and it was unrealistic that all
activities within this component would be achieved given challenges with implementation (see later in the
document for more detail); and (ii) there was a need to continue training teachers as a result of the poor PASEC
assessment, results of which had recently been released.9 In addition, within Component 2, more was allocated
toward school construction as a result of the Government decision to make additional classrooms available to
meet increasing need. As a result, this second restructuring increased the allocation to Category 2 (construction
activities). A summary of the changes in allocations across components and categories is provided in Annex 3.A.
Rationale for Changes and Their Implication on the Original Theory of Change
28. With the regards to long-term outcomes and PDO-level indicators, the original theory of change remained
largely the same throughout the life of the project. The PDO wording remained unchanged throughout the project life.
Although the GPIR in the deprived districts (total and girls) was added as a PDO-level indicator and the gap in the GPIR
between the deprived districts and the average national level (total and girls) was shifted to an IRI, these changes were
6 The only adjustments made to the Results Framework under the second restructuring was extension of the target date to coincide with the revised closing date of April 30, 2018. 7 The construction of schools was divided into two parts: (i) construction in sites where soils were normal; and (ii) construction in sites which need a soil study. Although the exchange rate gains were already achieved by the time of restructuring in September 2015, when the restructuring was being prepared, the bidding process for the second part of the construction was not completed and therefore it was not possible to anticipate the costs of the additional construction. As a result, this increase in the number of planned schools is not reflected in the Results Framework. 8 The World Bank noted that by comparing the costs by category after the first restructuring and the new allocation, the variation was minor (less than 15 percent) and fell within the competence of the Program Manager according to the procedures of the World Bank. As no changes had been made to the other aspects of the program, the Bank considered that the changes in program costs did not require a restructuring as defined by it and the request was limited to an extension. A separate summary document was sent outlining the reallocations across components and categories. 9 The results from this report indicated that student scores at beginning of primary school are the second last in language and mathematics among ten countries evaluated; however, at the end of primary school, Benin ranks third in language scores and fourth in mathematics scores. Within Benin, performance in urban areas is substantially better than performance in rural areas.

The World Bank Benin Global Partnership for Education Program (P129600)
Page 15 of 95
still sufficient to measure the two objectives of improved quality of classroom instruction and improved access and equity
at the basic level in the deprived districts. The rationale for these changes is provided in the section above.
29. The original theory of change remained materially the same over the life of the project with only minor
revisions to the project’s Results Framework and the scale up and addition of some activities due to cost savings and
the discontinuation of the school grants program supported under the project. Annexes 1.B and 1.C summarize the
changes introduced to the Results Framework and the Theory of Change, respectively.
II. OUTCOME
A. RELEVANCE OF PDOs
Assessment of Relevance of PDOs and Rating
30. The project’s objectives were highly relevant as they responded to key challenges facing the education sector
at appraisal and were strongly aligned with the country’s strategies. In a context of increased demand for education,
combined with low retention rates and poor teaching quality, the project provided much-needed support to address these
challenges. In addition, the CPF FY13-17 highlighted the need to improve the quality of education particularly in deprived
districts under the second pillar of improving service delivery and social inclusion. It also emphasized the need to ensure
gender issues were mainstreamed within the framework. Furthermore, the PDDSE highlighted priorities related to
improved service delivery to increase access, equity, retention and learning outcomes in basic education, promoting girls’
education, training qualified teachers, and strengthening governance and efficiency through more efficient school-based
management. The project’s focus on increasing equitable access to education and improving its quality with a particular
focus on increasing girls’ participation in school, was strongly aligned with both the CPF and the PDDSE. The project
funding contributed to closing the financing gap for the PDDSE and thus was supportive of the Government’s overarching
strategies and priorities.
31. The PDO continues to remain highly relevant given its strong alignment with the PDDSE, CPF and the country’s
new Education Sector Plan (ESP) (2018-2030). Specifically, the project’s focus on promoting equitable access to
education, improving teaching practices, and increasing equitable access of girls to schooling were aligned with the ESP
(2018-2030). In addition, the current CPF FY19-23 articulates three development priorities for the World Bank in Benin.
Under its second priority, “Equitable access to opportunities and inclusion of the poor in the growth process”, the CPF
aims to, inter alia, foster the following:
• Development of human capital, by improving equitable access to quality education and other basic services.
The project’s focus on equitable access to education, is aligned with CPF priorities. In particular, the
construction of classrooms at the primary and lower secondary levels was intended to improve access to
education while reducing student-classroom ratios in existing schools. The provision of school kits to girls
combined with promotion campaigns encouraging their participation in schooling was intended to reduce the
financial burden of sending girls to school and incentivize their enrollment and retention, thereby reducing
gender inequities in basic education. By focusing its efforts on the most deprived districts, project objectives
aimed to reduce the gap in the provision and quality of education services in these lesser-served regions,
thereby promoting equity. School feeding was intended to incentivize primary school enrollment and foster

The World Bank Benin Global Partnership for Education Program (P129600)
Page 16 of 95
attendance and retention, also reducing disparities in access between deprived districts and other districts in
the country.
• Improvement of educational outcomes and increased educational attainment to further reduce poverty,
increase labor productivity, and create better jobs. The project objective of improving the quality of basic
education instruction was fully aligned with this objective; pre- and in-service teacher trainings to be provided
under the project aimed to strengthen teachers’ pedagogical skills and content knowledge and, in turn,
improve student learning and increase educational attainment.
• Addressing of gender imbalances and regional disparities in well-being, to improve equality of opportunity and
equity overall. While addressing gender imbalances was not explicitly stated in the PDO, the project activities
centered on promoting girls’ participation and retention in school, with an aim of reducing the gender gap in
education. Furthermore, where possible, indicators in the Results Framework were often disaggregated to
include separate targets for girls. In addition, the focus on deprived districts (using the project’s targeting
criteria to identify regions at a disadvantage with respect to education services), was intended to reduce
geographic disparities in terms of education outcomes.
32. Given that the PDO was highly relevant at appraisal and continues to remain relevant to the country’s key sector
strategies and priorities, the relevance of the PDO is rated High.
B. ACHIEVEMENT OF PDOs (EFFICACY)
33. The ICR team carefully reviewed the OPCS/ICR Guidelines and IEG’s ICR Manual for Evaluators and determined
that since there was no change to project scope or objectives, a split rating/evaluation was not warranted in this case.
Although the September 2015 restructuring of the project changed one of the PDO-level indicators, endline targets for
some PDO-level indicators were revised (see Annex 1.B), one new PDO-level indicator was added – GPIR in deprived
districts – to replace an existing indicator on Gap in GPIR between deprived districts and the national average, this did not
materially change the scope or the overarching objectives of the project.
Assessment of Achievement of Each Objective/Outcome
Objective 1: Improving Access with Equity
34. The first objective of improving access with equity in the deprived districts was only partially achieved and as
such, the level of achievement of this first objective is rated Modest. While the project exceeded all access-related
indicators’ targets at the intermediate-level, targets of the PDO-level indicators were not met.
i. The project financed the construction of 318 equipped classrooms at the primary level and 212 equipped
classrooms at the lower secondary level in deprived districts. As part of the construction activities, 212 and 101
blocs of latrines were built at the primary and lower secondary levels respectively; 318 and 212 teacher desks were
provided at these levels; and 7,950 and 5,300 student desks were procured. The total number of classrooms built
by the end of the project, substantially exceeded the end-of-project targets of 255 and 192 classrooms built at the
primary and lower secondary levels, respectively. This corresponded to an increase over the target by 25 percent
at the primary level and 10 percent at the lower secondary level, respectively. These targets were, in part,
exceeded due to: (i) exchange rate gains from US$1 = FCFA 500 during appraisal to US$1 = FCFA 580 during the

The World Bank Benin Global Partnership for Education Program (P129600)
Page 17 of 95
first restructuring; and (ii) the Government’s decision to waive taxes on construction which allowed for savings in
the amount of FCFA 941 million (or US$1,622,413.80 with an exchange rate of US$1 = FCFA 580).
ii. During the second restructuring in May 2017, it was decided that the project would finance the
construction of additional classrooms. To ensure planned construction targets were achieved, school construction
was managed by two delegated contract management agencies that had been effective in this role under the
previous EFA-FTI project – Agence d’exécution des travaux urbains (AGETUR) and Agence d’exécution de travaux
intérêt public (AGETIP). These agencies were responsible for recruiting local firms and supervising the work,
conducting technical studies, adapting plans, etc. Although targets were exceeded, the work was not completed
according to the original timeline given the MOE’s initial delays in selecting those schools to receive additional
classrooms as well as delays in contracting. There were also delays in providing payments for construction, which
created additional lags in carrying out civil works activities under the project. A technical audit indicated that
technical studies were of satisfactory quality, with good supervision structures in place; however, the quality of
construction, while good, could have been improved.
iii. The objective of improved access was also supported through school feeding interventions. By the end of
the project, 318,245 primary students received at least one meal per day in the deprived districts, exceeding the
revised endline target (during the September 2015 restructuring) of 270,000 by 18 percent. The project was able
to cover the cost of providing school meals to additional students as a result of cost savings described above. Based
on successful implementation of this intervention under the EFA-FTI project, school feeding was administered by
an existing, informal system of mamans (mothers) who prepared and served lunchtime meals, using NGOs as a
supervising entity. FCFA 150 was allocated for each student with the maman cooking for two weeks and providing
receipts for reimbursement. The mamans were also trained on school hygiene and the basics of running a school
canteen.
iv. While the related indicator targets were exceeded, some challenges were encountered during
implementation including substantial delays in signing contracts during each year of the project resulting in
delayed provision of meals schools. In addition, schools did not have guidelines for portioning (i.e., nutrition and
calories to be provided with each meal), although the quality of meals were monitored by school committee
comprising of one teacher, students and community representatives. Despite these challenges, the beneficiary
survey at the end of the project found that 95 percent of parents sampled were satisfied or very satisfied with the
school canteen intervention. In the 2014/15 academic year, fraudulent practices involving the Head of the
Inspectorate and the District Tax Officer of Malanville (one of the 25 project districts) with the complicity of school
directors in the district were uncovered with regard to the administration of the school canteens. The total amount
of funds that were misused was FCFA 29 million (US$51,800). The Government and the project implementation
team took swift measures to address this by reporting it in a timely manner, dismissing the involved authorities
from their posts, and reimbursing in full the amount misused. The Bank task team reported this issue to INT who
reviewed the evidence and determined that the claim required “No Further Action” as all relevant steps had been
taken to rectify this issue. The Bank task team also requsested an audit of a representative sample of schools in
the targeted districts to oversee the use of funds transferred for all activities. In 2016/17, another case of misuse
of funds with regards to school canteens was documented. The amount of funds which were considered misused

The World Bank Benin Global Partnership for Education Program (P129600)
Page 18 of 95
amounted to FCFA 51.3 million (US$87,080). The Government reimbursed the project in full, and the INT report
indicated that this was also appropriately handled and that no further action was needed.
v. To increase equitable access to schooling, the project also financed the provision of 323,455 school kits
to girls in grades 1 and 2 in deprived districts, exceeding the target of 265,000 by 22 percent. In addition, 15,940
kits were distributed to flooded districts at the request of the Government. The kits included notebooks, didactic
materials excluding textbooks, as well as a school backpack and a school uniform. Although it was envisaged that
this activity would be discontinued following the 2016/17 academic year, cost savings enabled 71,500 more
students to benefit in 2017/18, the final year of the project. The provision of kits was advertised on community
radio stations with a staff person at the PIU in charge of facilitating awareness raising related to the kits.
Recognizing some challenges related to the quality and procurement of kits in 2014/15, the Government and the
project implementation team took proactive measures to ensure better monitoring of this activity. First, the
General Inspectorate of Finance in collaboration with the MOE conducted an audit in a representative sample of
schools in all 25 districts to ensure that the kits conformed to standards and complied with procurement
procedures. In addition, a new approach was adopted for distributing school kits where in the Program Monitoring
Unit (Unité d’Appui Technique et de Suivi – UATS) was responsible for their distribution with oversight by the
Minister’s Cabinet. Instead of kits being provided at the local level, an open bidding process was used whereby
schools were divided into geographic zones. The quality of schoolbags was also upgraded. Despite these changes,
school kits were delivered with some delay; but, according to the beneficiary survey, 89 percent of parents
sampled (parents of children who had received school kits) reported being satisfied or very satisfied with the
school kits.
vi. Notwithstanding these achievements, at the PDO-level, the access indicators’ targets were not met.
• GER in lower secondary school in the deprived districts (total and girls): While the revised endline
targets (introduced under the September 2015 restructuring) for this indicator was 48.5 percent and
37.5 percent for total and girls, respectively, in 2017/18, the total GER in the deprived districts was
35.6 percent while for girls this figure was 29.4 percent. This can be explained by more rigorous
enforcement of secondary school admission by the new administration in 2016, resulting in a decline
in examination results in the terminal primary exam (Certificat d’Etudes Primaires). Hence, in both
2016/17 and 2017/18, the GER at the lower secondary level for targeted districts declined
substantially.
• PCR in targeted districts (total and girls): This indicator’s target was also not achieved. The upward
revised endline targets (after the September 2015 restructuring) for the PCR in targeted districts was
56.5 percent total and 52.5 percent for girls. At the endline, 2017/18 data indicated that this target
was not met with the total primary education completion rate at 42.1 percent and for girls at 38.7
percent. It is important to highlight that these declines were also reflected at the national level,
where, despite improvements from 2012/13 to 2015/16, these rates began declining in 2016/17: at
the national level, the total PCR decreased from 76.8 percent in 2012/13 to 67.5 percent in 2017/18.
• GPIR in deprived districts (total and girls): The targets for this indicator of 117 percent total and 114
percent for girls was also not met: in 2017/18 the total GPIR was 104.3 percent and for girls it was
104.4 percent. These declines mirror the declines in the GPIR at the national level which decreased
from 142.7 percent in 2012/13 to 137.7 percent in 2017/18. Nevertheless, the gap in the GPIR

The World Bank Benin Global Partnership for Education Program (P129600)
Page 19 of 95
between the deprived districts and the average national total has also increased over the baseline
indicating that, despite project interventions, equity in access remains a challenge.
35. The second objective of improving the quality of classroom instruction at the basic education level in the
deprived districts was substantially achieved as evidenced by achievement of all PDO-level indicators’ targets. As such,
the level of achievement of the second objective is rated Substantial. In addition, all IRI’s targets linked to this objective
were achieved.
i. The project financed in-service teacher training for 10,699 primary level teachers in the deprived districts,
pre-service teacher training for 9,735 teachers at the lower secondary level, and in-service teacher training for
1,744 newly recruited lower secondary teachers.
• At the primary level: The project exceeded the endline target of 10,500 teachers trained by 2 percent. In-
service training sessions were held seven times throughout the project life. The first in-service teacher
training was delayed due to what was identified as the low quality of training materials which did not
target the needs of the teachers. However, once high-quality training materials (from the Francophone
Initiative for Distance Learning for Teachers) were identified and acquired, trainings were better aligned
with teachers’ needs. Trainings were further strengthened when the new administration took over and a
different agency under the Ministry was assigned responsibility for overseeing this intervention. Teachers
were evaluated in 2017 in subject matter expertise, particularly in linguistic skills (grammar, conjugation,
spelling and vocabulary) in the 25 deprived districts. The evaluation found that only 33 percent of teachers
who participated had a score of at least 50 percent, and nearly 30 percent of teachers had a score below
30 percent. The administration used these results to adjust the project –reallocating more funding toward
this sub-component and reconfiguring trainings to better target teachers’ needs. Teachers were
categorized according to their performance, strengths, weaknesses, and language abilities and trainings
covered a range of different areas including: content knowledge, evaluating student learning, managing
classroom time to maximize instruction, teaching multi-grade and large and heterogenous classes, and
Mathematics and French language instruction/tools.
• At the lower secondary level: Pre-service trainings were held during vacation periods for contract teachers
that were already teaching in schools. The duration of the training varied between one and four years
depending on the background and qualifications of the teacher(s). Trainings were administered under the
supervision of the public universities of Benin. Modules were developed by those who were considered
experts in the subject areas and delivered to contract teachers. Newly recruited instructors for pre-service
teacher training were trained in the use of the curriculum and teachers’ guides, lesson planning, leading
group discussions, and classroom management. In the poorest performing schools, two-week intensive
mentoring and feedback support was also provided through pedagogic advisors. During the ICR mission,
education stakeholders indicated that they found this training to be of a high quality. By the end of the
project, 63.3 percent of the teachers who were trained at the lower secondary level under the project
had graduated and were qualified to teach secondary school. In addition to training teachers, at the lower
secondary level, the project also financed the training of 387 educational advisers, 73 inspectors, and
1,320 management teams of lower secondary schools (Directors, Censors and Superintendents).

The World Bank Benin Global Partnership for Education Program (P129600)
Page 20 of 95
ii. The project also financed the purchase of teaching and learning materials in primary schools through
school grants in 2014/15 and provided and distributed G1 and G2 grammar books, delivering 26,000 grammar
books – surpassing the target of 21,000 by 24 percent.
• School grants: The indicator measuring the percentage of primary schools in the deprived districts having
purchased the required learning materials at least one month after the beginning of the 2014/15
academic year was dropped from the Results Framework as it was only relevant to the first year of the
project. The school grants during the year they were provided were used by the schools to cover the cost
of those learning materials needed by each specific school. The purchase of teaching and learning
materials with the school grants, however, was delayed as schools were required to use community
procurement procedures which were not well understood by the schools. By the end of the 2014/15
academic year, all primary schools in the 25 deprived districts (2,008 schools in total) had used the grants
to purchase appropriate materials.
• Grammar books: In order to strengthen the trainings under the project, the distribution of two grammar
books to all primary teachers in targeted districts was added as an activity under the first restructuring in
September 2015. The provision of these books aimed to further reinforce what the teachers had learned
during the training. The project team was proactive in ensuring that this activity was reflected in the
Results Framework, and the end-of-project targets was surpassed by 24 percent. The grammar books
were distributed in early 2017 and were accompanied with a study schedule to guide teachers on how to
use the grammar books.
iii. As a result of these trainings and school materials, there were improvements in teaching practices at the
primary level. The endline target for the PDO-level indicator on percentage of teachers rated satisfactory each
year by INFRE and an external agency survey of classroom observations in the deprived districts was 55 percent,
and this was surpassed by 4.4 percentage points reaching 59.4 percent under the project. This indicator was
measured three times during the course of the project.10 In addition, the target of the IRI on the percentage of
public teachers meeting the standards based on inspection and classroom visits each year at the primary level
using the l’Outil de Supervision et d’Encadrement Pédagogique (OSEP) tool was also exceeded, reaching 75.8
percent, surpassing the endline target of 70 percent by 5.8 percentage points. This tool assessed teachers’ content
knowledge and classroom management. Three rounds of classroom observations were conducted using the OSEP
tool throughout the course of the project.11
36. The project also financed activities to improve sector management and governance, which contributed to
strengthened data systems, research and human capacity.
i. To strengthen data systems, the project financed activities to strengthen the EMIS as well as Benin’s
participation in the CONFEMEN Programme for the Analysis of Education Systems (PASEC), a regional assessment.
The project also financed research on the causes of student drop out in primary schools.
• Strengthening EMIS: The project established a data center within the Ministry of Basic Education and
installed software for personnel management and the management of statistical data. However, there
were delays in procurement as a result of an initial conflict of interest with regard to recruiting the service
10 Reporting at endline averages all three results. 11 Ibid.
The World Bank Benin Global Partnership for Education Program (P129600)
Page 21 of 95
provider to develop the software, resulting in the bidding process being relaunched. This was reported to
INT. Consequently, the system was not established until nearly the end of the project, and the Ministry
had to make a strategic decision to determine what was feasible given the remaining time period. The
Government decided to test the software in one sub-sector (basic education) instead of rolling out a full
EMIS as envisioned and reallocated financing from this component to finance teacher training. Relevant
personnel within the Ministry were trained, and despite the delays, the first phase of the establishment
of the EMIS was completed. Due to time constraints, the EMIS was not installed in the regions and
districts, and as a result, the target of the corresponding IRI – EMIS is in place at the central Ministry of
Preschool and Primary Education (Ministère de l’Education Maternelle et Primaire – MEMP) and its
regional directorates and generating data in August for preschools and primary education – was not fully
achieved. The project also provided support to the statistical divisions to improve data collection and
processing in order to reduce the delay in the production of annual statistical yearbooks; however, the
change in administration in 2016 dismantled the EMIS at the regional level.
• Learning assessment: The project also funded Benin’s participation in a learning assessment at the
primary level, which was measured by a PDO-level indicator. The target of this indicator was achieved
when Benin participated in the PASEC 2014, a regional assessment that was designed to assess student
abilities in mathematics and reading in French which was rolled out to the entire country. A PASEC
committee was set up in the Ministry, that worked under the supervision of PASEC experts. The PASEC
2014 was designed to be internationally comparable and was administered to ten Francophone West
African countries.12 Both national and international reports for this examination were completed, and the
national report also incorporated Service Delivery Indicators. The results from this report indicated that
student scores at beginning of primary school are the second last in language and mathematics among
ten countries evaluated; however, at the end of primary school, Benin ranks third in language scores and
fourth in mathematics scores. This suggests that the Beninese education system is better able to fill the
gaps in knowledge than other countries evaluated. Within Benin, performance in urban areas is
substantially better than performance in rural areas. These reports, along with the teacher evaluations in
the deprived districts, were used to directly inform the project and led to the reallocation of increased
funding toward teacher training. The Government plans to continue using this assessment to measure
learning outcomes and has already paid to participate in PASEC 2019.
ii. To strengthen capacity, additional trainings and performance-based contracts were administered under
the project.
• Trainings at the central level: 460 officers of the ministries and deprived districts were trained, exceeding
the endline target (revised upward in September 2015) of 350 by 31 percent. Trainings were provided in
the following areas, among others: Excel, leadership and team management, archives and electronic
records management, personnel management, project planning, budgeting and annual work planning,
monitoring and evaluation, and procurement training. A one-year training in statistical disciplines for 15
officers of the Ministry of Education was also completed.
• Trainings at the decentralized level: Capacity development activities included training sessions for school
headmasters and heads of Parent Teacher Associations in the targeted school districts to build their skills
12 The ten countries were: Cameroon, Burundi, Republic of Congo, Cote d’Ivoire, Senegal, Chad, Togo, Benin, Burkina Faso and Niger.

The World Bank Benin Global Partnership for Education Program (P129600)
Page 22 of 95
in school-based participatory management and in sharing student results. The training also supported the
adoption and use of social accountability mechanisms such as posting school learning results and school
budgets so that the community would be aware of learning outcomes and budget decisions at the school-
level. The target of this indicator measuring the percentage of schools in deprived districts communicating
student results and budgets to the community through community quarterly briefing meetings was not
achieved, however, as the survey instrument that was intended to measure this indicator could not be
used as it was deemed unreliable.13
• Performance-based contracts: The project instituted a system of school support and monitoring through
performance-based contracts, which included pedagogical support to teachers through remediation
training sessions organized by inspectors / pedagogical advisors and inspections and class visits. School
inspectors developed an action plan for the year which was approved by their supervisor; they received
funding – most of which went toward remedial training for teachers and transportation for inspectors and
education advisers – to carry out activities within the action plans.
37. At the PDO-level, one indicator was linked to both project objectives – the number of direct project
beneficiaries. By project closing, this indicator’s target was surpassed by 25 percent. Compared to an endline target of
533,000 direct project beneficiaries, the project had 667,993 direct beneficiaries, 51 percent of whom were female.
Justification of Overall Efficacy Rating
38. The project met or exceeded the targets of four out of seven PDO-level indicators.14 The PDO-level indicators’
targets that were not achieved were those that relied on EMIS data and were indicators linked to the objective of
improved equitable access; targets of all indicators that were linked to the objective of improved quality were met or
exceeded. As mentioned above, the level of achievement for objective 1: Improving Equitable Access is rated Modest and
the level of achievement for objective 2: Improving quality of classroom instruction at the basic level in deprived districts
is rated Substantial. In the first few years of the project, progress was made on each of the PDO-level indicators that were
linked to improving access, but in the last two years, the positive trends which had been observed up until that point did
not continue and were reversed. This downward trend was observed both in the deprived districts and at the national
level. The project’s inability to meet the target of one of the PDO-level indicators – GER in targeted districts at the lower
secondary level – can be explained by contextual factors through more rigorous enforcement of secondary school
admission by the new administration in 2016, resulting in a decline in examination results in the terminal primary exam
(Certificat d’Etudes Primaires). While the other rates measured by PDO-level indicators – PCR and GPIR in targeted districts
– declined both at the national level an in deprived districts, this downward trend cannot be fully explained. The ICR team
worked closely with the Government to understand the factors driving this observed trend. Although no conclusive
determination was made, one potential explanation is that the raw data itself was problematic for the last two years of
13 It was deemed not reliable as it asked Heads whether or not they had completed these actions, without triangulating with community members. 14 Note that several indictors in the Results Framework were disaggregated by gender and had different targets for ‘total’ and ‘female’; these are not considered separate indicators. None of the access level indicators that were disaggregated were met. In addition, at the PDO level, the ‘system for learning assessment at the primary level’ is considered a separate indicator from the ‘utility of the learning assessment system’.

The World Bank Benin Global Partnership for Education Program (P129600)
Page 23 of 95
the project as substantial drops were observed in enrollment figures. Although the ICR team worked closely with the task
team and the Government to determine the factors driving these declines – none could be conclusively identified.
39. At the intermediate level, eight out of 11 IRIs’ targets were exceeded, while three indicators’ targets remained
unmet.15 The majority of IRIs’ targets were exceeded, often substantially so. Of particular note, compared to endline
targets: (i) 31 percent more officers of the ministries and deprived districts were trained; (ii) 25 percent more classrooms
were built at the primary level; (iii) 24 percent more grammar books were distributed; (iv) 22 percent more girls received
school packages; and (v) 18 percent more students received at least one meal per day. One of the indicators’ targets that
remained unmet relied on EMIS data for reporting and was moved from a PDO-level indicator to an IRI.16 In addition, the
EMIS set-up at the regional directorate level remained unmet due to delays to avoid a conflict of interest in bidding; the
final unmet indicator measuring the communication of student results to the community was not measured due to the
unreliability of the survey.
40. At endline, the targets of 57 percent of PDO-level indicators were achieved (and all those that remained unmet
relied on EMIS), while at the intermediate level, 73 percent of indicators’ targets were exceeded. While the efficacy rating
for the first objective is rated Modest, and for the second objective is rated Substantial, on balance, the ICR team rated
overall efficacy as Modest for the following reasons: (i) in terms of equitable access, at the PDO-level, none of the targets
were achieved and the deprived districts performed worse than the national level; (ii) although the project was extended
for 22 months in total, targets of PDO-level indicators linked to access remained unmet; and (iii) the targets of three
indicators at the IRI level were unmet. Notwithstanding these shortcomings, substantial achievements were observed
under the project, particularly with regards to its overall outputs as well as the outcomes achieved related to the project’s
second objective.
C. EFFICIENCY17
Assessment of Efficiency and Rating
41. By the end of the project, 99 percent of the project budget was expended.18. Disbursement trends reflected
implementation realities increasing rapidly in the latter half of 2015 due to project restructuring, and then rapidly
declining in the first half of 2016 due to changes in administration. Substantial cost savings were made due to exchange
rate fluctuations, enabling 16 percent more funding – in FCFA – to be made available to the project. When looking at the
budget by component, the project exceeded the reallocation in the second restructuring for Component 1 with a budget
execution rate of 123 percent, while these rates for Components 2 and 3 were 93.5 percent and 83.7 percent, respectively.
The cost overruns for Component 1 can be explained by the Government’s decision to invest more in teacher training
after poor PASEC 2014 and teacher evaluation results, while underspending in Component 2 is justified by substantial
cost savings owing to the Government’s decision to waive taxes on construction. As for Component 3, due to delays in
the set-up of EMIS, this activity could not be completed as planned and hence funding was reallocated away from this
component.
15 As at the PDO level, indicators that had two targets for ‘total’ and ‘girls’ were counted as one indicator. The only indicator that this affects at the intermediate level is the ‘gap in Gross Primary Intake Rate between the deprived districts and average national level’. 16 This was the ‘gap in Gross Primary Intake Rate between the deprived districts and average national level (total and girls)’. 17 Ideally the efficiency analysis would capture net present values, but project data was not available to conduct this analysis. 18 Note that this figure may diverge from what is reported in Client Connection or other sources given differences in the exchange rate when converting from FCFA to USD.

The World Bank Benin Global Partnership for Education Program (P129600)
Page 24 of 95
42. However, there were substantial delays in the implementation of various project components and misuse of
funds with regard to school feeding resulting in implementation inefficiencies. Financial management, procurement,
technical and administrative delays resulted in project implementation not occurring within the intended timeframe.
Among others, substantial delays were recorded with regard to the timeframe between project approval and
effectiveness, disbursement of school kits, school grants, and school construction. As a result of these delays, the project
was extended twice. The misuse of project funds with regard to school feeding also resulted in delays in its
implementation.
43. Unit costs for construction elements of the project were usually lower than cost comparators, demonstrating
high cost effectiveness – though some of these efficiency gains can be explained by exogenous factors such as exchange
rate gains and the Government’s decision to wiave taxes. Unit costs for new classrooms at the primary and lower
secondary levels were less than 85 percent of the budgeted cost, while for latrines they were between 87 percent and 92
percent of budgeted costs. At the primary level, unit costs were lower than cost comparators, while at the lower secondary
level, unit costs were higher. Unit costs for school kits were US$8, while the per child unit cost for school feeding was
below the average of low-income countries but approximately the same as previous school feeding estimates in Benin.
44. Substantial short-term benefits were recorded in terms of improved quality of education, while the literature
has demonstrated long-term benefits in terms of future earnings, health outcomes, and intergenerational effects. The
project recorded improvements in teaching practices through surpassing targets in terms of the percentage of teachers
rated satisfactory and the percentage of teachers meeting standards, while also substantially building capacity of teachers
at both the primary and lower secondary levels. In addition, when the same ‘deprived district’ criteria were reapplied to
Benin, nine of the 25 original project districts moved out of deprived status at the primary level, while 16 of the original
23 project districts moved out of deprived status at the lower secondary level. The project may also have long-term
impacts in terms of future earnings, health outcomes (reduced fertility and child mortality), and intergenerational
benefits. However, while project activities translated into substantial achievements for the majority of indicators’ targets
at the intermediate level, this was not reflected at the PDO-level for indicators linked to access. Eight of the 11
intermediate result indicators exceeded targets – often substantially by over 20 percent – but at the PDO level, access-
related indicators’ targets remained unmet.
45. Sustainability of many of the results achived under the project will depend on continued investment, some of
which will be provided by the pooled financing and the new GPE-financed project. The institutionalization of targeting
interventions in ‘deprived districts’ is already being continued as evidenced by the recategorization of districts using clear
criteria. Many other investments are expected to continue to benefit future cohorts of students such as teacher training
and provision of teaching and learning materials. However, other interventions will require continued investment,
especially for school feeding, school kits, and school grants. Some of this is supported by the pooled funding mechanism
and the new US$19.4 million GPE-financed project, which will continue to provide pre- and in-service training to basic
education teachers and provide school packages to girls in the regions of Alibori and Bourgou (regions where 11 out of 20
districts have PCRs below 50 percent) as well as the extension of EMIS to the secondary sub-sector and the regional level
and capacity building of Government personnel to operate this revamped EMIS. In addition, the Government has already
paid to participate in PASEC 2019, and the new GPE-financed project will also finance a national assessment in 2022.

The World Bank Benin Global Partnership for Education Program (P129600)
Page 25 of 95
46. In sum, the project was highly efficient in exceeding the majority of results at the intermediate level at a lower
than expected cost. Part of this can be explained by exchange rate gains and the Government’s decision to waive taxes
on construction, which in effect provided additional resources to fund project activities. The project was also relatively
more efficient than its budget for construction activities, and short- and long-term benefits were recorded in terms of
improved quality. Project disbursement was relatively smooth, and the institutionalization of the ‘deprived districts’
categorization, as well as the continued financing of some of the project interventions through the pooled fund
mechanism and the new GPE-financed project will ensure continued sustainability. However, despite these achievements,
the project recorded substantial delays resulting in two extensions, and misuse of funds with regard to school feeding
interventions; this meant the project was unable to be rolled out within the intended timeframe. In addition, the project
was unable to translate access achievements at the intermediate level to outcomes – despite a 22-month extension in
timeframe – and none of the PDO-level targets linked to access were achieved. In light of the above – as summarized
above and detailed in Annex 4 – the efficiency of the project is rated Modest.
D. JUSTIFICATION OF OVERALL OUTCOME RATING
47. The project was highly relevant at appraisal and continues to remain so today. In a context of expanded access,
poor retention and poor quality, the project provided necessary inputs to address these challenges. In addition, the
project was well-aligned with country priorities and the CPF FY13-17. At project closure, the PDO continued to remain
highly relevant to key priorities embedded within Benin’s Education Sector Plan 2018-2030 and the CPF FY19-23,
particularly with regards to developing human capital through improving access and educational outcomes in an equitable
manner.
48. The project is rated Modest in terms of its efficacy, having met 4 out of 7 PDO-level indicators’ targets, and 8
out of 11 IRIs’ targets. While progress was made at both the intermediate and outcome levels in terms of quality, and all
the IRIs’ targets linked to access were exceeded, this could not be translated into meeting endline targets for access at
the PDO-level despite a 22-month timeline extension. At the intermediate level, eight indicators exceeded their targets –
often substantially – with, among others, 31 percent more officers trained, 25 percent more classrooms built at the
primary level, 10 percent more classrooms built at the lower secondary level, 18 percent more students receiving at least
one meal per day, 24 percent more grammar books distributed, and 22 percent more girls receiving school kits. The
project substantially met its objective of improving the quality of classroom instruction, with 59.4 percent of teachers
rated satisfactory (compared to a target of 55 percent). However, in terms of access at the PDO-level, targets for the GER
at the lower secondary level, PCR, and GPIR remained unmet and performed worse than the national level.
49. Despite some of the efficiency gains summarized above and detailed in Annex 4, efficiency of implementation
is rated Modest. The project recorded unit costs for construction that were lower than planned, as well as cost savings
that resulted in many of the targets at the intermediate level being exceeded. In addition, many of the project
interventions – including the EMIS set-up, teacher training, and school feeding – are expected to be continued by the
pooled funding mechanism and the new GPE-financed project. Furthermore, the Government intends to continue
participating in regional and national assessments having already committed to PASEC 2019, and the ‘deprived district’
classification has now become entrenched ensuring interventions are targeted. However, the project recorded substantial
delays and misuse of funds with regard to school feeding resulting in inefficiencies.
The World Bank Benin Global Partnership for Education Program (P129600)
Page 26 of 95
50. In light of the ratings for Relevance of Objectives (High), Efficacy (Modest), and Efficiency (Modest), the overall
outcome rating for the project is Moderately Unsatisfactory.
E. OTHER OUTCOMES AND IMPACTS (IF ANY)
Gender
51. The project disaggregated several indicators by gender as part of the Results Framework: number of direct project
beneficiaries, GER in lower secondary schools, PCR, GPIR, gap in GPIR between deprived districts and the average national
level, and the number of girls in grades 1 and 2 receiving school packages. Overall, 51 percent of the 667,993 project
beneficiaries under the project were female. Under Component 2, a specific intervention to increase the enrolment of
girls in primary school was rolled out through which primary school packages were provided for girls in grades 1 and 2 in
the deprived districts under the project, which aimed at increasing access and retention for girls by lowering the costs for
families. In addition, 323,455 girls in grades 1 and 2 received school kits which included school supplies (notebooks, other
didactic materials excluding textbooks and a school backpack) and school uniforms.
Institutional Strengthening
52. The project emphasized capacity-building in several forms. In-service teacher training at the primary level was
funded by the project, as well as pre- and in-service teacher training at the lower secondary level, enabling 63.3 percent
of the teachers at this level to have graduated and, therefore, be qualified to teach at the secondary level. In addition to
training teachers, at the lower secondary level, the project also financed training of 387 educational advisers, 73
inspectors, 1,320 management teams of lower secondary schools (Directors, Censors and Superintendents). Furthermore,
the project financed capacity building of 460 officers within the Ministry and deprived districts in a range of areas including
administration, leadership, team management, procurement, project planning, personnel management, monitoring and
evaluation and budgeting. The project also provided a one-year long training in statistical disciplines to 15 Ministry staff.
In addition to capacity building, the project also financed the first phase of a revamped EMIS that will be further developed
in the new GPE-financed project, and also strengthened the capacity of the Ministry to administer a national learning
assessment.
Mobilizing Private Sector Financing
N/A
Poverty Reduction and Shared Prosperity
53. While specific data are not available to assess the impact of the project on poverty reduction, it can be ascertained
that interventions to increase access to education had a positive impact on those that were enrolled. The most recent
returns to education estimates from 2015 indicate that an additional year of schooling increases wages by 11 percent. In
addition, relative to those who have never gone to school, completion of primary education increases wages by 94 percent
and secondary education by 127 percent. Moreover, given that nine of the 25 deprived districts at the primary level and
16 of the 25 districts at the lower secondary level moved out of educationally ‘deprived’ status, this may reflect
corresponding impacts on poverty reduction. The project also financed 15,940 kits that were distributed to flooded
districts on the request of the Government, thereby providing some degree of a safety net from this external shock.
The World Bank Benin Global Partnership for Education Program (P129600)
Page 27 of 95
Other Unintended Outcomes and Impacts
54. The ‘deprived district’ criteria developed under the project was further mainstreamed by the Government by
continuing to use transparent criteria to target interventions to those districts that are most in need. The Government
recategorized districts using the criteria in 2015 for its Education Sector Plan.
III. KEY FACTORS THAT AFFECTED IMPLEMENTATION AND OUTCOME
A. KEY FACTORS DURING PREPARATION
55. The project had clearly stated objectives with logical links to project components and activities and responded
to sector priorities. The project was well aligned with the CPF FY13-17 and the PDDSE, and responded to the key setor
challenges including overcrowding, poor retention and poor education quality. In addition, the project’s design was
structured logically among three complementary components with investment in infrastructure and goods combined with
capacity-building. The results chain linking project inputs to outputs and outcomes was coherent, and this was well
reflected in the Theory of Change and the Results Framework.
56. The project also used existing structures that were familiar to all stakeholders. The project built upon existing
successes by continuing many of the efforts conceived under the EFA-FTI project which was largely successful in
meeting/exceeding most of its PDO-level indicators’ targets. Successful operations that were expanded upon from the
EFA-FTI project included: (i) strengthening district inspectorates, school management and information systems in order to
increase accountability to achieve results; (ii) providing direct support to schools for the acquisition of learning materials;
and (iii) supporting community-run school canteens. The project also used delegated contract management agencies that
had a track record of success – AGETIP and AGETUR – to ensure successful management of construction activities. In
addition, the project continued the use of a pooled funding mechanism that was instituted as part of the EFA-FTI project.
57. Financial management (FM) arrangements using national systems. In its institutional arrangements, the project
was designed to follow the Government’s existing public FM systems for budgeting, accounting, disbursement and flow
of funds. These arrangements were sound, based on an FM assessment—carried out in accordance with the World Bank
Financial Management Practices Manual—which determined that FM arrangements were adequate to provide accurate
and timely information on the status of the project as required by the Bank. The assessment rated fiduciary risk as
moderate, following the implementation of risk mitigation measures identified during preparation. By building on existing
structures, this design promoted greater Government ownership over the project, and helped ensure the sustainability
of the FM arrangements.
58. Readiness for implementation. As previously noted, project implementation began after a nine-month delay as
compared to the expected timing reducing its initial, pre-restructuring implementation period to two years and three
months instead of three years. There were two main reasons for this delay: (i) a lengthy project preparation period taking
into account Bank and GPE approval procedures; and (ii) a delay in completing the recruitment of UATS staff, a pre-
condition to the project’s negotiations (due to recruitment processes that had to be re-launched). Combined with the

The World Bank Benin Global Partnership for Education Program (P129600)
Page 28 of 95
delays in construction activities and in the establishment of the EMIS, the delay in readiness for implementation affected
the project’s implementation schedule as a whole.
B. KEY FACTORS DURING IMPLEMENTATION
59. Government turnover about two years into project implementation reshuffled project implementation
responsibilities and had a mixed effect with some interventions that were slowed and others that were more efficient.
In April 2016, following the conclusion of the term of President Yayi and peaceful elections, a new president, Patrice Talon,
took office. The restructuring of the education ministries followed policy changes in the sector. This restructuring implied
the reorganizing, renaming, eliminating and/or consolidating of certain ministry directorates, and in some cases, resulted
in the reshuffling of the lead directorates responsible for some of the project’s activities. For instance, the lead
implementing entity for the in-service teacher training component was re-assigned from the primary education
directorate (Direction de l’Education Primaire – DEP) of the MEMP to the National Institute for Training and Research in
Education (Institut National pour la Formation et la Recherche en Education – INFRE); and the Girls’ Schooling Directorate
(Direction de la Scolarisation des Filles), responsible for the sub-component on the packages to promote girls’ schooling,
was eliminated, and the department of the primary education ministry responsible for integrative education (Service de
l’Education Intégrée) became responsible for this sub-component. In addition, the statistical divisions of the regional
education directorates were eliminated, rendering data collection more difficult. The turnover in staff at multiple levels
meant that new staff had to gain an understanding of the project as well as its institutional arrangements and procedures,
which in some cases required sensitization and training. The MEMP’s planning department, for example, noted that the
Ministry’s procurement assistants and accountants, post-Government turnover, were not fully familiar with the project’s
procurement procedures, which contributed to implementation delays.
60. The reshuffling in some cases led to the revitalization of certain project activities as new, energized staff took
over the reins for implementation of sub-components. In particular, following the reshuffling, the newly created National
Institute for the Engineering of Training and Capacity Building of Trainers (Institut National d’Ingénierie de Formation et
de Renforcement des Capacités des Formateurs – INIFRCF) was responsible for implementation of the pre-service teacher
training. In the span of a year and a half, it conducted a survey to identify training content needs, developed, tested and
validated new teacher training modules which were provided to trained teachers, and successfully provided the pre-
service training to teachers. The turnover, therefore, had a mixed effect on the project, furthering the achievement of
some of its objectives while slowing the achievement of others.
61. Cost savings resulting from exchange rate gains and waiving of taxes on construction allowed for the
implementation of additional activities, allowing the project to exceed many targets of indicators in the Results
Framework, often substantially. During appraisal, US$1 = FCFA 500, but by the time of the first restructuring, exchange
rate gains were realized whereby US$1 = FCFA 580. In addition, the Government’s decision to waive taxes on construction
allowed for savings to be incurred in the amount of FCFA 941 million. The cost savings over the life of the project allowed
for the scaling up of selected existing project activities, and the introduction of new activities aiding in the achievement
of the PDO:
• First, under the component contributing to the improvement of the quality of basic education classroom
instruction, the cost savings allowed for additional pre- and in-service training sessions to be financed as follows:

The World Bank Benin Global Partnership for Education Program (P129600)
Page 29 of 95
training of 1,320 management teams of lower secondary schools in how to better evaluate student learning and
manage classroom time to maximize instruction; in-service training to strengthen the capacity of 10,700 primary
teachers in academic/content knowledge (which exceeded the baseline of 9,000 teachers during project appraisal
due to the inclusion of private school teachers); and pre-service training to 1,744 newly recruited secondary
teachers. In addition, the distribution of two grammar books to all teachers in the deprived districts, as planned
under the September 2015 restructuring, combined with training of teachers on French language tools (such as
grammar and conjugation), served to improve teaching conditions, enable teachers to be more effective in the
classroom, and increased the relevance and likelihood of effective use of the grammar books. All in all, these
additions are likely to have contributed to improvements in the quality of instruction.
• Second, under the component contributing to improved access and equity, cost savings financed construction of
an additional 83 classrooms (63 primary school classrooms, and 20 lower secondary classrooms). School feeding
activities also reached more students – about 58,000 more students benefited from one meal per day for an
additional school year (2017/18) compared to the endline targets, contributing to the project’s achievements in
access and retention. Finally, the distribution of an additional 71,500 school kits during the final year of the project
(while this sub-component was initially intended to end after the third year of the project) also contributed to the
schooling of more girls than originally planned. Overall, the increase in project scope from the cost savings allowed
the operation to reach more beneficiaries and maximize its impact.
62. The project was highly effective in coordinating all 16 active donors within the sector. The pooled funding
mechanism – which consolidated funds from two other donors, ensured that donor interests were aligned. In addition,
the project built upon the strong donor coordination from the previous EFA-FTI project, and there was strong donor
involvement during implementation support missions to discuss issues in basic education. Finally, during each of the
monthly donor meetings, discussions took place on the project’s progress. In particular, after each supervision mission,
the main findings – including challenges and achievements – were discussed during the meetings.
63. Due to some FM implementation inefficiencies and a high work load of Government’s FM staff, disbursement
and payment arrangements were a source of implementation delays. The delays were due to the General Directorate
of Treasury and Public Accounts, which had to await the monthly reconciliation of accounts and availability of funds prior
to undertaking payments. In addition, during the ICR mission, project FM staff noted that a factor in the delays was a
hesitation by risk-averse FM staff to making payments directly from the designated account at the Central Bank, even for
eligible activities, for fear of making a mistake while using the procedure with fewer administrative controls. The result
was that, in the case of contracts which called for making tranches of payments, in which the payment of one tranche
was necessary to advance to subsequent phases of implementation—such as the school construction managed by the
delegated contract management agencies—activities were at times delayed, due to an interruption in the flow of funds
needed to advance with the services. This contributed to delays in activities such as school construction, and to adverse
impacts such as service providers (i.e., school feeding mamans) feeling compelled to finance activities with their own
funds in order not to interrupt service provision.
64. In addition, procurement, administrative and technical delays also contributed to implementation bottlenecks.
Implementation delays affectedseveral key project sub-components over the project’s lifetime, for a range of reasons
from administrative and procurement bottlenecks, to re-launching of procurement procedures to ensuring the integrity
of the processes, to delays in producing terms of reference or finalizing sound technical aspects of activities. General

The World Bank Benin Global Partnership for Education Program (P129600)
Page 30 of 95
procurement-related delays were caused or exacerbated by: challenges in Government directorates producing or revising
technical documents (such as Terms of Reference of activities) in a timely manner; delays in obtaining Government staff
participation in bidding evaluations and related processes; and delays in the signature of contracts by ministry
counterparts, including notably the Ministry of Finance. These delays affected various aspects of the project including the
procurement process, provision of school kits, school construction, school canteen services, establishment of the EMIS,
performance-based contracts with DEOs, school grants, and teacher training.
65. Although there were cases of fraudulent activity as described earlier with regard to school feeding, these were
handled thoroughly and efficiently. In 2014/15 and again in 2016/17, insufficient monitoring and internal controls
resulted in fraudulent activity with regard to the school canteens. In the first instance, the Government reimbursed the
Bank the equivalent of US$51,800 and the fiduciary risk in ISR 5 was upgraded to High as a result. In the second case, the
Government reimbursed the Bank US$87,080. In both instances, the Government dismissed the involved authorities from
their post. These instances were reported to INT who closed the claims after determining they had been appropriately
handled.
66. Despite these challenges, the project team was responsive to the situation on the ground. Due to the delay in
project effectiveness which reduced the project’s implementation time period to two years and three months, the team
was proactive in extending the closing date of the project early on. During this restructuring in September 2015, project
indicators and targets were also revised to better reflect implementation realities. In addition, the project used results
from teacher evaluations and PASEC 2014 to adjust the teacher training strategy and ensure it was more targeted to
teachers’ strengths and weaknesses. When the quality of teacher training materials developed under the project was
deemed not good enough, the project used existing, high quality training modules. Furthermore, when school kits were
deemed to be of low quality and had procurement delays, the Government and supervision team conducted an audit of
the kits and changed the procurement procedures and oversight, ensuring that an open bidding process was used and
schools were divided into geographical zones. This ensured appropriate competition and quality control. The project also
ensured that a conflict of interest in the bidding process of the software to be procured for the implementation of the
first phase of EMIS was rectified by appropriately reporting it to INT. During the ICR mission, education stakeholders
commented that they believed that the project team was responsive in addressing challenges on the ground.
67. As a result, the project met or exceeded 12 of the 18 indicators’ targets in the Results Framework. The project
exceeded its endline targets for a number of indicators at the intermediate level including number of classrooms
constructed, number of students receiving one meal, number of students receiving school kits, and number of teachers
trained. However, the project was unable to meet PDO-level indicators’ targets linked to access.

The World Bank Benin Global Partnership for Education Program (P129600)
Page 31 of 95
IV. BANK PERFORMANCE, COMPLIANCE ISSUES, AND RISK TO DEVELOPMENT OUTCOME
A. QUALITY OF MONITORING AND EVALUATION (M&E)
M&E Design
68. At appraisal, the M&E system included a Results Framework with seven PDO indicators and ten IRIs; after the
project was restructured in September 201519, there were seven PDO indicators and 11 IRIs. Throughout the project, at
the PDO level, one indicator – number of direct project beneficiaries – was mapped to both objectives of the PDO. Three
PDO-level indicators were mapped to objective 1 of the PDO (improving access and equity) and the remaining three PDO-
level indicators were mapped to objective 2 of the PDO (improving quality of classroom instruction at the basic education
level). Both before and after the September 2015 restructuring, all IRIs were logically mapped to the three components
of the project (before restructuring: three under Component 1, four under Component 2, and three under Component 3;
after restructuring: three under Component 1, five under Component 2, and three under Component 3). Progress under
every sub-component could also be tracked by at least one indicator.20
69. Overall, the Results Framework was adequate for assessing achievement of project objectives and components
and the implementation team was proactive in updating the values for these indicators. At the PDO-level, indicators
tracked project performance against both objectives of the PDO statement, and a strong theory of change linked the
intermediate-level results to the outcomes. Additionally, aside from sub-component 1.2 (school grants) which was only
relevant in one year of the project, IRIs mapped well to sub-components of the project. When a new activity was
introduced (i.e., grammar books), the implementation team was proactive in updating the Results Framework so that this
activity could be tracked and also in removing indicators for activities that were no longer relevant to the project (i.e.
school grants). The implementation team closely tracked trends in indicators and revised targets in the Results Framework
based on these to ensure that targets remained ambitious, yet realistic.
70. The M&E design could have more fully accounted for the Ministry’s timelines in reporting on education data,
that affected updating values achieved on various indicators by the project closing date. The original M&E design
included three indicators that were reported on using EMIS data21; this increased to four indicators22 after the
restructuring in September 2015. EMIS data for one academic year is released several months after the beginning of the
next academic year; although the project funded efforts to ensure that the lag would be reduced by providing support in
data collection and processing, due to the Government’s decision to remove the statistical division at the regional level in
2016, this remained a challenge toward the end of the project. The project’s original expected closing date was June 30,
19 Note that despite the data sheet noting that there were changes to the Results Framework during the second restructuring in May 2017, no such changes were made. 20 For a full mapping of indicators to the PDO, see Annex 1.B; for a full list of indicators that were moved around during the September 2015 restructuring, see Annex 1.C. 21 These indicators are: (i) Gap in Gross Primary Intake Rate between the deprived districts and average national level (total and girls); (ii) Primary education completion rate in targeted districts (total and girls); and (iii) Gross enrolment rate in lower secondary education in target districts (total and girls). 22 All three of the previously mentioned indicators (with the Gap in GPIR having moved to an IRI-level indicator) and the inclusion of a fourth indicator: Gross Primary Intake Rate in the deprived districts (total and girls).
The World Bank Benin Global Partnership for Education Program (P129600)
Page 32 of 95
2016, and the last restructuring extended the closing date to April 30, 2018; in both cases, relying on EMIS to track progress
in the last year of the project would have been problematic given the Ministry’s timeline for data processing. Although
the financing of a revamped EMIS under the project was intended to mitigate this, due to delays in this process, reporting
on endline indicators was a challenge. This challenge persisted in the writing of this ICR as a three-month extension to the
ICR deadline was requested to ensure that the values of these indicators could be updated with 2017/18 data so that the
Results Framework reflected the current situation in Benin. Notwithstanding the challenges described above, it is
important to highlight that the project team chose to rely on EMIS in an effort to build a sustainable information system
and to avoid the creation of ad hoc data collection efforts.
M&E Implementation
71. M&E implementation relied on existing data collection instruments and arrangements established by the
implementing ministries at the various levels of the implementation chain, fostering strong ownership over project
M&E by the Government. The project’s Results Framework at appraisal clearly outlined the data sources and entities
responsible for the collection of data in relation to each project indicator. The project operations manual also described
the general arrangements for data collection and analysis.
72. In addition to Government ownership, a strong collaborative system for data analysis and reporting
contributed to moderately smooth M&E implementation. Data collection arrangements relied on reporting by schools
and school districts, NGO service providers, follow-up committees at the commune and regional levels, central-level
ministry directorates, and UATS. In addition to the data collected from these actors, the M&E system collected data from
annual work plans of the various project implementation units; periodic implementation reports from executing agencies
/ service providers and performance reports from the ministries; and the databases of the education ministries. In terms
of process, data collection, analysis and reporting followed a clearly defined procedure requiring inter-department
collaboration: the MEMP’s planning unit, using a database to track the project, populated indicator tables for the program
based on the data collected, and transmitted them to the UATS for compilation; the UATS subsequently would send the
latest project data, on a weekly basis, to a committee within the Office of the President of the Republic. The President’s
office conducted follow-up on the rates of execution of project indicators and implementation. The MEMP’s planning
department conducted its own reviews of progress against project indicators each semester, and one annual review of
the project Results Framework. In addition, the project trained 15 Ministry staff and 16 consultants in data processing and
cleaning, contributing to better data reporting.
73. However, some shortcomings and challenges during project implementation affected timely reporting on
project indicators and contributed to an M&E rating of Moderately Unsatisfactory for the last year and a half of the
project’s life. First, the elimination of the statistical division housed in the regional education offices following the
Government turnover, combined with a shortage of resources for data cleaning and verification during the final year of
project implementation, contributed to delays in data processing and reporting on key indicators. This also impacted data
trends, with EMIS data during the last two years of the project showing substantial declines in enrolment – both for the
deprived districts and at the national level – compared to previous years. The annual statistical yearbooks were also
generally produced with some delay – these data were usually made available about six months after the end of the school
year in question. Although the EMIS that was to be funded under the project was intended to mitigate some of these
impacts, project delays prevented this from being fully set up. As a result, when the project closed in April 2018, indicators

The World Bank Benin Global Partnership for Education Program (P129600)
Page 33 of 95
that relied on EMIS data could not be updated with 2017/18 data and it was agreed that the ICR timeline should be
extended by three months to ensure project reporting at endline with the most recent data. Second, the indicator tracking
the percentage of schools communicating students’ results and budgets to the community could not be fully measured
over the project life because the survey intended to measure it was not reliable23.
74. Although the results of the 2013 population census were released in 2016, the project was not able to
retroactively update indicators and targets that relied on census data with these figures, despite attempts to do so; as
a result, 2002 population census projections were used to report on indicators throughout the duration of the project.
Four indicators that relied on population projections were affected by this in particular: the PCR, the GER at the lower
secondary level, the GPIR, and the gap in GPIR between the deprived districts and the average national level. When the
census results were released in 2016, representatives of the Government requested the National Institute of Statistics
and Economic Analysis (INSAE) to undertake a retropolation of the 2002 census data and financing for this activity was
approved. However, UNESCO recommended that the 2002 population census be used to update project indicators. Hence,
the four aforementioned indicators continued to use projections from the 2002 population census to report on project
indicators and population projections from the 2002 census were used throughout the project reporting. Notwithstanding
this challenge, the ICR team was able to work closely with the project team and Government to systematically collect the
necessary information to report on all the PDO- and intermediate-level indicators included in the Results Framework.
M&E Utilization
75. Data collected via the project indicators were used to inform decision-making and to strengthen the impact of
project interventions. For example:
• Data obtained from internal and external classroom observations, the PASEC 2014, as well as from additional
teacher assessments over the course of the project, was used to identify teacher strengths, weaknesses, and
to categorize teachers according to years of experience and subject matter specializations. Subsequently, the
responsible ministries tailored the teacher training content and refined the training’s targeting (in terms of
what types of teachers would receive which themes and intensity / duration of in-service training). Anecdotal
stakeholder feedback during the ICR mission highlighted the perceived high value and improved effectiveness
of this tailored training by teachers and teacher trainers.
• M&E activities identified low teacher content as an impediment to achieving project quality outcomes and
there was, therefore, a need to reinforce what teachers had learned during the training. As a result, to
strengthen trainings under the project, the distribution of two grammar books to all primary teachers in
targeted districts was added as an activity under the first restructuring in September 2015.
• Recommendations from annual internal classroom observation evaluations (using the OSEP tool) resulted in a
workshop of inspectors and trainers of teacher training institutions to review and reorient the training in
teacher training institutes.
76. Beyond the project’s Results Framework, information on implementation including progress, sources of delays,
and quality of implementation was taken into account to provide feedback to implementation teams and maximize the
23 It was deemed not reliable as it asked school heads whether or not they had completed these actions, without triangulating this information with community members.
The World Bank Benin Global Partnership for Education Program (P129600)
Page 34 of 95
impact of the project’s interventions. For example, early in project implementation, supervision revealed concerns with
the quality of certain aspects of DCM-supervised construction works; this information was communicated to the DCMs,
who took additional measures to address the quality issues identified. In addition, due to initial delays in implementation
of school kits, an audit was conducted in a representative sample of schools to ensure that the kits conformed to standards
and complied with procurement procedures; based on this, the Government changed supervision and procurement
structures to improve their quality and make their distribution more effective.
Justification of Overall Rating of Quality of M&E
77. The overall quality of the M&E system is rated Modest. The design of the M&E system appropriately tracked
objectives outlined in the PDO and was strongly linked to the various components of the project. During the restructuring
in September 2015, when project components were updated, these were reflected in the Results Framework. In addition,
although the project could not complete the EMIS set-up at the regional level, M&E implementation relied on strong
ownership by the Government and existing data collection instruments and arrangements. Data from the project was
used to inform decision-making particularly with regard to teacher training interventions. Despite these strengths of the
M&E system, more careful consideration could have been given to the timeline for processing national level education
data collected by Government. In addition, implementation challenges in the form of delays in firm recruitment and lack
of reliability of surveys resulted in delays to updating the Results Framework and inability to report on one indicator in
the Framework. Finally, the project was unable to use the most updated population figures to report on four indicators.
B. ENVIRONMENTAL, SOCIAL, AND FIDUCIARY COMPLIANCE
78. The project used a pooled funding mechanism that built on the previous EFA-FTI arrangement. GPE funds
flowed into a pooled designated account previously established at the Benin Central Bank for development partner (DP)
contributions to the implementation of the PDDSE; payments at the central level for significant amounts were made
directly from this account, while other payments were pre-financed by the Public Treasury with a monthly reconciliation
and reimbursement on the program’s designated account. This approach was chosen based on the successful
implementation of such arrangements under the previous project’s pooled fund arrangements and to ensure that the
project was working within existing systems thereby ensuring alignment. The UATS—which was required to hire an FM
analyst and accountants—supported the smooth implementation of these arrangements, as did the full time secondment
of an agent of the Financial and Material Resources department of the MEMP.
79. Financial management under the project is rated Moderately Satisfactory overall. Although the fiduciary risk
rating during project preparation was rated Substantial, the project overall had ratings of mostly Moderately Satisfactory
with two instances of Satisfactory ratings and one instance of a Moderately Unsatisfactory rating. There were seven audit
reports undertaken during the project, all of unqualified opinion revealing no significant irregularities. Reporting
standards and protocols were adequate and interim unaudited financial reports were submitted in a timely manner and
in accordance with established Bank procedures. A final audit was not conducted as this will be done once the pooled
financing facility is closed in 2019. There were two cases of fraudulent activity of funds with regards to the school feeding
activity. In 2014/15, the Head of the Inspectorate and the District Tax Officer of Malanville (one of the deprived districts
under the project) in collaboration with school directors were discovered to have engaged in fraudulent practices with
regard to school feeding interventions. The Government was forced to reimburse the Bank the equivalent of US$51,800
and the fiduciary risk was upgraded to High in ISR 5 as a result. However, these were promptly addressed by reporting

The World Bank Benin Global Partnership for Education Program (P129600)
Page 35 of 95
the issue in a timely manner, dismissing the involved authorities from their posts, reimbursing the amount that was
misused, and conducting an audit on a representative sample of schools in the target districts to oversee the use of funds
transferred for all activities. The task team reported the issue to INT who closed the claim as all relevant steps had been
taken to handle the issue. In 2016/17, another case of fraudulent activity was identified due to insufficient monitoring
and internal controls whereby US$87,080 were misused for school canteens. The Government fully reimbursed the
project for this amount and this issue was again reported to INT with similar results, deeming that it was handled
appropriately and there was no need to further pursue the matter.
80. Procurement under the project is rated Moderately Satisfactory overall. During project preparation, the overall
risk assessment was rated Substantial; however, during project implementation, at the very beginning of the project,
there were two consecutive ratings of Satisfactory, and thereafter the rating changed to Moderately Satisfactory
throughout. Two DCMs were used, based on their past experience in administering classroom construction – AGETUR and
AGETIP. There were delays for several activities (school feeding, school kits, construction, processing of contracts, etc.)
which led to bottlenecks in project implementation, and there was one instance of conflict of interest with regard to
procurement procedures for the EMIS which was quickly rectified. In addition, the procurement specialist was changed
three times during the life of the project. However, in general, the Procurement Unit followed the Bank’s procurement
procedures and no major issues were identified during the implementation support missions.
81. Safeguards compliance is rated Moderately Satisfactory overall. At the project preparation stage, the Social and
Environmental risk was rated Low. The project triggered two safeguard policies: OP/BP 4.01 Environmental Assessment
and OP/BP 4.12 Involuntary Resettlement and was assigned the social and environmental category B due to classroom
construction. Given that classrooms were to be constructed in existing schools, the environmental and social impacts
were minimal and site-specific. Assessment of safeguards measures took place in June 2016, and an insufficiency was
identified with regard to rigorous implementation of the social provisions set out and recommended by the Resettlement
Policy Framework. This was addressed by carrying out targeted measures to collect necessary documentation in each of
the construction sites and to ensure that there was better compliance.
C. BANK PERFORMANCE
Quality at Entry
82. The World Bank supported the preparation of a project that was relevant to national development strategies
and took into consideration the key sector challenges, working across donors and following GPE guidelines. The
objectives of the project aligned with Government priorities as outlined in the 2013-15 PDDSE and endorsed by the LEG
and GPE. The project also continued some of the interventions from the EFA-FTI project which closed in 2012, thereby
ensuring sustainability of existing project interventions. The Bank team consulted with local DPs in the sector in
accordance with GPE guidelines to ensure complementarity of interventions. The M&E system reflected the objectives
outlined in the PDO, and the Results Framework could logically be mapped to the objectives and components of the
project.
83. However, the Bank team could have further strengthened the design of the M&E system under the project. As
previously mentioned, more careful consideration of data collection timelines would have enabled timely updating of the
Results Framework.

The World Bank Benin Global Partnership for Education Program (P129600)
Page 36 of 95
84. Based on this evidence, the World Bank’s performance in ensuring quality at entry is rated Moderately
Satisfactory.
Quality of Supervision
85. The project benefitted from appropriate supervision which enabled effective implementation. First, the team
possessed the appropriate skills to support project implementation, including education specialists, procurement
specialists, FM specialists, environmental and social safeguards specialists, and economists. In addition, having in-country
core team members, a Project Implementation Unit and a TTL who oversaw the project throughout its duration – including
the change of administration which resulted in substantial changes in responsibility for project administration – ensured
continuity and consistent supervision. Challenges with the project were reported in a timely manner in various project
documents including aide memoires, and ISRs, and fraudulent activity with regards to school feeding was dealt with
promptly and thoroughly. Missions were carried out regularly and the main challenges were recorded in the appropriate
documents. The Bank team was also proactive in restructuring the project and in changing indicators and targets to better
track project progress and reflect implementation realities. For instance, recognizing that school grants were only
administered in the 2014/15 academic year, this was removed from the Results Framework during the first restructuring
of the project in September 2015. The strong involvement of other DPs during project design and implementation also
ensured harmonization of project interventions within Benin’s education sector.
86. However, there were challenges with reporting on several indicators and often substantial delays in
implementation. One of the indicators in the Results Framework on the percentage of schools in deprived districts
communicating student results and budgets to the community could not be updated due to unreliability of the survey
that was carried out. In addition, indicators that relied on EMIS data took months to update, and the timeline of this ICR
had to be extended to report on these indicators at the endline. The project also suffered from implementation delays in
various areas including a delay between project preparation and effectiveness (with project implementation beginning
nine months after intended), and various other technical aspects and could have benefitted from even closer supervision.
Finally, detailed project documentation was not readily available and the beneficiary survey was completed six months
after project closing.
87. Based on this evidence, the World Bank’s performance in ensuring quality of supervision is rated Moderately
Satisfactory.
Justification of Overall Rating of Bank Performance
88. Based on the ratings for Quality at Entry (Moderately Satisfactory) and Supervision (Moderately Satisfactory) and
the overall Outcome rating (Moderately Unsatisfactory), overall Bank performance is rated Moderately Satisfactory.
D. RISK TO DEVELOPMENT OUTCOME
89. Some project interventions can be expected to benefit future cohorts of students, while others will require
continual funding; however, the inclusion of some of these elements in the Education Sector Plan 2018-2030 and the
new GPE-financed project makes future financing more likely. The construction of classrooms under the project is
expected to reduce overcrowding for future cohorts of students. In addition, capacity that was built during the project

The World Bank Benin Global Partnership for Education Program (P129600)
Page 37 of 95
through various trainings (in-service and pre-service teacher training, management, procurement, leadership, etc.) is
likely to benefit students beyond the scope of the project as well as maintain and further strengthen administration and
accountability of the education system. Some of the materials purchased under the school grants will also remain in the
schools and benefit future students. Interventions such as school feeding, student kits and school grants will require
continual funding in order to be continued. The Government’s commitment to supporting these interventions is clear
from the Education Sector Plan 2018-2030 whereby infrastructure, teacher training, supporting school canteens and
providing school kits in 42 newly categorized deprived districts is highlighted. In addition, the new GPE-financed project
in the amount of US$19.4 million recognized the successes of this project and chose to build on them; as such, the new
project will continue many of the interventions under this project, specifically providing pre- and in-service training to
basic education teachers, providing school packages to girls in the regions of Alibori and Bourgou (regions where there
are 11 districts with Primary Completion Rates below 50 percent out of a total of 20 districts), and strengthening the M&E
system.
90. The Government is also committed to continuing the national learning assessments and has already paid its
contribution for the 2019 PASEC; the new GPE-financed project also includes a national assessment in 2022. Given that
this was a GPE-financed project, the PDO was endorsed by DPs, and harmonization across donors and feedback from the
LEG was embedded within the project’s design and implementation. Close coordination improves the likelihood that
project-financed activities will be supported – both financially and technically – by other donors in the sector, which
greatly increases the likelihood that interventions and gains will be sustained. The pooled funding mechanism ensured
coordination across donors in financing the project. Other donors – including, among others, United Nations Children’s
Fund (UNICEF), GIZ (Deutsche Gesellschaft für Internationale Zusammenarbeit), Plan International – are also supporting
this by financing school construction, equity and inclusion, literacy, and technical and vocational education and training
in excess of US$100 million.
91. Future interventions and Government systems will likely benefit from the revamped EMIS set up under the
project and the learning assessment that was carried out under the project. The project set up an EMIS at the Ministry
of Basic Education that included software for personnel management and the management of statistical data, and officers
were trained to be able to use this new system. Although delays prevented this system from being established at the
regional level as intended under the project, the set-up is expected to allow for more efficient data collection in the future.
The pooled fund and the new GPE-financed project will support the full use of EMIS and extend EMIS to cover the
secondary level, as well as build the capacity of Government in the revamped EMIS. In addition, the nationally
representative learning assessment carried out under the project contributes to the knowledge base on learning
outcomes by providing the most up-to-date figures. This has been used to diagnose the learning crisis in Benin and allow
for more efficient targeting. The Government has already paid its contribution to participate in PASEC 2019, and the new
GPE-financed project has also earmarked funding to enable Benin to participate in a national assessment in 2022.
92. The project institutionalized the concept of deprived districts, a categorization to which the Government
remains committed. The 2015 Education Sector Analysis included a recategorization of districts using the original
selection criteria, finding that many of the districts covered under the project had moved out of ‘deprived’ status.
Recognizing this categorization as a way to address equity concerns, the Education Sector Plan 2018-2030 used this to
target districts to receive additional resources and instituted a policy to continue some of the project interventions in the

The World Bank Benin Global Partnership for Education Program (P129600)
Page 38 of 95
42 newly classified deprived districts (18 of which are districts that were part of the project). The Government also plans
to conduct research to better understand the root cause of the challenges that these districts are facing.
93. The Government remains committed to the twin PDO objectives of improving access and equity, and the quality
of classroom instruction. The Education Sector Plan 2018-2030 contains several objectives specifically linked to the PDO
of the project including: (i) increasing access and retention of children aged 3 to 15 in basic education; (ii) providing
children aged 3 to 15 with a fair and inclusive basic education; and (iii) providing children aged 3 to 15 with quality basic
education. Under these objectives, the Government includes, as strategies, all the interventions under the project, and
then expands upon this to include additional interventions that demonstrate strong commitment to the PDO. The
Education Sector Plan 2018-2030 also indicates that between 2018 to 2021, the financing gap for current expenditure is
just 4 percent, and for capital expenditure is 52 percent, indicating strong commitment to financing these objectives.24
V. LESSONS AND RECOMMENDATIONS
94. When using national procedures for financial management, consideration should be given to ways of mitigating
delays within the existing national arrangements. The project’s financial management system was integrated within the
pooled fund mechanism. This simplified the project’s institutional arrangements and avoided the creation of parallel
systems, but also resulted in delays due to inefficiencies in the system for project payments, which the set-up of a
Procurement Monitoring Committee was unable to mitigate. During the design phase, teams should consider ways of
further minimizing these delays.
95. An appropriately staffed project implementation unit can ensure continuity especially during changes of
administration. The presidential elections and subsequent transfer of power in early 2016 resulted in restructuring of the
education ministries and reshuffled lead directorates responsible for project activities. New project staff had to quickly
become well-versed in the institutional procedures. While this resulted in implementation delays, the presence of the
project implementation unit was crucial in minimizing the extent of these delays by providing institutional memory and
serving as a key resource for project guidelines and procedures. This reduced transaction costs and ensured continuity of
project implementation.
96. Careful consideration should be paid to the timelines for data collection of indicators; where relying on national
data collection systems may present delays, complementary data collection sources should be identified. Three of the
seven PDO-level indicators relied on EMIS data collection that was often only ready several months after the end of the
academic year; thus, by the time the project closed in April 2018, these endline indicators could not be updated with
2017/18 data. Considering these timelines for data collection and putting in place measures to ensure data could still be
collected at endline – i.e. by using indicators captured in existing national censuses / surveys or funding surveys under the
project – will ensure timely reporting at project closing. In addition, strengthening the data collection system to ensure
more timeline reporting will benefit the overall sector.
97. Building in feedback mechanisms that allow interventions to be adjusted accordingly can ensure greater
impact. For instance, the assessment of teacher competencies and subject specialization that was funded under the
project allowed for adaptation and targeting of teacher training by grouping teachers according to capacity and subject
24 Note that this includes financing for the entire education sector and is not broken down by sub-sector.

The World Bank Benin Global Partnership for Education Program (P129600)
Page 39 of 95
specification. Conducting feedback loops in other areas of project intervention – such as provision of school kits, school
canteens, etc. – could have been useful in further improve their delivery and effectiveness.
98. Procurement procedures should be carefully thought through to foster competition and find a balance between
cost efficiency and quality of service provision. Initially, procurement of school kits under the project was done at the
district level; however, in most districts few firms could provide school kits, resulting in little competition. In response,
the project adapted the procurement process by dividing schools into geographic zones and conducting an open bidding
process, which helped overcome this challenge. This new procurement process will be integrated within the new GPE
project being developed in Benin. Thereby, thinking through procurement processes can ensure efficiency of project
implementation.
.

The World Bank Benin Global Partnership for Education Program (P129600)
Page 40 of 95
ANNEX 1. RESULTS FRAMEWORK AND KEY OUTPUTS
For a more comprehensive presentation of the Results Framework – including all changes introduced throughout the life of the project, see Annex 1.B. G
A. RESULTS INDICATORS A.1 PDO Indicators Objective/Outcome: Improving access and equity with an emphasis on deprived districts
Indicator Name Unit of Measure Baseline Original Target Formally Revised
Target
Actual Achieved at Completion
2- Gross Primary Intake Rate in the deprived districts (Total)
Percentage 107.00 117.00 117.00 104.30
17-Sep-2015 31-May-2017 30-Apr-2018 30-Apr-2018
2' - Gross Primary Intake Rate in the deprived districts (girls)
Percentage 100.50 114.00 114.00 104.40
17-Sep-2015 31-May-2017 30-Apr-2018 30-Apr-2018
Comments (achievements against targets): The associated end-of-project target for this indicator was not met (total and girls). Downward trends for this indicator were also observed at the national level (total and girls). This indicator was added under the restructuring approved on September 17, 2015. Though the target value for this indicator did not change over the life of the project, the date for achievement of the target was modified to coincide with the project's closing date of April 30, 2018.
Indicator Name Unit of Measure Baseline Original Target Formally Revised
Target
Actual Achieved at Completion
3- Primary education Percentage 40.40 50.00 56.50 42.10

The World Bank Benin Global Partnership for Education Program (P129600)
Page 41 of 95
completion rate in targeted districts(total)
21-Mar-2014 30-Jun-2016 30-Apr-2018 30-Apr-2018
3' - Primary education completion rate in targeted districts (Girls)
Percentage 34.30 45.00 52.50 38.70
21-Mar-2014 30-Jun-2016 30-Apr-2018 30-Apr-2018
Comments (achievements against targets): The associated end-of-project target was not met (total and girls). Downward trends for this indicator were also observed at a national level (total and girls).
Indicator Name Unit of Measure Baseline Original Target Formally Revised
Target
Actual Achieved at Completion
4- Direct Project Beneficiaries of which percentage of female
Number 0.00 533000.00 533000.00 667993.00
21-Mar-2014 30-Jun-2016 30-Apr-2018 30-Apr-2018
Comments (achievements against targets): The associated end-of-project target was exceeded by 25%. More than half (51%) of direct project beneficiaries were female. Though the target value for this indicator did not change over the life of the project, the date for achievement of the target was modified to coincide with the project's closing date of April 30, 2018.
Indicator Name Unit of Measure Baseline Original Target Formally Revised
Target
Actual Achieved at Completion
5- Gross enrollment rate in lower secondary education in target districts (total)
Percentage 45.00 52.00 48.50 35.60
21-Mar-2014 30-Jun-2016 30-Apr-2018 30-Apr-2018
5' - Gross enrollment rate in Percentage 23.00 30.00 37.50 29.40
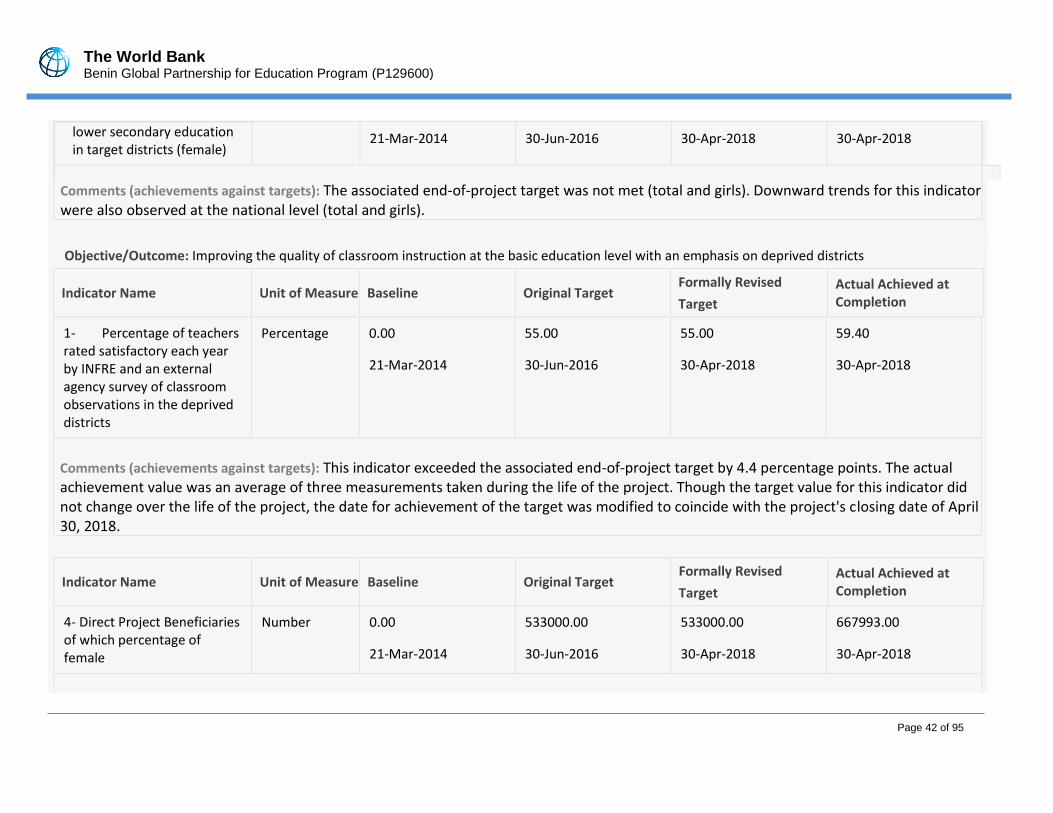
The World Bank Benin Global Partnership for Education Program (P129600)
Page 42 of 95
lower secondary education in target districts (female)
21-Mar-2014 30-Jun-2016 30-Apr-2018 30-Apr-2018
Comments (achievements against targets): The associated end-of-project target was not met (total and girls). Downward trends for this indicator were also observed at the national level (total and girls). Objective/Outcome: Improving the quality of classroom instruction at the basic education level with an emphasis on deprived districts
Indicator Name Unit of Measure Baseline Original Target Formally Revised
Target
Actual Achieved at Completion
1- Percentage of teachers rated satisfactory each year by INFRE and an external agency survey of classroom observations in the deprived districts
Percentage 0.00 55.00 55.00 59.40
21-Mar-2014 30-Jun-2016 30-Apr-2018 30-Apr-2018
Comments (achievements against targets): This indicator exceeded the associated end-of-project target by 4.4 percentage points. The actual achievement value was an average of three measurements taken during the life of the project. Though the target value for this indicator did not change over the life of the project, the date for achievement of the target was modified to coincide with the project's closing date of April 30, 2018.
Indicator Name Unit of Measure Baseline Original Target Formally Revised
Target
Actual Achieved at Completion
4- Direct Project Beneficiaries of which percentage of female
Number 0.00 533000.00 533000.00 667993.00
21-Mar-2014 30-Jun-2016 30-Apr-2018 30-Apr-2018

The World Bank Benin Global Partnership for Education Program (P129600)
Page 43 of 95
Comments (achievements against targets): The associated end-of-project target was exceeded by 25%. More than half (51%) of direct project beneficiaries were female. Though the target value for this indicator did not change over the life of the project, the date for achievement of the target was modified to coincide with the project's closing date of April 30, 2018.
Indicator Name Unit of Measure Baseline Original Target Formally Revised
Target
Actual Achieved at Completion
System for learning assessment at the primary level
Yes/No Y Y Y Y
21-Mar-2014 30-Jun-2016 30-Apr-2018 30-Apr-2018
Utility of the learning assessment system
Number 1.00 3.00 3.00 3.00
21-Mar-2014 30-Jun-2016 30-Apr-2018 30-Apr-2018
Comments (achievements against targets): The associated end-of-project target was achieved. Though the target value for this indicator did not change over the life of the project, the date for achievement of the target was modified to coincide with the project's closing date of April 30, 2018.
A.2 Intermediate Results Indicators
Component: Component 1: Improving the Quality of Basic Education
Indicator Name Unit of Measure Baseline Original Target Formally Revised
Target
Actual Achieved at Completion
Number of G1 and G2 Grammar books distributed to teachers in the deprived districts
Number 0.00 21000.00 21000.00 26000.00
17-Sep-2015 31-May-2017 30-Apr-2018 30-Apr-2018
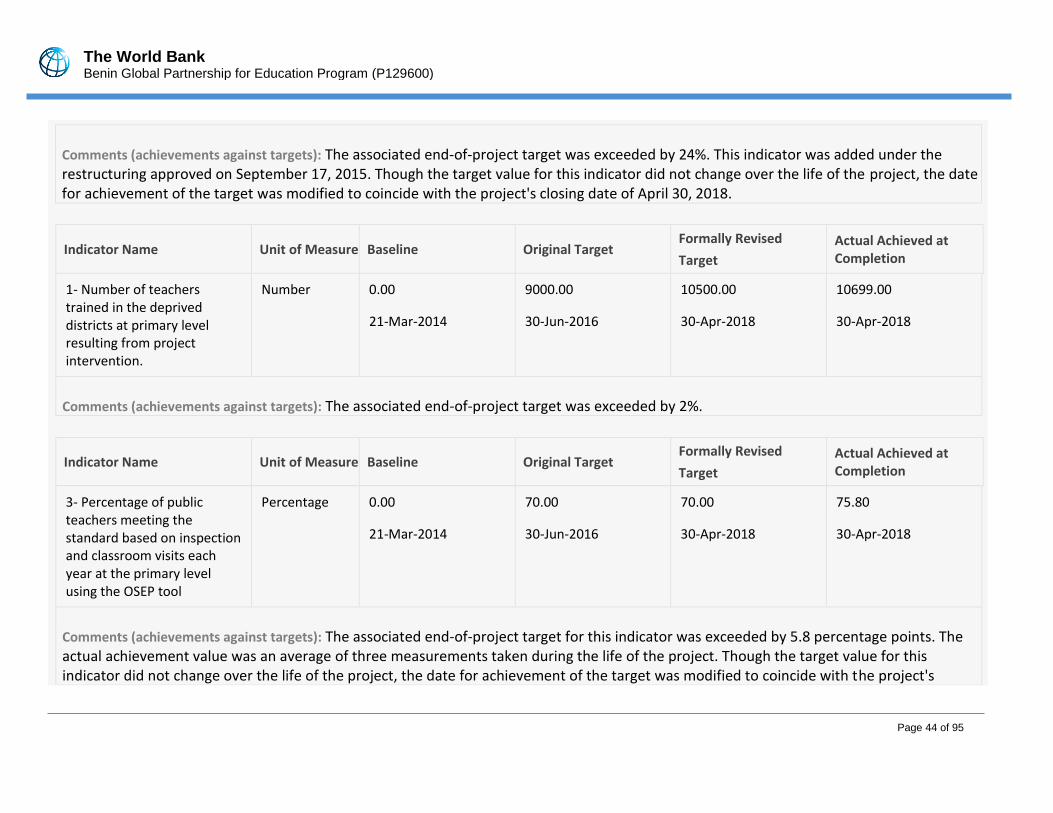
The World Bank Benin Global Partnership for Education Program (P129600)
Page 44 of 95
Comments (achievements against targets): The associated end-of-project target was exceeded by 24%. This indicator was added under the restructuring approved on September 17, 2015. Though the target value for this indicator did not change over the life of the project, the date for achievement of the target was modified to coincide with the project's closing date of April 30, 2018.
Indicator Name Unit of Measure Baseline Original Target Formally Revised
Target
Actual Achieved at Completion
1- Number of teachers trained in the deprived districts at primary level resulting from project intervention.
Number 0.00 9000.00 10500.00 10699.00
21-Mar-2014 30-Jun-2016 30-Apr-2018 30-Apr-2018
Comments (achievements against targets): The associated end-of-project target was exceeded by 2%.
Indicator Name Unit of Measure Baseline Original Target Formally Revised
Target
Actual Achieved at Completion
3- Percentage of public teachers meeting the standard based on inspection and classroom visits each year at the primary level using the OSEP tool
Percentage 0.00 70.00 70.00 75.80
21-Mar-2014 30-Jun-2016 30-Apr-2018 30-Apr-2018
Comments (achievements against targets): The associated end-of-project target for this indicator was exceeded by 5.8 percentage points. The actual achievement value was an average of three measurements taken during the life of the project. Though the target value for this indicator did not change over the life of the project, the date for achievement of the target was modified to coincide with the project's
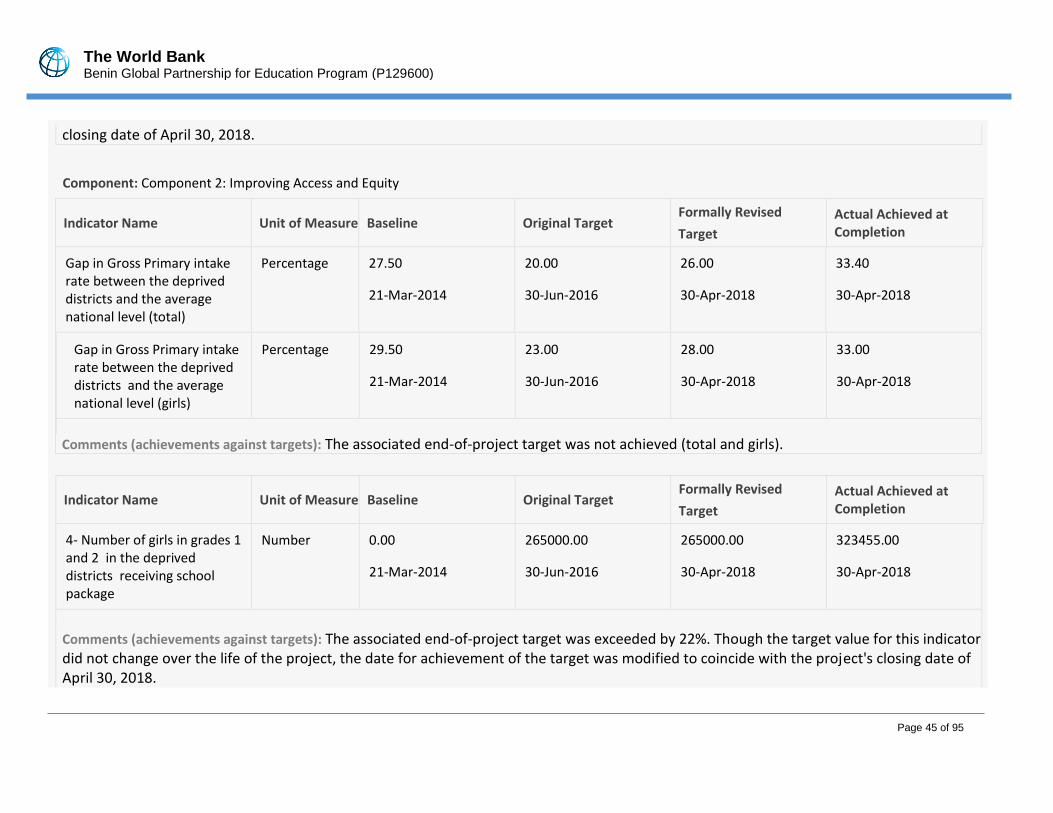
The World Bank Benin Global Partnership for Education Program (P129600)
Page 45 of 95
closing date of April 30, 2018.
Component: Component 2: Improving Access and Equity
Indicator Name Unit of Measure Baseline Original Target Formally Revised
Target
Actual Achieved at Completion
Gap in Gross Primary intake rate between the deprived districts and the average national level (total)
Percentage 27.50 20.00 26.00 33.40
21-Mar-2014 30-Jun-2016 30-Apr-2018 30-Apr-2018
Gap in Gross Primary intake rate between the deprived districts and the average national level (girls)
Percentage 29.50 23.00 28.00 33.00
21-Mar-2014 30-Jun-2016 30-Apr-2018 30-Apr-2018
Comments (achievements against targets): The associated end-of-project target was not achieved (total and girls).
Indicator Name Unit of Measure Baseline Original Target Formally Revised
Target
Actual Achieved at Completion
4- Number of girls in grades 1 and 2 in the deprived districts receiving school package
Number 0.00 265000.00 265000.00 323455.00
21-Mar-2014 30-Jun-2016 30-Apr-2018 30-Apr-2018
Comments (achievements against targets): The associated end-of-project target was exceeded by 22%. Though the target value for this indicator did not change over the life of the project, the date for achievement of the target was modified to coincide with the project's closing date of April 30, 2018.

The World Bank Benin Global Partnership for Education Program (P129600)
Page 46 of 95
Indicator Name Unit of Measure Baseline Original Target Formally Revised
Target
Actual Achieved at Completion
6- Additional classrooms built and or rehabilitated in the deprived districts at the lower secondary education level resulting from project intervention
Number 0.00 192.00 192.00 212.00
21-Mar-2014 30-Jun-2016 30-Apr-2018 30-Apr-2018
Comments (achievements against targets): The associated end-of-project target was exceeded by 10%. Though the target value for this indicator did not change over the life of the project, the date for achievement of the target was modified to coincide with the project's closing date of April 30, 2018.
Indicator Name Unit of Measure Baseline Original Target Formally Revised
Target
Actual Achieved at Completion
7- Primary students receiving at least one meal per day in the deprived districts resulting from project intervention
Number 0.00 128000.00 270000.00 318245.00
21-Mar-2014 30-Jun-2016 30-Apr-2018 30-Apr-2018
Comments (achievements against targets): The associated end-of-project target was exceeded by 18%.
Indicator Name Unit of Measure Baseline Original Target Formally Revised
Target
Actual Achieved at Completion
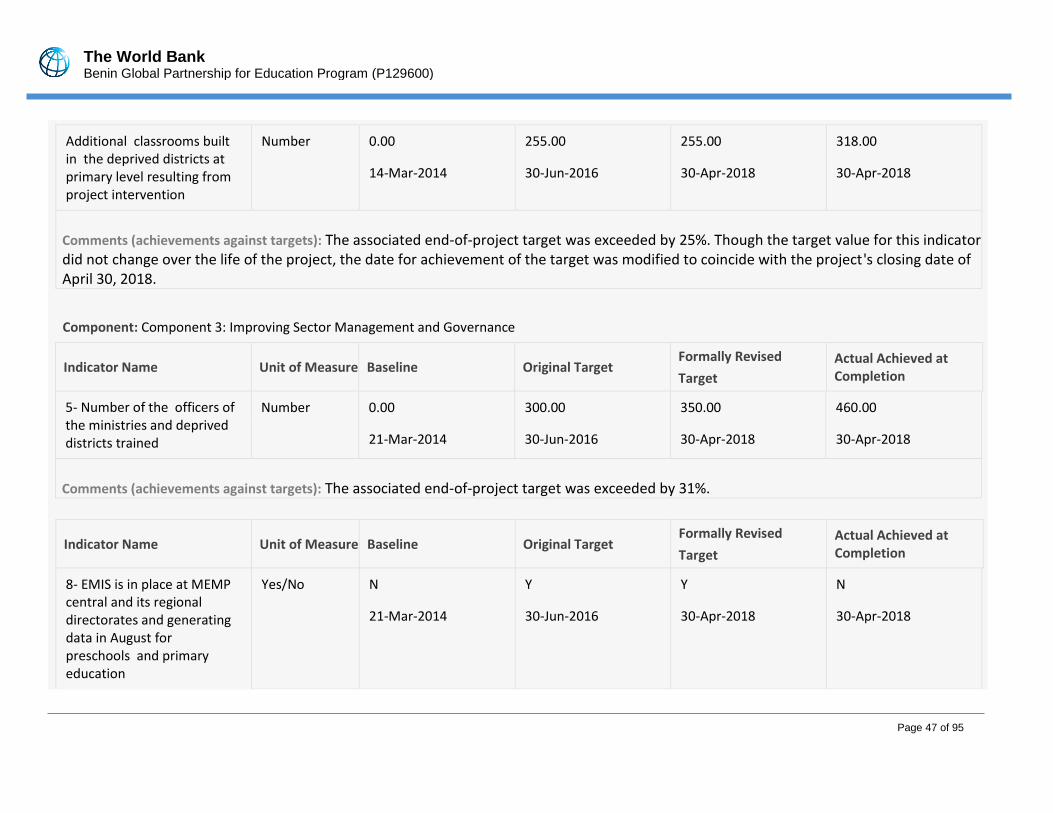
The World Bank Benin Global Partnership for Education Program (P129600)
Page 47 of 95
Additional classrooms built in the deprived districts at primary level resulting from project intervention
Number 0.00 255.00 255.00 318.00
14-Mar-2014 30-Jun-2016 30-Apr-2018 30-Apr-2018
Comments (achievements against targets): The associated end-of-project target was exceeded by 25%. Though the target value for this indicator did not change over the life of the project, the date for achievement of the target was modified to coincide with the project's closing date of April 30, 2018.
Component: Component 3: Improving Sector Management and Governance
Indicator Name Unit of Measure Baseline Original Target Formally Revised
Target
Actual Achieved at Completion
5- Number of the officers of the ministries and deprived districts trained
Number 0.00 300.00 350.00 460.00
21-Mar-2014 30-Jun-2016 30-Apr-2018 30-Apr-2018
Comments (achievements against targets): The associated end-of-project target was exceeded by 31%.
Indicator Name Unit of Measure Baseline Original Target Formally Revised
Target
Actual Achieved at Completion
8- EMIS is in place at MEMP central and its regional directorates and generating data in August for preschools and primary education
Yes/No N Y Y N
21-Mar-2014 30-Jun-2016 30-Apr-2018 30-Apr-2018

The World Bank Benin Global Partnership for Education Program (P129600)
Page 48 of 95
Comments (achievements against targets): While the EMIS was not established at the regional level due to delays, it was set up at the Ministry of Basic Education and includes software for personnel management and the management of statistical data and officers were trained in this system. Though the target value for this indicator did not change over the life of the project, the date for achievement of the target was modified to coincide with the project's closing date of April 30, 2018.
Indicator Name Unit of Measure Baseline Original Target Formally Revised
Target
Actual Achieved at Completion
10- Percentage of school in deprived districts communication students results and budgets to the community through quarterly community briefing meetings
Percentage 0.00 70.00 70.00 0.00
21-Mar-2014 30-Jun-2016 30-Apr-2018 30-Apr-2018
Comments (achievements against targets): A survey to determine the level of achievement was not carried out and, therefore, level of achievement cannot be determined. Though the target value for this indicator did not change over the life of the project, the date for achievement of the target was modified to coincide with the project's closing date of April 30, 2018.

The World Bank Benin Global Partnership for Education Program (P129600)
Page 49 of 95
A. KEY OUTPUTS BY COMPONENT
PDO Level
Objective 1: Improving access and equity with an emphasis on deprived districts
Objective 2: Improving the quality of classroom instruction at the basic education level with an emphasis on deprived districts
Outcome Indicators
One PDO indicator corresponded to both PDO objectives. Note that if targets were revised, this was done during the first restructuring of the project in September 2015:
• PDO indicator #4: Direct project beneficiaries of which percentage female. Target: 533,000. Achieved: 667,993 (51% female)

The World Bank Benin Global Partnership for Education Program (P129600)
Page 50 of 95
These PDO indicators correspond to objective 1. Note that if targets were revised, this was done during the first restructuring of the project in September 2015: Indicators that were maintained throughout the project
• PDO indicator #3: Primary education completion rate in targeted districts (total and girls). Original target: Total – 50%; Girls – 45%. Revised target: Total – 56.50%; Girls – 52.50%. Achieved: Total – 42.10%; Girls – 38.70%
• PDO indicator #5: Gross enrollment rate in lower secondary education in target districts (total and girls). Original target: Total – 52%; Girls – 30%. Revised target: Total – 48.5%; Girls – 37.5%. Achieved: Total – 35.6%; Girls – 29.4%
Indicators that were added during first restructuring (September 2015):
• PDO indicator #2: Gross Primary Intake Rate in the deprived districts (total and girls). Target: Total – 117%; Girls – 114%. Achieved: Total – 104.3%; Girls – 104.4%
Indicators that were removed during first restructuring (September 2015):
• PDO indicator #2 – this was moved from a PDO-indicator to an IRI under Component 2 during the first restructuring: Gap in Gross Primary Intake Rate between the deprived districts and the average national level (total and girls). Original target: Total – 20%; Girls – 23%. Revised target: Total – 26%; Girls – 28%. Achieved: Total – 33.4%; Girls – 33%
These PDO indicators correspond to objective 2:
• PDO indicator #1: Percentage of teachers rated satisfactory each year by INFRE and an external agency survey of classroom observations in the deprived districts. Target: 55.00. Achieved: 59.40
• PDO indicator #6: System for learning assessment at the primary level. Target: Yes. Achieved: Yes
• PDO indicator #7: Utility of the learning assessment system. Target: 3. Achieved: 3
Key outcomes: The project achieved four out of seven of its PDO indicators. The three indicators that were not achieved were all linked to access and all relied on EMIS data. These were: primary education completion rate, gross enrollment rate in lower secondary education, and gross primary intake rate. The inability to achieve the gross enrollment rate in lower secondary education can be explained by the more stringent entry requirements for the secondary level (in terms of passing the terminal primary level exam) that was instituted by the Government in 2016/17. The other two indicators – PCR and GPIR – cannot fully be explained, but substantial declines in enrolment were noted both nationally and in the deprived districts during the final two years of the project. It is important to highlight that declines in the PCR and GPIR were also reflected at the national level, where, despite improvements from 2012/13 to 2015/16, these rates began declining in 2016/17: at the national level, the PCR decreased from 76.8 percent in 2012/13 to 67.5 percent in 2017/18, while the GPIR at the national level decreased
The World Bank Benin Global Partnership for Education Program (P129600)
Page 51 of 95
from 142.7 percent in 2012/13 to 137.7 percent in 2017/18. All indicators linked to quality were achieved and / or exceeded. Direct project beneficiaries were also exceeded by 25 percent.
Component 1: Improving the quality of basic education
Description of Sub-Components Sub-component 1.1: Improving teaching practices. This sub-component included both in-service and pre-service trainings. The in-service training aspect was
directed toward primary school teachers and pedagogical support staff with an objective to prepare, deliver and test the impact of introduced improvements
in primary education teachers’ pedagogical skills and use of time in the classroom. All the modules developed were intended to focus on increasing time of
instruction (classroom management) and maximizing learning for different types of students. Training sessions were also organized for those selected teachers
recognized as having pedagogical shortcomings as determined through classroom visits. About 9,000 teachers yearly from the 1,769 schools in the deprived
districts were expected to benefit from this training. The pre-service training was directed toward lower secondary education teachers as a continuation of the
previous EFA-FTI project which began in 2011 with about 12,000 contract teachers. Out of the 12,000 teachers, the project intended to provide a two-year
training to 3,400 contract teachers with only a baccalaureate degree. Their training occurred during vacation periods in three teacher training colleges which
had already prepared a specific curriculum for this type of training.
Sub-component 1.2: School grants. This sub-component provided grants to schools for the acquisition of learning materials, not including textbooks, to support
primary schools in the deprived districts. Each school was intended to receive US$ 1,000 to purchase teaching materials in the school year 2014-2015. School
directors and parents’ associations were responsible for identifying needs, and the pedagogic advisor for certifying the needs identified. This request was then
validated at the district, regional and central levels.
Intermediate Results Indicator Indicators that were maintained throughout the project
• Number of teachers trained in the deprived districts at the primary level resulting from the project intervention
• Percentage of public teachers meeting the standard based on inspection and classroom visits each year at the primary level using the OSEP tool
Indicators that were added during first restructuring (September 2015):
• Number of G1 and G2 grammar books distributed to teachers in the deprived districts
Indicators that were removed during first restructuring (September 2015):
• Percentage of primary schools in the deprived districts having purchased the required learning material at least one month after the beginning of the school year 2013/14

The World Bank Benin Global Partnership for Education Program (P129600)
Page 52 of 95
Key outputs: Under sub-component 1.1, 26,000 G1 and G2 grammar books were distributed; 10,699 teachers at the primary level were trained in the deprived districts; and 75.8 percent of public teachers met the standard based on the inspection and classroom visits at the primary level. In addition, pre-service training was provided for 9,735 teachers at the lower secondary level and 1,744 newly recruited teachers at this level. By the end of the project, 63.3 percent of teachers who were trained at the lower secondary level had graduated and were qualified to teach secondary school. To support these teachers, the project also financed 387 educational advisers, 73 inspectors and 1,320 management teams of lower secondary schools. While the distribution of grammar books were not included in the Results Framework at appraisal, exchange rate gains and savings made from the Government’s decision to remove taxes associated with construction allowed for this activity to be included during the restructuring in September 2015, which was deemed as a necessary complement to teacher trainings. In addition, the indicator linked to the number of teachers trained was revised upward during this same restructuring in September 2015 to include private school teachers in the training. All indicators under this component exceeded targets in the Results Framework by 24 percent for the grammar books, 2 percent for teacher training (despite the upward revision), and 8 percent (or 5.83 percentage points) for the percent of public teachers meeting the standard. This indicates judicious use of project funds. Under sub-component 1.2, note that the indicator on the percentage of primary schools in the deprived districts purchasing required learning materials at least one month after the beginning of the school year 2013/14 was deleted because this only referred to one school year and did not seem relevant to the entirety of the project and procurement of materials was delayed. However, by the end of the 2014/15 academic year, despite delays, all primary schools in the 25 deprived districts – 2,008 schools in total – had used the grants to purchase appropriate materials.
Component 2: Improving access and equity
Description of Sub-Components Sub-component 2.1: Construction of classrooms in the most deprived districts. This sub-component was designed to contribute to the reduction of the shortage
of classrooms in the targeted districts through the construction and equipment of classrooms in selected schools based on the needs of each district and the
gap between student-classrooms ratios. The construction works were to be delegated by the Ministry of Pre- and Primary School (MEMP) and Ministry of
Secondary Education, Technical and Vocational Education, and Youth Integration (MESFTPRIJ, later changed to MESTFP) to two Delegated Contract Managers
(DCMs) used in the previous EFA-FTI project. At appraisal, the project intended to build the following numbers of classrooms:
• For primary schools: (i) 255 classrooms or 85 standard modules of three classrooms (which include an office and a storage room); 6,375 student desks;
255 teacher desks; and (ii) 170 blocks of 4 latrines
• For lower secondary schools: (i) 192 classrooms or 48 standard modules of four classrooms, 4,800 student desks, 192 teacher desks; and (ii) 96 blocks
of 4 latrines.
Sub-component 2.2: Improving retention and equity. This sub-component supported school feeding in deprived districts and actions aimed at promoting girls’
enrollment in the targeted districts. At appraisal, the project aimed to support, in the last two years, 396 existing school canteens run by the communities in
the deprived districts by offering at least one meal per day to an average of 128,000 students annually. The project built upon the previous EFA-FTI program

The World Bank Benin Global Partnership for Education Program (P129600)
Page 53 of 95
that used the informal system of mamans (mothers) to prepare and serve lunchtime meals, by recruiting NGOs to oversee the whole program, most notably by
organizing and monitoring the process and providing support to all actors, in particular for the monitoring and reporting. For promoting girls’ access in the most
deprived districts, the project intended to finance primary school packages for all girls in grades 1 and 2 in deprived districts, amounting to approximately
91,000 students per year. The underlying motivation for this sub-component was to encourage girls’ schooling in districts where they were under-represented;
the packages, which were to be distributed by the school headmaster each year for the three-year period, were thereby expected to encourage girls to attend
and stay in school and to lower schooling costs for their families. Each package was to consist of school supplies (including notebooks, other didactic materials
but excluding textbooks, and a school backpack) and school uniforms.
Intermediate Results Indicator Indicators that were maintained throughout the project
• Number of girls in grades 1 and 2 in the deprived districts receiving school package
• Additional classrooms built and or rehabilitated in the deprived districts at the lower secondary education level resulting from project intervention
• Primary students receiving at least one meal per day in the deprived districts resulting from project intervention
• Additional classrooms built in the deprived districts at primary level resulting from project intervention Indicators that were added during the first restructuring (September 2015):
• Gap in Gross Primary Intake Rate in the deprived districts (total and girls) – indicator moved from PDO level to IRI level during first restructuring

The World Bank Benin Global Partnership for Education Program (P129600)
Page 54 of 95
Key outputs: Under sub-component 2.1, 212 additional classrooms were built at the lower secondary level in the deprived districts; and 318 classrooms were built at the primary level in the deprived districts. In addition, 212 and 101 blocs of latrines were built at the primary and lower secondary levels respectively, as well as 318 and 212 teacher desks at these levels and 7,950 and 5,300 student desks. Owing to the Government’s decision to remove taxes for construction elements of the project and the exchange rate gains, cost savings were made in construction. Despite this, the project exceeded the targets in the Results Framework by 10 percent at the lower secondary level and 25 percent at the primary level. Under sub-component 2.2, 323,455 girls in grades 1 and 2 in the deprived districts received school packages and 318,245 primary pupils received at least one meal a day in the deprived districts. In addition, 15,940 kits were distributed to flooded districts on the request of the Government. During restructuring in September 2015, targets for the number of girls receiving school packages and the number of primary pupils receiving at least one meal a day were revised upwards and even these higher targets were exceeded by 22 percent and 18 percent respectively, indicating efficient use of project funds. School packages included notebooks, didactic materials excluding textbooks, school backpacks, and school uniforms. Despite these achievements, the gap in gross primary intake rate between the deprived districts and average national total remained unmet. This indicator was moved from the PDO level to the IRI level during the first project restructuring in September 2015.
Component 3: Improving sector management and governance
Description of Sub-Components Sub-component 3.1: First phase of the educational management information system (EMIS). The objective of this activity was to improve, in the short term, the availability of reliable data and, in the medium term, the capabilities for strategic planning and improved responsiveness by planners, managers, and decision-makers. Under the project, the following three areas were to be covered (yet limited to activities at MEMP central and regional education directorates and selected district education offices): (i) installing a network data center in the central ministry of primary education, the six regional primary education directorates and six selected district education offices; (ii) developing specific programs (school statistics, computerized staff management, and consolidated results of school exams); and (iii) building capacities for the management and use of EMIS.Sub-component 3.2: Strengthening of school inspection and improvement of pedagogical management through the use of student learning assessments. This sub-component was to be implemented nationwide and consisted of: (i) strengthening the impact of the pedagogical support to teachers resulting from classroom visits of school inspectors through performance-based contract which included training sessions in remedial education for students as well as supervision and inspection; and (ii) developing the learning assessment capability. Funds were to support financial resources to District Education Offices to strengthen pedagogical support to teachers through a performance-based contract aiming at increasing the number of inspections, classroom visits and remediation training sessions. Funds were also to be used toward developing learning assessment capability by providing pedagogical support to the MEMP’s evaluation unit responsible for student learning assessment through: (i) the provision of technical expertise; (ii) the preparation of thematic studies and surveys; (iii) technical workshops; and (iv) experience-sharing with other countries.Sub-component 3.3: Capacity building, project management and studies. The objective of this sub-component was to support capacity building for the staff of Benin’s ministries of education to increase the social accountability mechanisms by: carrying out training for key staff, strengthening capacity in the field of data collection and analysis, and improving their monitoring and evaluation functions. In terms of capacity building, to improve overall system management, the project was to finance capacity development activities, in conjunction with project activities, that included: (i) the provision of technical

The World Bank Benin Global Partnership for Education Program (P129600)
Page 55 of 95
expertise; (ii) in-service training for higher-level and technical staff at the central ministries and the decentralized offices in key areas; (iii) training sessions for school headmasters and heads of parents’ association in the targeted school districts in order to promote school-based participatory management and develop their skills in sharing student results as well as the financial resources devoted to schools; (iv) recruiting of 16 short term consultants (for 3 months) to support data collection and analysis; and (v) training of 16 ministry staff (3 years local training for 6 staff and 1 year training for 10 staff) in statistical disciplines in order to ensure the sustainability of the system at the end of the project. In terms of project management and studies, the sub-component would provide resources to support: (i) overall project management to the central level project coordination teams (The Project Implemenation Unit, Unité d’ Appui Technique et de Suivi – the UATS – and the Permanent Technical Secretariat of the PDDSE) to conduct audits; (ii) preparation of thematic studies and surveys to assess project interventions; (iii) a number of studies and strategy formulation in areas such as strategy of technical and vocational education, literacy, introduction of bilingual education in the first two grades of primary education; and (iv) data collection.
Intermediate Results Indicator
• Number of the officers of the ministries and deprived districts trained
• EMIS is in place at MEMP central and its regional directorates and generating data in August for preschools and primary education
• Percentage of schools in deprived districts communicating student results and budgets to the community through quarterly community briefing meetings
Key outputs: Under sub-component 3.1, the project established a data center within the Ministry of Basic Education with software for personnel management and management of statistical data. However, there were delays in this and in the recruitment of the service provider who was in charge of establishing hardware, and this activity was only closed out during the final weeks of the project. Although training was provided, the Ministry has only recently begun to use the new system. EMIS was not installed at the regional level and so the binary indicator (Yes / No) linked to this sub-component was not achieved. Under sub-component 3.2, performance-based contracts were instituted between the central level and district level inspectors whereby inspectors would develop an action plan for the year which was then approved and implemented and funds were then reimbursed for the activities based on their completion. Not all district directorates participated in this activity. A nationally representative learning assessment – PASEC 2014 – was also carried out that evaluated student learning in Mathematics and French at the second and fifth grade levels and compared results with nine other Francophone SSA countries. The results from this report indicated that student scores at beginning of primary school are the second last in language and mathematics among ten countries evaluated; however, at the end of primary school, Benin ranks third in language scores and fourth in mathematics scores. This suggests that the Beninese education system is better able to fill the gaps in knowledge than other countries evaluated. Within Benin, performance in urban areas is substantially better than performance in rural areas. However, although schools in deprived districts were encouraged to communicate student results and budgets to the community through quarterly community briefing meetings, the survey that was intended to measure this indicator was not reliable as it only asked school Heads about whether or not they had done this without further confirmation from other stakeholders. Hence, this indicator was not measured and not met. Under sub-component 3.3, the project funded various capacity building activities including training of 460 officers of the ministries and deprived districts in a broad range of areas (leadership, procurement, M&E, administration, financial management, etc.). This exceeded the target by 31 percent. In addition, a study on the reasons for dropout in primary school was also funded. The project also trained 15 Ministry staff and 16 consultants in data processing and cleaning, contributing to better data reporting.

The World Bank Benin Global Partnership for Education Program (P129600)
Page 56 of 95
B. DETAILED RESULTS FRAMEWORK AND MAIN CHANGES
Indicator
Original (March 2014) Restructuring (September 2015) Restructuring (May 2017)
Project Closing
(April 2018) Notes
Level Baseline Endline Target
Achieved Level Endline Target
Changes Achieved Achieved
Percentage of teachers rated satisfactory each year by INFRE and an external agency survey of classroom observations in the deprived districts PDO N/A 55.00 N/A PDO 55.00 None 71.30 59.4025
Linked to PDO objective of improving quality of classroom education at the basic education level
Gross Primary Intake Rate in the deprived districts Total Girls
114.00 110.70
PDO PDO
117.00 114.00
Indicator added; baseline in 2014 - total: 107.00 and girls: 100.50
118.30 115.20
104.30 104.40
Linked to the PDO objective of improving access and equity
Gap in Gross Primary Intake Rate between the deprived districts and the average national level Total Girls
PDO PDO
27.50 29.50
20.00 23.00
30.80 33.00
IRI IRI
26.00 28.00
Indicator moved to IRI (from PDO) and endline targets revised
29.80 29.60
33.40 33.00
Linked to the PDO objective of improving access and equity and Component 2 of improving access and equity
25 Note that this figure is an average of three evaluations.

The World Bank Benin Global Partnership for Education Program (P129600)
Page 57 of 95
Indicator
Original (March 2014) Restructuring (September 2015) Restructuring (May 2017)
Project Closing
(April 2018) Notes
Level Baseline Endline Target
Achieved Level Endline Target
Changes Achieved Achieved
Primary education completion rate in targeted districts Total Girls PDO
PDO 40.40 34.30
50.00 45.00
53.10 49.10
PDO PDO
56.50 52.50 Endline targets revised
54.40 50.90
42.10 38.70
Linked to the PDO objective of improving access and equity
Direct project beneficiaries of which percentage female
PDO 0 533,000 422,400 PDO 533,000 None
592,687 (44.8% female)
667,993 (51% female)
Linked to both PDO objectives: improving access and equity and improving quality of classroom education at the basic education level
Gross enrollment rate in lower secondary education in target districts Total Girls
PDO PDO
45.00 23.00
52.00 30.00
44.60 34.40
PDO PDO
48.50 37.50 Endline targets revised
44.80 41.20
35.60 29.40
Linked to the PDO objective of improving access and equity
System for learning assessment at the primary level
PDO No Yes No PDO Yes None No Yes
Linked to PDO objective of improving quality of classroom education at the basic education level

The World Bank Benin Global Partnership for Education Program (P129600)
Page 58 of 95
Indicator
Original (March 2014) Restructuring (September 2015) Restructuring (May 2017)
Project Closing
(April 2018) Notes
Level Baseline Endline Target
Achieved Level Endline Target
Changes Achieved Achieved
Utility of the learning assessment system
PDO 1 3 1 PDO 3 None 1 3
Linked to PDO objective of improving quality of classroom education at the basic education level
Number of G1 and G2 grammar books distributed to teachers in the deprived districts 0 IRI
21,000 Indicator added 0
26,000
Linked to Component 1 of improving the quality of basic education
Number of teachers trained in the deprived districts at the primary level resulting from the project intervention IRI 0
9,000 9,500 IRI
10,500 Endline targets revised 10,699 10,699
Linked to Component 1 of improving the quality of basic education
Percentage of primary schools in the deprived districts having purchased the required learning material at least one month after the beginning of the school year 2013/14 IRI 0.00 80.00 Indicator deleted
Linked to Component 1 of improving the quality of basic education
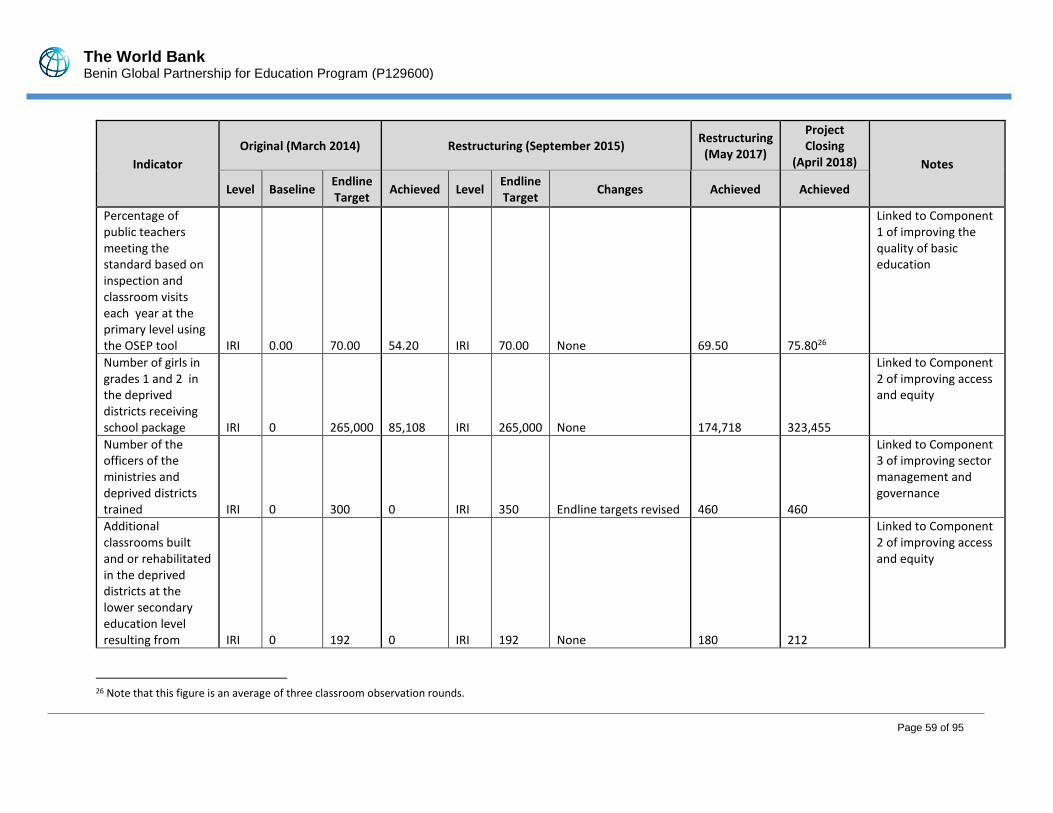
The World Bank Benin Global Partnership for Education Program (P129600)
Page 59 of 95
Indicator
Original (March 2014) Restructuring (September 2015) Restructuring (May 2017)
Project Closing
(April 2018) Notes
Level Baseline Endline Target
Achieved Level Endline Target
Changes Achieved Achieved
Percentage of public teachers meeting the standard based on inspection and classroom visits each year at the primary level using the OSEP tool IRI 0.00 70.00 54.20 IRI 70.00 None 69.50 75.8026
Linked to Component 1 of improving the quality of basic education
Number of girls in grades 1 and 2 in the deprived districts receiving school package IRI 0
265,000 85,108 IRI
265,000 None 174,718 323,455
Linked to Component 2 of improving access and equity
Number of the officers of the ministries and deprived districts trained IRI 0 300 0 IRI 350 Endline targets revised 460 460
Linked to Component 3 of improving sector management and governance
Additional classrooms built and or rehabilitated in the deprived districts at the lower secondary education level resulting from IRI 0 192 0 IRI 192 None 180 212
Linked to Component 2 of improving access and equity
26 Note that this figure is an average of three classroom observation rounds.

The World Bank Benin Global Partnership for Education Program (P129600)
Page 60 of 95
Indicator
Original (March 2014) Restructuring (September 2015) Restructuring (May 2017)
Project Closing
(April 2018) Notes
Level Baseline Endline Target
Achieved Level Endline Target
Changes Achieved Achieved
project intervention
Primary students receiving at least one meal per day in the deprived districts resulting from project intervention IRI 0
128,000 89,300 IRI
270,000 Endline targets revised 178,188 318,245
Linked to Component 2 of improving access and equity
EMIS is in place at MEMP central and its regional directorates and generating data in August for preschools and primary education IRI No Yes No IRI Yes None No No
Linked to Component 3 of improving sector management and governance
Additional classrooms built in the deprived districts at primary level resulting from project intervention IRI 0 255 0 IRI 255 None 231 318
Linked to Component 2 of improving access and equity

The World Bank Benin Global Partnership for Education Program (P129600)
Page 61 of 95
Indicator
Original (March 2014) Restructuring (September 2015) Restructuring (May 2017)
Project Closing
(April 2018) Notes
Level Baseline Endline Target
Achieved Level Endline Target
Changes Achieved Achieved
Percentage of schools in deprived districts communicating student results and budgets to the community through quarterly community briefing meetings IRI 0.00 70.00 0 IRI 70.00 None 0 0
Linked to Component 3 of improving sector management and governance
Note that for PDO indicators 6 and 7, the following definitions are used:
• PDO Indicator 6: This is a binary indicator with options of ‘yes’ or ‘no’. To meet the endline of ‘yes’, the following criteria needs to be met: (i)
official purpose of the assessment is to measure overall student progress toward agreed system learning goals; and (ii) assessment is given to
a representative sample or census of the target grades or age levels.
PDO Indicator 7: This is considered a sub-indicator of PDO indicator 6. The definition of this core indicator is given in Table 3 below:
Table 3: Definition of PDO Indicator 7: “Utility of the Learning Assessment System”
Criteria Indicator Value
Data are analyzed and results are reported to education policymakers and/or the public
NO YES on any one of the three criteria
YES on any two of the three criteria
YES
Results are reported for at least one of the following student subgroups: gender, urban/rural, geographic region
NO YES
The assessment exercise is repeated at least once every 5 years for the same subject area(s) and grade(s)
NO YES
Value 1 2 3 4

The World Bank Benin Global Partnership for Education Program (P129600)
Page 62 of 95
C. REVISED ILLUSTRATION OF RESULTS CHAIN AFTER SEPTEMBER 2015 RESTRUCTURING
Teacher training including distribution of
grammar books
School construction
School feeding
Primary school packages to girls
Support for first phase of EMIS
Support for development of
learning assessment
Performance-based contracts with DEOs
Capacity building, project management,
and studies
Improved quality of basic education:
• 10,500 teachers trained
• 21,000 G1 and G2 grammar books distributed
• 70% of teachers meeting teaching standards
Improved access and equity:
• 265,000 girls in Grades 1 and 2 receiving school packages
• 192 lower secondary classrooms built / rehabilitated
• 255 primary classrooms built • 270,000 primary students receiving at least
one meal a day
Improved sector management and governance:
• 350 officers of the ministries and deprived districts trained
• Functional EMIS system in place in HQ and regional directorates
• 70% of schools in deprived districts communicating student results and budgets to the community through quarterly community briefing meetings
Improved quality of classroom instruction at the basic education level in deprived districts:
• Improved teaching practices
• Learning assessment system established to track student progress
Improved access and equity at the basic education level in deprived districts:
• Increased access to education at the basic level
• Increased access to education at the lower secondary level
• Increased retention of students at the primary level
• Gap in access between deprived districts and nation
Universal access to basic education Improvement in learning outcomes
Activities Outputs PDO/Outcomes LT Outcomes

The World Bank Benin Global Partnership for Education Program (P129600)
Page 63 of 95
ANNEX 2. BANK LENDING AND IMPLEMENTATION SUPPORT/SUPERVISION
A. TASK TEAM MEMBERS
Name Role
Preparation
Linda K. English Lead Human Development Specialist
Lucienne M’ Baipor Senior Social Development Specialist
Deborah Newitter Mikesell Senior Operations Officer
Atou Seck Senior Education Economist
Pierre Joseph Kamano Senior Education Specialist
Yacinthe Gbaye Education Economist, Task Team Leader
Africa Eshogba Olojoba Senior Environemntal Specialist
Geraldo Joao Martins Senior Education Specialist
Sylvie Charlotte Ida do Rego Program Assistant
Alain Hinkati Senior Financial Management Specialist
Mathias Gogohounga Procurement Specialist
Emmelita Olagnika Da Matha Sant-Anna Temporary
Supervision/ICR
Angelo Donou Financial Management Specialist
Isabella Micali Drossos Counsel
Abdoulaye Gadiere Senior Environmental Specialist
Yacinthe Gbaye Senior Economist, Task Team Leader
Saba Nabeel M Gheshan Associate Counsel
Mathias Gogohounga Procurement Specialist
Alain Hinkati Financial Management Specialist
Felly Akiiki Kaboyo Operations Analyst
Axelle Latortue Consultant, ICR Author
Laura S. McDonald Operations Officer

The World Bank Benin Global Partnership for Education Program (P129600)
Page 64 of 95
Africa Eshogba Olojoba Environmental Specialist
Bintou Sogodogo Program Assistant
Natasha Ibrahim Somji Consultant, ICR Author
Gertrude Marie Mathilda Coulibaly Zombre Senior Social Development Specialist
B. STAFF TIME AND COST
Stage of Project Cycle Staff Time and Cost
No. of staff weeks US$ (including travel and consultant costs)
Preparation
FY12 7.490 66,780.61
FY13 13.390 112,587.06
FY14 .950 4,171.66
Total 21.83 183,539.33
Supervision/ICR
FY13 8.875 12,462.52
FY14 3.825 38,378.11
FY15 18.277 33,010.52
FY16 14.597 70,646.65
FY17 17.999 76,498.46
FY18 34.495 211,833.68
FY19 .225 30,763.84
Total 98.29 473,593.78

The World Bank Benin Global Partnership for Education Program (P129600)
Page 65 of 95
ANNEX 3. PROJECT COST BY COMPONENT27
Components Amount at Approval
(US$M) Actual at Project
Closing (US$M) Percentage of Approval
(US$M)
Component 1: Improving the quality of basic education
8.20 12.89 157.2
Component 2: Improving access and equity
25.30 23.14 91.5
Component 3: Improving Sector Management and Governance
8.80 5.93 67.4
Total 42.30 41.96 99.20
A. Summary of changes in allocation by component and category, US$
Comp. Description of component Initial allocation
in PAD
After restructuring
Sept 2015 May 2017
1 Improving the quality of basic education 8,184,000 9,696,000 10,467,000
2 Improving access and equity 25,285,000 25,372,000 24,748,000
3 Improving sector management and governance 8,831,000 7,232,000 7,085,000
TOTAL 42,300,000 42,300,000 42,300,000
Category 1 30,780,000 32,648,000 31,279,000
Category 2 11,520,000 9,652,000 11,021,000
TOTAL BY CATEGORY 42,300,000 42,300,000 42,300,000
Source: Fiche Synthese Sur Le Programme FCB-PME, March 2017
27 Note that these figures may diverge from what is reported in Client Connection or other sources given differences in the exchange rate when converting from FCFA to USD.
The World Bank Benin Global Partnership for Education Program (P129600)
Page 66 of 95
ANNEX 4. EFFICIENCY ANALYSIS
Introduction 1. This annex provides an efficiency analysis of the Benin Global Partnership for Education project. It is
structured to mirror, where possible, the economic and financial analysis conducted at appraisal, but
updates the analysis with the most recent information and with actual costs and benefits at closeout.
While ideally the efficiency analysis would capture net present values, project data was not available
to conduct this analysis. A summary of the analysis at appraisal is warranted to contextualize this
work.
2. The assessment at appraisal was divided into five parts. First, the macroeconomic context was
discussed, highlighting the trends in the availability of public resources. Next, trends in education
expenditures were detailed and disaggregated by various elements. Third, the contribution of
households was documented; next, the main features of the project were analyzed to justify
investments in project areas and the selection of districts under the project; and finally estimated
costs and anticipated benefits were detailed. This analysis at closing follows in a similar vein, but is
divided into the following main parts: (i) an analysis of education expenditure is given; (iii) a cost-
effectiveness analysis is conducted; (iii) the short- and long-term benefit incidence of the project is
detailed; (iv) an analysis of the efficiency of implementation and spending is documented; and (v) an
analysis of project sustainability is conducted.
Education Financing 3. Benin is in the process of finalizing its new Education Sector Plan 2018-2030. As part of this work, an
Education Sector Analysis was produced, which analyses education expenditure between 2010 and
2015, and thereby provides a rich source of data on the macroeconomic context of education. This
sub-section draws primarily from this source.
4. Benin remains committed to education financing, with total education expenditure increasing
between 2010 and 2015, and the average share of public expenditure on education in the GDP and
in Government expenditure exceeding targets and outperforming neighboring countries (Table 4).
As Benin’s GDP has steadily increased by an average of 5.2 percent between 2010 and 2015, so has
education expenditure from the national budget, reaching FCFA 225.6 million in 2015; this is an
increase of 19 percent after accounting for inflation. Across the same period, an average of 4.8% of
the GDP and 27.8% of total Government expenditure was allocated toward education. The Global
Partnership for Education (GPE) recommends that 20 percent of a country’s expenditure should be
allocated to education, and Benin has consistently exceeded this target. Benin also outperforms
other sub-Saharan African (SSA) countries, which allocate on average 4.3 percent of their share of
GDP and 16 percent of public expenditure to education. However, in 2015 there was a substantial
drop in the proportion of Government expenditure expended on education (22 percent) as compared
to previous years, owing primarily to presidential elections which increased transfer expenses.

The World Bank Benin Global Partnership for Education Program (P129600)
Page 67 of 95
Table 4: Education expenditure indicators in Benin, 2010-2015
2010 2011 2012 2013 2014 2015
Education expenditure from national budget*
168.7 177.9 203.3 219.9 218.7 225.6
Share of public expenditure on education in GDP
4.9% 4.8% 4.9% 4.9% 4.6% 4.5%
Share of public expenditure on education in Government expenditure**
28.7% 29.3% 29.1% 28.7% 29.2% 22.0%
*millions of FCFA; **excludes interest on debt Source: Note d’analyse sectorielle du système d’éducation et de la formation, 2017
5. Donors are an important and growing contributor toward reducing allocation inefficiencies by
investing an increasing proportion in goods and services and investment. In 2015, external financing
of the sector contributed to 4.2 percent of total education expenditure; this increased substantially
from 2010, when donors contributed just 2.9 percent. Table 5 demonstrates that the proportion of
public expenditure in goods and services and investment has decreased between 2010 and 2015
(from 5.9 percent to 4.7 percent for goods and services and from 6.8 percent to 5.7 percent for
investment expenditure). However, when donor financing is included, the proportion of total
expenditure in investment remains unchanged between 2010 and 2015 (at 7.3 percent) while
investment in goods and services increases (from 7.1 percent to 6.8 percent) across the same years.
This demonstrates an increasing reliance on external financing to support goods and services and
investment expenditure and makes a strong case for donor investment in education in reducing
allocation inefficiencies.
Table 5: Public and total education expenditure by source in Benin, 2015
2010 2015
Public expenditure Total expenditure
Public expenditure Total expenditure
Amount % Amount % Amount % Amount %
Current 157.2 93.2% 161.0 92.7% 212.8 94.3% 218.2 92.7%
Staff 115.3 68.3% 115.4 66.4% 156 69.1% 156.1 66.3%
Goods and Services 9.9 5.9% 12.4 7.1% 10.7 4.7% 16.1 6.8%
Transfers to institutions 8.6 5.1% 9.8 5.7% 15.6 6.9% 15.6 6.6%
Social 13.5 8.0% 13.5 7.8% 18.9 8.4% 18.9 8.0% Other current
transfers 6.5 3.9% 6.5 3.7% 6.7 3.0% 6.7 2.8%
BESA 3.3 2.0% 3.3 1.9% 4.8 2.1% 4.8 2.0%
Investment 11.5 6.8% 12.7 7.3% 12.8 5.7% 17.1 7.3%
TOTAL 168.7 100.0% 173.7 100.0% 225.6 100.0% 235.3 100.0%
Table Notes: All non % expenditures are in millions of FCFA. Total expenditure includes external financing. BESA represents the budget for administrative service equipment. Source: Author calculations using data from Note d’analyse sectorielle du système d’éducation et de la formation, 2017
The World Bank Benin Global Partnership for Education Program (P129600)
Page 68 of 95
6. Although the primary sub-sector received the largest amount of public resources in 2015, this has
declined since 2010 in favor of tertiary education, increasing inequities in education. In 2010, 49.1
percent of total public education expenditure was allocated toward primary, and this reduced to 43.5
percent in 2015, which was lower than the ECOWAS average of 48.4 percent.28 These resources have
been reallocated to the tertiary sector where the proportion of education expenditure has increased
from 16.9 percent to 21.6 percent between 2010 and 2015, higher than the ECOWAS average of 19.7
percent. Coupled with the fact that those from higher income quintiles are more likely to access
higher levels of education, this indicates an increasingly regressive distribution of education
spending. The proportion of public education financing allocated toward lower secondary education
has remained unchanged between 2010 and 2015 at 17.9 percent, which is higher than the ECOWAS
average of 16.9 percent. This provides strong justification for investments in primary education in
particular.
7. This inequitable allocation of education expenditure is also reflected in unit costs as a percent of
GDP per capita. In 2015, expenditure on primary education was 11.2 percent of GDP per capita, while
for lower secondary the comparative figure was 13.3 percent. At the tertiary level, this number is
97.2 percent.
Cost-effectiveness analysis of project components 8. The project was relatively cost-effective for all construction items when compared to the amount
budgeted during appraisal. Table 6 provides budget and actual unit cost estimates for new
classrooms and three-block latrines at the primary and lower secondary levels.29 It is clear that these
construction costs are lower than what was budgeted for. However, at least in part, this is a result of
exchange rate gains and the Government’s decision to waive taxes on construction—both of which
resulted in cost savings. In addition, actual unit costs were lower under the project for primary school
classrooms and latrine blocs when compared with unit costs across other projects in sub-Saharan
Africa and higher for new classrooms at the secondary level. In other contexts, unit costs for new
classrooms at the primary level ranged from between US$ 13,750 to US$ 30,000, while for primary
school latrine blocs the range was from US$ 4,100 to US$ 7,200. At the lower secondary level, unit
costs for new classrooms were approximately US$ 14,300.
28 Note that these percentages do not include expenditure on pre-school. If this is accounted for, then the share of total public education expenditure allocated toward the primary and pre-school sub-sectors declines from 52.3 percent in 2010 to 47.6 percent in 2015. 29 Note that these unit costs are averaged across all construction during the project: unit costs were understandably higher for sites that were more difficult (due to topography or other features of the habitat) and lower for sites that were easier.

The World Bank Benin Global Partnership for Education Program (P129600)
Page 69 of 95
Table 6: Unit cost of construction, USD
Level Item Budgeted Unit Cost
(1)
Actual Unit Cost (2)
Difference (2) – (1)
% of budget (2) / (1)
Primary
New Classrooms
15,169.71 12,579.31 - 2,590.41 82.9
Latrine blocs (4 latrines)
3,000.00 2,754.16 - 245.84 91.8
Lower Secondary
New Classrooms
19,771.65 16,653.48 - 3,118.18 84.2
Latrine blocs (4 latrines)
4,000.00 3,464.39 - 535.61 86.6
Table Notes: Note that at the primary level, the project in Mali gave unit costs for three-block latrines. The author projected this for four-block latrines by simply finding the unit-cost for each latrine and multiplying by four. Source: Adapted by the author from project documents
9. The per student cost of school kits was US$7.99 which was lower than the budgeted unit cost of
US$11.63. The school kits included school supplies (including notebooks and other materials), a
school bag, and school uniforms. The actual per student cost was US$3.64 lower than the amount
budgeted for at the beginning of the project, resulting in savings of US$1,177,180 for all kits
combined. Although the content of kits vary widely across projects, incentive kits in Mali and Ghana
cost between US$6.73 and upwards of US$50.
10. The per child unit cost of school feeding was US$28, which is below the average in low-income
countries of US$41 (Kristjansson et al., 2016) but is approximately the same as previous school
feeding costs in Benin. Figure 2 shows the standardized average cost of school feeding across a range
of countries, which shows a large range in school feeding with per-child school feeding costs in 2008
around the same as during the project.30 The cost per meal under the project was US$0.25.
30 Note that these comparisons should be viewed with the caveat that the per child cost under the project were not standardized so may not be comparable.

The World Bank Benin Global Partnership for Education Program (P129600)
Page 70 of 95
Figure 2: Standardised school feeding costs in USD across low- and middle-income countries31
Source: Global School Feeding Sourcebook, Drake et al., 2016
11. The per participant training and material provision cost for the teacher training intervention was
US$840.82, covering 13,259 teachers and supervisors – composed of 10,699 teachers at the primary
level, 11,479 teachers at the lower secondary level – and 1,780 persons in charge of the education
unit and their deputies. Given the variability of teacher training costs in terms of scope, duration and
mode of delivery, it is difficult to identify a relevant cost comparator. However, the project conducted
multiple trainings on a variety of topics including tools to improve professional skills, managing
classroom time, evaluating student learning, content knowledge, teaching multi-grade and large
classes, and French language tools. Through these various trainings, most teachers were trained
multiple times. This unit cost also covers the cost of 26,000 grammar books distributed to teachers.
Benefit incidence 12. The project partially fulfilled its Project Development Objective to improve access and equity and
the quality of classroom instruction at the basic education level, with particular emphasis on
deprived districts. This is evidenced by the following:
• Re-categorization of districts using the original selection criteria: During appraisal, deprived
districts that were to receive project interventions were selected using the following criteria:
(i) for primary, if the GER was lower than 95 percent and / or completion rate less than 50
31 Note that this graph does not indicate whether costs in the figure provide estimates from locally-administered of centrally-run / NGO-run actors; in general, locally-run school feeding can be substantially cheaper.

The World Bank Benin Global Partnership for Education Program (P129600)
Page 71 of 95
percent; (ii) for lower secondary, if GER for girls was lower than 30 percent. Based on these
criteria, 25 deprived districts were selected at the primary level and 23 at the lower secondary
level. Given the clear selection criteria, it was possible to recategorize the districts in 2015 for
the Education Sector Analysis. In 2015, reapplying the original selection criteria at the primary
level, nine of the 25 original project districts that qualified as deprived at appraisal would no
longer be classified as such. In another 12 districts, improvements in completion rates and GER
were noted, but these improvements were not sufficient to move them out of the ‘deprived’
zone. Four additional districts worsened in terms of indicators from the original selection
criteria (i.e. GERs and / or completion rates dropped). In 2015, reapplying the original selection
criteria at the lower secondary level, 16 of the 23 original project districts that qualified as
deprived at appraisal would no longer be classified as such. Of the remaining districts, five
registered improvements in girls GER but still remain below 30 percent, and for two districts,
GER for girls worsened. On the whole, it is clear that outcomes had improved in 2015 for most
of the districts originally classified as deprived.
• Access with equity: None of the PDO-level indicators linked to access were met under the
project; however, all the intermediate result indicators that were related to access were either
met or exceeded. The project was not able to meet targets linked to improving the GPIR in the
deprived districts, improving the primary education completion rate, or the GER at the lower
secondary level. However, the project did finance the construction of 318 classrooms at the
primary level (compared to a target of 255), 212 classrooms at the lower secondary level
(compared to a target of 192), 323,455 school kits for girls (compared to a target of 265,000)
and 318,245 students to receiving at least one meal per day (compared to a target of 270,000).
• Quality of classroom instruction: While it is difficult to establish causation, the quality of
classroom instruction did improve in targeted districts as indicated by the project surpassing
all quality-related targets in the Results Framework. This includes: approximately 60 percent
of teachers rated satisfactory (compared to a target of 55 percent), 26,000 G1 and G2 grammar
books distributed (compared to a target of 21,000), over 10,500 teachers trained at the
primary level and 75.8 percent of teachers meeting the standard based on inspection and
classroom visits each year (compared to a target of 70 percent). The nationally representative
evaluation of learning outcomes that was conducted using project funds still found that the
deprived districts under the project performed lower than other public schools in Mathematics
and French, but at the second grade level, these differences were not significant.32
13. The project may also have long-term impacts on the following:
• Future earnings: The most recent private returns to schooling estimates in Benin are from
2015 where an additional year of schooling is correlated with a 11 percent increase in wage.
This is slightly lower than the SSA average of 12 percent. The private rates of return to
completing primary education is 94 percent higher wage compared to no education; at the
lower secondary level, this figure is 127 percent. Hence, there are long-term impacts in terms
of future earnings from the project.
32 Note that, without a baseline, it is not possible to determine whether there has been improvement in these districts.

The World Bank Benin Global Partnership for Education Program (P129600)
Page 72 of 95
• Health outcomes: According to 2017/18 Demographic and Health Survey (DHS) data, child
mortality and fertility rates in Benin have both increased since 2011/12. The former now stands
at 55 deaths per 1,000 births (an increase from 42 in 2011/12) while the latter is 5.7 children
per woman, an increase from 4.9 in 2011/12 (Cinquième Enquête Démographique et de Santé,
2017-18). A number of studies have found negative correlations between education and child
mortality and fertility rates (Witter et al., 2017), and Benin’s example corroborates these
findings. The 2017/18 DHS indicates that the higher the education level, the less likely a woman
between the ages of 15 and 19 years old are to have a child or be pregnant with a child: 33.5
percent of women who have no education between these ages have started their procreative
lives, compared to 13.1 percent who have a lower secondary education. Furthermore, UNESCO
estimates that the number of underage births33 in sub-Saharan Africa, South and West Asia
stands at 3.4 million, but this would fall by 10 percent if all women had primary education and
59 percent if all women had secondary education (Witter et al., 2017). Hence, there may be
long-term impacts in terms of these health benefits for those who benefitted from the project.
• Intergenerational effects: Education can also be seen as a positive externality in that the
benefits of educational attainment in one generation can spillover into future generations. In
a study of 16 sub-Saharan African countries, it was found that 68 percent of children with
uneducated mothers attended school, compared to 87.7 percent and 95.5 percent of children
with mothers who had six and 12 years of education respectively. UNESCO has also found that
an extra year of a mother’s education resulted in an increase in a child’s education by 0.32
years (Witter et al., 2017).
Efficiency of Implementation 14. The project disbursed 99.2 percent of the budgeted amount, or 41.96 of the USD 42.3 million
allocated to the project; the disbursement trend has been mostly smooth. The change in proportion
disbursed from one six-month period to the next varied throughout the life cycle of the project, with
average disbursement of 14 percent within six months. Figure 3 provides the percent disbursed and
the percentage point change in the percent disbursed from one cycle to the next. The period between
June 2015 and June 2016 indicates a rapid increase in disbursement for the first six months, and then
a drop to no disbursement for the next six months. This is reflective of implementation realities, most
significantly a change in administration in April 2016 and project restructuring in September 2015. It
is during this time that discussions for extending the project are considered to allow activities to be
completed and to account for the rainy season which would slow down construction. The supervisory
team also demonstrated proactiveness when they worked with the Government to develop a tight
schedule for the implementation of the school kits and school canteens activities, which had been
significantly delayed. It is also worth noting that all of the seven financial audits that were available
were of unqualified opinion and reported no significant irregularities, indicating judicious supervision
of project funds.
33 Defined as before the mother reaches 17 years of age.
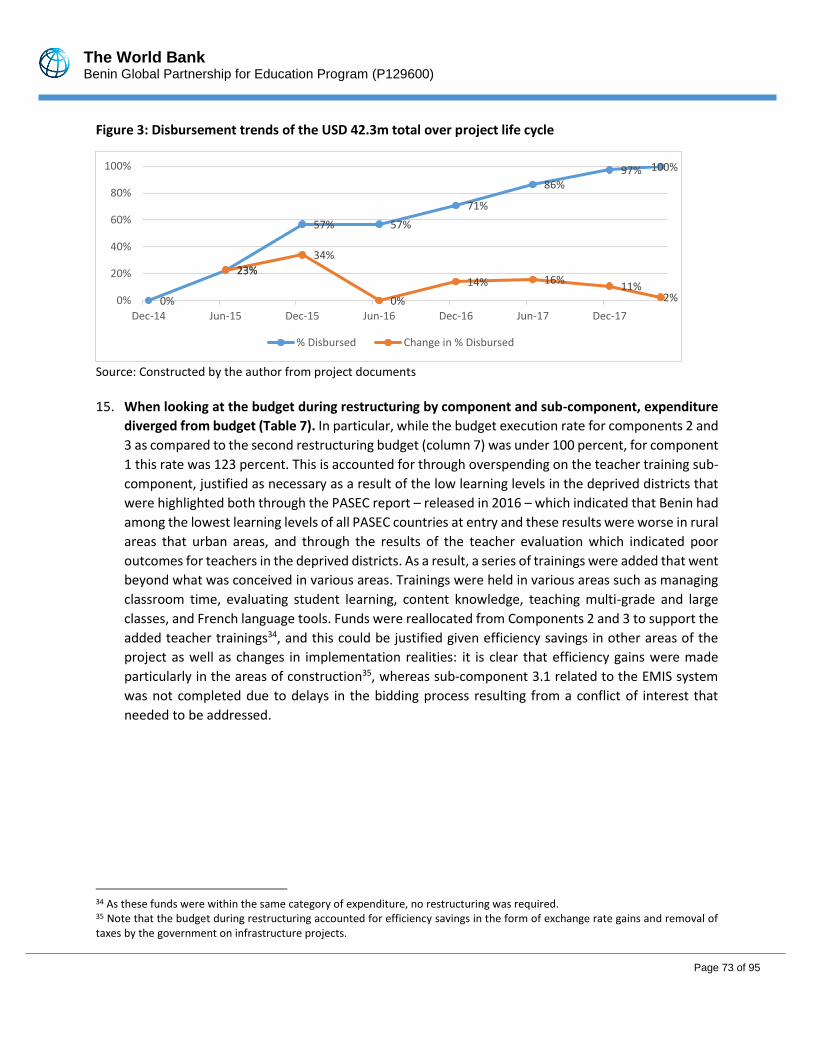
The World Bank Benin Global Partnership for Education Program (P129600)
Page 73 of 95
Figure 3: Disbursement trends of the USD 42.3m total over project life cycle
Source: Constructed by the author from project documents
15. When looking at the budget during restructuring by component and sub-component, expenditure
diverged from budget (Table 7). In particular, while the budget execution rate for components 2 and
3 as compared to the second restructuring budget (column 7) was under 100 percent, for component
1 this rate was 123 percent. This is accounted for through overspending on the teacher training sub-
component, justified as necessary as a result of the low learning levels in the deprived districts that
were highlighted both through the PASEC report – released in 2016 – which indicated that Benin had
among the lowest learning levels of all PASEC countries at entry and these results were worse in rural
areas that urban areas, and through the results of the teacher evaluation which indicated poor
outcomes for teachers in the deprived districts. As a result, a series of trainings were added that went
beyond what was conceived in various areas. Trainings were held in various areas such as managing
classroom time, evaluating student learning, content knowledge, teaching multi-grade and large
classes, and French language tools. Funds were reallocated from Components 2 and 3 to support the
added teacher trainings34, and this could be justified given efficiency savings in other areas of the
project as well as changes in implementation realities: it is clear that efficiency gains were made
particularly in the areas of construction35, whereas sub-component 3.1 related to the EMIS system
was not completed due to delays in the bidding process resulting from a conflict of interest that
needed to be addressed.
34 As these funds were within the same category of expenditure, no restructuring was required. 35 Note that the budget during restructuring accounted for efficiency savings in the form of exchange rate gains and removal of taxes by the government on infrastructure projects.
0%
23%
57% 57%
71%
86%97% 100%
23%
34%
0%
14% 16%11%
2%0%
20%
40%
60%
80%
100%
Dec-14 Jun-15 Dec-15 Jun-16 Dec-16 Jun-17 Dec-17
% Disbursed Change in % Disbursed
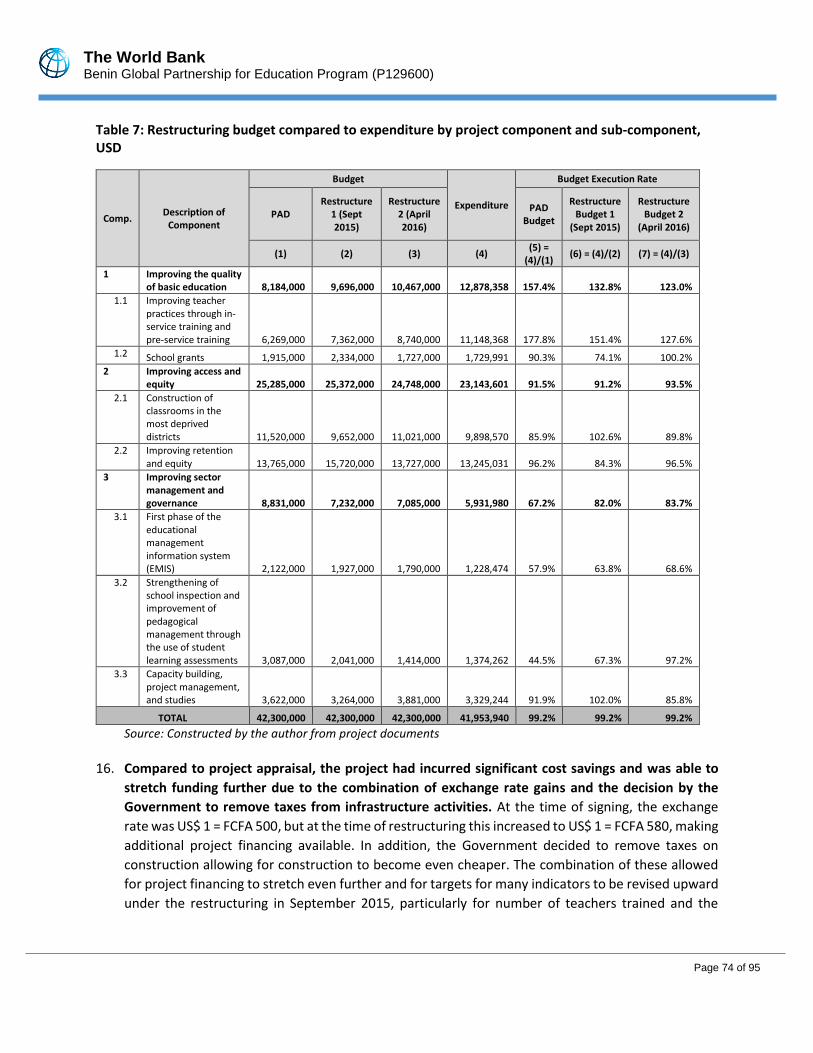
The World Bank Benin Global Partnership for Education Program (P129600)
Page 74 of 95
Table 7: Restructuring budget compared to expenditure by project component and sub-component, USD
Comp. Description of
Component
Budget
Expenditure
Budget Execution Rate
PAD Restructure
1 (Sept 2015)
Restructure 2 (April 2016)
PAD Budget
Restructure Budget 1
(Sept 2015)
Restructure Budget 2
(April 2016)
(1) (2) (3) (4) (5) =
(4)/(1) (6) = (4)/(2) (7) = (4)/(3)
1 Improving the quality of basic education 8,184,000 9,696,000 10,467,000 12,878,358 157.4% 132.8% 123.0%
1.1 Improving teacher practices through in-service training and pre-service training 6,269,000 7,362,000 8,740,000 11,148,368 177.8% 151.4% 127.6%
1.2 School grants 1,915,000 2,334,000 1,727,000 1,729,991 90.3% 74.1% 100.2%
2 Improving access and equity 25,285,000 25,372,000 24,748,000 23,143,601 91.5% 91.2% 93.5%
2.1 Construction of classrooms in the most deprived districts 11,520,000 9,652,000 11,021,000 9,898,570 85.9% 102.6% 89.8%
2.2 Improving retention and equity 13,765,000 15,720,000 13,727,000 13,245,031 96.2% 84.3% 96.5%
3 Improving sector management and governance 8,831,000 7,232,000 7,085,000 5,931,980 67.2% 82.0% 83.7%
3.1 First phase of the educational management information system (EMIS) 2,122,000 1,927,000 1,790,000 1,228,474 57.9% 63.8% 68.6%
3.2 Strengthening of school inspection and improvement of pedagogical management through the use of student learning assessments 3,087,000 2,041,000 1,414,000 1,374,262 44.5% 67.3% 97.2%
3.3 Capacity building, project management, and studies 3,622,000 3,264,000 3,881,000 3,329,244 91.9% 102.0% 85.8%
TOTAL 42,300,000 42,300,000 42,300,000 41,953,940 99.2% 99.2% 99.2%
Source: Constructed by the author from project documents
16. Compared to project appraisal, the project had incurred significant cost savings and was able to
stretch funding further due to the combination of exchange rate gains and the decision by the
Government to remove taxes from infrastructure activities. At the time of signing, the exchange
rate was US$ 1 = FCFA 500, but at the time of restructuring this increased to US$ 1 = FCFA 580, making
additional project financing available. In addition, the Government decided to remove taxes on
construction allowing for construction to become even cheaper. The combination of these allowed
for project financing to stretch even further and for targets for many indicators to be revised upward
under the restructuring in September 2015, particularly for number of teachers trained and the

The World Bank Benin Global Partnership for Education Program (P129600)
Page 75 of 95
number of students receiving at least one meal a day; in addition, grammar books were purchased
and provided to teachers as an additional activity.
17. However, substantial project delays and fraudulent activity with regards to school feeding resulted
in inefficient implementation. The project suffered from delays in all areas, including FM,
procurement, administration and technical delays which substantially delayed project
implementation. For instance, school kits to girls were provided with substantial delay, as were
school grants in the 2014/15 academic year; payments for classroom construction was also
substantially delayed. As a result, project extensions were requested twice under the project. In
addition, two instances of fraudulent activity with regard to school feeding resulted in substantial
delays in school feeding activities. This meant that activities were not administered within the
intended timeframe, resulting in inefficiencies.
18. While these revised targets were exceeded in 8 out of 11 instances at the intermediate level, at the
PDO level, only 4 out of the 7 indicators were achieved. However, although the budget execution
rate only exceeded 100 percent for sub-component 1.1; for all other sub-components, the budget
execution rate was under 100 percent. Despite these cost savings, many indicators in the Results
Framework exceeded their revised targets (after the restructuring in September 2015 which
accounted for the exchange rate gains), most notably: 25 percent more beneficiaries benefitted from
the project; 25 percent and 10 percent more schools at the primary and lower secondary levels
respectively were constructed; 24 percent more G1 and G2 grammar books were distributed; 22
percent more girls in grades 1 and 2 received school packages; and 18 percent more primary school
students received at least one meal per day. The project thus underspent compared to the budget
and exceeded endline targets indicating extreme efficiency in spending of resources. However,
despite these efficiency gains, access indicators at the PDO level remained unmet.
Sustainability analysis 19. Categorization of districts as ‘deprived’ using objective and transparent criteria was initially done
by the project, but this has since been institutionalized and adopted nationally. As previously
mentioned, the 2015 Education Sector Analysis recategorized districts using the original selection
criteria and found that many districts had moved out of deprived status. The Education Sector Plan
2018-2030 used this recategorization to redefine 42 districts which should be targeted (which
includes 18 districts targeted under the project). This classification has become so entrenched, that
the Government has instituted a new policy to continue some of the project interventions in these
42 districts, as well as to conduct research to better understand the root causes that these districts
are facing.
20. In addition, the pooled fund mechanism and the new GPE project will allow for continued support
of project interventions. In particular, the pooled fund mechanism will finance teaching materials to
schools as well as capacity building for the full use of EMIS as well as extend EMIS to the secondary
level. Given the success of the project in targeting teacher training by using the results of teacher
evaluations, the Minister intended to continue this aspect; however, teachers boycotted this

The World Bank Benin Global Partnership for Education Program (P129600)
Page 76 of 95
intervention so this could not be continued. The new GPE-financed project, in the amount of US$19.4
million, will continue to provide pre- and in-service training to basic education teachers, provide
school packages to girls in the regions of Alibori and Bourgou (regions that have 11 out of 20 districts
with PCRs below 50 percent), and strengthening the M&E system and extending the EMIS. Other
donors are also supporting this by supporting school construction, equity and inclusion, literacy, and
technical and vocational education and training.
21. Many of the project interventions can be expected to benefit future cohorts of students. While
minimal maintenance costs will be required, the schools constructed under the project will continue
to benefit students beyond the scope of the project. In addition, the capacity building under the
project in the form of in-service and pre-service training, monitoring and evaluation training,
leadership training, procurement training, financial management training, etc. will also benefit
additional students that were not part of the project especially if refresher trainings can be
financed.36 Furthermore, some of the teaching and learning materials purchased under the school
grants will continue to remain in the schools and benefit future students.
22. However, other interventions will need to be sustained through continued financing as detailed in
Table 8. Specifically, school feeding, student kits and school grants will require investment if these
interventions are to be continued. The Government has included in the Education Sector Plan 2018-
2030 the need to target interventions related to infrastructure, teacher training, school canteens,
and school kits in the 42 new districts categorized as ‘deprived’; this commitment makes the
possibility of funding for these activities more realistic. In addition, the new GPE project will ensure
sustainability of many of the project interventions by continuing to provide pre- and in-service
training to teachers, providing school packages to girls in the regions of Alibori and Bourgou (regions
where there are 11 districts with Primary Completion Rates below 50 percent out of a total of 20
districts), continuing constructing classrooms in deprived districts, and continuing administering
learning assessment by strengthening MEMP’s capability.
Table 8: Unit costs of interventions that will require continued investment, USD
Item Unit Cost (US$)
School feeding 28 (per child)
School kits 7.99 (per kit)
School grants 1,000 (per school)
23. Future projects and Government initiatives will benefit both from the set-up of the EMIS system
and the learning assessment that was carried out under the project. While the EMIS system was not
established at the regional level as the project intended due to delays, it was set up at the Ministry
of Basic Education and includes software for personnel management and the management of
statistical data and officers were trained in these systems. This will allow for more efficient data
collection for future projects, and the new GPE-financed project along with the pooled funding
36 Note that this is tempered somewhat due to attrition of staff, but it is not possible to get a sense of the scale of attrition.

The World Bank Benin Global Partnership for Education Program (P129600)
Page 77 of 95
mechanism intends to continue financing the extension of EMIS to other levels as well as the training
of staff to build their capacities in the use of EMIS. In addition, the nationally representative learning
assessment carried out under the project provides the latest datapoint on learning outcomes in the
country at the primary level and allows for more efficient targeting. The Government has already
paid to participate in PASEC 2019, and the new GPE project will finance Benin’s participation in a
national learning assessment in 2022.
24. To conclude, the project was highly efficient in exceeding the majority of results at the intermediate
level at a lower expected cost. Part of this can be explained by exchange rate gains and the
Government’s decision to waive taxes on construction, which allowed project financing to be
stretched further. The project was also relatively more efficient than cost comparators especially for
construction, and short- and long-term benefits were recorded in terms of improved quality. Project
disbursement was relatively smooth, and the institutionalization of the ‘deprived districts’
categorization, as well as the continued financing of some of the project interventions through the
pooled fund mechanism and the new GPE-financed project will ensure continued sustainability.
However, the project also suffered from delays in FM, procurement, technical and administrative
implementation which substantially affected timelinesss of implementation and resulted in two
project extensions. In addition, some of the efficiency gains observed under the project were made
possible by exogenous factors (exchange rate gains and the Government’s decision to waive taxes).
Moreover, the project was unable to translate achievements at the intermediate level to outcomes
and none of the PDO-level targets linked to access were achieved. In light of the above, the efficiency
of the project is rated Modest.

The World Bank Benin Global Partnership for Education Program (P129600)
Page 78 of 95
ANNEX 5. BORROWER, CO-FINANCIER AND OTHER PARTNER/STAKEHOLDER COMMENTS
The following provides an excerpt of the Government’s completion report. The full report can be found in WBdocs.
I. Conception, exécution, réalisation et impact du projet
A. Evaluation de la conception du projet
Le projet vise à appuyer le Gouvernement du Bénin dans la mise en œuvre de la troisième phase de son Plan sectoriel pour l'éducation (ESP). Le projet contribue aux objectifs les plus élevés de la stratégie de réduction de la pauvreté du Bénin soutenue par la Stratégie Nationale d'Assistance de la Banque (SNAB) pour la période 2009-2012. Le projet contribue également aux objectifs du Plan Décennal de Développement du Secteur de l'Education - PDDSE). Il est destiné à soutenir les domaines qui complètent les dépenses du gouvernement ainsi que d'autres sources de financement du secteur. Il contribue donc à l’atteinte des cinq objectifs interdépendants du PDDSE que sont: améliorer le taux de scolarisation, de l'équité régionale, du genre et la rétention de l'éducation de base ; méliorer la qualité de l'enseignement à tous les niveaux du secteur de l'éducation avec pour objectif de maximiser les résultats d'apprentissage ; accroître l'efficacité et la pertinence du système éducatif en favorisant des liens plus étroits entre la technique, la formation professionnelle et l'enseignement supérieur, d'une part, et les exigences du marché du travail, d'autre part ; gérer le flux des étudiants à travers la diversification de l'offre d'éducation pour l'enseignement post-fondamental ; améliorer la gestion globale du système y compris la gestion administrative, pédagogique et financière. L’atteinte de ces objectifs à l’issue des quatre années d’exécution du projet est mesurée par les indicateurs de résultats suivant : Pourcentage d’enseignants jugés satisfaisants chaque année par une enquête d’observation de classes de l’INFRE et d’une agence externe dans les communes défavorisées ; L’écart entre le Taux Brut d'Admission au cours primaire des communes défavorisées et celui recueilli au niveau moyen national (dont celui des filles); Le taux d'achèvement de l'enseignement primaire dans les communes ciblées (total / filles); Le taux brut de scolarisation dans l'enseignement secondaire au premier cycle dans les communes cibles; Le système pour l'évaluation des apprentissages dans l'enseignement primaire; Les Bénéficiaires Directs du Projet (nombre), dont des filles (%) CORE. Les indicateurs de développement du programme ont progressé dans l’ensemble de manière satisfaisante de 2014 à 2016. Jusqu’en 2016, les résultats sont jugés modérément satisfaisants étant donné que quatre des cinq indicateurs de performance clés ont progressé vers les cibles. Pour l’année scolaire 2016-2017, il a été noté une baisse du niveau des différents indicateurs. Cependant, cette baisse a été moins importante que celle observée au niveau de la moyenne nationale ; ce qui entraîne une amélioration à la baisse de l’écart entre les communes défavorisées et la moyenne nationale au niveau des indicateurs sélectionnés pour le suivi du programme au niveau du primaire. En particulier, au niveau du secondaire, la chute du seul indicateur suivi dans ce sous-secteur (taux brut de scolarisation dans le secondaire général au premier cycle dans les communes ciblées) est due aux

The World Bank Benin Global Partnership for Education Program (P129600)
Page 79 of 95
résultats catastrophiques enregistrés au CEP session de 2016.
B. Principaux résultats obtenus dans chacune des composantes du projet
1. Pour la composante 1 (Amélioration de la qualité de l’enseignement).
En termes de statistiques, les résultats obtenus se présentent comme indiqués dans le tableau ci-dessous : Tableau 1 : Effectif des enseignants formés par an
Indicateurs 2014/15 2015/16 2016/17
Valeur Cible
Valeur Atteinte
Valeur Cible
Valeur Atteinte
Valeur Cible
Valeur Atteinte
Nombre d’enseignants du primaire formés dans les communes défavorisées dans le cadre du projet
7 000 9 367 10 500 10 699 10 500 10 699
Ces formations ont été soutenues par des évaluations périodiques qui ont permis d’apprécier l’évolution des performances des enseignants. Au nombre de ces évaluations financées par le projet, il y a :
• L’étude d'évaluation et d'observation des enseignants en situation de l’INFRE et d’une agence
externe qui a permis de dégager le « Pourcentage d’enseignants jugés satisfaisants chaque
année ». Elle a révélé que 59,4% des enseignants des 25 communes ont été jugés satisfaisant en
matière de pratique de classe.
• L’évaluation à l’aide de l’Outil de Supervision et d’Encadrement Pédagogique (OSEP). Elle a permis
d’apprécier chaque année le pourcentage d’enseignants du public satisfaisant aux normes
d’inspection et de visites de classe.
Au niveau du Ministère des Enseignements Secondaire, Technique et de la Formation Professionnelle, il était prévu la formation initiale de 3 400 enseignants contractuels qui n'ont que le baccalauréat (ou un an au-delà) pour deux (02) ans. Cette formation des enseignants reversés ACE du secondaire est achevée et les résultats sont proclamés dans toutes les cohortes. Le taux global de succès est de 63,3 %. Il convient de noter que les résultats sont particulièrement faibles en mathématiques et en sciences physiques où les taux de succès sont respectivement de 39,4% et 49,4%. Outre cette formation initiale, certaines activités de formation et de remédiation aux insuffisances pédagogiques ont été menées au niveau de ce sous-secteur. Toutes ces formations et remédiations ont permis d’obtenir les résultats suivants au niveau de ce sous-secteur :
• 1744 enseignants du secondaire recrutés en 2014 et 2016 et 387 conseillers pédagogiques ont vu
leur capacité renforcée sur quelques stratégies de gestion de classe ;
• 1320 responsables d’établissements du secondaire (dont 440 Directeurs/Proviseurs, 440 censeurs
et 440 surveillants généraux) des départements Zou-Collines, Borgou-Alibori et Atacora-Donga
ont vu leurs insuffisances pédagogiques et administratives remédiées ;

The World Bank Benin Global Partnership for Education Program (P129600)
Page 80 of 95
• 73 inspecteurs et cadres assimilés du MESTFP ont été formés au « Team Building » et au
« Leadership et Management d’équipes Performantes » respectivement par les cabinets de
formation TALENTS PLUS et AFRIQUE CONSEIL ;
• les insuffisances académiques de 912 enseignants en situation de classe identifiés dans les
disciplines de français, de mathématiques, de la SVT et du PCT sont remédiées ;
• 600 enseignants sont outillés à utiliser les ressources notionnelles, pédagogiques et techniques
actualisées dans le processus enseignements/apprentissages/évaluation de leurs disciplines
respectives.
En matière d’intrants pédagogiques et de matériel didactique, le projet a transféré une subvention ponctuelle de 500 000 F CFA à chacune des 2 008 écoles primaires publiques des 25 communes défavorisées pour l’acquisition de matériels pédagogiques au titre de l’année scolaire 2014-2015. Au-delà de ce qui était prévu dans cette sous composante, le projet a acquis et distribué 13 000 exemplaires de chaque livre de grammaires G1 et G2 ont aux enseignants formés en 2015 sur les livrets IFADEM 3, 4, 5 et 6. Au niveau de cette composante, les leçons tirées se résument comme suit :
• l’implication des cabinets à divers niveaux a permis d’accélérer la mise en œuvre des formations ;
• la coordination des activités de formations continues par une seule structure (INFRE) au niveau de
la maternelle et du primaire s’est révélée comme une option pertinente et efficace ;
• l’utilisation de certains documents de formations déjà élaborés (livrets IFADEM) a permis
d’optimiser le temps et de réduire les coûts des formations ;
• toutes les évaluations et études ont presque abouti aux mêmes constats, à savoir une
détérioration de la qualité des apprentissages depuis 2000. Mais, de façon récurrente, les
recommandations ne font pas l’objet d’un suivi et sont peu mises en œuvre.
2. Composante 2 : Amélioration du taux de scolarisation et de l’équité
Au niveau des constructions, les résultats sont jugés satisfaits. Les cibles prévues ont été largement dépassées. Toutes les constructions du volet PME du programme sont achevées. Il s’agit de :
• 85 modules de trois salles de classe entièrement équipés et 170 blocs de latrines au profit du
MEMP ;
• 48 modules de quatre salles de classe entièrement équipés et 96 blocs de latrines au profit du
MESTFP.
Tous ces modules ont été réceptionnés provisoirement ; soit un taux d’exécution global de 100%. Outre ces infrastructures, compte tenu des gains de change et des reliquats sur cette sous composante, des infrastructures complémentaires ont été réalisées. Il s’agit de : Une première cohorte complémentaire de 21 modules de trois (03) salles de classe au profit du MEMP et

The World Bank Benin Global Partnership for Education Program (P129600)
Page 81 of 95
cinq (05) modules de quatre (04) salles de classe au profit du MESTFP, ont été construits sur les ressources du PME. Le taux physique global d’exécution est de 85% pour les 21 modules de trois (03) classes ; Une deuxième cohorte de 10 modules de trois (03) salles classes et 03 modules de quatre classes ont été construits au profit du MEMP et du MESTFP sur les ressources du PME. Le taux global d’exécution des travaux est estimé à 60%. 11 modules à réaliser dans les zones déshéritées confiés à AGETUR SA au profit du MESTFP sur les ressources FCB ont été construits et réceptionnés provisoirement ; soit un taux global d’exécution de 100%. Après l’échéance de la période de garantie de 01 an, 05 modules sur les 11 réalisés ont été réceptionnés définitivement. Deux (02) dortoirs de 100 places confiés à AGETIP-BENIN dans les Ecoles Normales d’Instituteurs d’Abomey et de Porto-Novo au profit du MEMP sur les ressources FCB ont été construits définitivement réceptionnés. En résumé, le projet a pu construire :
• 118 modules de trois (03) salles de classe entièrement équipés et 232 blocs de latrines au profit
du MEMP ;
• 67 modules de quatre (04) salles de classe entièrement équipés et 107 blocs de latrines au profit
du MESTFP.
En matière de sauvegarde environnementales et sociales, la mise en œuvre des politiques OP/BP 4.01 Evaluation environnementale et OP/BP 4.12 Réinstallation involontaire a permis de :
o Sécuriser les sites d’infrastructures ;
o Assurer la durabilité des infrastructures ;
o Obtenir les infrastructures respectant les normes environnementales et sociales de la Banque
mondiale ;
o Assurer la participation des bénéficiaires aux organes de gestion du programme ;
o Améliorer les conditions de travail des élèves qui reçoivent peu les rayons de soleil grâce à une
bonne orientation des élèves ;
Au niveau de la distribution des kits, il est prévu la distribution des kits aux filles de CI et CP pendant 03 ans. Le projet a pu distribuer de kits à 339 395 écolières de CI et CP depuis 2014. Au niveau des cantines scolaires, le projet a appuyé 396 écoles dans 17 communes des 25 ciblées par le programme FCB-PME durant les trois (03) premières années du projet. Le projet a pu dégager des reliquats pour assurer le fonctionnement de 297 écoles à cantine au cours de l’année scolaire 2017-2018. Dans le cadre de l’alphabétisation des adultes, 27 178 personnes ont été alphabétisées au total dont 11 913 femmes sur un total de 26 400 personnes prévues. Le projet a également financé l’Intégration scolaire des enfants à besoins spécifiques à travers le volet ISEH. Cela a permis d’avoir les résultats ci-après :

The World Bank Benin Global Partnership for Education Program (P129600)
Page 82 of 95
• Les parents d’enfants handicapés et des autorités locales des communes du zou ont été
sensibilisés pour susciter leur adhésion et engagement à la cause des enfants handicapés ;
• 287 enfants handicapés ont été identifiés et suivis dans les neuf (09) communes du Zou ;
• Des consultations médicales pour identification des besoins spécifiques de chaque enfant
handicapé ciblé ont été faites ;
• Tous les enseignants ayant les enfants handicapés dans leurs classes ont été formés ;
• Des cours de renforcement ont été organisés au profit des enfants handicapés ;
• Des traitements médicaux généraux et spécialisés (chirurgie et/ou appareillage orthopédique,
rééducation, ORL, ophtalmologie) ont été effectués au profit des enfants handicapés
bénéficiaires ;
• Des aides à la mobilité (tricycles, cannes, vélos) ont été fournis aux enfants concernés.
Au niveau de cette composante, les leçons tirées se résument comme suit :
• les commandes groupées ont permis de gagner du temps dans la réalisation des infrastructures et
d’induire une certaine uniformité au niveau des modules ;
• L’allotissement même s’il permet de gagner du temps dans la réalisation des infrastructures ne
permet pas toujours de préciser l’imputation des responsabilités en cas de malfaçons ;
• la montée en capacité technique des entreprises d’infrastructures a permis d’atteindre une
meilleure qualité des infrastructures ;
• le dispositif de suivi et de contrôle des travaux s’est amélioré avec l’acquisition d’équipements
techniques de contrôle plus pointus ;
• une plus forte mobilisation des communautés autour des chantiers de construction
d’infrastructures scolaires à travers la mise en place des comités locaux de suivi ;
• la prise en compte des mesures de sauvegarde sociale et environnementale dans la mise en œuvre
des infrastructures s’est avérée comme une option positive à pérenniser et à étendre à toutes les
constructions d’infrastructures ;
• l’organisation d’une partie du processus d’acquisition des kits scolaires au niveau central avec
l’implication de l’UATS s’est révélée concluante parce que cela a permis de réduire les délais de
mise en place ;
• le processus d’appel d’offres ouvert pour l’acquisition des kits a permis d’avoir les kits à moindre
coût mais pas des kits de qualité ;
• la régularité des suivis du niveau central et les descentes de l’IGM ont permis d’amoindrir les
dysfonctionnements enregistrés au fil des années au niveau des cantines ;
• la mise en œuvre du Volet ISEH a permis aux parents et la société de comprendre que l'enfant
handicapé est capable d’aller à l’école, de réaliser les mêmes prouesses que les autres enfants et
de sentir épanouir ;
• le Volet ISEH a fondamentalement montré que l’initiative est très intéressante et qu‘elle mérite
d’être étendue à d’autres départements du pays.

The World Bank Benin Global Partnership for Education Program (P129600)
Page 83 of 95
3. Composante 3: Amélioration de la gestion et la gouvernance du secteur
Au niveau de la gestion et du pilotage, la plupart des activités prévues au niveau de cette composante ont été exécutées. La mise en place du Système d’Information et de Gestion de l’Education (SIGE), à la date du 30 avril 2018, montre que tous les quatre (04) lots (lot 2 Equipements centraux informatiques, Equipements réseaux et de sécurité), lot 3 (Equipements périphériques, Micro-ordinateurs, imprimantes scanners), lot 4 (équipements d’énergie et de climatisation) et lot 1 (acquisition de licences de logiciels, de les adaptation, de formation des utilisateurs pour la maintenance et le transfert de compétences) ont été réceptionnés au grand bonheur des acteurs de l’école, avec installation du DATA CENTER au MEMP. En ce qui concerne les Contrats d’objectifs avec les circonscriptions scolaires, des ressources d’un montant total de 460 000 000 F CFA ont été transférées aux circonscriptions scolaires pour le renforcement des inspections et visites de classes inscrites dans les plans d’actions validés par la DIIP. En termes d’évaluation des acquis scolaires, le projet a appuyé financièrement les évaluations ci-après :
• Évaluation nationale des acquis scolaires des élèves du CP et du CM1 ;
• PASEC 2014 performances du système éducatif béninois ;
• Étude d'évaluation et d'observation des enseignants en situation de classe ;
• Evaluation des enseignants sur les livres de grammaire G1&G2 ;
• Evaluation de la maîtrise des contenus notionnels par les enseignants : « Ce que je sais de ce que
j’enseigne » ;
• Etude sur les causes des abandons scolaires des enfants dans les écoles primaires publiques.
De façon globale, les résultats issus de l’ensemble des évaluations montrent que les lignes n’ont pas trop bougé en matière d’amélioration de la qualité des performances des apprenants et des pratiques pédagogiques observées chez les enseignants. L’exécution financière du programme est de F CFA vingt-quatre milliards trois cent quarante sept millions neuf cent soixante huit mille huit cent soixante-trois (24 347 968 863) sur un disponible de F CFA vingt-quatre milliards cinq cent quarante-huit millions huit cent cinq mille (24 548 805 000) au cours de 1 USD = 580,35 F CFA soit un taux d’exécution financière globale de 99,18% au 30 avril 2018.
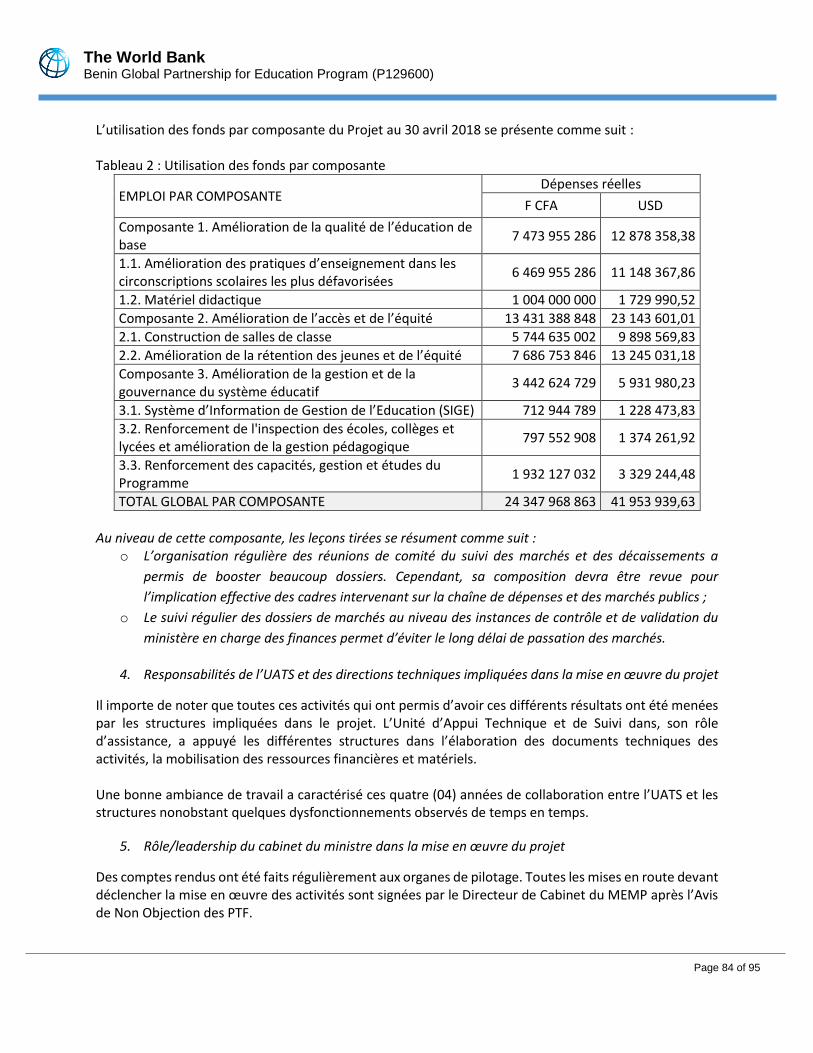
The World Bank Benin Global Partnership for Education Program (P129600)
Page 84 of 95
L’utilisation des fonds par composante du Projet au 30 avril 2018 se présente comme suit : Tableau 2 : Utilisation des fonds par composante
EMPLOI PAR COMPOSANTE Dépenses réelles
F CFA USD
Composante 1. Amélioration de la qualité de l’éducation de base
7 473 955 286 12 878 358,38
1.1. Amélioration des pratiques d’enseignement dans les circonscriptions scolaires les plus défavorisées
6 469 955 286 11 148 367,86
1.2. Matériel didactique 1 004 000 000 1 729 990,52
Composante 2. Amélioration de l’accès et de l’équité 13 431 388 848 23 143 601,01
2.1. Construction de salles de classe 5 744 635 002 9 898 569,83
2.2. Amélioration de la rétention des jeunes et de l’équité 7 686 753 846 13 245 031,18
Composante 3. Amélioration de la gestion et de la gouvernance du système éducatif
3 442 624 729 5 931 980,23
3.1. Système d’Information de Gestion de l’Education (SIGE) 712 944 789 1 228 473,83
3.2. Renforcement de l'inspection des écoles, collèges et lycées et amélioration de la gestion pédagogique
797 552 908 1 374 261,92
3.3. Renforcement des capacités, gestion et études du Programme
1 932 127 032 3 329 244,48
TOTAL GLOBAL PAR COMPOSANTE 24 347 968 863 41 953 939,63
Au niveau de cette composante, les leçons tirées se résument comme suit :
o L’organisation régulière des réunions de comité du suivi des marchés et des décaissements a
permis de booster beaucoup dossiers. Cependant, sa composition devra être revue pour
l’implication effective des cadres intervenant sur la chaîne de dépenses et des marchés publics ;
o Le suivi régulier des dossiers de marchés au niveau des instances de contrôle et de validation du
ministère en charge des finances permet d’éviter le long délai de passation des marchés.
4. Responsabilités de l’UATS et des directions techniques impliquées dans la mise en œuvre du projet
Il importe de noter que toutes ces activités qui ont permis d’avoir ces différents résultats ont été menées par les structures impliquées dans le projet. L’Unité d’Appui Technique et de Suivi dans, son rôle d’assistance, a appuyé les différentes structures dans l’élaboration des documents techniques des activités, la mobilisation des ressources financières et matériels. Une bonne ambiance de travail a caractérisé ces quatre (04) années de collaboration entre l’UATS et les structures nonobstant quelques dysfonctionnements observés de temps en temps.
5. Rôle/leadership du cabinet du ministre dans la mise en œuvre du projet
Des comptes rendus ont été faits régulièrement aux organes de pilotage. Toutes les mises en route devant déclencher la mise en œuvre des activités sont signées par le Directeur de Cabinet du MEMP après l’Avis de Non Objection des PTF.

The World Bank Benin Global Partnership for Education Program (P129600)
Page 85 of 95
Toutes les activités reçoivent l’autorisation du Ministre à travers une fiche ou note à l’attention qui lui est soumise.
6. Leçons à tirer
Les leçons tirées au niveau de la coordination et la gestion du programme se résument aux deux (02) points ci-après :
• les prérequis en matière de connaissance du secteur par deux (02) cadres de l’UATS
(Coordonnateur et SSE) ont permis d’accélérer la mise en œuvre du projet ;
• la signature des mises en route des activités et l’élaboration des fiches et note à l’attention au
MEMP sur les activités clés ont permis de renforcer l’implication des autorités dans la mise en
œuvre des activités du projet.
C. Evolution des indicateurs de développmenent
Les progrès vers les objectifs de développement du Programme ont été évalués par période et au regard de la situation nationale. Jusqu’en 2016, les résultats sont jugés satisfaisants étant donné que quatre des cinq indicateurs de performance clés ont progressé vers les cibles. Pour l’année scolaire 2016-2017, il a été noté un ralentissement de la tendance observée. Ainsi les cibles des indicateurs que sont : (i) le taux brut d'admission au primaire dans les communs ciblées ; (ii) le taux d’achèvement du primaire dans les communes ciblées ; (iii) le taux brut de scolarisation dans le secondaire général au premier cycle dans les communes ciblées n’ont pas été atteintes. L’observation des valeurs atteintes pour ces indicateurs montre qu’au niveau des indicateurs de l’enseignement primaire, cette baisse a été moins importante que celle observée au niveau de la moyenne nationale comme l’indique le tableau ci-dessous. Ainsi au niveau du taux brut d'admission la baisse est de 7 points au niveau nationale contre 5 points au niveau des communes ciblées. La même tendance pour le taux d’achèvement oû les points d’écart sont respectivement de 11 et 9. Sur la base de ces données, la situation est meilleure dans les communes défavorisées que dans les autres. Au niveau du secondaire la chute du seul indicateur suivi dans ce sous-secteur (taux brut de scolarisation dans le secondaire général au premier cycle dans les communes ciblées) est due aux résultats catastrophiques enregistrés au CEP session de 2016. Cette situation est essentiellement due à une baisse des effectifs en 2017 tant au niveau du primaire que du secondaire général. L’analyse des données scolaires de l’année 2018 en cours de finalisation permettra de conclure si cette situation de 2017 est exceptionnelle ou structurelle. Dans le second cas une étude sera réalisée pour mieux comprendre les facteurs explicatifs de cette baisse.

The World Bank Benin Global Partnership for Education Program (P129600)
Page 86 of 95
Tableau 3 : Comparaison des écarts des TBA et TAP entre la moyenne nationale et les communes ciblées entre 2016 et 2017
Benin Communes PME Ecart 2016-2017
2016 2017 2016 2017 Benin Communes PME
Taux d'admission au primaire 146,9% 139,2% 116,0% 110,9% -7,8% -5,1%
Taux d''achèvement 78,8% 68,2% 52,8% 43,6% -10,7% -9,2%
D. Impact du programme dans la mise en œuvre de la politique nationale en matière d’éducation
au Benin
Le Bénin a marqué sa volonté d’accorder la priorité au secteur de l’éducation dans sa stratégie de développement et de lutte contre la pauvreté avec l’adoption du PDDSE, qui offre un cadre cohérent intégrant tous les niveaux d’enseignement. Ainsi, au niveau des sous-secteurs des enseignement primaire et secondaire, du point de vue de la qualité, le renforcement des capacités des enseignants du primaire et la formation initiale donnée aux enseignants du secondaire ont permis de :
(i) renforcer les compétences des enseignants et la prestation découlant de celles-ci ;
(ii) renforcer la gestion pédagogique et le rendement scolaire ; et
(iii) stopper ainsi la détérioration du taux de qualification du corps enseignant.
Ces renforcements de capacités ont permis d’espérer à court et à long terme, une amélioration : de l’encadrement des élèves; de la gouvernance des établissements ; des pratiques professionnelles ; de la gestion du temps scolaire ; des pratiques et techniques d’élaboration des fiches pédagogiques ; de la qualité de l’alphabétisation et de l’éducation des adultes. De plus, la distribution des livres de grammaires G1&G2 et des livrets IFADEM aux enseignants, a contribué à améliorer l’environnement des apprentissages. Les différentes évaluations organisées ont permis de mieux maîtriser les maux qui minent le sous-secteur des enseignements maternel et primaire. Au niveau de l’amélioration du taux de scolarisation et de l’équité, le projet a contribué à lever quelques contraintes qui empêchent l’atteinte de cet objectif. La construction de 118 modules de trois (03) salles de classe entièrement équipés et 232 blocs de latrines au profit du MEMP et 67 modules de quatre (04) salles de classe entièrement équipés et 107 blocs de latrines au profit du MESTFP a permis d’améliorer l’accès et la rétention. La distribution des kits scolaires et le fonctionnement des cantines au niveau des communes de l’Alibori ont permis d’améliorer les indicateurs d’accès et de rétention de cette zone. Les inégalités filles/garçons en matière de fréquentation scolaire dans le primaire ont continué de se réduire.
The World Bank Benin Global Partnership for Education Program (P129600)
Page 87 of 95
II. Analyse critique de l’action de la Banque mondiale, du Gouvernement et de l’assistance technique
A. Appréciation de l’action de la Banque mondiale et des autres PTF au cours de l’exécution du
projet
1. Principales décisions ayant favorisé l’exécution du projet
Les actions de la Banque mondiale et des autres PTF ont été globalement satisfaisantes au cours de l’exécution du projet. La Banque a été attentive aux différentes contraintes et difficultés qui auraient pu affecter l’exécution du Projet. Dans ce cadre, un échange permanent est établi avec les responsables en charge du programme au niveau de la Banque en vue de trouver des solutions appropriées pour les diverses questions posées. Ceci a permis l’atteinte des objectifs du Projet. Dans le cadre du renforcement des capacités des enseignants, la Banque a suggéré l’évaluation des enseignants afin de les catégoriser pour augmenter l’efficacité de ces formations. Cette démarche a permis de cibler les formations et d’éviter de donner le même type de formation à tous les enseignants en sachant qu’ils n’ont pas tous le même niveau. La Banque a aussi appuyé le projet dans le processus de passation communautaire en acceptant que le processus de sélection des fournisseurs soit fait au niveau central quitte aux écoles d’émettre des bons de commande à ces fournisseurs retenus. Ce processus communautaire amélioré a permis de gagner du temps et de réaliser des économies. La Banque a également accepté que les économies réalisées grâce au processus de passation de marché basé sur le moins disant notamment sur les constructions des salles de classe, l’acquisition des kits etc. soient affectées à d’autres activités pertinentes qui rentrent dans le cadre du projet. Le Plan de passation de marchés (PPM) adopté et actualisé périodiquement a favorisé la réalisation de plusieurs activités qui ont conduit à plus de visibilité et de transparence dans la mise en œuvre des activités. La Banque a fortement appuyé le gouvernement dans la rédaction de ses deux requêtes de restructuration du projet. L’appui apporté par la Banque au cours de l’évaluation des acquis des apprentissages à travers le recrutement d’un consultant international en évaluation a permis de renforcer les compétences des cadres béninois dans ce domaine.
2. Suivi du projet par la Banque mondiale (missions de suivi et d’appui technique)
Depuis la préparation du projet jusqu’à sa mise en œuvre, les Partenaires Techniques et Financiers du secteur de l’éducation au Bénin ont eu une forte implication à travers les creusets suivants :
• le Groupe Technique Education ou cadre de concertation des PTF ;
• le Groupe Local Education (GLE) ;
• les revues sectorielles et sous-sectorielles ; et
• les missions conjointes d’appui technique et de suivi.

The World Bank Benin Global Partnership for Education Program (P129600)
Page 88 of 95
En termes de mission d’appui technique et de suivi, le projet a connu une dizaine de missions de supervision de la Banque mondiale (au moins une mission tous les six mois). L’année 2016 a, sur le plan technique, enregistré la tenue de la revue à mi-parcours (du 30 mai au 03 juin 2016) qui a permis de faire le point sur la mise en œuvre des activités du projet et de procéder à une analyse approfondie des prévisions au regard du temps écoulé et du temps restant. Ces évaluations à mi-parcours ont permis d’identifier les faiblesses et proposer des mesures correctives. La Banque a mené des missions spécifiques de supervision du programme de constructions scolaires et de sauvegarde environnementale et sociale.
3. Principales leçons à tirer
Les leçons tirées de cet appui de la banque mondiale et des autres PTF se résument essentiellement à :
• la revue à priori des dossiers des marchés permet de faire évoluer favorablement l’étude des
dossiers par les acteurs de la chaîne de contrôle des marchés publics ;
• l’organisation périodique des missions d’appui technique et de suivi des Partenaires Techniques et
Financiers du programme permet de suivre l’évolution, la mise en œuvre des activités et permet
de faire le recadrage de la mise en œuvre de ces activités.
B. Appréciation de l’action du Gouvernement au cours de l’exécution du projet
1. Principales décisions ayant favorisé l’exécution du projet
Au cours de la mise en œuvre du projet, le gouvernement a pris un certain nombre de décisions qui ont favorisé l’exécution du projet. Au nombre de ces activités, il y a :
o la coordination des activités de formations continues par une seule structure (INFRE) au niveau
de la maternelle et du primaire s’est révélée comme une option pertinente et efficace ;
o le reversement des fonds du projet irrégulièrement dépensés dans le cadre des cantines
scolaires ;
o les sanctions administratives prises à l’encontre des directeurs fautifs (concernés par les
irrégularités au niveau des cantines scolaires).
Le gouvernent a initié des contrôles conjoints de l’IGM du MEMP et de l’IGF en vue de s’assurer de la bonne gestion des ressources mises à disposition des différentes structures et des écoles afin d’en tirer les leçons pour les projets futurs.
2. Principales décisions (ou absence de prise de décision) ayant freiné l’exécution du projet
Le changement de régime au cours de la mise en œuvre du projet a induit un certain nombre de décisions qui ont freiné un tant soit peu la mise en œuvre du projet PME. Au nombre de ces décisions, il y a :
o la suppression, par le conseil des ministres, des frais d’entretien au profit du personnel
administratif et assimilés a freiné la mise en œuvre de certaines activités du projet ;
o la fusion des circonscriptions scolaires en région pédagogique ;
o l’interdiction du déroulement des formations continues des enseignants du primaire lors des jours
œuvrés.
The World Bank Benin Global Partnership for Education Program (P129600)
Page 89 of 95
Ces décisions bien que salutaires ont eu un impact négatif sur l’exécution des activités programmées par le projet.
3. Suivi du projet au niveau des Ministères de l’éducation impliqués, des ministères du Développement, de l’Economie et des Finances
Le secteur de l’éducation a connu au cours de la décennie des avancées notables dues à la stabilité politique et sociale du pays et aux mesures de soutien à la scolarisation prises par le gouvernement avec l’appui des partenaires au développement dans le cadre de la mise en œuvre du Plan Décennal de Développement du Secteur de l’Education (PDDSE) 2006-2015 et dans le cadre de la mise en œuvre du projet. Le pilotage du secteur de l’éducation se fait au niveau central, déconcentré, décentralisé dans le cadre des lois sur la décentralisation adoptées par le Bénin depuis 1999. Dans le cadre du PDDSE actualisé (2013 à 2015) et la mise en œuvre du projet, quatre (04) instances de pilotage sont prévus au niveau sectoriel. Elles ont un rôle transversal dans le pilotage et la coordination de la mise en œuvre du PDDSE. Leurs missions devraient concourir à la cohérence et à l’efficacité par la coordination des actions des ministères. Ces structures ont activement participé au suivi de la mise en œuvre du projet. Elles sont :
o Le Comité de Pilotage du Secteur de l’Education (CPSE) ;
o Le Comité de Coordination du Secteur de l’Education (CCSE) ;
o Le Secrétariat Technique Permanent du PDDSE (STP-PDDSE) ;
o Le Comité de Suivi des Décaissements et des Marchés (CSDM).
Le Comité de Suivi des Décaissements et des Marchés (CSDM) structure placée sous la présidence du directeur de cabinet du Ministre chargé des finances a suivi et facilité la mise à la disposition des structures impliquées dans le projet, des ressources nécessaires à la mise en œuvre des activités. Le ministère en charge du plan et du développement a également joué un rôle prépondérant au niveau du suivi du projet à travers la revue périodique des projets financés par la Banque mondiale. Outre ces revues, les outils de collecte d’indicateurs de suivi et les fiches signalétiques des projets sont régulièrement renseignés par le projet au profit de ces ministères.
C. Evaluation de l’efficacité et de la qualité des relations entre la Banque mondiale et le
Gouvernement durant l’exécution du projet
Pour mieux assoir les relations entre la Banque mondiale (PTF) et le gouvernement, des creusets de concertation et de partenariats ont été créés. Il s’agit de :
o le Groupe Local Education (GLE) Créé par arrêté n°188/MEMP/CAB/ DC/DPP/DRFM/STP-
PDDSE/SP du 1er juin 2015 portant création, composition, attributions et fonctionnement du GLE,
il réunit les ministères en charge de l’éducation et du développement, les Partenaires Techniques
et Financiers, ONG et autres organisations de la société civile, les parents d’élèves, les partenaires
sociaux, des associations nationales dont l’Association Nationale des Communes du Bénin, le
secteur privé, etc. ; en tant que tel, le GLE constitue « un cadre de renforcement des acquis du
secteur de l’éducation et de promotion d’un partenariat dynamique pour la promotion d’une

The World Bank Benin Global Partnership for Education Program (P129600)
Page 90 of 95
éducation inclusive et de qualité pour tous… » (article 1er) et incarne le pilotage participatif des
questions de l’éducation ;
o le Groupe Technique Education (GTE). Il est un cadre de concertation entre les PTF, les ONG
actives dans le secteur de l’éducation et le gouvernement, qui se réunit mensuellement autour
des thématiques de l’éducation et sous la présidence du chef de file des PTF.
Ces cadres de concertations témoignent de la bonne qualité des relations entre la Banque mondiale et le gouvernement Béninois en général et les autorités en charge du secteur en particulier. Cette bonne et efficace relation a fortement contribué à créer un environnement favorable pour la bonne exécution du projet. Ainsi, les autorités du secteur de l’éducation n’ont ménagé aucun effort pour accompagner les différentes missions de la Banque et assurer la mise en œuvre des différentes recommandations.
D. Evaluation des performances des différentes institutions, bureau d’études et consultants ayant
participé à la réalisation du projet (coût, bénéfices)
D’une manière générale, les différents acteurs impliqués dans l’exécution du projet ont convenablement rempli leurs missions. Le nouveau dispositif de formation des enseignants mis en œuvre à partir de 2016 en confiant les formations continues à une seule structure a bien fonctionné. Il a permis de réduire les pertes de temps et de mieux organiser les formations sur le terrain. Les rapports d’étude et d’évaluation produits par les bureaux d’étude et d’évaluations tels qu’Education International, LEADD et le consultant international SEIDOU GARBA sont de bonne qualité. A travers leur intervention, le transfert des compétences a enregistré globalement des résultats satisfaisants malgré quelques imperfections. En ce qui concerne les constructions scolaires, les agences AGETUR et AGETIP et les MO ont joué pleinement leur rôle et ont livré toutes les infrastructures qui leur ont été confiées même si le problème de qualité se pose à quelques endroits. Leur prestation a permis de faire des économies au niveau de cette sous composante de construction. Les consultants recrutés par le projet à savoir consultants en communication et en sauvegarde environnementale et sociale ont permis, chacun dans son domaine, d’améliorer les prestations du projet dans ces domaines. L’appui de la Banque mondiale à travers les consultants en construction d’infrastructures et en sauvegarde environnementale et sociale a permis de renforcer le dispositif existant et d’améliorer les performances des structures et des agences en charge de ces volets du projet.
III. Perspectives futures pour la pérennisation des acquis Le processus d’élaboration du nouveau plan sectoriel de l’éducation post 2015 étant achevé, le Bénin dispose d’un nouveau plan sectoriel qui va à l’horizon 2030. Ce plan permettra donc d’assoir une base pour la pérennisation des acquis du programme FCB-PME. D’ailleurs, la nouvelle requête pour le

The World Bank Benin Global Partnership for Education Program (P129600)
Page 91 of 95
financement du PME en cours d’élaboration s’appuie sur ces acquis. Les actions à mener dans le futur doivent se consacrer sur comment :
o assurer un meilleur accueil des apprenants ;
o assurer le maintien des enfants dans l’éducation ;
o mettre en œuvre des mesures supplémentaires d’équité et de justice sociale pour certaines zones et certaines catégories sociales (discrimination positive, mesures incitatives).

The World Bank Benin Global Partnership for Education Program (P129600)
Page 92 of 95
ANNEX 6. SUPPORTING DOCUMENTS
All aide memoires under the project. All ISRs under the project. All Withdrawal Applications under the project. Arrangement de Financement Commun Entre le Gounvernement du Benin et les Partenaires Techniques et Financiers Relatif au Fonds Commun Budgetaire en Faveur du Plan Decennal de Developpment du Secteur de L’Education (PDDSE) 2006-2015. Dossat, Luce et Gbenou, Pieerre A. Evaluation du Niveau des Enseignants des Ecoles Primaires du Benin en Didactique des Mathematiques et Elaboration d’un Programme de Formation: Rapport d’Evaluation, 2013. Education Internationale. Realisation de L’Etude d’Evaluation et d’Observation des Enseignants en Situation de Classe au Profit du Programme Fonds Commun Budgetaire-Partenariat Mondial Pour L’Education (FCB-PME), 2017. Fiche Synthese sur le Programme FCB-PME: Extension du volet PME, 2017. Garnier, Maurice. Les Ecoles Efficaces Au Benin: Etude Diagnostique de Mai 2008, 2008. Global Partnership for Education Grant Agreement: Education For All – Fast Track Initiative Catalytic Trust Fund, 2014. Ministere des Enseignement Maternel et Primaire. Evaluation Nationale des Acquis Scolaires des Eleves du CP et du CM1, 2018. Ministere des Enseignement Maternel et Primaire et Ministere de L’Enseignement Secondaire, Technique et de la Formation Professionnelle. Rappory de Fin d’Execution du Volet PME du PRogramme FCB-PME, 2018. Ministere des Enseignement Maternel et Primaire et Ministere de L’Enseignement Secondaire, Technique et de la Formation Professionnelle. Rapport Intermediare Financiere No. 15, 2018. Ministere des Enseignement Maternel et Primaire, Ministere de L’Enseignement Secondaire, Technique et de la Formation Professionnelle et Ministere de la Culture de L’Artisanat, de L’Alphabetisation et du Tourisme. Cadre Politique de Reinstallation et de Compensation des Populations, 2012. Ministere des Enseignement Maternel et Primaire, Ministere de L’Enseignement Secondaire, Technique et de la Formation Professionnelle et Ministere de la Culture de L’Artisanat, de L’Alphabetisation et du Tourisme. Project PME Benin: Cadre de Gestion Environmentale et Sociale Rapport Definitif, 2012.

The World Bank Benin Global Partnership for Education Program (P129600)
Page 93 of 95
Ministere des Enseignement Maternel et Primaire et Institut National pour la Formation et la Recherche en Education. Mise en Oeuvre Efficiente du Travail en Groupe en Situation de Classe: Cahier de L’Apprenant, 2017. Ministere des Enseignement Maternel et Primaire et Institut National pour la Formation et la Recherche en Education. Mise en Oeuvre Efficiente du Travail en Groupe en Situation de Classe: Guide du Formateur, 2017. Ministere des Enseignement Maternel et Primaire et Institut National pour la Formation et la Recherche en Education. Module de Formation des Enseignants sur la Didactique des Mathematiques: Cahier de l’Apprenant, 2017. Ministere des Enseignement Maternel et Primaire et Institut National pour la Formation et la Recherche en Education. Module de Formation des Enseignants sur la Didactique des Mathematiques: Guide du Formateur, 2017. Ministere des Enseignement Maternel et Primaire et Institut National pour la Formation et la Recherche en Education. Module de Formation des Enseignants sur L’Evaluation des Apprentissages Conception et Elaboration des Instruments de Mesure: Cahier de l’Apprenant, 2017. Ministere des Enseignement Maternel et Primaire et Institut National pour la Formation et la Recherche en Education. Module de Formation des Enseignants sur L’Evaluation des Apprentissages Conception et Elaboration des Instruments de Mesure: Guide du Formateur, 2017. Ministere des Enseignement Maternel et Primaire et Institut National pour la Formation et la Recherche en Education. Module de Formation des Enseignants sur la Gestion des Classes Multigrades: Guide du Formateur, 2017. Ministere des Enseignement Maternel et Primaire et Institut National pour la Formation et la Recherche en Education. Module de Formation des Enseignants sur la Gestion des Classes Multigrades: Cahier de l’Apprenant, 2017. Ministere des Enseignement Maternel et Primaire et Institut National pour la Formation et la Recherche en Education. Module de Formation des Enseignants sur la Gestion du Temps Apprentissage: Cahier de l’Apprenant, 2017. Ministere des Enseignement Maternel et Primaire et Institut National pour la Formation et la Recherche en Education. Module de Formation des Enseignants sur la Gestion du Temps Apprentissage: Guide du Formateur, 2017. Ministere des Enseignement Maternel et Primaire et Institut National pour la Formation et la Recherche en Education. Module de Formation des Enseignants sur les Outils Linguistiques: Cahier du L’Apprenant, 2017.
The World Bank Benin Global Partnership for Education Program (P129600)
Page 94 of 95
Ministere des Enseignement Maternel et Primaire et Institut National pour la Formation et la Recherche en Education. Module de Formation des Enseignants sur les Outils Linguistiques: Guide du Formateur, 2017. Ministere de L’Enseignement Secondaire, Technique et de la Formation Professionnelle et Ministere des Enseignements Maternel et Primaire. Rappor d’Audit des Etats Financiers du Programme FCB-PME, 2015. Ministere de L’Enseignement Secondaire, Technique et de la Formation Professionnelle et Ministere des Enseignements Maternel et Primaire. Rappor d’Audit des Etats Financiers du Programme FCB-PME, 2016. Ministere de L’Enseignement Secondaire, Technique et de la Formation Professionnelle et Ministere des Enseignements Maternel et Primaire. Rappor d’Audit des Etats Financiers du Programme FCB-PME, 2017. Ministere des Enseignements Maternel et Primaire et Direction de L’Alimentation Scolaire. Criteres de Selection des Ecoles Beneficiares de la Cantine Scolaire Gouvernementale. Ministere des Enseignements Maternel et Primaire et Unite d’Appui Technique et de Suivi de Programme FCB-PME. Audit Technique et Comparatif Cout/Qualite des Infrastructures Scholaires Realises par les Projets/Programmes, les MOD, les Communes, et les Ministeres Sectoriels, 2018. Ministere des Enseignements Maternel et Primaire et Ministere de la Culture, de L’Alphabetisation, de L’Artisanat et du Tourisme. Rapport d’Audit des Comptes Exercice 2014, 2014. Ministere des Enseignements Maternel et Primaire. Rapport de L’Evaluation des Enseignants Sur les Livres de Grammaire G1&G2, 2017. Ministere en Charge de L’Education. FCB-PME Manuel d’Execution, 2014. Note d’analyse sectorielle du système d’éducation et de la formation pour plus de mesures d’équité et de justice sociale le système d’éducation et de formation béninois, 2017. PASEC. PASEC2014 Performances des Systemes Educatifs en Afrique Subsaharienne Francophone: Competences et Facteurs de Reussite au Primaire, 2015. Rapport de Mission de Suivi des Cantines Scolaires Financees sur le Programme FCB/PME, 2017. Rapport de Mission de Suivi des Cantines Scolaires Financees sur le Programme FCB/PME 2ieme phase, 2018. Republique du Benin, Ministere des Enseignements Maternel et Primaire, et Cabinet du Ministre. Rapport de Presentations des Resultats de L’Evaluation Sur les Acquis des Eleves du CP et du CM1 dans les Ecoles Primaires Publiques et Privees du Benin, 2012.

The World Bank Benin Global Partnership for Education Program (P129600)
Page 95 of 95
Republique du Benin. Plan Sectoriel de L’Education Post 2015 (2018-2030), 2017. Republique du Benin. Rapport d’audit (version préliminaire) Audit institutionnel, organisationnel et fonctionnel du secteur de l’éducation du Bénin, 2011. Secretariat Technique Permanent du Plan Decennal du Developpement du Secteur de L’Education. Rapport de la Premiere Enquete de Satisfaction des Acteurs et Beneficiares du Programme FCB/PME, 2018. UNESCO Pole de Dakar et La Republique de Benin. Diagnostic du système éducatif béninois pour une revitalisation de la politique éducative dans le cadre de l’actualisation du programme décennal de développement du secteur de l’éducation, 2013. World Bank. Additional Instructions: Disbursement. Official Letter, 2014. World Bank. Catalytic Fund Program Document on an Education For All – Fast Track Initiative in the Amount of US$76.1 Million to the Republic of Benin for a Education Sector Development Program, 2008. World Bank. Concept Note on a Proposed Grant in the Amount of US$ 17 Million to the Republic of Benin for Benin Global Partnership for Education Project Phase 3 (P167432), 2018. World Bank. Country Partnership Strategy FY13-17 for The Republic of Benin, 2013. World Bank. Country Partnership Strategy for Benin FY19-FY23, 2018. World Bank. Draft Minutes of Concept Note Review Meeting Benin GPE Project (P167432), 2018. World Bank. First Amendment to the Grant Agreement. Official Letter, 2015. World Bank. Implementation Completion and Results Report (TF-91947) on a Grant in the Amount of SDR49.4 Million (US$76.1 Million Equivalent) to the Republic of Benin for an Education For All-Fast Track Initiative Program (P110576), 2012. World Bank. International Development Association Project Appraisal Document on a Proposed Grant in the Amount of US$ 19.4 Million Equivalent to the Government of Benin for a Benin Global Partnership for Education Project Phase 3, 2018. World Bank. Project Appraisal Document on a Proposed Grant Amount of US$42.3 Million to the Republic of Benin for a Global Partnership for Education Project, 2014. World Bank. Restructuring Paper on a Proposed Project Restructuring of Benin Global Partnership for Education Program Grant March 21, 2014 to the Republic of Benin, 2015. World Bank. Restructuring Paper on a Proposed Project Restructuring of Benin Global Partnership for
Education Program Approved on March 21, 2014 to Government of Benin, 2017.