Embed Size (px)
Citation preview

1
Imperfect information and contracts in the market for ideas: evidence from the licensing of biomedical inventions*
Deepak Hegde Walter A. Haas School of Business University of California, Berkeley
JOB TALK PAPER November 08, 2009
ABSTRACT
This study evaluates the influence of imperfect information on the structure of arm’s-length contracts in the market for ideas. I employ a sample of 505 licensing contracts between inventors and developers of biomedical inventions to test the predictions of hidden quality and unobservable effort theories about contractual payment terms. My analysis reveals: (a) royalty rates provide incentives for the transfer of inventors’ “tacit knowledge” or unobservable inventor effort (b) fixed fees address the transfer of inventors’ “codified know-how” or observable inventor effort, and unobservable developer effort (c) minimum royalty payments are used by informed inventors to signal their inventions’ hidden quality, and (d) milestone payments are related to uncertainties in the development of valuable early-stage inventions. Firms use a variety of contractual provisions to cope with the information hazards inherent in the exchange of new ideas.
Work in progress; please do not quote or cite without permission.
* I am grateful to Thomas Varner of Cornerstone Research for data on license agreements and David Mowery for his guidance. For their helpful suggestions, I thank: Bronwyn Hall, Steven Tadelis, Brian Wright, Catherine Wolfram, Bhaven Sampat, Ernesto Dal Bo, Jennifer Walske, Rui de Figueiredo, Pablo Spiller, Pedro Gardete, Justin Tumlinson, Mohan Turaga, Orie Shelef and participants at the Oliver E. Williamson Seminar, Innovation Seminar and the Business and Public Policy Seminar at the University of California, Berkeley. The Kauffman Dissertation Fellowship program and the Bradley Foundation generously funded this study.

2
1 Introduction
The market for ideas is characterized by imperfect information. The inventors of a new idea and those who seek to
develop it may have different expectations regarding the idea’s quality; yet credible demonstration of quality can
risk the idea’s expropriation by potential buyers (Arrow 1962).1 This hidden quality problem poses difficulties
for the two parties to agree upfront on a price for the idea. Even if they agree on a price, the parties may differ in
their incentives to invest unobservable effort required to develop the idea. “Arm’s-length” transactions in the
market for ideas are hence hard to achieve, and numerous theoretical studies consider the design of optimal
contracts to mitigate imperfect information problems.2
Agency theory recommends mitigating the problems – adverse selection (hidden quality) and moral
hazard (unobservable effort) – with two-part payment contracts consisting of upfront fees and revenue-based
royalty rates. According to adverse selection models, the informed party uses the two parts as signaling devices to
convince the uninformed party about the hidden quality of its inputs (e.g. Lazear 1986, Gallini & Wright 1990).
Thus, privately informed inventors signal their ideas’ superior quality by offering contracts with high royalty rates
and low upfront fees to developers,
3 while privately informed developers compensate superior ideas with high
fees upfront and low royalty rates. According to moral hazard models, two-part payments provide the parties with
appropriate incentives to invest unobservable effort in developing the idea (e.g. Holmström 1979, Jensen &
Thursby 2001). Thus, when developers require inventors’ unobservable effort in development activities, the
optimal contract favors royalty rates, while inventors concerned about unobservable developer effort prefer
upfront payments.4
1 In this study’s setting, patents allow the inventor to reveal the idea, but not the idea’s quality, without the fear of expropriation. Accordingly, I focus on the hidden quality problem, not the inventors’ expropriation concerns here. Anton and Yao (1994) theoretically investigate the latter problem.
2 Kamien (1992) surveys relevant theory. Recent theoretical studies on the topic are: Arora (1995), Macho-Stadler et al (1996), Jensen & Thursby (2001), Crama et al (2008), and DeChenaux et al (2009). 3 The intuition is that because royalty rates are expressed as a percentage of revenues and revenues reveal the true quality of an idea, an inventor informed of her ideas’ superior quality separates herself from inferior inventors by accepting royalty rate payments instead of upfront fees. Uninformed developers commit to such contracts since royalty payments to the inventor will be low if the idea turns out to be bad. 4 This is because royalty rates tie the inventor’s income to revenues which increase with effort.

3
The predictions of theory notwithstanding, and because transactions-level data are hard to obtain, we do
not yet know how real world contracts between inventors and developers of new ideas deal with the information
hazards. Thus, the goal of this study is to test whether the provisions of such contracts are consistent with the
predictions of two-sided hidden quality and unobservable effort theories. For this purpose, I employ a unique
hand-collected sample of 505 licenses between inventors and developers of biomedical inventions negotiated
during the years 1995-2008. The licenses were reported as “material” by public corporations in their U.S.
Securities and Exchange Commission (SEC) filings, and represent high value transactions (the sample mean
upfront payment to inventors is $1.5 Million). I construct contract-level proxies for the private information of
inventors and developers, the inventions’ hidden quality, and the two parties’ unobservable effort, and link the
proxies to cross-sectional variation in contractual payment terms. Although theory focuses on upfront fees and
royalty rates as primary payment terms, my analysis also examines the minimum royalty payments and milestone
payments found in biomedical licenses.
Inventor-developer engagements in the biomedical industry provide an ideal setting to assess imperfect
information theories for the following reasons: (i) the development process for new drugs and devices is
expensive, lengthy, and uncertain (the mean drug development process costs $ 350 Million, takes 7.5 years, and
has a success probability of 18%)5,6(ii) since inventors of drugs and devices often lack downstream capabilities,
they license out their inventions to specialist developers for testing, manufacturing, and marketing (51% of the
drugs launched during 1981-2008 were associated with at least one license agreement)7
5 Drug “development” refers to the activities between the filing of an “Investigational New Drug” application filed before the start of Phase-1 clinical trials and the approval of a “New Drug Application” by the U.S. FDA. NDA approval signifies readiness for marketing. Most medical devices and instruments are exempt from clinical trials but require either a premarket notification (510K) or premarket approval from the FDA.
(iii) the uncertain value of
inventions at license date, and the division of labor between inventors and developers can lead to divergent
assessments of the inventions’ quality and adverse selection (iv) the commercial success of inventions is closely
tied to the parties’ application of hard-to-observe “tacit knowledge” in post-agreement development activities,
raising the potential for moral hazard (70% of licensed biomedical inventions require significant “redesign and
6 These mean statistics are representative of drugs and not medical devices. The statistics also mask significant therapy-class level variation in development costs, times and success probabilities (see DiMasi et al 2003). 7 This estimate is from Pharmaprojects, a leading drug-development database.

4
development” after agreement date)8
My analysis finds that unobservable inventor effort is significantly correlated with higher royalty rates,
and unobservable developer effort with higher upfront fees. These ceteris paribus results are consistent with the
predictions of two-sided moral hazard models which resolve unobservable effort with revenue-sharing incentives.
Contracts between developers and inventors who are informed of the value of their high quality inventions specify
higher minimum royalty payments, a finding broadly consistent with the prediction of inventor adverse selection
models. Minimum royalty payments, like payments from royalty rates, are contingent on inventions’ successful
commercialization; but unlike the latter they do not incur the costs of verifying developers’ outputs. Inventions’
quality that is hidden to both parties at agreement date is positively related to milestone payments, suggesting the
payments deal with uncertainty about the viability of early-stage inventions. Overall, license contracts for
biomedical inventions provide incentives to address the hazards posed by the unobservable efforts of inventors
and developers, inventors’ private information about hidden quality, and uncertainty associated with the
development of novel inventions. The contractual provisions are broadly consistent with the prescriptions of
agency theory, but the diversity of provisions suggests a need for further modeling and empirical research.
, and (v) patents are known to effectively protect inventors’ intellectual
property in the biomedical industry and facilitate the contracting of ideas (Cohen et al 2000), entailing a close
match between the setting assumed by the theories and the real world transactions analyzed here.
This study contributes to our understanding of contracts, and the market for ideas. Previous large sample
analyses of contracts under imperfect information have focused almost exclusively on financial contracting,
business franchising, and sharecropping.9
8 According to a survey of biomedical licensors and licensees by the Licensing Executive Society (2008).
But the analyses have confronted, with limited success, the issues of
unobservable revenues, endogenous measures of hidden quality and effort, and a setting where imperfect
information about product quality is a secondary concern at best. This study presents a unified analysis of two-
sided hidden quality and unobservable effort explanations for contractual incentives in a context where the
information hazards are salient. My analysis exploits unique contract-level data, novel proxies, and measures for
9 Hart (2001) surveys agency explanations for the structure of financial contracts. Martin (1988), Lafontaine (1993), and Brickley (2002) are examples from franchising, and Laffont & Matoussi (1995) recently analyze sharecropping contracts.

5
unobserved revenues to remedy the limitations of prior studies. Second, my findings are based on a sample of
high-value transactions among sophisticated parties most likely to adopt contractual safeguards as prescribed by
theory to mitigate the information problems. My findings accordingly suggest contractual strategies for the larger
population of inventors and developers. The insights from this study can be extended to a variety of contexts
where creators of new ideas and those who commercialize them contract under imperfect information; for
example, in the book publishing, movie production, and consulting industries.
The study is not without limitations. I do not observe the revenues of licensed inventions and use forward
citations of licensed patents and therapeutic category fixed effects to control for within- and across- product class
variation in unobserved commercial value (revenues are also unobserved by the contracting parties at agreement
date). I discuss the implications of this issue, and any potential biases in findings due to the endogeneity between
payment terms and proxies for hidden quality and effort in the following sections.
Section 2 reviews imperfect information theories and their empirical implications for the structure of
contractual payments. Section 3 describes my sample and sampling issues. Section 4 describes revenue-sharing
terms, proxies for imperfect information and control variables. Section 5 discusses regression specifications,
limitations of my identification strategy, and results. Section 6 concludes with a discussion of findings and
avenues for future research.
2 Empirical implications of imperfect information theories
2.1 Framework and assumptions
Consider an inventor of a new drug or medical device. The inventor has monopoly power over her invention
protected by patents but does not have the downstream capabilities to test, manufacture, or market the invention.
The inventor has three options to profit from her invention – acquire downstream capabilities, enter into an
alliance with a downstream firm to jointly develop the invention, or license the invention to a downstream firm.10
10 The inventor retains legal ownership of the invention under licensing. An alternative means of dealing with imperfect information is the sharing of ownership rights as in alliances or joint ventures (Aghion & Tirole 1994). Lerner & Merges (1998) analyze the allocation of control rights in biomedical R&D alliances.

6
A “license” is an arm’s-length contractual arrangement between two legally independent business entities
whereby the licensee (the party that commercializes the invention, referred to as “developer” throughout the
paper) pays the licensor (the “inventor”) for the right to “use, make and sell” the latter’s invention. The theoretical
models discussed here examine contractual payment terms, contingent on the inventor’s decision to license.
These models all share the following assumptions.
A1: The inventor has a comparative disadvantage in commercializing the invention relative to the
developer and the parties do not compete in downstream markets.
A2: Inventor and developers do not engage in repeat transactions for the same invention and have no
incentive to establish reputations.11
A3: Inventor and developer are risk-neutral.
A4: Licenses specify two types of payments to the inventor – a lump-sum fee (f) paid upfront only
once for the duration of the contract, and royalty payments specified as a percentage of the product’s
revenues called royalty rate (r).
A common implication of the models is that f and r are negatively related when revenues are held
constant (i.e. f is the net present value of future payments given the amount of royalties paid to the inventor).
2.2 The perfect information benchmark
Kamien and Tauman’s (1986) model provides a perfect information “benchmark” against which to assess
the effects of information hazards on the structure of payments. The model assumes that both inventor and
developer are perfectly informed about the invention’s quality.12
11 Even if inventors do not deliberately overstate their invention’s value for reputation’s sake, they have a well documented tendency to be overly optimistic about their invention’s value (Camerer & Lovallo 1999).
With perfectly informed parties and no inventor
effort post-license, a fixed-fee license (i.e. r = 0) is optimal because: (a) a fixed payment, unlike a running royalty,
does not increase the marginal costs of the downstream developer, (b) developers retain the full profits from the
final product, providing first-best incentives for downstream effort, and (c) the inventor may find it costly to
verify the developer’s outputs on which royalty payments are based.
12 I use “quality” synonymously with commercial value or expected revenues throughout this paper.

7
With a competitive market for licenses, Kamien and Tauman show that the inventor charges a fixed fee
that fully extracts the invention’s value from the developer. Hence, with risk-neutral parties, perfect information
predicts a license with r=0 and f directly proportional to the invention’s quality.
H0: With perfectly informed parties, the fixed fee is increasing in the invention’s quality, when all other
variables are held constant.
2.3 Empirical implications of hidden quality
The quality of most biomedical inventions, in an expected value sense, is not perfectly known to either
party at license date. Uncertainty about quality stems from factors like the technical and commercial feasibility of
inventions, delays in testing and regulatory approval of new drugs, manufacturing and marketing challenges of
new products, and the threat of entry by competitors. Inventors and developers often differ in their knowledge of
these factors, leading them to divergent assessments of an invention’s quality. Whether the inventor or the
developer is better informed of this “hidden” quality determines the identity of the adversely selected party.
Gallini & Wright (1990) model inventors with private information about their inventions’ quality.
Privately informed inventors have an incentive to overstate their invention’s quality to extract higher payments
from developers. Potential developers, wary of this hidden quality problem, may be unwilling to license in
inventions without credible assurances of their quality. In this situation, an inventor of a high-quality invention
can separate herself from an inferior inventor by offering a contract that makes her payments contingent on the
final product’s commercial performance.13,14
13 In Gallini & Wright (1990), both low-quality and high-quality inventions are profitable to the developer, but high-quality inventions more so. Since royalty rates distort downstream output, the low-type inventor finds payments from royalties less lucrative than fixed payments. In the separating equilibrium, low-type inventors extract the full value of their inventions from developers (because markets for licenses are assumed competitive), and high-quality inventors leave some “information rents” to the developer.
Under a royalty scheme, the developer knows that inventor
payments will be small if the invention’s true quality is low, and commits to the license. Hence, royalty rates
serve as a credible signaling device for inventors with high quality inventions.
14 Lazear (1986) is similar to Gallini & Wright (1990) in spirit. The former predicts performance contingent employment contracts to address asymmetric information about employee type. The idea that informed principals signal their quality with revenue-sharing offers has been empirically investigated in various settings including entrepreneurial finance (Leland & Pyle 1977) and franchising (Lafontaine 1993).

8
H1a: With privately informed inventors, the royalty rate is increasing (and the upfront fee decreasing) in the
invention’s hidden quality, when all other variables are held constant.
In many cases, developers with extensive expertise in evaluating and commercializing inventions are
better informed than inventors about the quality of new ideas. Beggs (1992) models privately informed developers
and predicts that informed developers confident about the invention’s superior quality will prefer contracts with
high upfront fees (and low r).15
H1b: With privately informed developers, the royalty rate is decreasing (and the upfront fee increasing) in the
invention’s hidden quality, when all other variables are held constant.
Equivalently, informed developers offer contracts with high r (and low f) when
they expect the invention to be of dubious quality.
2.4 Empirical implications of unobservable effort
Biomedical inventions typically require significant development after their license, and before
commercialization.16
In Jensen & Thursby’s (2001) model, university-based inventors prefer to focus their efforts on research
rather than commercialization, and therefore shirk in the latter activity when their efforts are not easily observed
by the developer. A fixed fee provides no incentives for inventors to invest effort in post-license development
activities. Royalty payments solve this inventor moral hazard problem by tying the inventor’s income to the
invention’s commercial value. The insight also applies to the incentives of nonacademic inventors.
The commercial value in such cases depends crucially on the efforts of both parties in
testing, redesign, and development activities. Absent appropriate incentives, each party may opportunistically
shirk, especially in activities where their effort is not observable (or verifiable) by the other party.
H2a: The royalty rate is increasing (and the fixed fee decreasing) in unobservable inventor effort, when all
other variables are held constant.
15 In Gallini & Wright (1990) privately informed inventors have the bargaining power and makes revenue-sharing offers, whereas in Beggs (1992), informed developers make contract offers. 16 85% of the sample pharmaceutical inventions were in preclinical stage at the time of licensing. Jensen & Thursby (2001) also report that more than 70% of university licenses require significant inventor and developer effort before commercialization based on a survey of 62 U.S. universities and 112 licensees.

9
Similarly, a greater share in residual profits enhances developer incentives to invest effort in
commercialization.17
H2b: The royalty rate is decreasing (and the fixed fee increasing) in unobservable developer effort when all
other variables are held constant.
Table 1 summarizes the predictions of the above symmetric and asymmetric information models for f and
r. Three points are important to note before testing the predictions.
The models are not mutually exclusive in reality – the final terms in a license reflect hidden quality and
unobservable effort concerns of both parties, as well as the invention’s value that the parties agree over.
The primary challenge for econometrically identifying the partial effects of the various information-
related assumptions is to construct proxies that capture the effects without biases.
The models tested here assume a two-part payment structure with r and f. However, 57% of my sample
licenses stipulate other payments (either milestone payments or minimum royalty payments). While
theory offers little guidance for either their existence or magnitude, I also investigate the relationships
between milestone fees and minimum royalty payments, and imperfect information.
The empirical tests that follow focus on the effects of hidden quality and unobservable effort, and do not
directly address alternative explanations for revenue-sharing such as the parties’ risk preferences and
capital constraints. I control for these factors in my empirical analysis, and where appropriate, discuss
their potential influence on contractual payments.
TABLE 1
The next section describes my sample, the proxies for inventor and developer private information, hidden
quality, unobservable effort, and control variables. I describe the sample contracts in some detail because the
structure of biomedical licenses is not well documented in the literature and my descriptive results can be
compared with the structure of licenses suggested by other studies.
17 Many developers may license in inventions solely to preclude other competitors from acquiring the technology. In such cases of extreme developer opportunism, inventors should prefer fixed fee licenses.

10
3 The sample
3.1 Sample description
The license agreements for this study are drawn from the Securities and Exchange Commission (SEC) EDGAR
filings of U.S. publicly listed firms during the years 1995-2008. Public companies are required to disclose a
variety of “material” transactions in the filings such as: license agreements, franchise agreements, supply and
distribution agreements, assignment agreements, and end-user agreements.18 After carefully perusing each
individual agreement, I retained arm’s-length license agreements, and eliminated redacted agreements,
agreements among dependent entities, and agreements observably tied to other transactions between the parties. I
was thus left with 505 complete licenses for inventions in the pharmaceuticals, biotechnology, medical
instruments and devices industries.19
I used the detailed descriptions of licensed inventions in the 505 sample contracts to match each invention
to one of 65 therapeutic categories and four broad sectors. Table 2 shows that 48.3% of the sample biomedical
licenses are for pharmaceutical inventions and 44% for medical devices and instruments. The remaining licenses
are for genetic (5.5%) and veterinary products (1.8%). Anticancer drugs (general and immunological, with
estimated market sizes of $1-5B per year), Catheters, needles and syringes (market size estimates not available),
and Cardiovascular devices (estimated market sizes of > $10B per year) are the three most common therapeutic
categories.
Hence, the sampling frame for this study is “material” license contracts, or
contracts above a certain expected value threshold, covering inventions in the biomedical industry.
The therapeutic categories were developed by Pharmaprojects (for pharmaceuticals) and the Medical and
Healthcare Marketplace Guide (for medical devices and instruments) to assess the revenue potential of new
18 A “material” event is any significant event that affects the company’s financial standing such as a bankruptcy, a lawsuit, a merger, employment of key personnel, joint-venture, or a license agreement. Descriptions of material events are reported in Form 8-K, 10-K or 10-Q reports. Public companies can be exempt from filing the standard SEC forms if they have less than 500 stockholders and less than $10 million in total assets. 19 “Biomedical” as used here includes the following SIC-2 categories: 28 - Chemicals & allied products; 38 - Measuring, Analyzing, & Controlling Instruments, Medical And Optical Goods; 50 - Wholesale Trade - Durable Goods; 80 - Health Services; 87 -Engineering, Accounting, Research, Management, & Related Services.

11
inventions based on the size of their product markets.20
TABLE 2
Industry experts use the categories as a starting point to
evaluate the expected value of inventions in licensing negotiations (P.C. with Greg Wiener, 07.06.2009) and
accordingly, I use therapeutic category fixed-effects in my regressions to control for heterogeneity in the expected
revenue of inventions arising from therapy-level differences in their market potential. The controls allow me to
focus on within therapeutic-category variation in the effects of imperfect information on payment terms.
For each license, I collected data on the effective start date, duration, identity of the parties, United States
Patent and Trademark Office (USPTO) identifiers for the 1,265 unique licensed patents (both patent applications
and issued patents), revenue-sharing terms (upfront payments, royalty rates, milestone payments, and minimum
royalty fees), and other terms (field of use exclusivity and territory of use). For each licensed patent, I gathered its
issue date, number of forward citations in every year after its issue (through 2008), number of references to
previous scientific literature, and USPTO class and subclasses.21
The sample agreements were reported by public companies in their role as either inventors (licensors) or
developers (licensees) for each agreement. Table 3 shows the sample distribution of public companies, as well as
universities, individuals, and foreign entities as inventors and developers. U.S. corporations are inventors in 47%
and developers in 87% of the transactions. U.S. universities (22%) and individuals (10.5%) are other major
sources of inventions.
22
TABLE 3
The low frequency of universities, non-profits and individuals among developers reflects
the widely held view, consistent with assumption A1, that these organizational forms are comparatively
disadvantaged relative to large corporations in downstream development.
3.2 Sample selection issues
20 Pharmaprojects is the pharmaceutical industry’s leading drug development database. “Medical and Healthcare Marketplace Guide” is an annual industry publication that focuses on medical instruments and devices. I confirmed these matchings by using the services of a graduate pharmacology student. 21 USPTO patent subclasses are finer categorizations than therapeutic categories – a patent in any given therapeutic category can fall into any one of the more finely defined 2-8 USPTO subclasses. 22 This distribution is comparable to the distribution of organizational types reported by others (licensing executives survey 2008, Taylor & Silberston 1973, Caves et al 1983, Anand & Khanna 2001).

12
The sample licenses are not randomly drawn but obtained from the selective disclosures of U.S. public
corporations, which arguably are more expert at evaluating inventions and writing sophisticated contracts. Hence,
the primary effect of selection is to generate a closer match between the sample parties and the value-maximizing
actors assumed by theory. To get a better sense of selection of inventors into the sample, I compared the
distribution of inventors (assignees) of the 1,265 US patents associated with the 505 sample licenses to the
distribution of inventors of the 170,955 US patents not in the sample but in the same USPTO subclasses as the
licensed patents. The two subsamples together represent the population of all U.S. inventions patented during the
years 1976-2008 in the technology fields of the sample patents.
Panel-A of Table 4 shows that rather than U.S. corporations, U.S. universities and the federal government
are disproportionately represented as inventors in the sample. Since universities and federal laboratories rarely
engage in development, this difference is in line with assumption A1 that inventors are not active in downstream
markets. Thus, it does not appear plausible that these differences will introduce biases in inferences from this
sample of the effects of imperfect information on contract terms. My estimations also use dummy variables for
inventor and developer organizations to pick up any unobserved differences among the different organizational
types.
TABLE 4
A second source of potential bias arises from the “quality” of sample inventions, since only transactions
valuable enough to meet the materiality requirements for disclosure by public companies are represented in the
sample.23 Panel-B of Table 4 presents summary statistics for the forward citations (a proxy for quality) of in-
sample patents and matched “out of sample” patents at and after agreement date.24
23 Firms sometimes redact key contractual terms (like payments, license dates and patent numbers) from their SEC filings and redacted licenses are omitted from my sample. If firms redact licenses with strategically important or valuable inventions, then it is plausible that my sample licenses are biased towards less-important inventions.
The average licensed patent
has 40% more forward citations at agreement date relative to the average out-of sample matched patent and twice
the number of forward citations as matched patents after license date. It is not clear whether these differences in
citations patterns reflect differences between the population of licensed patents and patents that are not licensed,
24 The matching was done on the basis of USPTO patent subclass and grant date.

13
or between in-sample and out of sample patents. In either case, this potential oversampling of valuable inventions
reinforces the likelihood that the sample contracts are the result of careful negotiations between value-maximizing
parties and resemble the optimal contracts of theory.
4 Variables and descriptive results
4.1 Revenue-sharing terms
Revenue-sharing terms – royalty rates, upfront fees, milestone fees and minimum royalty payments – are the
dependent variables of this study. Royalty rates (r), expressed as a percentage of revenues to be paid to the
inventor on an annual basis, are required by all the 505 sample licenses.25
Apart from f and r, 40% of the sample licenses specify an annual dollar lower bound on the amount of
royalties. The payments are contingent on commercialization, credited against annual royalty payments, and
continue through the expiration of the agreement. I calculate minimum royalty payments (p) as the net present
value of annual minimum payments (discounted at 5% p.a) over the term of the agreement.
73% of the agreements stipulate
upfront fees (f).
27% of the licenses also specify milestone or state-contingent lump-sum payments. Typical milestones
are: the filing of an “investigational new drug” application by the licensee, completion of successive phases of
clinical trials, regulatory approval of “new drug applications,” and first commercial sale of the final drug or
medical device. Milestone payments (m) are the sum total of all state-contingent payments to the inventor.26
TABLE 5
Table 5 presents summary statistics for the four payment types.27
25 This is consistent with the findings of Taylor & Sylberston (1973), Contractor (1981), and Anand & Khanna (2001) all of who report a less than 10% incidence of zero-royalty licenses.
Statistics for f, m and p are calculated
for non-zero values and expressed in FY2008 constant dollars. The median r (5%) approximates the mean (5.5%),
26 Since the exact dates for the realization of milestones are not available, I do not report discounted NPVs but just net milestone payments here. 27 9 of the licenses in my sample (all with university licensors) required the developer to sponsor inventor’s research. However, these sponsorships were either specified as state-contingent payments or deferred upfront payments and

14
but the other three payments exhibit substantial skew. The mean f of $1.5 Million is well above the median ($
214,000). When present, minimum and milestone payments are economically significant ($1.6 M and $ 4 M
respectively), and on average, exceed upfront fees. Summing the payments specified in dollar terms suggests that
the sample average of expected payments to inventors is $3.5 Million. These statistics should be interpreted
cautiously – nearly 80% of biomedical inventions fail during testing and many of the payments (milestone
payments and royalties) do not materialize.28
4.2 Measuring private information and hidden quality
Thus the numbers represent potential payments, not actual transfers.
Theory predicts that contractual payments are affected by the parties’ private information about the
invention’s expected value. In an ideal world, the effect of private information can be measured with data on the
identity of the informed party and the extent of private information about the invention’s hidden quality at
agreement date. Since these data are practically impossible to observe, I use proxies for the level of private
information of the inventor and the developer, and the invention’s hidden quality at agreement date.
I construct measures for the hidden and publicly known components of the invention’s quality (expected
revenues) based on the number of future citations received by licensed patents (“forward citations”). My
assumption that the number of forward citations captures a patent’s quality is based on the following findings.
Trajtenberg (1989) found a strong positive correlation between the commercial value of different scanners
within the Computed Tomography field (measured by sales revenues from hospital purchases of CT
scanners) and the forward citations of patents associated with the scanners.
Harhoff et al (1999) surveyed German patentholders of U.S. patents and asked them to evaluate the
selling price of their patents three years from the survey date. The responses were linked with the
forward citations of patents three years after survey date. Each additional citation to the sample patents
was worth an increased valuation of $1 million.
accordingly I treat them as milestone and minimum payments respectively. The results reported here are not sensitive to either the exclusion of these payments or the exclusion of contracts with these payments. 28 The probability of eventual FDA approval ranges between 8% and 37% (depending on therapeutic categories) for New Chemical Entities that enter the clinical testing stage (Adams & Branter 2006; DiMasi et al 2003)

15
Hall et al (2005) report a direct relationship between the forward citation stocks of U.S. firms’ patents and
the market value of these firms measured by Tobin’s-q. Firms with patents that are cited 20 times or more
commanded a “market-premium” of up to 54%.
Of direct relevance to the proxies used here, real-world licensing executives use forward citations to
assess the quality of patented inventions and the value of licensing transactions (see Ocean Tomo, a
leading IP aggregator’s 2008 catalogue, or Parr 2002).
I observe the forward citations of licensed patents at a date after the agreement date. This retrospective
view allows me to decompose the forward citations into two parts: citations that arrived before agreement date,
and citations that arrived after agreement date (but before 2008, the last year for which I have citations data). The
first part proxies for the invention’s publicly known quality, and the second part reveals the invention’s hidden
quality at agreement date as explained below.
4.2.1 Public information about inventions’ quality
The number of forward citations to licensed patents before the agreement date is directly correlated with
common knowledge about the invention’s quality at license date since both inventor and developer observe the
citations. Forward citations at agreement date hence correspond to the invention’s expected revenues that both
parties agree on, and proxy for the symmetric information component of the invention’s expected value.
4.2.2 Hidden information about inventions’ quality
Citations to licensed patents that arrive after agreement date have information on the invention’s hidden
quality once we remove future citations that can be predicted based on the citation history at agreement date
(since past citations are a good predictor of future citations). The “purging” is easily accomplished by
disaggregating post-agreement citations into a predictable component based on the citations at agreement date and
a residual component. When both pre-agreement and post-agreement citations are included on the Right Hand
Side (RHS) in a multivariate regression, the coefficient on the post-agreement citations variable captures the
effect of this residual component. The residual proxies for the “unexpected” or hidden quality of the licensed
invention at agreement date.

16
These citation-based proxies require refinement because: (a) patents in different technologies and
therapeutic categories have different citation patterns (b) patents (both within and across licenses) issued in
different years have different durations of time during which they can be cited by other patents, and (c) a typical
license is associated with multiple patents (the median agreement in my sample licenses 2 patents). To correct for
these sources of noise, I first normalize the forward citations of each licensed patent at any given date by dividing
the citations by the number of forward citations of the average patent in the same USPTO technology subclass
and vintage as the licensed patent. I then calculate the quality proxies for each license as the mean of the
normalized forward citations of all patents in the license.
Next, I use the number of other patents held by the two parties in the same USPTO patent subclass as the
licensed invention at agreement date as proxies for their respective levels of information. The interaction terms of
the number of other patents held by inventors and developers with the post-agreement citations of patents
covering the licensed invention identify the effect of the parties’ private information about the invention’s hidden
quality. Beyond controlling for the idiosyncratic aspects of USPTO technology subclasses, my regressions include
fixed effects for the 65 therapeutic categories discussed earlier. Hence, the estimated effects of the above proxies
capture within product class relationships between information about the inventions’ quality and contractual
payments.
TABLE 6
Panel-A of Table 6 reports summary statistics for the number of patents held by licensors and developers
as well as for the symmetrically known- and hidden- quality proxies. A majority of inventors (61%) and
developers (86%) do not have patents in the same field as the licensed invention at agreement date, skewing their
summary averages towards zero. The unit value of normalized citations for the median licensed invention at
license date suggests that at the time of licensing, the quality of the median licensed invention is not statistically
different from an average invention. The median invention after agreement date however is 1.5 times more
valuable than an average invention of comparable technology and vintage.29
29 The sample median patent is licensed 3 years after its grant. 8 years is the median difference between the time the median patent is licensed, and the date of its last forward citation (in year 2008).

17
4.3 Measuring unobservable effort
An ideal test of two-sided moral hazard would relate both the importance of the parties’ efforts, and the
cost of monitoring effort to contractual payments. Because I do not have fine-grained measures for unobservable
effort, I use the presence of inventor and developer effort-related clauses in the licenses to identify moral hazard.
4.3.1 Inventor effort
In its most basic form, a technology license confers the right to make, use and sell products with the
inventor’s patents. Many licenses, in addition to the right to infringe upon inventor patents, require the transfer of
inventor knowledge to the developer. These knowledge transfers requiring inventor effort are indicated by the
presence of two qualitatively distinct clauses.
(i) Know-how clauses specify the transfer of blueprints, drawings, data, records, prototypes or other
material, commonly referred to as “know-how” and required by the developer to practice the licensed patents.
Know-how clauses sometimes require the inventor to train developer personnel to use the transferred material.
Panel B of Table 6 reports that 41% of the sample agreements specified a know-how clause. For example:
“Know-How means all of Licensor's technical know-how and other knowledge, information, plans, drawings, instructions, software and engineering advice relating to any and all of the Licensed Products developed by Licensor that Licensor, in its reasonable determination, believes can be used in the myocardial ablation field;”
(ii) Show-how clauses or “inventor assistance” clauses stipulate the provision of technical services by the
inventor to support the developer’s commercialization activities. Show-how requires the inventor to assist in
activities that occur after the agreement date – for example, in the conduct of clinical trials, redesign and
development, seeking of regulatory approval and manufacturing activities. 18.6% of the sample agreements
specified a show-how clause. The following contractual language is an example of a show-how clause:
6.2 ASSISTANCE BY OWNER. The Owner (COLTHURST LIMITED) shall be responsible for reasonably assisting Holmedco in the Development of the Products. Holmedco shall pay Owner for such services at the rate of $15,000 US per month, such payments to be retroactively paid for services commencing June 1, 1994 through FDA Phase II approval for marketing. Holmedco and Owner shall interview prospective FDA consultants and shall engage the top-choice consultant as soon as possible. At all times during the term of this Agreement, the Owner and Holmedco shall each promptly after learning

18
thereof notify the other in writing of any serious or unexpected adverse reactions or side effects with respect to the Products.
Both know-how and show-how clauses explicitly specify, or refer to, a compensation for the inventor’s
time that is separate from the revenue-sharing terms. The key difference between the transfers of know-how and
show-how is that the former relates to the transfer of codified knowledge before or at agreement date, while the
latter requires the application of inventor’s “tacit knowledge” in post-license development activities. Hence, I use
the presence of show-how clauses in licenses as a proxy for the presence of unobservable inventor effort and
know-how clauses to indicate observable inventor-effort. Admittedly, a careful reading of contractual language
suggests that the two proxies are not perfect – the quality of at least some of the inventor activities specified in
know-how clauses is hard to perfectly monitor and most show-how clauses imply sharing of at least some of the
inventor’s codified know-how in addition to tacit knowledge. Hence, a know-how clause should be interpreted as
indicating inventor activities that are more visible to the developer relative to the activities covered by show-how
clauses.
4.3.2 Developer effort
Some developers may license patents exclusively to preclude inventors from licensing their inventions to
competing developers. In other cases, developers may consider their share of profits insufficient to go forward
with the investments to commercialize the invention (DeChenaux et al 2009). “Due-diligence” clauses stipulate a
minimum level of developer effort and I use these clauses as a proxy for concerns about developer opportunistic
behavior, and the importance of developer’s unobservable effort. The following contractual language is an
example of a “due-diligence”clause:
6.4 Notwithstanding any other provision of this Agreement, Licensee shall be considered to have committed an event of default, and this Agreement and the license granted hereunder shall terminate, if any of the following occur:
6.4.2 Licensee fails to file one Investigational New Drug Application (IND)
for Licensed Products by September 30, 1998 and has not initiated significant clinical activity by September 30, 1999.
36% of the sample licenses specified a “due-diligence” clause.
4.4 Control variables

19
Identifying the effect of hidden quality and effort on payment terms requires that I control for a variety of
factors potentially correlated with payments and the explanatory variables. First, I include other terms in contracts
(the number of licensed patents, exclusivity, duration, and territory) on the RHS as potential correlates of payment
terms.30 Panel C of Table 6 shows that 83% of the licenses in my sample are either exclusive or exclusive to field
of use (therapeutic category). 87% of licenses grant the developer world-wide rights to the practice of licensed
patents. The median license duration (the time between the agreement start date and the day on which the licensed
patents expires) is 16 years – a reasonable length of time to recoup developer investments in commercialization
that may not occur for 8-10 years after the agreement date.31
Second, while theory assumes risk-neutral parties (A3), the relative risk preferences of real-world
negotiators may be correlated with the use of effort-related payments (risk-averse parties prefer the insurance of
fixed payments rather than royalties). I include variables for the length of time the parties have been innovative
(organizations with a longer inventive history may be less risk-averse) and their organizational types (i.e.
corporations, small firms, individuals, universities, other non-profits, and foreign entities) as first order controls
for factors like risk preferences and liquidity constraints.
The median invention in my sample is protected by 2
patents. The sample statistics on exclusivity and duration are consistent with assumption A2 that inventors do not
license out their inventions more than once (either to the same, or to a different, party) precluding invention-
specific reputation as a factor affecting payment terms.
32
30 Agreements are defined to be effective till the expiry of the last licensed patent. I calculated the duration for the sample agreements as the difference between agreement start date and the expiry date of the last patent.
Panel D of Table 6 shows that inventors are on average
twice as experienced in innovation as developers at license date (“inventive age” is the difference between the
application year of the party’s first patent in any field and agreement date). I also control for industry-wide trends
in the preferences for certain types of revenue-sharing terms or the value of innovations by including a
logarithmic trend variable.
31 17 of my sample agreements compensated the inventor with the developer’s equity. Either excluding these contracts or controlling for the provision of equities on the RHS do not alter the findings reported here. 32 The large numbers of unique inventors (401) and unique developers (407) relative to sample size (505) precludes the inclusion of organization-specific dummy variables.

20
Third, characteristics of the invention such as its closeness to basic science may affect commercialization
efforts and payment structure. Previous literature has shown that patents protecting embryonic or early-stage
inventions have a higher proportion of references to prior scientific literature (Narin et al 1997). I use the
proportion of references to scientific literature in the licensed patents, normalized as described in Section 4.2, to
capture the developmental stage or maturity of the licensed invention. Inventions’ product-class factors like
market size, volatility, technological opportunity, availability of substitutes, or the threat of competition can also
affect payments, and the 65 therapeutic category dummies control for these factors that vary with product
categories. All coefficients can thus be interpreted as within-product class effects.
5 Results and robustness checks
5.1 Estimation and issues
This section tests whether payment terms in the sample contracts respond to imperfect information as predicted by
theory. The empirical tests regress the payment terms on proxies for hidden quality and hidden effort with
controls for the characteristics of inventions, licenses, inventors and developers explained in the previous section.
The cross-sectional nature of the sample and the absence of final revenues data pose several challenges to the
identification of imperfect information.
First, the proxy for hidden quality may be endogenous to revenue-sharing terms. Forward citations to
licensed patents after the agreement (measure of hidden quality) may increase when royalty rates are higher
because inventors and developers may respond to the potential of higher profits by taking actions that increase the
value of the invention and the number of forward citations. Any RHS measure of hidden quality based on post-
agreement outcomes is similarly susceptible to this endogeneity problem. However, since contracts are written to
mitigate the effect of hidden quality on outcomes, the estimated effects of my tainted proxy on contract terms are
likely to be biased towards zero.
Second, for two-part payment schemes, theory assumes that upfront fees represent the present value of the
inventor’s share of all future revenues given the amount of royalty payments. This implies that holding revenues

21
constant, upfront fees and royalty payments are inversely related (assumptions A4 & A5). Hence, regressions in
the reduced form should either estimate the effect of imperfect information variables on the ratio of upfront fees to
the net present value of royalty payments over the duration of contracts, or control for the net present value of
revenues while estimating the effect of RHS variables on f and r. Omitting revenues from the regressions will
result in biased estimates of hidden quality (or effort) on (f, r) if hidden quality (or effort) is correlated with both
revenues and revenue-sharing terms. The same argument holds for licenses with m and p – the terms may be
substitutes for each other or for (f, r), and unbiased estimation of the effects of quality and effort on these terms
requires controls for expected revenues. Although I do not observe the final revenues associated with licensed
inventions, I include 65 therapeutic-category dummies and forward citations to licensed patents normalized by
USPTO patent subclass and issue date.33
Third, as noted before, not all sample licenses involve the payment of f, p or m. When these payments are
absent, the dependent variable in the corresponding estimating equations is bounded below at zero. The potential
censoring problem can be corrected by maximum likelihood estimations for f, p and m. Accordingly, I estimate
Tobit equations, in addition to OLS regressions, after converting the three dollar payments to a partially
logarithmic scale (i.e. y = log [1 + payments] where y represents the transformed dependent variable). This
transformation scales down the discontinuity between zero and non-zero payments, and reduces the variance in
the distributions of the three payments.
These variables respectively control for across- and within- product-
class variation in the expected revenues for licensed inventions.
Fourth, royalty rates (divided by 100) are bounded below by 0 and above by 1. I estimate the royalty rate
equation using both raw royalty rates specified as percentages and a logistically transformed variable that maps
the rates to the real line (z = ln[r/(1—r)]) where z is the transformed variable).
Fifth, my data are cross-sectional and I cannot reject the presence of heteroskedasticity. I hence calculate
and report Huber-White robust standard errors, which account for heteroskedasticity of unspecified form, on all
coefficients. 33 Actual revenues are hard to gather because: (a) 70% of licensed inventions fail to be developed into revenue-yielding products (b) the average time-gap for pharma inventions between agreement date and first product sales is 4-10 years (Pharmaprojects 2009, Adams & Branter 2006), and (c) firms rarely disclose product level revenues.

22
The following sections first consider the effect of the RHS variables on f and r and then on m and p.
5.2 Results for fixed fees and royalty rates
The first two columns of Table 7 report OLS estimates of log(1+f) (where f the upfront fee is expressed in
1000s of Y2008 $) and royalty rates (expressed in percentages) on hidden quality and hidden effort proxies.
Column-3 reports Maximum Likelihood (Tobit) estimates for log (1+f), and Column-4 presents the effect of RHS
variables on logistically transformed royalty rates. The transformed royalty rate equation measures the effect of
independent variables on the logged odds of royalty rates. The coefficients produced by these different
estimations are qualitatively similar to OLS estimates and the following discussion focuses on the latter for their
ease of interpretation.
TABLE 7
A doubling of forward citations to licensed patents at agreement date is associated with a 15% increase in
f. For the average license in my sample (with a non-zero f), this amounts to an increased upfront payment of
$232,000. The presence of know-how clauses, indicating the transfer of codified knowledge, increases f by over
70% or $1M for the average license. Upfront payments are not statistically different for licenses with show-how
clauses, which proxy for the transfer of inventor tacit knowledge, and ordinary patent licenses. Due-diligence
clauses, indicating safeguards against potential developer opportunism, are associated with 80% (or $1.2M)
higher f on average. Hence, fixed fees are positively related to the symmetrically known quality of the invention
at agreement date, the transfer of observable inventor effort, and the potential for developer moral hazard, results
that are respectively consistent with H0, H2a and H2b.
Licenses with show-how clauses are associated with royalty rates that are nearly twice those associated
with an average licensed patent (4.7%). This result is consistent with H2a which predicts that greater difficulty in
monitoring inventor effort will be associated with greater reliance on revenue-based royalty rates. Licenses with
know-how clauses are also associated with higher r (1.3 percentage points) than ordinary licenses but the effect of
know-how clauses is not comparable to that of show-how clauses. This result suggests that “know how” clauses
may not be perfect proxies for observable effort, perhaps because the transfers of materials, data and training of
developer personnel stipulated by these clauses involve inventor actions that are hard to perfectly monitor and

23
compensate with upfront payments alone. The interactions of the forward citations after agreement date with the
number of patents held by the two parties are not significantly correlated with r and f. This suggests that
inventors and developers may not be using the terms to signal the inventions’ hidden quality as anticipated by
H1a and H1b.
Although not directly related to the hypotheses, the estimated effects of some control variables are
interesting. For example, more experienced developers prefer higher f and universities receive both lower f and r
relative to other types of inventors, ceteris paribus (relative to U.S. corporations, the omitted inventor and
developer organizational type). The former result suggests that experienced developers may be less risk-averse
(or less capital-constrained) and prefer to pay upfront rather than share their revenues. The result on university
inventors could be driven by either differences in institutional objectives or levels of sophistication in license
negotiations. Parties also appear to tradeoff territorial restrictions for royalty rates. Licenses with patents that
have been litigated receive more than twice the f that other licenses do. This may be because the parties to a
license are more likely to be informed of the value of litigated patents.
5.3 Results for minimum royalty and milestone payments
The first two columns of Table 8 report OLS estimates and the next two maximum likelihood estimates
(Tobit) of the effect of RHS variables on log minimum royalty payments and log milestone payments. The two
sets of estimates are qualitatively similar and I focus on OLS estimates in the following discussion.34
TABLE 8
The interaction term of inventor patents in the same subclass as licensed patents (proxying for privately
informed inventor) and post-agreement “unexpected” forward citations (a proxy for hidden quality) is directly
related to minimum royalty payments. This result is statistically significant (at p<0.05) in both OLS and Tobit
estimations (Columns 1 and 3 respectively). A unit increase in the interaction term (a unit increase can be thought
of as a 1% increase in the number of licensor patents, a doubling of post-agreement forward citations to licensed
patents, or some combination of the two changes) is associated with a 2.8% ($49,314) increase in minimum
34 Estimates not reported here suggest that the effect of the RHS variables on the probability of observing p and m payments and the magnitude of p & m, conditioned on censoring, are similar.

24
royalty payments. Asymmetrically informed inventors appear to signal high quality inventions by requiring
higher minimum royalty payments rather than higher running royalties as anticipated in H1a.
The presence of a due-diligence clause is associated with a 58% ($953,000) increase in the amount of net
minimum payments, although the standard error of this estimate is quite large (significant at p<0.1 for OLS and
p<0.05 for MLE). Since forward citations are positively related to f and negatively related to p, it appears that
public information on quality increases upfront fees but decreases minimum royalty payments, broadly consistent
with H0.
The proxy for hidden quality (unexpected forward citations without licensor or licensee patents
interactions) is positively correlated with the magnitude of milestone payments, but inventor knowledge of the
invention’s hidden quality (proxied by the interaction term of forward citations post-agreement date and inventor
patents in the same subclass as the licensed patents) is negatively related to milestone fees. This may be because
asymmetrically informed inventors substitute p for m to avoid developer moral hazard concerns. These results
suggest that milestone payments are uniquely driven by unexpected quality or uncertainty related to the quality of
the licensed invention. Higher shares of references to scientific literature in licensed patents (proxy for the
embryonic stage of licensed inventions) and the presence of know-how clauses are also positively associated with
milestone payments.
5.4 Relationship among payment terms
The theoretical models assume that the different types of contractual payments are substitutes for each
other (assumption A5). Thus upfront fees, royalties (royalty rates or minimum royalty payments), and milestone
payments should be negatively related to each other, for a given level of revenues. This implication of theory is
not convincingly supported by my results – for example, the estimated positive effect of symmetrically known
quality on f is not accompanied by a significantly negative effect on r. This could be because the payment terms
(f & r) are not perfect substitutes for each other in the real-world. An alternate reason could be that the payments
are simultaneously determined and the theoretically predicted negative relationship is part of the error term in my
independent OLS equations for the different payments.
TABLE 9

25
I investigate simultaneity bias by estimating the effects of imperfect information variables on each
payment term, holding constant the level of all other payment terms in the contracts. OLS estimates of the effects
of explanatory variables and other payments on each payment term (f, r, p, m) are reported in Table 9. These
estimated partial correlations are over and above the effects of the quality and effort variables and should pick up
relationships among payment terms previously subsumed in the error term. f and r are not negatively correlated
with each other, but m and p appear to be imperfect substitutes (at p<0.05). Most importantly, the estimates show
that the introduction of other fees does not alter the previous findings on the effect of hidden quality and
unobservable effort proxies, ruling out simultaneity bias as an issue in the estimations.
FIGURE 1
However, the issue of the real relationship between the different payment terms remains. One explanation
for the empirical pattern of relationships is that in reality, license negotiators do not have precise expectations
about future revenues, obscuring the theoretically anticipated relationship among r and the other payment terms.
This view is supported by the sample distribution of royalty rates, which does not display the large variance that
would be consistent with the dispersion of expected revenues of sample inventions and other payments. Indeed,
Figure 1 shows that much of the sample variation in r is explained by the presence of know-how and show-how
clauses, and values of r “clump” around the respective median values for show-how, know-how and ordinary
licenses.35
Licensing executives I interviewed suggest that they decide royalty rates by referring to rules of thumb
or “comparables” (to account for the transfer of inventor codified and tacit knowledge) and then divide expected
downstream rents among fixed fees, minimum royalties, and milestone payments as a function of information
conditions and bargaining power (P.C. on 10.18.09 with Lorraine Morrison, Licensing Executives Society).
6 Concluding remarks
35 Consistent with my findings, Allen and Lueck (1993) report that 92% of contracts between landowners and tenants share output either on a 50/50, 40/60, or one-third/two-thirds basis, obscuring a clear relationship between upfront and revenue-based payments. Lafontaine and Shaw (1999) and Lafontaine (1992) also fail to find a negative relationship between royalty rates and upfront fees in a sample of franchising agreements.

26
This study empirically evaluated imperfect information theories about the structure of contractual incentives. The
two imperfections considered by theory – hidden quality and unobservable effort – influence the structure of real-
world contracts. My findings agree with, and depart from, the theoretical predictions as follows.
First, agency theory views the transfer of inventor tacit knowledge to developers as involving
unobservable effort and solves the moral hazard problem with “pay for performance.”In this spirit, Jensen &
Thursby (2001) link unobservable inventor effort in downstream development to higher royalty rates. I find that
biomedical inventors’ visible efforts to transfer “codified” know-how are compensated with higher upfront fees,
while the transfer of hard-to-observe “tacit” knowledge is associated with higher royalty rates, consistent with the
Jensen-Thursby prediction. Inventors deal with the hazard of developer opportunism by demanding higher upfront
payments, a finding that is also consistent with moral hazard models. These results reveal how sophisticated
parties create contractual incentives to deal with the transfer of inventors’ tacit knowledge to developers – a topic
of central concern in the innovation management literature (Arora 1995, Teece 1986).
Second, according to Gallini and Wright (1990), when inventions’ quality is hidden from developers,
inventors with good inventions signal their quality by offering contracts with higher royalty rates and lower
upfront payments. The signaling hypothesis is not supported by the royalty rates for my sample contracts, but is
consistent with the results for minimum royalty payments. The shortcomings of royalty rates as a signal for
hidden quality were highlighted in my interviews with licensing executives. Inventors are required to estimate (ex
ante) and verify (ex post) developers’ final revenues to use royalty rates as signals of their invention’s quality.
The estimation of product revenues is costly because of substantial uncertainties about the success and scope of
inventions at agreement date, and verification of final product revenues taxes the limited resources of specialized
inventors. By contrast, minimum royalty payments are relatively easy to specify and verify, and their presence in
license contracts appears to represent a real-world adaptation to the drawbacks of royalty rates. Future theories of
contract can model verifiability concerns and investigate why royalty rates are effective at addressing the
unobservable effort problem but not the hidden quality hazard.
Third, milestone payments are directly related to the unexpected quality of inventions at agreement date.
This finding does not support Dechenaux et al (2009), who propose that milestone payments address inventor

27
moral hazard. Licensing executives view milestones (e.g. success in various phases of clinical trials, regulatory
approval) as largely unpredictable “lotteries,” and milestone payments as instruments for managing uncertainty
about the technical feasibility of early-stage “blockbuster inventions” rather than as devices for rewarding
inventor effort (P.C. on 08.29.09 with Irwin Mettler, Office of Technology Licensing, University of California,
Berkeley).36
The main findings of this study suggest that real world value-maximizing agents respond to information
hazards with contractual incentives broadly consistent with the prescriptions of agency theory. The relationship
between the structure of information during contract negotiations and the structure of contracts is more
complicated than portrayed by theory, reflected in the prominence of alternative provisions such as minimum
royalty and milestone payments. The simplicity and tractability of these alternative payment terms may render
them preferable to royalty rates in other imperfect information settings. My ancillary findings on the relationship
between exclusivity and royalty rates, and litigation and upfront payments relate to theories not discussed here
(e.g. Shapiro 1985) and merit further investigation. A significant amount of variation in contractual payments is
also explained by organization- and product class- specific attributes, recommending a closer examination of
underlying factors such as bargaining ability, competition, and contract objectives.
Finally, upfront fees, unlike milestone payments vary directly with information about the invention’s
quality available to both inventors and developers at agreement date – a finding anticipated by theories of
licensing with symmetric information (e.g. Kamien & Tauman 1986 and Katz & Shapiro 1986).
The present study has investigated only one means of organizing the exchange of ideas. Important
avenues for future work in this area include: evaluating the implications of other information imperfections (for
example, the inventor’s appropriability problem) on transactions and institutions in the market for ideas,
analyzing how contract structure influences performance, and comparing the choice and effectiveness of different
modes (arm’s-length contracts, alliances, and vertical integration) of organizing the exchange of ideas. I hope to
pursue these avenues in future work. 36 Another fact consistent with the view that milestone payments address technical uncertainties associated with embryonic inventions is that university inventions commonly involve milestone payments. These licenses rarely stipulate inventor involvement in developer’s downstream activities because most universities do not contract out faculty know-how (only 8% of university licenses specified a “show-how” clause as compared to 22% for the rest of the sample) suggesting that uncertainties about quality, not inventor moral hazard drives milestone payments.

28
References
Adams, C.P., Brantner, V.V. 2006. Estimating the cost of new drug development: is it really 802 million dollars? Health Affairs 25, p 420–428. Aghion, P., Tirole,J. 1994. The Management of Innovation. Quarterly Journal of Economics 109 (4), p. 1185-1210. Allen, D.W, and Lueck, D. 1992. Contract Choice in Modern Agriculture: Cash Rent Versus Cropshare, Journal of Law and Economics, Vol. 35, p. 397-426. Anand, B.N., Khanna, T. 2000. The structure of licensing contracts. Journal of Industrial Economics 48(1), p. 103-135. Anton, J., Yao, D. A. 1994. Expropriation and inventions: Appropriable rents in the absence of property rights. American Economic Review (84) p 190–209. Arora, A. 1995. Licensing tacit knowledge: Intellectual property rights and the market for know-how. Economics of Innovation and New Technology. Vol 4. p 41-59. Arrow, K.J. 1962. Economic Welfare and the Allocation of Resources for Inventions. In R. Nelson (ed.), The Rate and Direction of Inventive Activity: Economic and Social Factors. Princeton University Press, Princeton. N.J. Beggs, A. V. 1992. The Licensing of Patents under Asymmetric Information. International Journal of Industrial Organization (10) p. 171-91. Brickley, J. 2002. Royalty Rates and Upfront Fees in Share Contracts: Evidence from Franchising," Journal of Law, Economics, and Organization, 18: 511-35. Camerer, C., Lovallo, D. 1999. Overconfidence and Excess Entry: An Experimental Approach. American Economic Review. 89(1), p. 306–18. Caves, R., Crookell, H., Killing, J. P. 1983. The Imperfect Market for Technology Licenses Oxford Bulletin of Economics and Statistics, 45, p 223-48. Cohen W,.M., Nelson R, R., Walsh J.P. 2000. Protecting Their Intellectual Assets: Appropriability Conditions and Why U.S. Manufacturing Firms Patent (or Not). Working Paper no. W7552, National Bureau of Economic Research, 2000. Crama, P., Reyck, B. D., Degraeve, Z., 2008. Milestone Payments or Royalties? Contract Design for R&D Licensing. Operations Research, 56(6), p. 1539 - 1552. Dechenaux, E., Thursby, M., Thursby, J. 2009. Shirking, Sharing Risk and Shelving: The Role of University License Contracts, International Journal of Industrial Organization, 27(1), p. 80-91.

29
DiMasi, J. A., Hansen R.W., Grabowski, H. G. 2003. The price of innovation: new estimates of drug development costs. Journal of Health Economics, 22, p 151–185. Elfenbein, D. 2009. Contract Structure and Performance of University-Industry Technology Transfer Agreements. Working paper. Gallini, N. T., Wright, B.D. 1990. Technology transfer under asymmetric information. RAND Journal of Economics, 21, p 147-60. Greene, W. H. 1997. Econometric Analysis. Upper Saddle River, NJ: Prentice Hall. Hall, B.H., Jaffe, A., Trajtenberg, M. 2005. Market Value and Patent Citations, RAND Journal of Economics, 36, p 16-38 Hart, 0., Holmström, B. 1987. The Theory of Contacts. In T. Bewley, ed., Advances in Economic Theory: Fifth World Congress. Cambridge: Cambridge University Press, 1987. Holmström, B., 1979. Moral Hazard and Observability Bell Journal of Economics, The RAND Corporation, vol. 10(1), p 74-91. Holmström, B., 1989, "Agency Costs and Innovation," Journal of Economic Behavior and Organization, 12 (3), 305-327. Harhoff, D., Narin, F, Scherer, F.M., Vopel, K. 1999. Citation Frequency and the Value of Patented Inventions, Review of Economics and Statistics, Vol. 81, p. 511-515. Hart, O., 2001. Financial Contracting. Journal of Economic Literature, Vol. 39(4), p. 1079-1100. Jensen, R., Thursby, M., 2001. Proofs and prototypes for sale: the licensing of university inventions. American Economic Review 91, p 240–259. Kamien, M., Tauman, Y., 1986. Fees versus Royalties and the Private Value of a Patent. Quarterly Journal of Economics. 101, p 471-93. Katz, M., Shapiro, C., 1986, How to license intangible property, Quarterly Journal of Economics, 101, p 567-590. Laffont, J. J., Matoussi, M. S. 1995. Moral Hazard, Financial Constraints and Sharecropping in El Oulja', Review of Economic Studies 62, p 381 - 399. Lafontaine, F. 1992. Agency Theory and Franchising: Some Empirical Results, RAND Journal of Economics, The RAND Corporation, vol. 23(2), p. 263-283 Lafontaine, F. 1993. Contractual Arrangements as Signaling Devices: Evidence from Franchising. Journal of Law, Economics, and Organization 9 p 256-89.

30
Lafontaine, F., Shaw, K. 1999. The Dynamics of Franchise Contracting: Evidence from Panel Data. Journal of Political Economy, 107. p 1041-80. Lazear, E. P.1986. Salaries and Piece Rates. Journal of Business, July 1986, 59(3), p. 405–31. Leland, H. E., David H. P. 1977. Informational Asymmetries, Financial Structure and Financial Intermediation Journal of Finance 32 p. 371-87. Lerner, J., Merges, R. 1998. The Control of Technology Alliances: An Empirical Analysis of the Biotechnology Industry, Journal of Industrial Economics 46, 125-156. Licensing Executives Society Survey. 2008. LES BioPharmaceutical Royalty Rates and Deal Terms Survey. Licensing Executives Society (USA & Canada). http://www.lesusacanada.org/MainNav/PublicationsPapers/biopharmrates.aspx Martin, R. E., 1988. Franchising and Risk Management American Economic Review, vol. 78(5), p. 954-68, Macho-Stadler, I., Martinez-Giralt, X., Pèrez-Castrillo, D., 1996. The role of information in licensing contract design. Research Policy 25, p 43–57. Narin F., Hamilton K., Olivastro D. 1997. The increasing linkage between US technology and public science, Research Policy, 26 (3), p 317-330. Shapiro, C., 1985. Patent Licensing and R&D Rivalry. American Economic Review 75(2), p 25-30. Trajtenberg, M. 1989. The Welfare Analysis of Product Innovations, with an Application to Computed Tomography Scanners Journal of Political Economy, vol. 97(2), p. 444-79. Teece, D.J. 1986. Profiting from technological innovation: implications for integration, collaboration, licensing, and public policy. Research Policy 15, p 285–305. Taylor, C. T., Silberston, Z.A. 1973. The economic impact of the patent system: a study of the British experience, Cambridge Univ. p. 294.

31
TABLE 1: Imperfect-information theoretical models, assumptions, and predictions on fixed fee (f) and royalty rate (r)
Model Information assumptions Predictions on (f, r)
Perfect information (Kamien and Tauman 1986)
Perfect information regarding quality (H0) (+, 0)
Adverse selection (Gallini & Wright 1990, Beggs 1992)
Inventor knows hidden quality (H1a) Developer knows hidden quality (H1b)
(-, +)
(+, -)
Moral Hazard (Holmström 1979, Jensen & Thursby 2001)
Hidden inventor effort (H2a) (-, +)
Hidden developer effort (H2b) (+, -)
TABLE 1 NOTES: The theories assume risk neutral parties. Perfect information and adverse selection theories respectively relate commonly known and hidden quality of the invention to upfront fees (f) and royalty rate (r). Moral hazard theories relate hidden effort to (f, r).

32
TABLE 2: Therapeutic categories and revenue potential of sample licenses
Therapeutic Category N of licenses Expected revenues per year Anticancer, General Agents 24 >US$1 B Anticancer, Immunological 16 US$2001-5000 M Drug formulation technology 16 NA Antibiotics 11 US$501-2000 M Antiinfective 11 US$501-2000 M Antiviral, Other 10 US$2001-5000 M Unclassified 10 NA Gastrointestinal disorders 9 US$501-2000 M Neurological 9 US$2001-5000 M Imaging Agent 8 <US$500 M Monoclonal Antibodies 8 >US$1 B Prophylactic Vaccine 8 US$2001-5000 M Antidiabetic 7 US$2001-5000 M Dermatological 7 >US$10001 M Antiviral, Anti HIV 6 US$501-2000 M Cardiovascular 6 US$10001 M Radio/Chemoprotective 6 <US$500 M Therapeutic Vaccine 6 US$501-2000 M Vulnerary products 6 US$501-2000 M Antithrombotic 5 US$2001-5000 M Cellular therapy 5 NA Nutritional supplements 5 US$501-2000 M Analgesic 4 US$5001-10000 M Anticancer, Antibiotic 4 US$2001-3000 M Antiinflammatory 4 >US$10001 M Cognition enhancer 4 US$501-2000 M Musculoskeletal 4 US$5001-10000 M Anaesthetic 3 US$501-2000 M Antiviral, Interferon 3 <US$500 M Immunostimulant 3 <US$500 M Addiction treatment 2 US$501-2000 M Antianaemic 2 US$2001-5000 M Anticancer, Alkylating 2 US$501-2000 M Anticoagulant 2 US$501-2000 M Antidepressant 2 >US$10000 M Antiparkinsonian 2 US$501-2000 M Antipruritic 2 <US$500 M Haematological 2 US$2001-5000 M Pharmaceuticals 244 Contd...

33
TABLE 2: Therapeutic categories of sample licenses (Continued)
Therapeutic Category N of licenses Expected revenues per year Catheters, Needles & Syringes 29 NA Cardiovascular devices 17 >US$10001 M Diagnostic Imaging products 16 >US$10001 M Wound Care products 16 >US$10001 M Diagnostic (in-vitro) products 15 US$501-2000 M Laser (Medical) 14 US$2001-5000 M Opthalmic Devices 13 >US$10001 M Analytical Instruments 11 NA Stents 11 >US$1 B Medical plastics 10 NA Minimally invasive surgical devices 9 >US$10001 M Urology devices 8 NA Kits and Trays 7 <US$500 M Patient Monitoring systems 7 US$501-2000 M Laboratory equipment 6 NA Unclassified 6 NA Electrophysiology products 4 NA Implanting technology 4 NA Dialysis products 3 US$5001-10000 M Endoscopy 3 >US$10001 M Male sexual dysfunction 3 US$2001-5000 M Orthopedic products 3 >US$10001 M Respiratory 3 >US$10001 M Defibrillators 2 NA Dental products 2 US$5001-10000 M Hearing aid devices 2 US$501-2000 M Devices and Instruments 224
Gene Therapy 15 US$2001-5000 M Cloning technology 13 NA Genetics 28
Veterinary 9 NA
TOTAL 505
TABLE 2 NOTE: The therapeutic categories and their revenue potential were identified by matching descriptions of the 505 sample inventions to descriptions in Pharmaprojects (for pharmaceutical inventions) and the Medical & Healthcare Marketplace Guide (for medical devices and instruments).

34
TABLE 3: Organizational forms of sample inventors and developers
Organization type Inventor Developer
US Corporation 46.9% 86.7% US University 21.8 - Foreign Corporation 10.1 9.5 US Individual 10.5 - Others 10.7 3.8
Total Sample Licenses 505 505 TABLE 3 NOTES: All numbers, except Total Sample Licenses are percentages. “Others” category includes U.S. non-profits, foreign universities and foreign individuals.

35
TABLE 4: Assignee types of in-sample and out-of sample US patents
In-sample patents Out of sample patents
PANEL A: Organization type
US for-profit organization 46.2% 45.0% US University 23.2 11.3 Foreign for-profit organization 12.2 30.6 US Individual (Unassigned inventor) 14.5 11.1 US Federal Government 3.8 1.6 Foreign governments 0.0 0.4
Total patents (grant years 1976-2008)
1,265
170,955
PANEL B: Patent forward citations
At date of license Mean 8 4.97
SD 16.9 8.32 Median 1 1.52
After date of license Mean 21.4 10.6
SD 68.1 20.2 Median 8 5.57
TABLE 4 NOTES: PANEL A compares the distribution of assignee organization types among the sample and “out of sample” patents in the USPTO patent subclasses of the sample patents. The 1,265 sample patents were associated with the 505 sample licenses. Assignee organization types are gathered from USPTO records. All numbers except total patents are percentages. PANEL B compares the forward citations of the sample and “out of sample” patents. Out of sample patents are matched by the USPTO patent subclasses of the sample patents and forward citations of out of sample patents are calculated in the same time-window as the sample patents.

36
TABLE 5: Sample summary of revenue-sharing terms
Revenue-sharing terms Non-zero N Median Mean SD Min Max
Royalty Rate (%) 505 5.0 5.5 4.3 0.1 30.0 Upfront fees (Y2008 1,000$) 367 214.4 1,546.1 5,824.4 0.1 66,000.0 Min. royalty payments (Y2008 1,000$) 201 414.5 1,643.8 3,978.0 14.6 37,075.3 Milestone payments (Y2008 1,000$) 136 1,255.0 4,034.8 8,733.1 16.1 67,080.0 Total $ payments (Y2008 1,000$) 409 874.1 3,536.8 8,851.3 0.1 92,075.3 TABLE 5 NOTES: The table presents summary statistics for the revenue-sharing terms (dependent variables) in the 505 sample licenses. Royalty rates are expressed in percentages and the rest of payments in 1000’s of FY2008 constant dollars. Minimum royalty payments are NPV values of annual minimum royalty payments over the term of the agreement discounted at 5% p.a. Milestone payments are the sum of state-contingent payments. Total payments for each license are calculated as the aggregate of upfront fees, minimum royalty payments and milestone payments. Sample-statistics reported are for non-zero values of the respective revenue-sharing terms.

37
TABLE 6: Sample characteristics of explanatory and control variables
PANEL A: Quality-related variables Median Mean SD Min Max Normalized forward citations at license date 1.00 1.42 1.80 0 23.5 Normalized forward citations after license date 1.51 4.62 12.43 0 118.0 Licensor patents in subclasses of licensed patents 0 1.67 5.63 0 86 Licensee patents in subclasses of licensed patents 0 0.38 1.51 0 17
PANEL B: Effort-related variables Non-zero N Know How (0/1) 208
Show How (0/1) 94 Due Diligence (0/1) 181
PANEL C: Other license characteristics Median Mean SD Min Max Number of patents per license 2 2.88 2.80 1 16 Term of license in years 16 14.9 4.9 2 28 Normalized % of science references 1 1.2 1 0 8.4
Non-zero N
Exclusivity Non Exclusive (0/1) 87
Exclusive (0/1) 227 Exclusive to field of use (0/1) 191 Territorial restrictions (0/1) 65 Litigated (0/1) 22
PANEL D: Inventor and developer characteristics Median Mean SD Min Max Inventor Inventive age 12 16.0 12.9 0 98 Developer Inventive age 6 7.9 8.8 0 45
TABLE 6 NOTES: The table presents summary statistics for the Right Hand Side variables (independent and control variables). All statistics in the panels are for the full sample of 505 licenses. PANEL A: Forward citations are normalized by dividing the number of forward citations received by each licensed patent by the number of forward citations of the “average” patent in the same issue year and USPTO patent subclass as the licensed patent. For licenses with more than one patent, I use the average value of the patents’ normalized citations. Licensor and licensee patents are the number of the respective parties’ patents in the same USPTO patent subclass as licensed patents. PANEL B: Variables are dichotomous and indicate the presence of Know-how, show-how and due-diligence clauses in the licenses. PANEL C: Science references are the percentage of backward citations or references to scientific papers in licensed patents. Normalization follows the procedure explained under PANEL A notes. PANEL D: Licensor and licensee “innovative” ages are calculated as the difference between license date and the application date of the parties’ earliest U.S. patent application.

38
TABLE 7: OLS and Tobit estimates of hidden quality and unobservable effort proxies on upfront fees and royalty rates
[1] [2] [3] [4] log upfront royalty rate log upfront log(r/1-r) Forward citations at license date (FCITESB) 0.145 -0.021 0.204 0.001
[0.064]** [0.090] [0.079]*** [0.017]
Forward citations after license date (FCITESA) 0.01 0.005 0.013 0.002
[0.014] [0.014] [0.017] [0.002]
Log inventor patents (INVPAT) 0.197 0.277 0.245 0.096
[0.218] [0.259] [0.269] [0.047]**
Log developer patents (DEVPAT) -0.312 -0.278 -0.506 -0.072
[0.404] [0.399] [0.509] [0.067]
FCITESA X INVPAT 0.002 0.006 0 -0.001
[0.009] [0.014] [0.010] [0.002]
FCITESB X DEVPAT -0.029 -0.005 -0.039 0.002
[0.016]* [0.018] [0.026] [0.003]
Know-how clause 0.694 1.268 0.924 0.32
[0.330]** [0.350]*** [0.407]** [0.074]***
Show-how clause 0.553 4.85 0.668 0.827
[0.396] [0.614]*** [0.501] [0.092]***
Due-diligence clause 0.804 -0.525 1.23 -0.124
[0.298]*** [0.427] [0.371]*** [0.077]
Number of patents in license 0.039 -0.157 0.055 -0.021
[0.050] [0.060]*** [0.062] [0.012]*
Litigated patents in license 2.22 0.209 2.736 -0.032
[0.681]*** [0.795] [0.764]*** [0.175]
% of science references 0.005 -0.158 0.028 -0.053
[0.142] [0.194] [0.172] [0.034]
Exclusive 0.597 -0.361 0.66 -0.143
[0.449] [0.546] [0.583] [0.095]
Exclusive to field 0.465 0.571 0.445 -0.001
[0.455] [0.647] [0.580] [0.105]
Territorial restrictions 0.251 1.901 0.226 0.23
[0.428] [0.715]*** [0.519] [0.103]**
Log Trend 0.074 0.228 0.159 0.051
[0.218] [0.262] [0.275] [0.056]
Contd.

39
TABLE 7: Continued
[1] [2] [3] [4] log upfront royalty rate log upfront log(r/1-r) Log inventor inventive age 0.191 0.107 0.277 0.036
[0.159] [0.197] [0.202] [0.039]
Log developer inventive age 0.433 0.052 0.574 -0.023
[0.135]*** [0.175] [0.167]*** [0.031]
Inventor Foreign Corp -0.037 -0.435 -0.1 -0.125
[0.542] [0.704] [0.654] [0.118]
Inventor Others -0.636 -2.988 -0.386 -0.598
[0.483] [0.583]*** [0.581] [0.121]***
Inventor US Individual -0.823 -1.777 -0.799 -0.372
[0.549] [0.632]*** [0.722] [0.135]***
Inventor US University -1.256 -1.747 -1.348 -0.348
[0.432]*** [0.590]*** [0.547]** [0.111]***
Developer Foreign Corp 0.94 -0.18 1.252 0.062
[0.507]* [0.526] [0.588]** [0.096]
Developer Others(US NPR & Fed) 1.229 -0.978 1.586 -0.224
[0.864] [0.977] [0.963]* [0.197]
Therapeutic category dummies Y Y Y Y Constant 1.32 4.697 1.853 -3.181 Observations 505 505 505 505 Uncensored observations
367
Log-likelihood
-1086.1 R-squared 0.26 0.42
0.4
Robust standard errors in brackets; * p<0.1; ** p<0.05; *** p<0.01 TABLE 7 NOTES: Columns [1] & [2] report OLS estimates of the effect of RHS variables on log(1+Upfront fees) and royalty rate (in %) respectively. Column [3] reports MLE(Tobit) estimates of the effect of RHS variables on log(1+Upfront fees). Column [4] reports OLS estimates of the effect of RHS variables on log(1/1-r), where r is royalty rate and 0> r<1. Upfront fees are in 1000’s of FY2008$. All estimations include 65 therapeutic category dummy variables. “U.S. corporations” is the reference organizational form (for both inventors and developers) and omitted from the estimations.

40
TABLE 8: OLS and Tobit estimates of hidden quality and unobservable effort proxies on minimum royalty and milestone payments
[1] [2] [3] [4]
log min royalties
log milestone
log min royalties
log milestone
Forward citations at license date (FCITESB) -0.198 0.047 -0.562 0.072
[0.074]*** [0.078] [0.235]** [0.417]
Forward citations after license date (FCITESA) -0.022 0.023 -0.056 0.11
[0.015] [0.011]** [0.035] [0.031]***
Log Inventor patents (INVPAT) -0.05 0.045 0.091 0.599
[0.234] [0.258] [0.509] [0.707]
Log Developer patents (DEVPAT) -0.155 0.037 -0.657 -0.641
[0.380] [0.345] [1.034] [1.072]
FCITESA X INVPAT 0.028 -0.02 0.047 -0.096
[0.010]*** [0.009]** [0.020]** [0.039]**
FCITESA X DEVPAT -0.001 -0.023 -0.004 -0.043
[0.012] [0.017] [0.042] [0.056]
Know-how clause 0.136 0.927 0.293 2.667
[0.349] [0.341]*** [0.783] [1.016]***
Show-how clause -0.315 -0.095 -1.341 -0.963
[0.423] [0.396] [1.027] [1.417]
Due-diligence clause 0.574 0.6 1.607 1.635
[0.339]* [0.360]* [0.729]** [0.968]*
Number of patents in license 0.05 -0.005 0.093 0.047
[0.056] [0.053] [0.119] [0.156]
Litigated patents -1.127 0.582 -3.021 0.19
[0.695] [0.536] [1.689]* [3.071]
% of science references -0.013 0.212 0.064 0.939
[0.147] [0.116]* [0.333] [0.396]**
Exclusive 0.008 1.731 -0.46 8.472
[0.479] [0.383]*** [1.136] [1.813]***
Exclusive to field 0.335 1.656 0.549 7.844
[0.497] [0.418]*** [1.166] [1.853]***
Territorial restrictions 0.043 0.125 0.015 -0.092
[0.472] [0.443] [1.083] [1.331]
Log Trend -0.664 0.361 -1.479 1.886
[0.257]** [0.244] [0.547]*** [0.914]**
Contd.
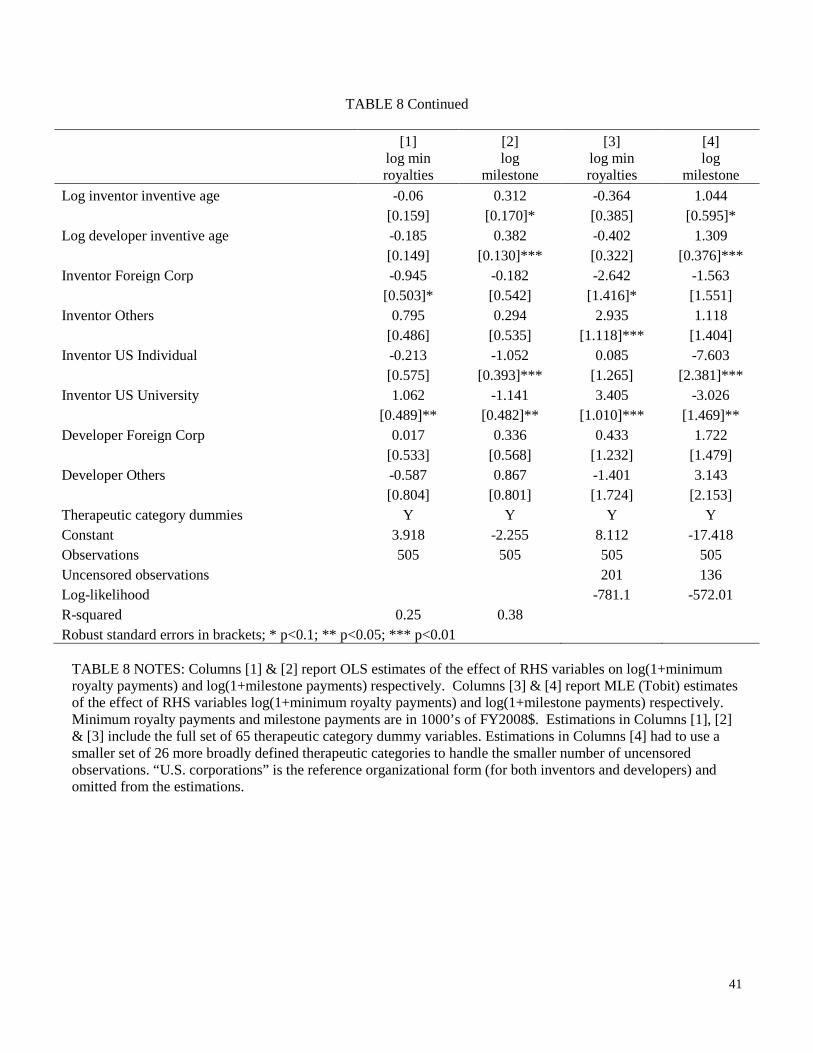
41
TABLE 8 Continued
[1] [2] [3] [4]
log min royalties
log milestone
log min royalties
log milestone
Log inventor inventive age -0.06 0.312 -0.364 1.044
[0.159] [0.170]* [0.385] [0.595]*
Log developer inventive age -0.185 0.382 -0.402 1.309
[0.149] [0.130]*** [0.322] [0.376]***
Inventor Foreign Corp -0.945 -0.182 -2.642 -1.563
[0.503]* [0.542] [1.416]* [1.551]
Inventor Others 0.795 0.294 2.935 1.118
[0.486] [0.535] [1.118]*** [1.404]
Inventor US Individual -0.213 -1.052 0.085 -7.603
[0.575] [0.393]*** [1.265] [2.381]***
Inventor US University 1.062 -1.141 3.405 -3.026
[0.489]** [0.482]** [1.010]*** [1.469]**
Developer Foreign Corp 0.017 0.336 0.433 1.722
[0.533] [0.568] [1.232] [1.479]
Developer Others -0.587 0.867 -1.401 3.143
[0.804] [0.801] [1.724] [2.153]
Therapeutic category dummies Y Y Y Y Constant 3.918 -2.255 8.112 -17.418 Observations 505 505 505 505 Uncensored observations
201 136
Log-likelihood
-781.1 -572.01 R-squared 0.25 0.38
Robust standard errors in brackets; * p<0.1; ** p<0.05; *** p<0.01
TABLE 8 NOTES: Columns [1] & [2] report OLS estimates of the effect of RHS variables on log(1+minimum royalty payments) and log(1+milestone payments) respectively. Columns [3] & [4] report MLE (Tobit) estimates of the effect of RHS variables log(1+minimum royalty payments) and log(1+milestone payments) respectively. Minimum royalty payments and milestone payments are in 1000’s of FY2008$. Estimations in Columns [1], [2] & [3] include the full set of 65 therapeutic category dummy variables. Estimations in Columns [4] had to use a smaller set of 26 more broadly defined therapeutic categories to handle the smaller number of uncensored observations. “U.S. corporations” is the reference organizational form (for both inventors and developers) and omitted from the estimations.
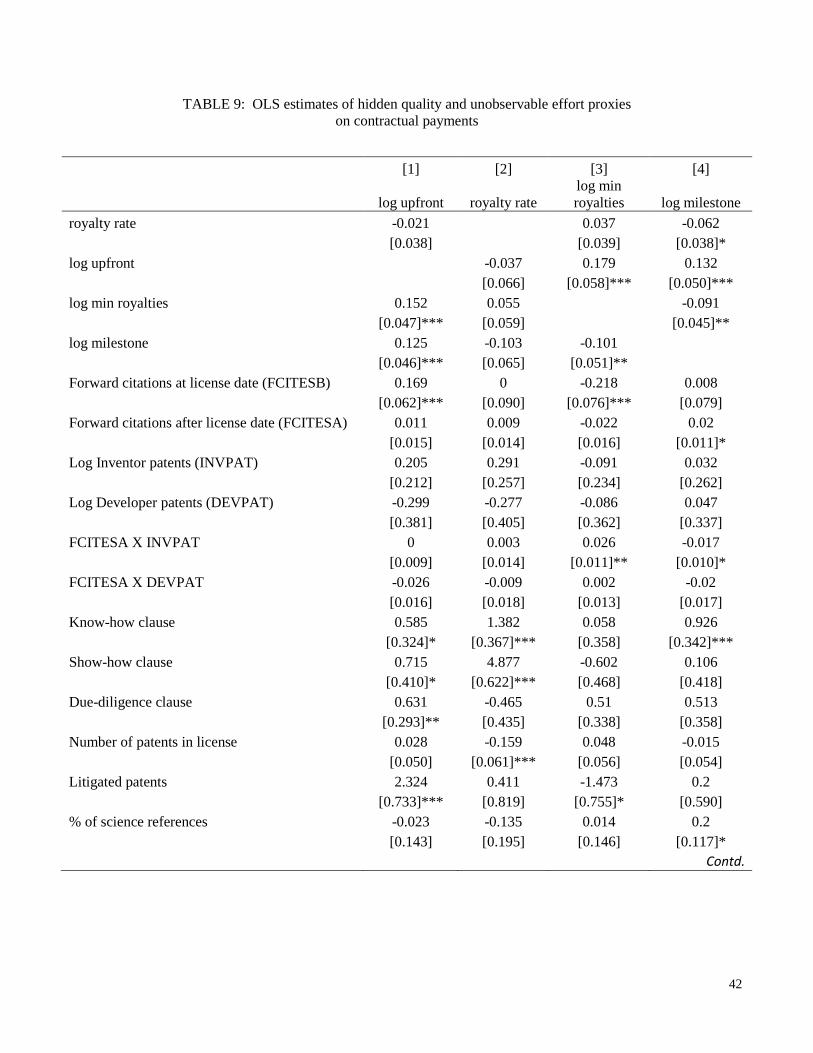
42
TABLE 9: OLS estimates of hidden quality and unobservable effort proxies on contractual payments
[1] [2] [3] [4]
log upfront royalty rate log min royalties log milestone
royalty rate -0.021
0.037 -0.062
[0.038]
[0.039] [0.038]*
log upfront
-0.037 0.179 0.132
[0.066] [0.058]*** [0.050]***
log min royalties 0.152 0.055
-0.091
[0.047]*** [0.059]
[0.045]**
log milestone 0.125 -0.103 -0.101
[0.046]*** [0.065] [0.051]**
Forward citations at license date (FCITESB) 0.169 0 -0.218 0.008
[0.062]*** [0.090] [0.076]*** [0.079]
Forward citations after license date (FCITESA) 0.011 0.009 -0.022 0.02
[0.015] [0.014] [0.016] [0.011]*
Log Inventor patents (INVPAT) 0.205 0.291 -0.091 0.032
[0.212] [0.257] [0.234] [0.262]
Log Developer patents (DEVPAT) -0.299 -0.277 -0.086 0.047
[0.381] [0.405] [0.362] [0.337]
FCITESA X INVPAT 0 0.003 0.026 -0.017
[0.009] [0.014] [0.011]** [0.010]*
FCITESA X DEVPAT -0.026 -0.009 0.002 -0.02
[0.016] [0.018] [0.013] [0.017]
Know-how clause 0.585 1.382 0.058 0.926
[0.324]* [0.367]*** [0.358] [0.342]***
Show-how clause 0.715 4.877 -0.602 0.106
[0.410]* [0.622]*** [0.468] [0.418]
Due-diligence clause 0.631 -0.465 0.51 0.513
[0.293]** [0.435] [0.338] [0.358]
Number of patents in license 0.028 -0.159 0.048 -0.015
[0.050] [0.061]*** [0.056] [0.054]
Litigated patents 2.324 0.411 -1.473 0.2
[0.733]*** [0.819] [0.755]* [0.590]
% of science references -0.023 -0.135 0.014 0.2
[0.143] [0.195] [0.146] [0.117]*
Contd.

43
TABLE 9: Continued
[1] [2] [3] [4]
log upfront royalty rate log min royalties log milestone
Exclusive 0.372 -0.161 0.09 1.63
[0.447] [0.578] [0.480] [0.383]***
Exclusive to field 0.22 0.74 0.398 1.66
[0.462] [0.690] [0.500] [0.427]***
Territorial restrictions 0.268 1.921 -0.059 0.214
[0.423] [0.719]*** [0.477] [0.435]
Log Trend 0.135 0.304 -0.649 0.305
[0.216] [0.267] [0.259]** [0.242]
Log inventor age 0.163 0.149 -0.067 0.288
[0.154] [0.199] [0.159] [0.164]*
Log developer age 0.415 0.118 -0.226 0.312
[0.134]*** [0.177] [0.152] [0.128]**
Inventor Foreign Corp 0.121 -0.404 -0.941 -0.29
[0.538] [0.711] [0.491]* [0.532]
Inventor Others -0.856 -3.025 1.049 0.264
[0.483]* [0.593]*** [0.493]** [0.541]
Inventor US Individual -0.697 -1.903 -0.107 -1.073
[0.541] [0.635]*** [0.581] [0.389]***
Inventor US University -1.312 -1.969 1.236 -0.988
[0.433]*** [0.615]*** [0.485]** [0.487]**
Developer Foreign Corp 0.891 -0.112 -0.111 0.203
[0.500]* [0.535] [0.519] [0.566]
Developer Others 1.19 -0.811 -0.684 0.59
[0.881] [0.967] [0.845] [0.829]
Therapeutic category dummies Y Y Y Y Constant 1.103 4.298 3.281 -1.781 Observations 505 505 505 505 R-squared 0.29 0.43 0.27 0.4 Robust standard errors in brackets; * p<0.1; ** p<0.05; *** p<0.01
TABLE 9 NOTES: The columns report OLS estimates of the effect of RHS variables on log(1+Upfront fees), royalty rate (in %), log(1+Minimum royalty payments) and log(1+milestone payments) respectively. Upfront fees, minimum royalty payments and milestone payments are in 1000’s of FY2008$. All estimations include 65 therapeutic category dummy variables. “U.S. corporations” is the reference organizational form (for both inventors and developers) and omitted from the estimations.

44
FIGURE 1: Box plot of royalty rates (in %) by license type
0 2 4 6 8 10 12 14 16 18 20 22 24 26 28 30Royalty rates (%)
Show-how clause
Know-how clause
Ordinary license
FIGURE 1 NOTES: The lines in the boxes represent median values for each category (ordinary license = 3.25%, know-how license = 5%, show-how license = 7.75%) among the 505 sample licenses. Lower and upper hinges of boxes represent respectively 25th and 75th quartile values. Lower and upper whiskers represent the lowest datum within 1.5 IQR of the lower quartile, and the highest datum still within 1.5 IQR of the upper quartile respectively. Dots represent outlying observations.