Embed Size (px)
Citation preview

1
IMPEL – TFS Enforcement Actions
Project Report 2014 – 2015
Enforcement of the European Waste Shipment Regulation
2
Introduction to IMPEL
The European Union Network for the Implementation and Enforcement of Environmental Law (IMPEL) is an international non-profit association of the environmental authorities of the EU Member States, acceding and candidate countries of the European Union and EEA countries. The association is registered in Belgium and its legal seat is in Brussels, Belgium. IMPEL was set up in 1992 as an informal Network of European regulators and authorities concerned with the implementation and enforcement of environmental law. The Network’s objective is to create the necessary impetus in the European Community to make progress on ensuring a more effective application of environmental legislation. The core of the IMPEL activities concerns awareness raising, capacity building and exchange of information and experiences on implementation, enforcement and international enforcement collaboration as well as promoting and supporting the practicability and enforceability of European environmental legislation. During the previous years IMPEL has developed into a considerable, widely known organisation, being mentioned in a number of EU legislative and policy documents, e.g. the 7th Environment Action Programme and the Recommendation on Minimum Criteria for Environmental Inspections. The expertise and experience of the participants within IMPEL make the network uniquely qualified to work on both technical and regulatory aspects of EU environmental legislation. Information on the IMPEL Network is also available through its website at: www.impel.eu
3
Title report: IMPEL–TFS Enforcement Actions 2014 - 2015
Number report:
Project manager: Katie Olley, Scottish Environment Protection Agency
Report adopted at IMPEL
General Assembly
Authors:
Katie Olley/ Naomi Ross/ Pádraig O’Shea – SEPA
Number of pages:
Project team
Katie Olley
Naomi Ross
Padraig O’Shea
Anno Loonstra
Mark Preston
Sebastien Nochez
Katharina Aiblinger-Madersbacher
Disclaimer: This report is the result of a project within the IMPEL network. The content does not necessarily represent the view of the national administrative.

2
Contents
IMPEL Enforcement Actions 1
Project Report 2014 – 2015 1
Enforcement of the European Waste Shipment Regulation 1
1. Executive Summary 4
2. Foreword 5
3. Introduction 7
4. Project approach, workflow and progress 9
4.1 9
1.1 Overall Developments since Enforcement Actions III 9
4.1.1 Changes to Waste Shipment Regulation 9
4.2 Participating Countries 10
4.3 Communications between Participating Countries 11
4.3.1 Guidance development 11
4.3.2 Exchange of Inspectors 12
4.3.3 Basecamp Data Sharing 14
4.3.4 Case Studies & Newsletters 14
4.3.5 Webinars 14
4.3.6 Best Practice Meetings 15
4.3.7 On-line Survey 15
4.4 Inspection Selection Methods 23
5. Inspection Results 25
5.1 General considerations regarding interpretation of reported data 25
5.2 Number of Transport Inspections 25
5.3 Number of Company Inspections 28
5.4 Transport Violation Data Analysis 28
5.5 Company Violations Data Analysis 33
5.6 Violation Outcomes 37
5.6.1 Outcomes 38
5.7 Non-OECD Shipment Violations 38
5.7.1 Overall Non-OECD Shipment Violations 38
5.7.2 Non-OECD Shipment Violations by Region 41
5.8 Trends in violation data 44
5.9 Total annual data (2012-2015) 48
6 Exchanges 56
7 Conclusions and Recommendations 66
3
7.1 Conclusions 66
7.2 Recommendations 67
8. Literature and References 69
Annex I: Participants 71
Annex II: Terms of Reference 72
Annex III: Newsletter 82
4
1. Executive Summary
European Regulation (EC) No 1013/2006 on shipments of waste concerns the prevention of the illegal shipment of waste. Obligations are placed on Member States to carry out waste shipment inspections, to cooperate with each other, and to establish appropriate penalties and fines to deter illegal shipments. The Enforcement Actions Project 2014 – 2015 is the eighth inspection project under the umbrella of IMPEL-TFS. It follows on from the Seaport projects I & II, the Verification projects I & II (running from 2003 up to June 2006), the Waste Enforcement Actions (EAI) Project (from 2006 to 2008), European Enforcement Actions II (EAII) Project (from 2008 to 2012) and the Enforcement Actions III project (from 2012 – 2013). It aims to promote and improve inspections and enforcement of waste shipments through and out of the European Union.
The project objectives included carrying out inspections on waste shipments, knowledge exchange and capacity building in order to harmonise the level of enforcement and expertise within the participating countries. For this purpose joint activities were carried out over six inspection periods throughout 2014 (Year 1) and 2015 (Year 2). This report covers the results for the inspection periods in both Years 1 and 2.
Thirty-one countries participated in the project; these were Austria, Belgium, Bulgaria, Croatia, Czech Republic, Cyprus, Denmark, Estonia, Finland, France, Germany, Hungary, Ireland, Italy, Latvia, Luxembourg, Malta, The Netherlands, Norway, Poland, Portugal, Romania, Serbia, Slovenia, Spain, Sweden, Switzerland, England, Wales, Scotland and Northern Ireland of which, 26 countries submitted inspection results. Where joint border controls occurred, one country submitted the inspection results. Contact was also made with Greece and Macedonia in an attempt to involve them in the project; both countries have indicated they are willing to participate in the next round of Enforcement Actions work.
A total of 4,787 administrative and 12,396 physical transport inspections were undertaken during EAIV, with the majority conducted on roads or at ports, combining a mix of random, on site and targeted inspections. Waste shipments accounted for 28.7% of these inspections, of which 16.6% (815) were in violation of the Waste Shipment Regulation (WSR). Over the same period, 486 company inspections took place, of which, 91.2% were waste-related, with 66 (14.9%) violations detected.
It should be noted that the reported figures do not reflect the overall number of inspections and violations in Europe, as the project gives a ‘snapshot’ of total inspection activity within the participant countries.
Nevertheless, the results clearly show the active participation of the majority of Member States in the project. The sustained level of inspections, plus the participation of customs officers, police officers and port authorities indicate that enforcement of the EU waste shipment regulation remains a priority in many Member States. The violations captured in this project also clearly demonstrate that there is still effort needed to move towards a level playing field of enforcement.
Disclaimer: This report is the result of a project within the IMPEL network. The content does not necessarily represent the view of the national administrations.

5
2. Foreword
The Commission has highly appreciated IMPEL's projects to strengthen the inspections and enforcement of the Waste Shipment Regulation. This report marks the successful completion of IMPEL's latest enforcement actions which contribute valuably to combatting illegal waste shipments. Just over ten years ago, the dumping of toxic waste from the ship Probo Koala resulted in devastating consequences for people living in the Ivory Coast. This case gave rise to an international outrage and spurred pleas to fight illegal waste shipments. However, illegal shipments are still a serious problem today requiring actions to be taken. The Commission's Circular Economy Action Plan foresees actions to step up the enforcement of the Waste Shipment Regulation, http://ec.europa.eu/environment/circular-economy/index_en.htm In addition to significant benefits for the environment and health, this also plays a central role in our transition to a circular economy: if waste is recycled instead of being illegally exported, we bring valuable materials back into the economy, while fostering energy savings and reducing greenhouse gas emissions. The Waste Shipment Regulation was recently strengthened with new inspection requirements, including increased powers for inspectors to require evidence from waste exporters and risk-based planning of inspections by Member States to establish the capacity needed to prevent illegal shipments. The Commission is currently working together with Member States to make sure that these new requirements are effectively implemented: - An exchange of experiences is being organised with Member States to facilitate the
application of the new rules. - A correlation table between customs and waste codes was recently adopted to support
customs officials in preventing illegal waste exports. - The grounds for an electronic notification system are being prepared, which is expected to
improve the traceability of waste shipments. - Guidance to support Member States in developing inspections plans for waste shipments is
being provided by IMPEL with the assistance of the Commission. - High-value waste streams, such as end-of-life vehicles, will be targeted specifically, to
prevent raw materials leakage. The Commission is also preparing the review of the Waste Shipment Regulation. The review will consider, inter alia, the effectiveness of inspection plans to prevent illegal shipments and is foreseen by 31 December 2020. Let me conclude by emphasizing the importance of IMPEL as a strategic partner for the Commission. IMPEL's projects on enforcement actions and guidance for inspection planning are among the key measures to improve inspections and enforcement of the Waste Shipment
6
Regulation. Our continued cooperation and joint efforts will be instrumental to achieve success in preventing illegal waste shipments.
Kęstutis Sadauskas Director for Circular Economy and Green Growth DG Environment European Commission

7
3. Introduction
Waste shipments can be a double-edged sword. If properly carried out in an environmentally sound manner, they can deliver resources to industries that use them; however, improper or inadequate treatment of waste can cause severe damage to the environment and human health. Increasingly demanding recovery targets coupled with the declining access to raw materials has led to the rapid rise in global waste shipments. Waste, like water, generally finds ‘the lowest’ level, meaning that the lowest cost, not necessarily most environmentally sound process is usually employed to ‘get rid’. This can mean that waste is treated in a manner that can cause severe detriment to the environment and human health if not properly monitored. The European Community has set up rules for waste management and targets for recovery to minimise the risks associated with managing waste. European Regulation (EC) No 1013/2006 on shipments of waste (WSR) contains a number of measures to prevent the illegal shipment of waste. These include obligations on Member States (MS) to carry out waste shipment inspections, to cooperate with other MS and to establish appropriate penalties and fines. The WSR was amended in 2014 to strengthen the rules by clarifying ‘burden of proof’ requirements and ensuring that all Member States put inspection plans in place. Currently, the work of IMPEL is grouped into expert groups; the Waste and TFS cluster concerns the Transfrontier Shipment of Waste (TFS) regime. Since 2003 the IMPEL-TFS cluster has carried out several enforcement projects with the aim of supporting effective cross-border control of waste shipments and targeting those waste shipments suspected of being illegal. The Seaport I & II projects focussed on waste shipments via seaports; the Verification I & II projects concentrated on shipments within Europe. Both the Seaports and the Verification projects ran from 2003 until 2006. The objectives of these projects were continued in the Enforcement Actions I, II and III projects. These projects clearly displayed the need for cross-border collaboration at an operational level in order to implement and enforce the WSR effectively. During these projects, valuable experience was gained on inspection methods, the planning of inspections and the exchange of staff and technical information. This latest tranche of IMPEL Enforcement Actions project has come to a successful end, after fulfilling six inspection periods and this report contains the results, conclusions and recommendations of this project, covering the inspection period March 2014 to December 2015. The Enforcement Actions work within IMPEL forms part of core work for the group, which is reported in two yearly inspection cycles. The 2014-2015 inspection cycle is termed ‘Enforcement Actions IV’ to enable comparisons with previous twenty-four month projects. The main objectives of this project are similar to those of the previous Enforcement Actions project including the following:
To work towards an adequate level of inspections in all Member States;
To introduce complete measures in order to prevent and detect illegal waste shipments and to deter illegal waste exporters;
To verify waste destination and the treatment at destination within or outside Europe;
To set up training and exchange programmes for inspectors; and
To maintain and improve the network and collaboration of front line inspectors and other competent authorities.

8
The report includes comparison of data where there has been noticeable trend change compared to previous years. The results of this project will be distributed to various stakeholders such as the IMPEL network, the European Commission, Member States, IMPEL-TFS National Contact Points, the European Parliament, the Waste Shipment Correspondents Group, the Basel Secretariat and NGOs, and be published on the IMPEL website.

9
4. Project approach, workflow and progress
The IMPEL Enforcement Action project has enabled joint inspections and exchange programmes under Regulation EC (No) 1013/2006 to take place. These inspections took place on roads, harbours and railheads, as well as at waste producers and waste management companies’ sites.
Internal and external communications were established via an online communication platform (Basecamp), newsletters, press releases and physical and online meetings.
The coordinator of the project has been the Scottish Environment Protection Agency (SEPA) under the umbrella of the IMPEL. Funding for meetings, exchanges and inspection tools was provided by IMPEL. The participants contributed their time and expertise, and host countries also contributed financially during exchanges. It is estimated that over 2040 days a year was contributed each year by those taking part in the project (please see section 3.2), 4080 days throughout the course of the two year inspection cycle.
This report covers inspection results and project outcomes from March 2014 through to December 2015.
4.1 Overall Developments since Enforcement Actions III
The number of participating countries within Enforcement Actions IV was 31, of which 26 reported inspection activities. By comparison, the number of participating countries during EA III was 30, of which 24 reported inspection activities. Enforcement Actions IV reported a total of 17,183 physical and administrative transport inspections, of which 4,923 (28.7%) were related to transfrontier shipment of waste. This is a higher proportion of waste inspections than EA III which reported 22,414 inspections, of which 3,162 were waste related (14.1%). Transport inspections are most frequently carried out at the roadside, accounting for the high number of intra-EU movements reported in the project. This was also the case in EAIII. The total number of company inspections related to transfrontier shipment of waste in EA IV was 486 whereas 354 were carried out in EA III. Overall, 14 countries reported company inspections in EA IV, compared with 11 during EA III. Several countries, namely Republic of Ireland, Scotland, The Netherlands and England provided full year data for the inspection period, i.e. this was reported in addition to their ‘snapshot’ inspection data. The idea behind this was to get a fuller picture of emerging trends in waste shipments. It is also hoped that the data obtained provide a clearer view of the daily work of competent authorities and their inspection methods.
4.1.1 Changes to Waste Shipment Regulation
The European Regulation (EC) No 1013/2006 covers rules for shipments of waste both within the EU and between the EU and third countries. They specifically prohibit exports of hazardous waste to countries outside the OECD and exports of waste for disposal outside EU.

10
In May 2014 Regulation 660/2014 amending the WSR was published in the Official Journal. The Regulation aims to strengthen Member States’ inspection systems. It requires Member States to establish inspection plans, based on risk assessments, by January 2017 for the enforcement of the waste shipment regime. The Regulation also gives authorities greater powers to demand evidence from suspected waste importers and exporters. IMPEL is currently running a project – Waste shipment inspection planning - to draft guidance for authorities on how to draw up an inspection plan. It is likely that Member States’ plans will have an impact on the inspection results and methods for future Enforcement Action Projects.
4.2 Participating Countries
In Year 1, 26 countries participated in the project; these were Austria, Belgium, Czech Republic, Cyprus, Denmark, Estonia, Finland, France, Germany, Ireland, Latvia, Luxembourg, Malta, The Netherlands, Norway, Poland, Portugal, Romania, Serbia, Slovenia, Sweden, Switzerland, United Kingdom (England, Scotland and Northern Ireland) of which, 19 countries submitted inspection results. In Year 1 contact was also been made with Croatia, Iceland, Greece, Hungary, FYR Macedonia, Italy, Spain, Slovakia, Turkey and Ukraine with an attempt to involve them in the project.
By Year 2, 31 countries were taking part in the project including all the countries in Year 1 with the addition of Croatia, Spain, Bulgaria and Wales. In total 20 countries submitted inspection results in Year 2. A breakdown of the contributions of days of participation spent on the EA project by all participating countries combined is provided in Table A. The number of days contribution is broken down depending on the type of project contributor, and details are provided of the tasks associated with these days. The aim is to get a general picture of how much time resource IMPEL derives from its members. Note: The total number of days participation is indicative only, as individual contributions are not provided by each participating country.
Table A: Overview of participation for EA
Project Role Number of days
participation a year Details of time spent
Project Manager 60
Project management, report writing and technical editing, organising exchanges, data analysis and communicating to project team members
Project team 40
Data analysis of inspection results submitted by all participating countries. Originator for summary and final reports for Enforcement Actions

11
Project Member (s) 1940
(100 inspectors (2 per country from competent authority and two from other regulatory authorities) participating in 18 days of joint inspections to October + report filling for countries) + best practice meeting of 30 member countries + best practice meeting preparation and fulfilling actions + WebEx participation + exchanges + drafting items for IMPEL newsletters
Cluster Secretary 2 Communicating with project and support in arranging best practice meeting
Overall total 2042
4.3 Communications between Participating Countries
For each participating country, a coordinator was appointed responsible for the implementation and coordination of the project. The country co-ordinator is principally responsible for submitting inspection results to the Project Team. The EA project management was the Scottish Environment Protection Agency (SEPA) under the umbrella of the IMPEL Waste and TFS cluster. Communications between each of the participating countries has been carried out using the following methods:
Exchange of inspectors
Basecamp on-line data sharing
Case studies
Webinars
Best practice meetings and
An on-line survey
Further efforts to strengthen communications between all of the project participants and interested parties include:
Provision of news stories for IMPEL newsletters
Implementation of the ‘snowball effect’ in an effort by existing participants to engage neighbouring countries – this has resulted in participation by Spain, Greece and Bulgaria
Participation in and data gathering for the Countering WEEE Illegal Trade project
Regular updates and meetings with National Contact Points, IMPEL-TFS Steering Committee and IMPEL Board
Template press release was produced for use by the competent authorities
Further details of each of these communication methods is provided below 4.3.1 Guidance development Guidance has been drafted up for participants to use during the course of 2014-2015. The 2008 ‘A Practical guidance for Managing illegal shipments of waste’ has been re-drafted based on

12
competent authorities’ experiences with intercepting illegal shipments and dealing with them. The document is now entitled ‘A guide to repatriating waste’ and emphasises the importance of communication between the competent authorities involved. The processes involved in returning waste to its country of origin have also been simplified. It is currently being trialled by IMPEL members for twelve months before it is put to the General Assembly for adoption in late 2016.
Guidance on the classification of WEEE and components of WEEE was also discussed at the 2015 Best Practice meeting in Landshut. The guide is for frontline inspectors. The draft of this guidance was additionally presented at IMPEL’s National Contact Point meeting (for TFS officers) in in Ljubljana in October 2015 to encourage discussion on this topic and to achieve a common classification of different types of WEEE as hazardous, non-hazardous, ‘listed’ or’ non-listed’ waste.
Comments submitted by some countries show that there are still discrepancies especially with regard to the assessment of certain types of WEEE as GC 020 or ‘non-listed’ waste. This is significant, as ‘non-listed’ waste shipments are subject to the procedure of prior written notification and consent. It is also evident that there is a need to define what evidence should accompany a shipment, or be provided to competent authorities on request, in order to demonstrate to inspectors in the field that the waste is non-hazardous. This will necessitate further consideration of brominated flame retardants in WEEE and therefore the guidance will be finalised during the next inspection round (2016-2017).
4.3.2 Exchange of Inspectors
Joint inspections and exchange programmes under the project took place in accordance with Regulation EC (No) 1013/2006, which requires Member States (MS) to co-operate bilaterally or multilaterally in order to facilitate the prevention and detection of illegal shipments. The project also funded a successful exchange programme. This enabled inspectors from one or more countries to visit a host country and either observe inspection and enforcement practices in another jurisdiction, or participate in joint inspections at a border point. These exchanges included road inspections and inspections at ports, as well as inspections at waste producers and waste management companies’ sites. The focus of the exchange programme was agreed between the participating inspectors. It typically involved targeting priority waste streams, e.g. Waste Electrical and Electronic Equipment (WEEE), used tyres, End-of-Life Vehicles (ELVs), or targeting a particular transport route of mutual concern or importance. Some of these exchange visits were written up and presented back to the project group via a ‘webinar’, and it was clear to see that sharing experiences and opinions on the ground continues to be a very effective training tool. Exchanges are central to introducing competent authorities and new officers to the practicalities of waste shipment inspections. They also strongly increase communications between the competent authorities involved. This was much evident following the Ireland – Scotland exchanges, which has resulted in increased detection of illegal shipments moving between the two countries. There were several productive outcomes from the exchanges, for example some countries purchased better personal protection equipment to carry out inspections more safely, and some acted as experts to train less experienced inspectors in the project. Several countries wrote up reports detailing the experiences and outcomes of the exchanges, and uploaded these to Basecamp to share with other users. Details of the outcomes are provided in Table N. As can be
13
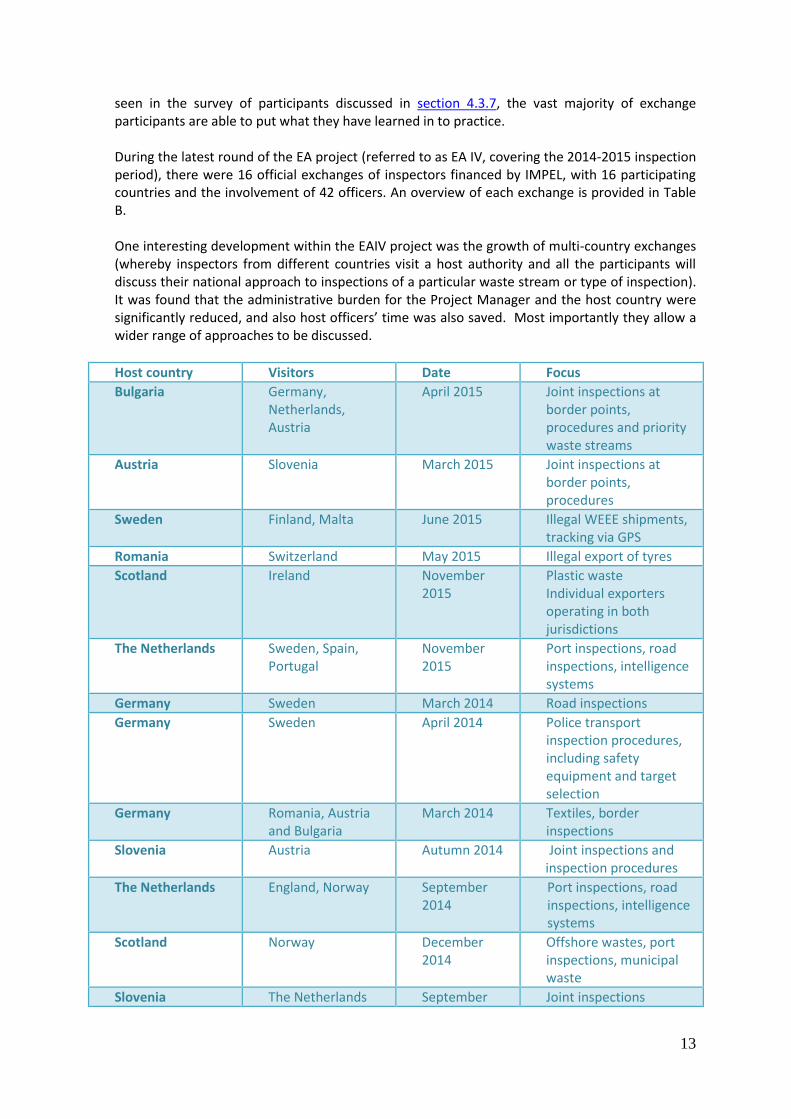
seen in the survey of participants discussed in section 4.3.7, the vast majority of exchange participants are able to put what they have learned in to practice. During the latest round of the EA project (referred to as EA IV, covering the 2014-2015 inspection period), there were 16 official exchanges of inspectors financed by IMPEL, with 16 participating countries and the involvement of 42 officers. An overview of each exchange is provided in Table B. One interesting development within the EAIV project was the growth of multi-country exchanges (whereby inspectors from different countries visit a host authority and all the participants will discuss their national approach to inspections of a particular waste stream or type of inspection). It was found that the administrative burden for the Project Manager and the host country were significantly reduced, and also host officers’ time was also saved. Most importantly they allow a wider range of approaches to be discussed.
Host country Visitors Date Focus
Bulgaria Germany, Netherlands, Austria
April 2015 Joint inspections at border points, procedures and priority waste streams
Austria Slovenia March 2015 Joint inspections at border points, procedures
Sweden Finland, Malta June 2015 Illegal WEEE shipments, tracking via GPS
Romania Switzerland May 2015 Illegal export of tyres
Scotland Ireland November 2015
Plastic waste Individual exporters operating in both jurisdictions
The Netherlands Sweden, Spain, Portugal
November 2015
Port inspections, road inspections, intelligence systems
Germany Sweden March 2014 Road inspections
Germany Sweden April 2014 Police transport inspection procedures, including safety equipment and target selection
Germany Romania, Austria and Bulgaria
March 2014 Textiles, border inspections
Slovenia Austria Autumn 2014 Joint inspections and inspection procedures
The Netherlands England, Norway September 2014
Port inspections, road inspections, intelligence systems
Scotland Norway December 2014
Offshore wastes, port inspections, municipal waste
Slovenia The Netherlands September Joint inspections
14
and Estonia 2014 Exchange of procedural requirements
Belgium Germany September 2014
Collaboration with Waste Sites II project
Ireland Scotland November 2014
Municipal waste, operators acting in both jurisdictions
Italy Sweden December 2014
Police procedures in detecting illegal shipments of waste
Table B: Overview of exchanges 2014-2015
Further details of these exchanges are included in section Error! Reference source not found.. 4.3.3 Basecamp Data Sharing
Basecamp – an online communication platform – is used by participants to discuss Enforcement Action issues, such as inspection planning, best practice techniques, exchange arrangements and to upload inspection results. It is a well-established platform for IMPEL participants and is used regularly, with frequent posts from most member countries. It is also used to arrange meetings.
4.3.4 Case Studies & Newsletters
A newsletter was prepared in October 2014 and distributed to the project participants and other concerned authorities in EU Member States, disseminating latest results, practical experience, and upcoming news from the project. The EA Newsletter contained the following information:
Updates on the Enforcement Action Project, including the exchanges that had been organised
A summary of a case study of how Dutch authorities intercepted illegal shipments of e-waste from Germany to the Ivory Coast and Nigeria
A summary of a case study of a roadside inspection in Lower Bavaria which found e-waste and and ELVs moving from Austria to Nigeria
A short report on an exchange to The Netherlands, organised for English and Norwegian inspectors
Forthcoming milestones for the Project A copy of the newsletter is provided in Annex III. After the production of this newsletter, Enforcement Actions participants instead contributed to the IMPEL newsletter, which has a wider audience. 4.3.5 Webinars
Several ‘webinars’ (internet enabled conference calls which allow participants to access a presentation and discussion at their own desks), were hosted within 2014 and 2015. They proved to be a useful tool in sharing best practice information between meetings. Following each presentation there was an opportunity for those attending to discuss issues and to put questions to the presenter in an open forum.
15
The content and host country was rotated as the primary objective of the webinars was to maximise communications and sustain project momentum throughout inspection periods and in between annual conferences. The following webinars were hosted:
Shipments of electronic scrap: experience from Germany
CWIT project: presentation by UNU, Interpol and WEEE Forum
Cathode Ray Tubes on the move from France via the Netherlands to Vietnam or China: The Netherlands
IMPEL-TFS exchange between Swedish and Italian Police Corps
Project Group webinars for organising upcoming events and report drafting
The presentations given are available to participants on Basecamp.
4.3.6 Best Practice Meetings Best Practice meetings took place in Edinburgh in April 2014 and in Landshut in May 2015. The principal objective of both meetings was to discuss the barriers countries encountered by regulators on a day-to-day basis in enforcing the WSR, and to learn from each other’s inspection and enforcement experiences. Further details of these meetings remain available for participants on Basecamp, including copies of the presentations given at each meeting.
The programme for the 2014 meeting was broken down into key themes, each with a different country Group Leader to co-ordinate the main discussion points:
Repatriation
Smart exchanges
Verifications
Collaboration with Asian network
Actions were recorded and published in a meeting report that was circulated to the full project group on Basecamp. These actions could form discussion topics and objectives to build upon in future projects. Examples are:
Update of the guidance document the on repatriation of waste
On-going action to carry out more company inspections to identify more waste at the point of loading
On-going assistance to involve countries not yet participating
On-going action to provide guidance on the classification of e-waste components
4.3.7 On-line Survey A survey was conducted in 2015, which allowed all participants to express their views on the progress of the project, highlight details of the types of inspections carried out, how they experience their working environment and highlight the areas in which they need further assistance. In total, there were 32 respondents from 30 different countries. A summary of the main results is provided in Table C, alongside a comparison of the previous survey results (undertaken in 2013).

16
The survey also asked several questions to inform the outcome of the Countering WEEE Illegal Trade Project. The detailed answers are not provided but they have been incorporated into the CWIT project findings.

17
Topic 2015 Findings 2013 Findings Highlights
Intelligence and Risk Assessment
47% have intelligence capacity
68% use risk assessment
72% concentrate on specific waste streams
61% concentrate on specific operators
70% have intelligence capacity
75% use risk assessment
85% concentrate on specific waste streams
90% concentrate on specific operators
Reduction in intelligence capacity amongst participating countries
Fewer authorities concentrating on specific operators/ waste streams
The Inspectors and Inspections
50% had taken part in an exchange under the Enforcement Actions projects
87% would like to take part in one again
0 to 240 inspectors on TFS in organisation, median around 2.5 officers
65% inspect other regimes too, e.g. REACH
72% had taken part in an exchange under the Enforcement Actions projects
77% would like to do so again
1 to 52 inspectors on TFS in organisation, median around 6 officers
83% inspect other regimes too, e.g. REACH
Newer TFS inspectors
Reduction in enforcement capacity in inspectorates
Co-operation
66% co-operate with Police
83% co-operate with Customs
22% co-operate with harbour/ train operators
52% have formal agreements with other partners
48% do joint inspections with neighbouring countries
66% co-operate with Police
89% co-operate with Customs
44% co-operate with harbour/ train operators
50% have formal agreements with other partners
Reduction in co-operation with harbour/ train operators but otherwise limited change
Legal issues 66% encounter problems in bringing prosecutions (11% of which, rarely)
Very few cases are passed on to / accepted by prosecutors
‘significant quantity’ of contamination has to be demonstrated
Half encounter problems in bringing prosecutions
prosecutors not willing to take action
lack of experience
waste definition issues
Similar issues arising

18
Prosecutors do not have specialist knowledge and do not see TFS as a priority
Courts have lack of understanding. Gives wriggle room for defence.
Weak regulations. Export attempts not illegal until 2015.
No authority to undertake investigations by the competent authority and police are reluctant to take on cases
Gathering information from abroad
when export starts (can't prosecute for an attempt to ship)
Police prioritise other crimes
time-consuming to prepare cases
hazardous waste classification issues
Table C: 2015 Survey Findings

19 | P a g e
The survey shows that the majority of participants monitoring waste shipments also cover other regimes, e.g. REACH, waste permitting, etc. This is shown in Figure 1:
Figure 1 –Does your team/ department regulate other environmental regimes? As noted previously, the Enforcement Actions work provides ‘snapshot’ data of authorities’ inspections and the results recorded in the project may not show the full range of the types of inspections an authority undertakes each year. Consequently, a question on the types of inspections undertaken in 2014 was included in the survey. Figure 2 below shows the array of inspection types:

20 | P a g e
Figure 2 – Types of inspections undertaken in 2014
Officers reported various interesting findings during their 2014 inspections, including the emerging trend of ‘road hopping’ whereby officers find hauliers using alternative routes to move waste in an attempt to avoid inspection. The phenomenon of ‘port hopping’ has been known for some years now where exporters choose to ship their waste via ports with weaker inspection regimes1. One authority reported an improvement in the completeness of Annex VII forms moving with waste, whilst others reported that waste moving under ‘green list controls’, i.e. with Annex VII forms, had poorer levels of compliance than in previous years. Other authorities reported that the final destinations of plastics, WEEE and ELVs had changed from previous years. One authority reported that they were finding waste being shipped illegally in vans; their previous inspections had focussed on containers. It was also found that the destination of Zanzibar is becoming a gateway for WEEE (white goods) into mainland Africa via Tanzania; the purpose of exporting to Zanzibar is most likely to avoid inspection/potential costs. The survey highlighted that inspection authorities’ intelligence capabilities have declined by 20% since the last survey undertaken in 2013, with only 47% of authorities now having access to intelligence. The cause for these results has not yet been investigated but this will be covered in the next Best Practice meeting in 2016. Cautious assumptions might be that the newer participants do not yet have intelligence units or access to Police information that would assist them in their inspections. It could also be the case that intelligence operations are being reduced in competent authorities.
1 Reference Enforcement Actions II report
21 | P a g e
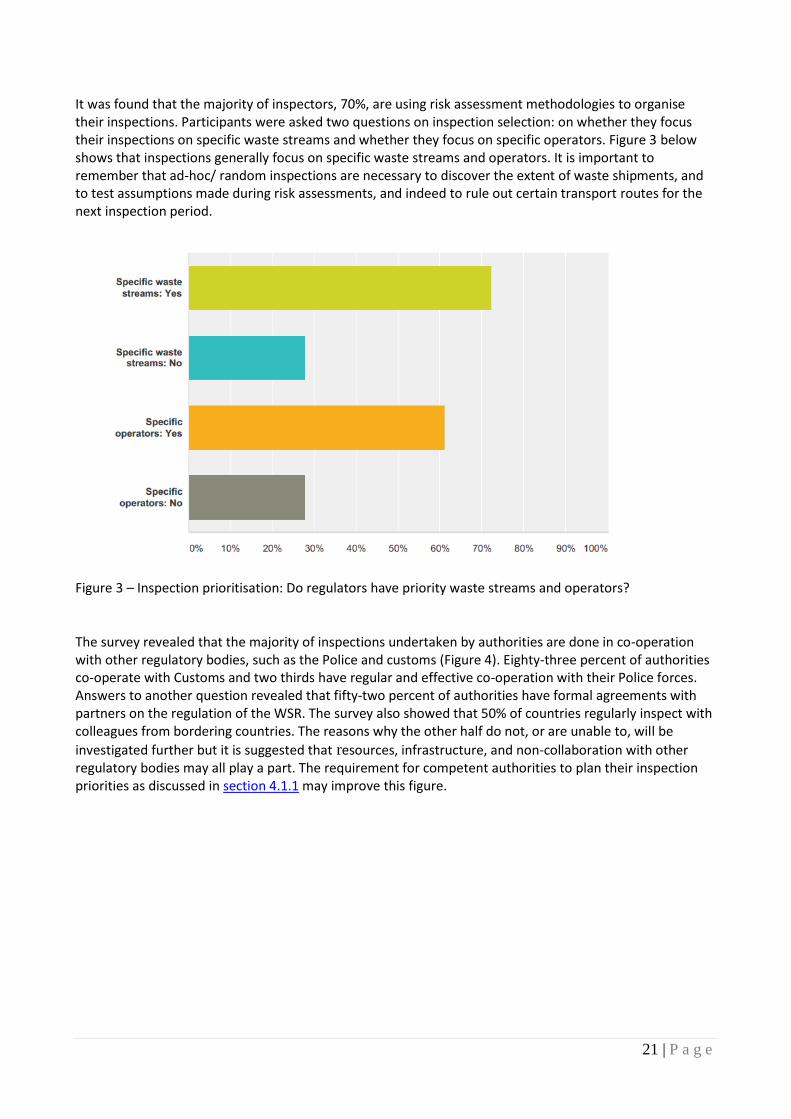
It was found that the majority of inspectors, 70%, are using risk assessment methodologies to organise their inspections. Participants were asked two questions on inspection selection: on whether they focus their inspections on specific waste streams and whether they focus on specific operators. Figure 3 below shows that inspections generally focus on specific waste streams and operators. It is important to remember that ad-hoc/ random inspections are necessary to discover the extent of waste shipments, and to test assumptions made during risk assessments, and indeed to rule out certain transport routes for the next inspection period.
Figure 3 – Inspection prioritisation: Do regulators have priority waste streams and operators?
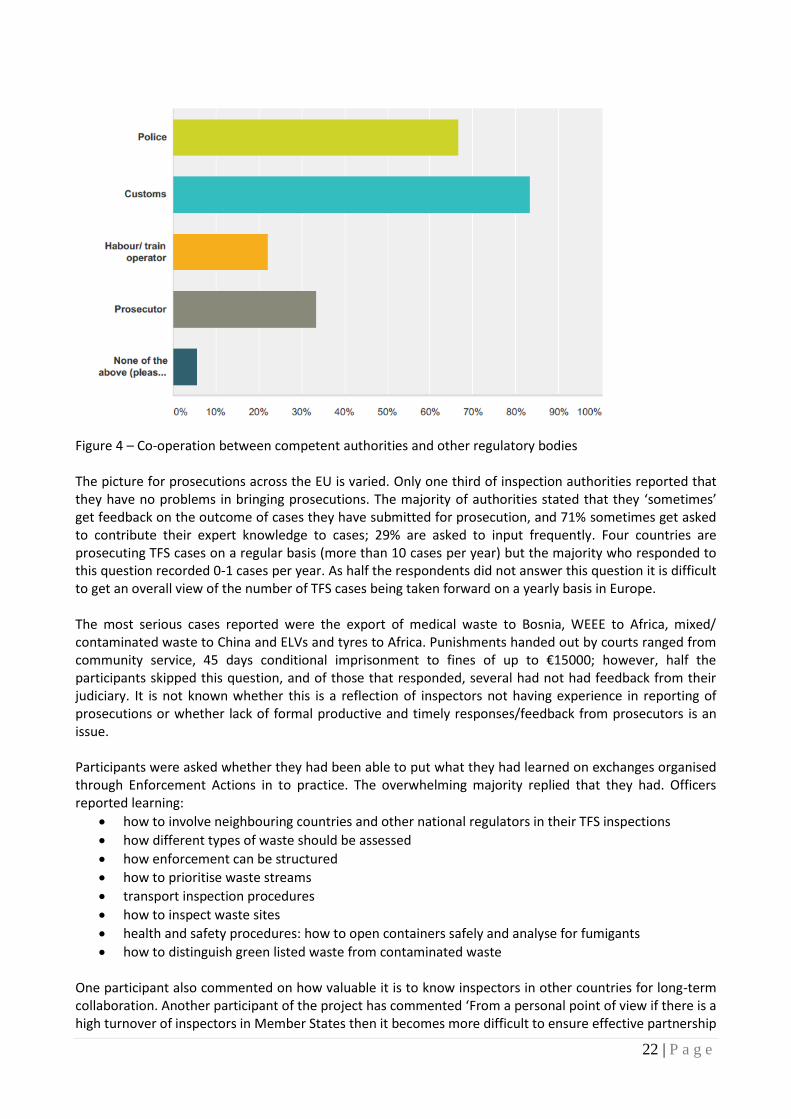
The survey revealed that the majority of inspections undertaken by authorities are done in co-operation with other regulatory bodies, such as the Police and customs (Figure 4). Eighty-three percent of authorities co-operate with Customs and two thirds have regular and effective co-operation with their Police forces. Answers to another question revealed that fifty-two percent of authorities have formal agreements with partners on the regulation of the WSR. The survey also showed that 50% of countries regularly inspect with colleagues from bordering countries. The reasons why the other half do not, or are unable to, will be
investigated further but it is suggested that resources, infrastructure, and non-collaboration with other regulatory bodies may all play a part. The requirement for competent authorities to plan their inspection priorities as discussed in section 4.1.1 may improve this figure.
22 | P a g e
Figure 4 – Co-operation between competent authorities and other regulatory bodies The picture for prosecutions across the EU is varied. Only one third of inspection authorities reported that they have no problems in bringing prosecutions. The majority of authorities stated that they ‘sometimes’ get feedback on the outcome of cases they have submitted for prosecution, and 71% sometimes get asked to contribute their expert knowledge to cases; 29% are asked to input frequently. Four countries are prosecuting TFS cases on a regular basis (more than 10 cases per year) but the majority who responded to this question recorded 0-1 cases per year. As half the respondents did not answer this question it is difficult to get an overall view of the number of TFS cases being taken forward on a yearly basis in Europe. The most serious cases reported were the export of medical waste to Bosnia, WEEE to Africa, mixed/ contaminated waste to China and ELVs and tyres to Africa. Punishments handed out by courts ranged from community service, 45 days conditional imprisonment to fines of up to €15000; however, half the participants skipped this question, and of those that responded, several had not had feedback from their judiciary. It is not known whether this is a reflection of inspectors not having experience in reporting of prosecutions or whether lack of formal productive and timely responses/feedback from prosecutors is an issue. Participants were asked whether they had been able to put what they had learned on exchanges organised through Enforcement Actions in to practice. The overwhelming majority replied that they had. Officers reported learning:
how to involve neighbouring countries and other national regulators in their TFS inspections
how different types of waste should be assessed
how enforcement can be structured
how to prioritise waste streams
transport inspection procedures
how to inspect waste sites
health and safety procedures: how to open containers safely and analyse for fumigants
how to distinguish green listed waste from contaminated waste One participant also commented on how valuable it is to know inspectors in other countries for long-term collaboration. Another participant of the project has commented ‘From a personal point of view if there is a high turnover of inspectors in Member States then it becomes more difficult to ensure effective partnership

23 | P a g e
working. Incentivising inspectors to stay in the job should also be addressed. Retaining experienced inspectors in the long-term should drive up the detection level of illegal waste shipments.’
Figure 5 – Have you put in to practice what you learned on an exchange? Survey respondents were also asked about what guidance would help them in their jobs. Eighty percent of inspectors use the Waste (S)Watch; this is a pocket guide to enforcing the WSR with points of attention for specific problem waste streams. It is therefore proposed that this handy tool be updated during the next project round. Respondents also expressed a desire to have guidance on the changes to the ‘burden of proof’ made by the recent amendment to the Waste Shipment Regulation discussed in section 4.1. Topics that participants would like to see covered in future projects include:
Amendments to the WSR
Problems faced by inspectors when following up inspections
Inspection planning
Cases involving by-products and ‘end of waste’
Classification of WEEE
Cases on exports of mixed waste and a discussion on contamination limits
Verification of recovery facilities in third countries, especially Asia,
Quantified risk assessments
Priority waste streams at the European level
The level at which inspectors consider, know about or follow the country of destination’s regulatory import controls – ELVs to Africa.
4.4 Inspection Selection Methods
An objective of the Enforcement Actions Project is to encourage the use of risk assessment to pre-select and plan where and when inspections happen, with the intention to increase the levels of detection of both waste shipments. It is anticipated that this approach may then have a subsequent increase in the number of violations recorded by participating countries. Information on the selection methods used by authorities during inspections can be captured via the inspection forms. This aspect of inspection reporting has not featured heavily in previous projects, nor is it comprehensively completed by all participating countries, therefore it is difficult to draw conclusions and make comparisons to earlier projects on whether authorities’ inspection methods are changing. In addition, competent authorities did not record the number of inspections that were subject to a specific inspection process. Therefore it is difficult to determine the success of the different selection methods.

24 | P a g e
However, data captured on the inspection forms do suggest that the majority of countries submitting inspection data are implementing an intelligence-led approach, either by collaboration with partner agencies such as police or border control agencies, or by information gathered by the inspecting officers directly. A number of countries carried out ‘random’ inspections; these are generally ‘unannounced’ inspections with limited opportunity to select shipments, e.g. during road checks. Some potential reasons for this may include:
(i) the inspecting country does not have the resources to approach inspections in any other way; (ii) it has been decided that random spot checks at the chosen location is the best way to approach inspections for that particular participating country; (iii) The inspecting country may wish to ascertain the number of waste shipments, and the proportion of these that are illegal waste shipments moving through their respective countries. One of the most straightforward ways of achieving this is to undertake random inspections.
The inspection forms also show that co-operation with other authorities (both within a Member State and with competent authorities in other countries) remains at about the same level as EAIII. This also tallies with the survey responses. Most inspections take place with the assistance of other authorities, especially national police and national customs authorities.
25 | P a g e
5. Inspection Results
5.1 General considerations regarding interpretation of reported data
It is emphasised that IMPEL-TFS Enforcement Actions IV (EA IV) did not aim and was not designed to provide a complete picture of TFS inspections performed by participating countries in that time period. Non-participation in this project does not mean that inspections did not take place. The focus of the project was on transport inspections. Company inspections were introduced for verification purposes and for authorities that have limited opportunities to do transport inspections or where company inspections are a more effective tool for particular waste streams.
5.2 Number of Transport Inspections
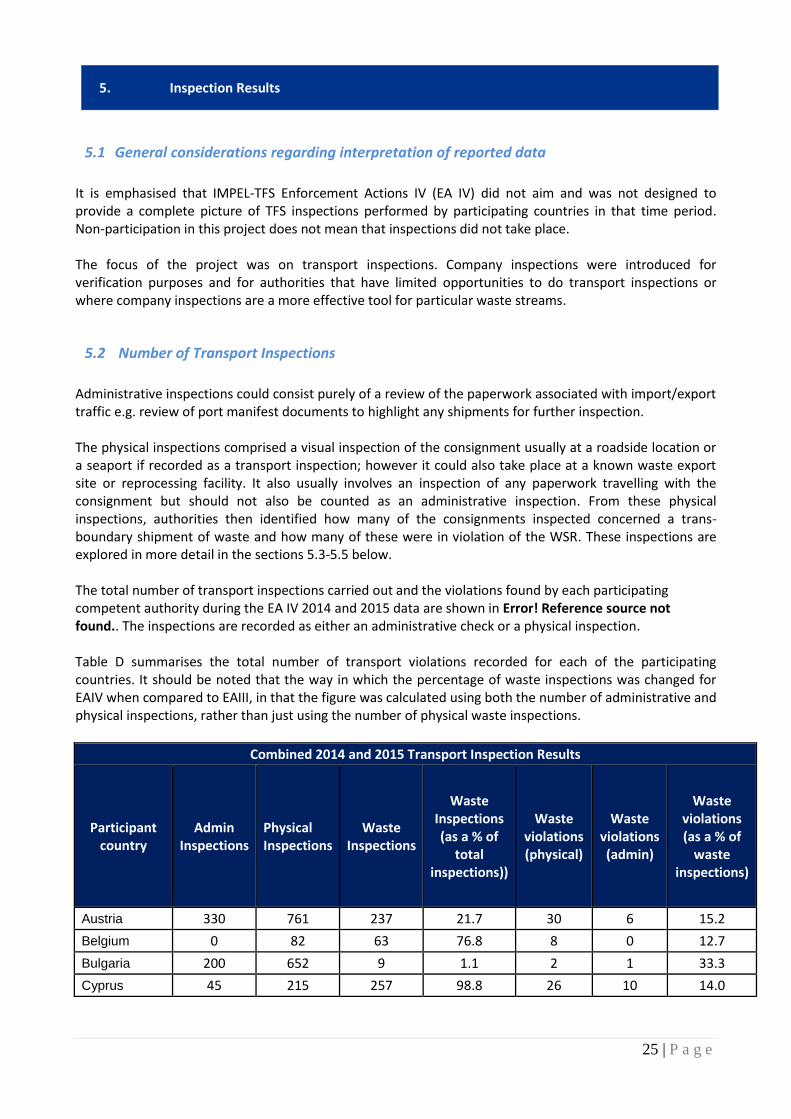
Administrative inspections could consist purely of a review of the paperwork associated with import/export traffic e.g. review of port manifest documents to highlight any shipments for further inspection. The physical inspections comprised a visual inspection of the consignment usually at a roadside location or a seaport if recorded as a transport inspection; however it could also take place at a known waste export site or reprocessing facility. It also usually involves an inspection of any paperwork travelling with the consignment but should not also be counted as an administrative inspection. From these physical inspections, authorities then identified how many of the consignments inspected concerned a trans-boundary shipment of waste and how many of these were in violation of the WSR. These inspections are explored in more detail in the sections 5.3-5.5 below. The total number of transport inspections carried out and the violations found by each participating competent authority during the EA IV 2014 and 2015 data are shown in Error! Reference source not found.. The inspections are recorded as either an administrative check or a physical inspection. Table D summarises the total number of transport violations recorded for each of the participating countries. It should be noted that the way in which the percentage of waste inspections was changed for EAIV when compared to EAIII, in that the figure was calculated using both the number of administrative and physical inspections, rather than just using the number of physical waste inspections.
Combined 2014 and 2015 Transport Inspection Results
Participant country
Admin Inspections
Physical Inspections
Waste Inspections
Waste Inspections (as a % of
total inspections))
Waste violations (physical)
Waste violations (admin)
Waste violations (as a % of
waste inspections)
Austria 330 761 237 21.7 30 6 15.2
Belgium 0 82 63 76.8 8 0 12.7
Bulgaria 200 652 9 1.1 2 1 33.3
Cyprus 45 215 257 98.8 26 10 14.0

26 | P a g e
Denmark 328 174 502 100.0 26 65 18.1
England 0 117 117 100.0 29 0 24.8
Estonia 0 101 9 8.9 4 0 44.4
Finland 20 210 5 2.2 2 2 80.0
France 1895 23 930 48.5 14 15 3.1
Germany 27 1854 621 33.0 176 0 28.3
Hungary 202 73 260 94.5 20 25 17.3
Ireland 105 193 210 70.5 15 5 9.5
Luxembourg 5 5 10 100.0 0 0 0.0
Malta 0 22 22 100.0 4 0 18.2
Netherlands 65 397 231 50.0 25 0 10.8
Northern Ireland
7 412 44 10.5 2 0 4.5
Norway 74 23 97 100.0 11 33 45.4
Poland 746 2595 551 16.5 14 1 2.0
Portugal 51 3685 148 4.0 6 1 4.7
Scotland 0 55 55 100.0 18 0 32.7
Slovenia 653 347 228 22.8 2 1 4.8
Sweden 34 117 66 43.7 35 7 63.6
Switzerland 0 247 247 100.0 173 0 70.0
Wales 0 36 4 11.1 1 0 25.0
Overall total 4787 12396 4923 28.7 643 172 16.6
Figure 6 shows the number of violations detected as a result of the administrative and physical checks carried out by each reporting countries’

27 | P a g e
Figure 6: Total Transport Violations Of the 17,183 transport inspections, 4923 were found to be waste inspections over the EA IV inspection periods. Table D shows that the average ratio of waste inspections compared to the total number of physical and administrative inspections is 28.7%. In previous reports, the ratio was calculated using the total number of physical inspections only. However, this does not take account of all the waste-related inspections Member States conduct, so this report includes both administrative and physical inspections, for completeness. To allow a comparison with EA III, the average ratio of waste inspections compared to the total number of physical inspections was 30.0% in EA III, compared with 39.7% for EA IV. The percentage of transport inspection violations averages 16.6% over the EA IV inspection period. This is the average number of violations found as a proportion of both the physical and administrative waste inspections that were undertaken. This differs from EA III, where the figures were reported as a proportion of just the physical waste inspections undertaken. As these waste inspection figures have been combined in EA IV, it is not possible to make a direct comparison between the figures. In EA III, the percentage of transport inspection violations found as a result of physical inspections was 31.97%. This does not necessarily mean that countries are becoming less able to target illegal shipments or that these shipments are less prevalent. When the results are compared to EA Interim and EAII, the violation rate has not dropped significantly. The reasons behind any decrease in violation rate should be investigated thoroughly before any conclusions are drawn. Reasons may include officers having less time to focus on targeted inspections due to reduced resources. This would accord with the findings from the online survey, which showed that there has been a reduction in intelligence capacity amongst participating countries and that few authorities directed their inspections on specific operators and waste streams. The cohort of inspectors was also newer in their jobs and enforcement capacity within inspectorates had declined since the previous project. However, it is equally likely that structural and reporting changes have affected the results; for example, Belgium previously reported port inspections only for EAIII, but during EAIV reported port and road inspection.

28 | P a g e
5.3 Number of Company Inspections
Table E shows the combined administrative and physical inspections of companies and associated violations identified by each competent authority for EA IV periods 2014 and 2015. These inspections involved a visual inspection of the waste to assess its compliance with the WSR. The inspections were carried out either at waste producers’ sites, waste exporting sites, waste storage sites or waste treatment facilities. Table E summarises the total number of company violations recorded for each of the participating countries. Similar to the transport inspections, the method of recording the data makes direct comparisons between EA III and EA IV impossible. In EA IV the average number of violations was reported as a proportion of both the physical and administrative waste inspections that were undertaken. This differs from EA III, where the figures were reported as a proportion of just the physical waste inspections undertaken.
Combined 2014 and 2015 Company Inspection Results
Participant Admin
Inspections Physical Inspections
Waste Inspections
Waste Inspections (% of total
inspections)
Physical Violations
Admin Violations
Violations (% of waste inspections)
Austria 192 0 192 100 0 0 0
Czech Republic
3 6 6 66.7 6 0 100
Finland 0 18 0 0 0 0 -
Germany 0 5 2 40 0 0 0
Ireland 92 20 100 89.3 2 0 2
Italy 5 1 1 16.7 0 1 100
Malta 20 15 35 100 0 0 0
Northern Ireland
0 3 3 100 0 0 0
Norway 1 0 1 100 0 1 100
Poland 0 1 1 100 1 0 100
Scotland 0 75 73 97.3 38 0 52.1
Slovenia 1 14 15 100 4 0 26.7
Sweden 11 2 13 100 2 10 92.3
Wales 0 1 1 100 1 0 100
Overall total
325.00 161.00 443.00 79.29 54.00 12.00 14.9
Table E: Reported company inspections and violations by country for EA IV periods 2014 and 2015
5.4 Transport Violation Data Analysis
The total number of transport violations recorded during the EA IV inspection periods was 815. The underlying offences can be grouped into three main categories:
Administrative violations, including missing or incomplete Annex VII forms, which account for 289 violations (36.5%);

29 | P a g e
More serious offences such as national regulations, or missing, incomplete and incorrect notifications, which account for 425 violations (52.1%);
Shipments subject to export bans, which account for 84 violations (9.3%); Another 17 violations (2.1%) were for other or unspecified offences. These data are broken down in Table F below, which also shows violation totals from EA III.
Type of Violation Overall EA IV
Total EA III Total
Annex VII missing 63 53
Annex VII incomplete 243 258
Notification missing 151 33
Notification document incomplete/incorrect 96 277
Waste handling/processing not compliant with environmental standards/in accordance with TFS information
5
0
Waste not as stated in documents 48 14
National regulation 118 140
Subject to export ban 74 115
Other 4 1
Not specified 13 20
Total 815 1011
Table F: Types of Transport Violations EAIV and EAIII Figures 7-8 and Tables H-I show the breakdown of transport inspections into the most frequent types of violations, a breakdown of the different waste streams shipped illegally, and the most common destination of illegal shipments.
Figure 7: Types of Transport Violations (Overall) 2014-2015 As is evident from the chart and supporting data above, the most common type of violation is an ‘incomplete annex VII form’ (30%). However there were also a significant number of reported violations

30 | P a g e
relating to missing national regulations and missing or incomplete notification forms (14% and 18% respectively). The 2015 results show some major differences from 2014. Most notably, although the number of violations increased in 2015, there were decreases in violations relating to export bans, and to incomplete annex VII and notification forms.
Waste Description 2014 2015 Overall Frequency
Metals 61 95 156
Paper & cardboard 50 65 115
Plastics 64 42 106
WEEE 52 47 99
ELVs & car parts 38 51 89
RDF & mixed municipal waste 18 26 44
Wood 21 20 41
Tyres 17 17 34
Other non-hazardous 17 10 27
Other hazardous waste 14 12 26
Textiles 11 9 20
No data 0 19 19
Cables 4 3 7
Glass 1 4 5
Construction waste 1 3 4
Green waste 0 4 4
Sludges & filtercake non-hazardous 1 3 4
Ash & slags non-hazardous 0 3 3
Food & edible oil 1 2 3
Batteries 2 0 2
Mixed packaging 0 2 2
Oils 1 1 2
Other household & garden 2 0 2
Bulky waste 1 0 1
Total 377 438 815
Table G: Transport Violations by Waste Stream 2014-2015 * The description of some waste streams were considered difficult to categorise into existing waste descriptions for comparison with previous years. These materials have been categorised as ‘Other hazardous, non-hazardous or household & garden waste’.
The waste streams identified in violations during the EA IV project show no particular material was present in a substantially higher amount than all others. The major waste streams involved in transport violations were metals (19%), paper & cardboard (14%), plastics (13%), WEEE (12%) and ELVs & car parts (11%). This is broadly similar to the top categories for EA III, with the exception of:

31 | P a g e
RDF & mixed municipal waste violations, which dropped considerably from 205 (20.3%) in EA III to 44 (5%) in EA IV;
ELVs & car parts, which have increased from 70 (6.9%) in EA III to 89 (11%) in EA IV. As Table G shows the most notable differences between 2014 and 2015 are that, although the number of violations increased in 2015 compared to 2014, there were decreases in violations relating to plastics (64 in 2014 compared to 42 in 2015). Metals also increased significantly (61 in 2014 compared to 95 in 2015), compared with other materials, mainly due to a large number (32) of violations detected by Hungary in 2015.
Figure 8: Transport Violations by Waste Stream (Overall) 2014-2015 The transport inspection data in Figure 9 shows the majority of violations in EA IV concerned shipments within the EU (77%). This was also the case in EA III, when the corresponding figure was 70%). Twenty-one percent of violations identified were bound for Africa, Asia, and other non-OECD countries. The proportion of violations destined for the EU increased from 70.8% in 2014 to 81.5% in 2015 as shown in Table H, with a corresponding decrease in the proportion of violations for Africa and Asia, which dropped from 28.1% to 15.1% over the same period. A large number of violations with no specified destination were recorded in 2015, accounting for 2% of the overall violations. EA IV has also seen the first recording of North America as a destination, although at two shipments, this makes up less than 0.3% of all violations.

32 | P a g e
Destination regions for illegal shipments
2014 2015 Overall Total
EU 267 357 624
Africa 30 26 56
Asia 69 35 104
No data 0 13 13
North America 2 0 2
Other non-OECD 7 5 12
Unknown 2 2 4
Total 377 438 815
Table H – Transport Violations by Destination 2014-2015
Figure 9: Transport Violations by Destination Country (Overall) 2014-201
Tracking illegal waste exports with GPS systems
A further development in the Enforcement Actions project was to support the Pirkanmaa ELY Center and the County Administrative Board of Norrbotten, Sweden, financially to get a better understanding of the illegal exports. The project focused on mapping illegal waste streams with the help of GPS trackers. Waste lead-acid batteries and WEEE arising at municipal recycling centres were tracked with GPS devices during 2015. The project was successful in tracking illegal waste movements in Sweden during the beginning of 2015 and during the summer and autumn in Finland. Waste stolen from recycling centres was sold on a small scale to metal recycling business so that they re-entered the legal waste stream. Collaboration with Police meant that search warrants could be used to verify the tracking findings and identify other stolen goods and evidence of other illegal activity. The project showed that illegally shipped waste was only ‘illegal’ for a short period of time before it re-entered the legal waste stream. Criminals found a way to use the system during this short time frame to earn money from the small-scale thefts which when multiplied by the number of such incidents is a substantial amount of money.

33 | P a g e
5.5 Company Violations Data Analysis
Tables I-M, and Figures 10-12 show the breakdown of company (waste site) inspections into the most frequent types of violations, a breakdown of the different waste streams shipped illegally, and the most common destination of illegal shipments, in line with that illustrated above for transport inspections. Fourteen countries provided company violation data, with a total of 486 inspections and 66 violations recorded.
Combined 2014 and 2015 Company Inspection Results
Participant Admin Inspections
Physical Inspections
Waste Inspections
Waste Inspections (as a % of total inspections)
Physical Violations
Admin Violations
Violations (as a %) of waste inspections
Austria 192 0 192 100 0 0 0
Czech Republic
3 6 6 66.7 6 0 100
Finland 0 18 0 0 0 0 0
Germany 0 5 2 40 0 0 0
Ireland 92 20 100 89.3 2 0 2
Italy 5 1 1 16.7 0 1 100
Malta 20 15 35 100 0 0 0
Northern Ireland
0 3 3 100 0 0 0
Norway 1 0 1 100 0 1 100
Poland 0 1 1 100 1 0 100
Scotland 0 75 73 97.3 38 0 52.1
Slovenia 1 14 15 100 4 0 26.7
Sweden 11 2 13 100 2 10 92.3
Wales 0 1 1 100 1 0 100
Overall total 325.00 161.00 443.00 91.15 54.00 12.00 14.90
Table I: Reported number of company inspections and violation rate 2014-2015
Type of Violation 2014 2015 EAIV Total
Annex VII missing 4 1 5
Annex VII incomplete 1 1 2
Notification missing 1 23 24
Notification incorrect 0 10 10
National regulation 1 0 1

34 | P a g e
Not specified 3 0 3
Other 0 2 2
Subject to export ban 2 10 12
Facility processes not compliant 3 2 5
Waste not as stated 0 1 1
Waste not permitted for company 1 0 1
Total 16 50 66
Table J: Types of Company Violations 2014-2015
Figure 10: Types of Company Violations 2014-2015 Figure 10 and the supporting data in Table J above show the most common type of company violation recorded is a missing notification (27% of all company violations). Other major violations ‘incorrect notifications’, and ‘subject to export ban’. Company inspections are often carried out at known facilities, by comparison with transport inspections which tend to be roadside or seaport checks, which are more random in nature. This means officers inspecting companies’ facilities are able to target inspections towards those handling or treating priority waste streams. ‘RDF & mixed municipal waste (MMW)’ were the main waste stream with violations, followed by ‘WEEE’, then ‘paper & cardboard’ (as shown in Figure 11).
Waste Description 2014 2015 Overall Total

35 | P a g e
Batteries 1 0 1
Other non-hazardous 1 0 1
Paper & cardboard 4 1 5
Plastics 2 1 3
RDF & MMW 1 43 44
Sludge & filter cake hazardous 1 0 1
Sludge & filter cake non-hazardous 0 1 1
Tyres 2 1 3
WEEE 4 3 7
Total 16 50 66
Table K: Company Violations by Waste Stream
Figure 11: Company Violations by Waste Stream The Austrian competent authority carried out a campaign on shipments of glycerin from Austria in order to determine the level of compliance with the Waste Shipment Regulation. This resulted in a new specification for glycerine by-products. Further detail is provided below:
Austrian Case Study – ‘Glycerin campaign’ In 2012 the BMLFUW - the Austrian competent authority for transboundary waste shipments – started an information campaign to clarify the status of the glycerin phase, raw glycerin and technical glycerin caused by the detection of some – in our view - illegal transboundary shipments of raw glycerin. At that time (2012) we stated following classifications:
36 | P a g e
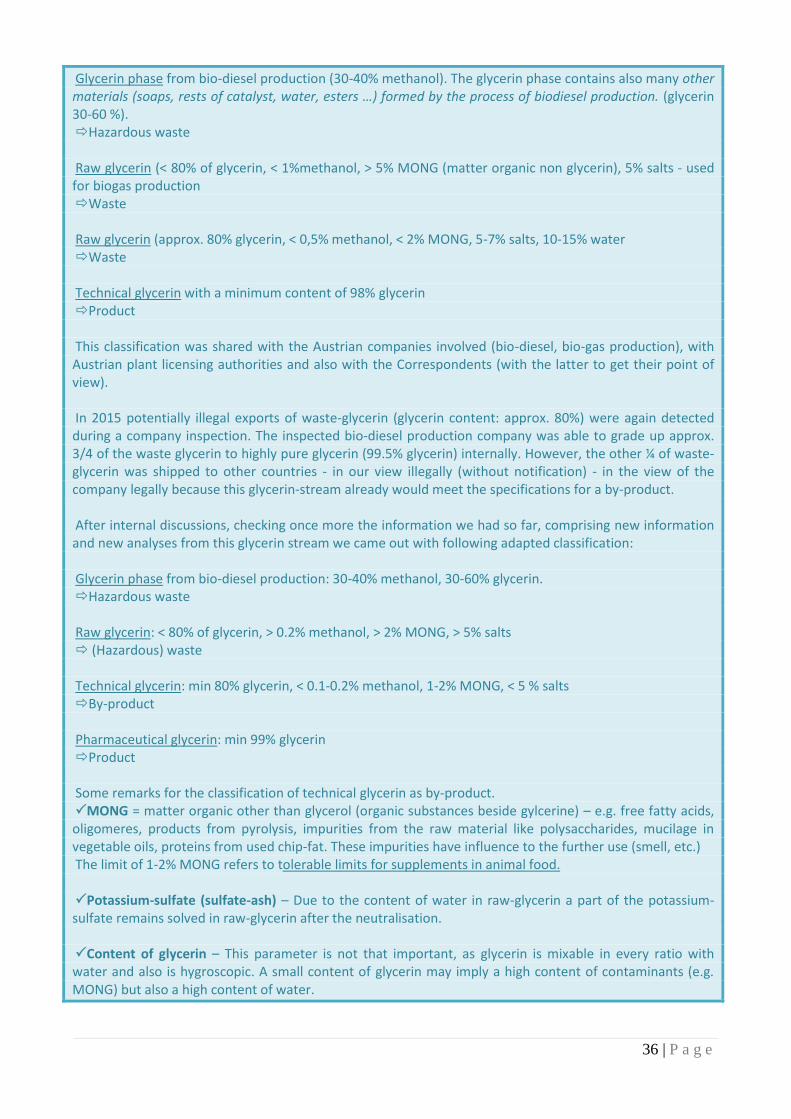
Glycerin phase from bio-diesel production (30-40% methanol). The glycerin phase contains also many other materials (soaps, rests of catalyst, water, esters …) formed by the process of biodiesel production. (glycerin 30-60 %). Hazardous waste Raw glycerin (< 80% of glycerin, < 1%methanol, > 5% MONG (matter organic non glycerin), 5% salts - used for biogas production Waste Raw glycerin (approx. 80% glycerin, < 0,5% methanol, < 2% MONG, 5-7% salts, 10-15% water Waste Technical glycerin with a minimum content of 98% glycerin Product This classification was shared with the Austrian companies involved (bio-diesel, bio-gas production), with Austrian plant licensing authorities and also with the Correspondents (with the latter to get their point of view). In 2015 potentially illegal exports of waste-glycerin (glycerin content: approx. 80%) were again detected during a company inspection. The inspected bio-diesel production company was able to grade up approx. 3/4 of the waste glycerin to highly pure glycerin (99.5% glycerin) internally. However, the other ¼ of waste-glycerin was shipped to other countries - in our view illegally (without notification) - in the view of the company legally because this glycerin-stream already would meet the specifications for a by-product. After internal discussions, checking once more the information we had so far, comprising new information and new analyses from this glycerin stream we came out with following adapted classification: Glycerin phase from bio-diesel production: 30-40% methanol, 30-60% glycerin. Hazardous waste Raw glycerin: < 80% of glycerin, > 0.2% methanol, > 2% MONG, > 5% salts (Hazardous) waste Technical glycerin: min 80% glycerin, < 0.1-0.2% methanol, 1-2% MONG, < 5 % salts By-product Pharmaceutical glycerin: min 99% glycerin Product Some remarks for the classification of technical glycerin as by-product. MONG = matter organic other than glycerol (organic substances beside gylcerine) – e.g. free fatty acids, oligomeres, products from pyrolysis, impurities from the raw material like polysaccharides, mucilage in vegetable oils, proteins from used chip-fat. These impurities have influence to the further use (smell, etc.) The limit of 1-2% MONG refers to tolerable limits for supplements in animal food. Potassium-sulfate (sulfate-ash) – Due to the content of water in raw-glycerin a part of the potassium-sulfate remains solved in raw-glycerin after the neutralisation. Content of glycerin – This parameter is not that important, as glycerin is mixable in every ratio with water and also is hygroscopic. A small content of glycerin may imply a high content of contaminants (e.g. MONG) but also a high content of water.

37 | P a g e
In the end the inspected company was able to prove that its technical glycerin met the specifications for a by-product.
The countries of destination company inspection violations are similar to that of the transport inspections in that most loads were destined for EU countries (65%) as show in Table L and figure 12. The next most common destination was Asia (27%), followed by Africa (6%). A more comprehensive analysis of the non-OECD shipments is provided in section 5.8.
Destination Countries for illegal shipments
2014 2015 Total
EU 8 35 43
Africa 3 1 4
Asia 4 14 18
Unknown 1 0 1
Total 16 50 66
Table L: Company Violations by Destination Country
Company inspections - destination region
Africa
Asia
EU
Unknown
Figure 12: Company Violations by Destination Country (Overall)
5.6 Violation Outcomes
Figure 13 below summarises the outcomes of the violations for the whole EA IV project.

38 | P a g e
0
100
200
300
400
500
600
700
800
Africa Asia EU N. America no data Other non-OECD
Unknown
Violation outcomes by destination
Warning Letter
Warning
Verification request
Repatriation: return to country ofdispatch
Repatriation
Pending
Penalty
Action
Destination Region
Sum of No. loads
Figure 13: Violation outcomes 2014-2015
5.6.1 Outcomes
Figure 13 shows penalties were the most common response to detection of illegal movements with 311 issued (36%), followed by repatriations (17%) closely by prosecutions with 78 cases prepared (9%). These figures are significantly higher than in EA III, during which time 190 penalties were issued and 39 files were prepared for prosecution. Given that during EA III prosecutions and penalties combined only accounted for 20.6% of all action taken, and that the greatest proportion of violations resulted in warnings (41.6%), this represents a substantial change in the actions being taken against illegal shipments. The most frequent outcome for shipments that were stopped because they were subject to the export ban was repatriation (41%), followed by prosecution (20%). Many countries recorded ‘other’ or ‘pending’ as outcomes of the inspections. This may be because the illegal shipments detected were still being dealt with at the time of reporting and the regulatory outcome was not yet known. Or it could be the course of action taken was to address an offence under national/domestic regulation rather than the Waste Shipment Regulation.
5.7 Non-OECD Shipment Violations
5.7.1 Overall Non-OECD Shipment Violations
39 | P a g e
Figure 14 shows the specific destinations of all illegal shipments (from transport and company inspections) and the nature of these violations to non-OECD countries. It can be seen that of all the illegal shipments to non-OECD countries, China is by far the most common non-OECD destination and it can be assumed that the majority of shipments to Hong Kong (the second most common non-OECD destination) are also bound for a final treatment destination in China. It is interesting to note that more than half of the illegal shipments to China and the majority of those to Hong Kong were due to either the waste not being as stated in the paperwork, or not being sent for processing at equivalent standards to the EU. It may be that these shipments consisted of dry recyclables such as paper, cardboard and plastics, which are of substandard quality to that which would be deemed acceptable within the EU, for example containing higher quantities of contamination, including food and offensive (e.g. dirty nappies) waste. By contrast, the largest proportion of illegal shipments to most other non-OECD countries were subject to export bans. Materials that are subject to the export ban generally include WEEE, ELVs and other hazardous wastes. It may be that there is a crossover between the categories of violations, in that some countries may record contaminated recyclate as not being in compliance with the accompanying paperwork, whereas others would record this as subject to the export ban. This is something that can be explored in greater detail during the Enforcement Actions best practice meeting in Bern in April 2016.

6-40 | P a g e
Figure 14: Transport & Company Violations to Non-OECD Destinations (Overall)

41 | P a g e
5.7.2 Non-OECD Shipment Violations by Region
A breakdown by region of the waste types going to non-OECD countries are provided in Figures 15-17. Significant regional differences can be seen and these are explored in more detail in the text below. For Asian destinations, shown in Figure 15, China and Hong Kong accounted for the overwhelming majority of violations, followed by India and Pakistan. Of these, the most common were ‘plastics’, ‘paper & cardboard’ and ‘mixed municipal waste’. Plastics were sent to more than half of the 10 Asian countries listed, followed by ‘metals’ (5 countries) then ‘WEEE’ (4 countries). It should be noted that ‘metals’ may be used to categorise compressors.
Figure 15: Transport & Company Violations to Asia, by Waste Type
In Africa (Figure 16), more than 90% of the violations related to waste were sent to West African countries, with Nigeria being the most popular destination. ‘ELVs & car parts’ were destined for almost all African countries (9 out of 13), accounting for the greatest proportion of waste types, followed closely by WEEE (8 countries), then tyres (5 countries).

42 | P a g e
Figure 26: Transport & Company Violations to Africa, by Waste Type
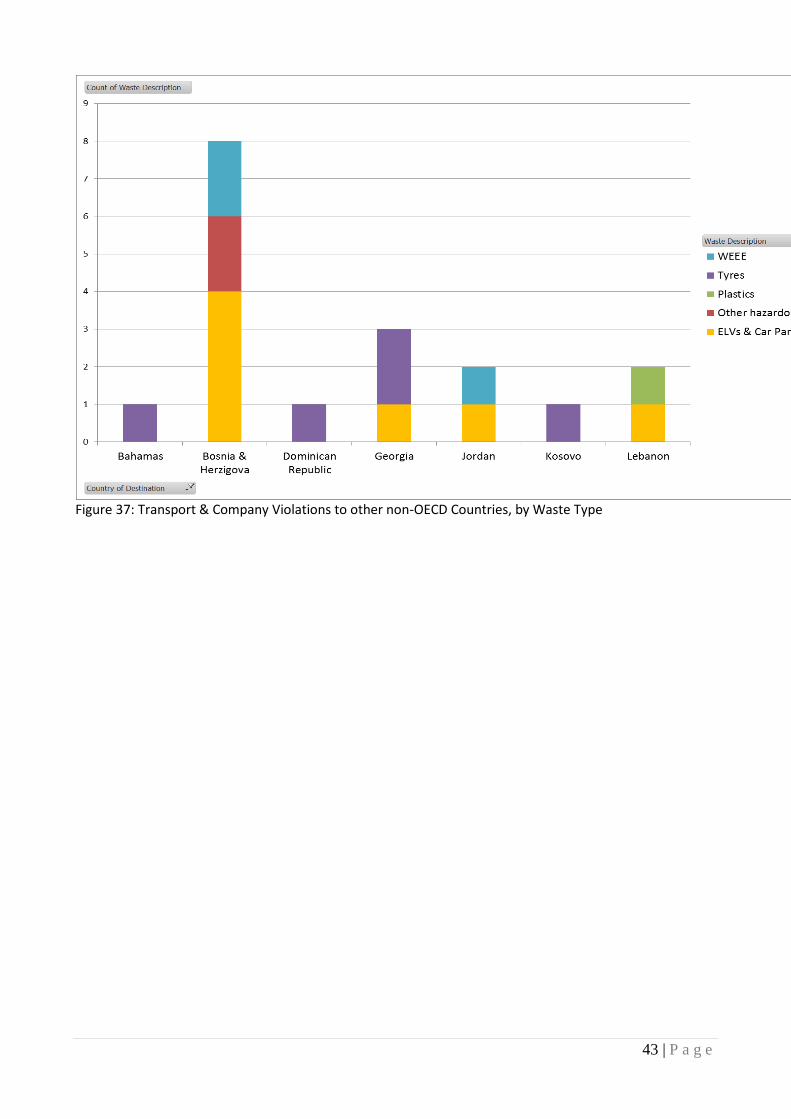
There were fewer violations attributed to other non-OECD destinations, so the results, (Figure 14), are less robust than those for Africa and Asia. The data shows that waste destined for Bosnia & Herzegovina was associated with the greatest number of violations. It also shows ‘ELVs & car parts’ accounted for the greatest proportion of waste to these ‘other non-OECD destinations’, with 7 instances of violations going to 4 of the 8 countries, closely followed by ‘tyres’, with 5 instances of violations also going to 4 countries. Interestingly, significantly fewer violations were identified for Kosovo in EA IV compared with EA III. Furthermore, Caribbean countries (Dominican Republic and the Bahamas) had associated violations identified for the first time; both were for ‘tyres’. It is not known whether these shipments reflect an emerging trend due to the limited data set.
43 | P a g e
Figure 37: Transport & Company Violations to other non-OECD Countries, by Waste Type

44 | P a g e
5.8 Trends in violation data
Previous reports have not looked at trends beyond the previous year's report, due to a lack of available data. As the Enforcement Actions project is now in its fourth phase, there is sufficient data to be able to look at trends as far back as 2010. Figure 18 shows the transport violations by waste type, as a percentage of the total number of transport violations. The Figure shows significant fluctuation between years for most waste types, however, two key issues can also be highlighted:
ELVs & Car Parts, Metals, Paper & Cardboard and WEEE have consistently been major materials of concern, comprising at least 5% of all violations every year since 2010.
Violations for paper & cardboard have been increasing steadily since 2011
Figure 18: Violations by Waste Type as a Percentage of the Total Number of Transport Violations (2010-15)
Another key trend, shown in Figure 19, is the change in destinations for reported violations. Figure 19 shows that the proportion of violations associated with EU destinations seem to have been increasing (40% of all violations in 2011, up to 81% in 2015), whilst the proportion of violations associated with African and Asian destinations has been decreasing (from 17% each in 2010 to 6% and 8% respectively in 2015).

45 | P a g e
Figure 19: Destination regions as a percentage of the total number of transport violations (2010-15)
Given the high proportion of violations destined for China and Hong Kong, further analysis was done on these countries dating back to 2012 (data on individual countries was not available for 2010 or 2011). Whilst there were no trends in the total number of violations over the years, figure 20 shows a dramatic decrease in the number of violations associated with plastic waste in 2015, as well as paper and cardboard. This is coupled with a marked increase in materials categorised as mixed municipal waste in 2015, which could be due to illegal shipments of paper and cardboard or plastics that are so heavily contaminated that they actually resemble mixed municipal waste, so that the waste was reported as a different category.
Figure 20: Violation waste types destined for China and Hong Kong 2012-2015
Although the proportion of violations destined for Africa has been decreasing since 2011, the types of materials being sent there have remained largely the same. As the most commonly cited African

46 | P a g e
destination is Nigeria, the associated violations are shown in more detail in Figure 21. These material types (ELVs & Car Parts, Tyres and WEEE) are generally representative of illegal shipments destined for other West African countries. This is very different from illegal waste being routinely sent to China and Hong Kong over the past four years, the majority of which has been plastics and paper and cardboard, followed by WEEE.
Figure 21: Violations by waste type for shipments destined for Nigeria (2012-15)
Tyres are one waste type which does not appear to have any outstanding preferential destination region, as can be seen in Figure 22 below. In fact, although the number of violations has not changed greatly over the last four years (despite an unusual dip in 2013), the range of destinations has expanded significantly. In 2012, destinations were confined to 8 countries in Africa and the Middle East. This expanded to 11 countries in 2014, including a number of European destinations, and to 14 countries in 2015, including islands in the Caribbean.

47 | P a g e
Figure 22: Destination countries for tyre shipment violations (2012-15)
Figure 23 shows the individual countries illegal shipments have been destined for, as a percentage of overall violations for each year. Most notably, this illustrates that there were a significant number of new destinations which arose during 2014 1nd 2015, but very few countries dropped off the list. New EU destinations during the EA IV time period included: Belgium, Bulgaria, Czech Republic, France, Hungary, Italy, Lithuania, Latvia, Netherlands, Portugal, Serbia, Sweden, Switzerland and Slovakia. Whilst it is possible that more illegal shipments are being sent to these countries, one other likely explanation could be that improved co-operation between Member States has allowed these violations to be more easily detected than in previous years.

48 | P a g e
Figure 23: EU illegal shipment destinations (2012-15)
5.9 Total annual data (2012-2015)
The Enforcement Actions project aims to provide a ‘snapshot’ of competent authorities’ inspections. Often, inspectors arrange their inspections so that they provide a platform for co-operating with other regulatory authorities, be it in a neighbouring country, or within their own country. However, Member States are required to report details of all the violations they uncover in a year to the European Commission. Up-to-date data on these violations have not yet been published by Eurostat, however, they have been submitted to the Enforcement Actions Project Team for the following countries:
The Netherlands (2013 & 2014)
The Republic of Ireland (2013-2015)
Scotland (2013 & 2014)
England (2014 & 2015) Data for 907 violations were submitted to the Project Team by these countries. Of these violations, the vast majority 647 (71%) were stopped as they were contrary to the export ban on the export of hazardous waste to non-OECD countries. The most likely outcome for these shipments was that they were blocked from onwards movement and forced back to the site of loading. Thirty-nine shipments resulted in a warning being issued. Prosecutions and administrative penalties were applied in 11.3% of cases. Figure 24 shows the change in destination countries over the reporting years. 2014 shows a spike in shipments that were destined for Africa which were intercepted by the four authorities because all authorities reported 2014 data whereas this was not the case for 2013 and 2014. These data are considerably different from the ‘snapshot’ data which shows that Europe is the main destination of illegal shipments. There are likely to be several reasons that account for this, including the use of intelligence by these four authorities, not being land locked and therefore having the opportunity to screen shipment data from customs or shipping lines, and the lower number random or ad-hoc inspections as a proportion of the total number of inspections carried out.

49 | P a g e
Figure 24: Destination countries (2013-15) total annual data
The following graph shows the waste types and intended destinations for shipments that were stopped by the four authorities over the 2013-2015 reporting years; it should be noted that the 2015 dataset is not yet complete and not all countries provided 2013 data. China has been the main country of destination, with the most commonly illegally shipped wastes being household waste and recyclates, such as paper, plastic and mixed packaging.
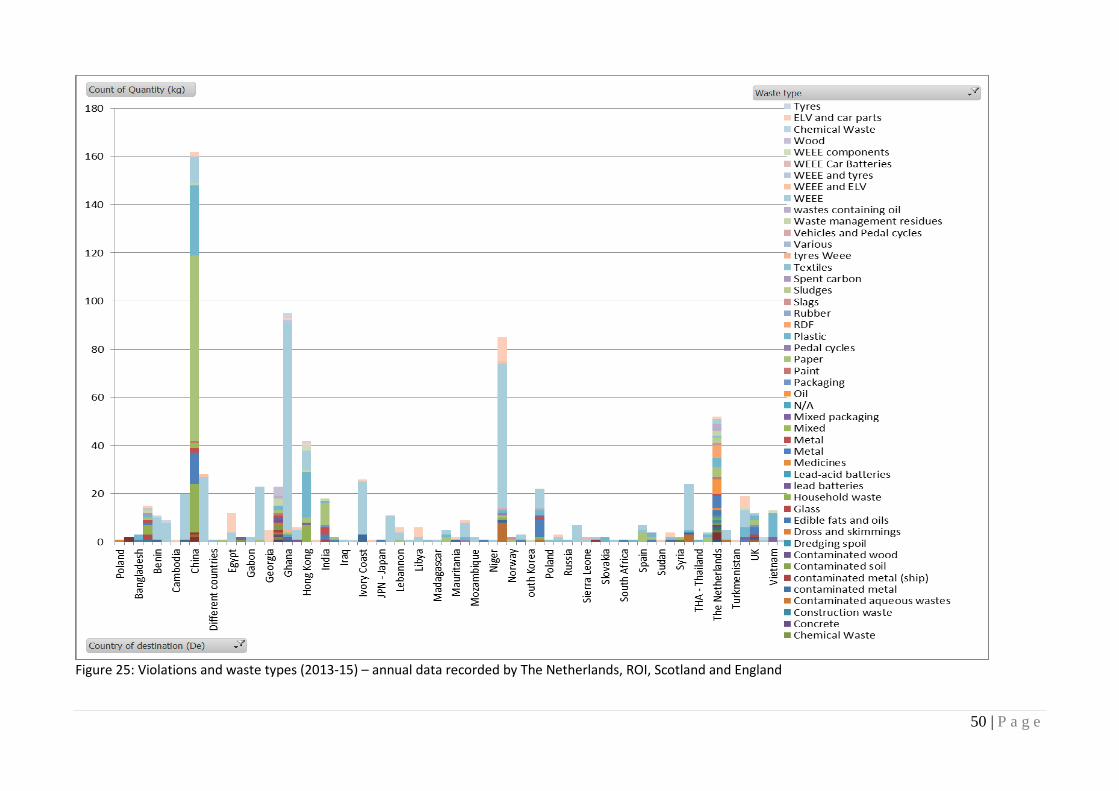
50 | P a g e
Figure 25: Violations and waste types (2013-15) – annual data recorded by The Netherlands, ROI, Scotland and England
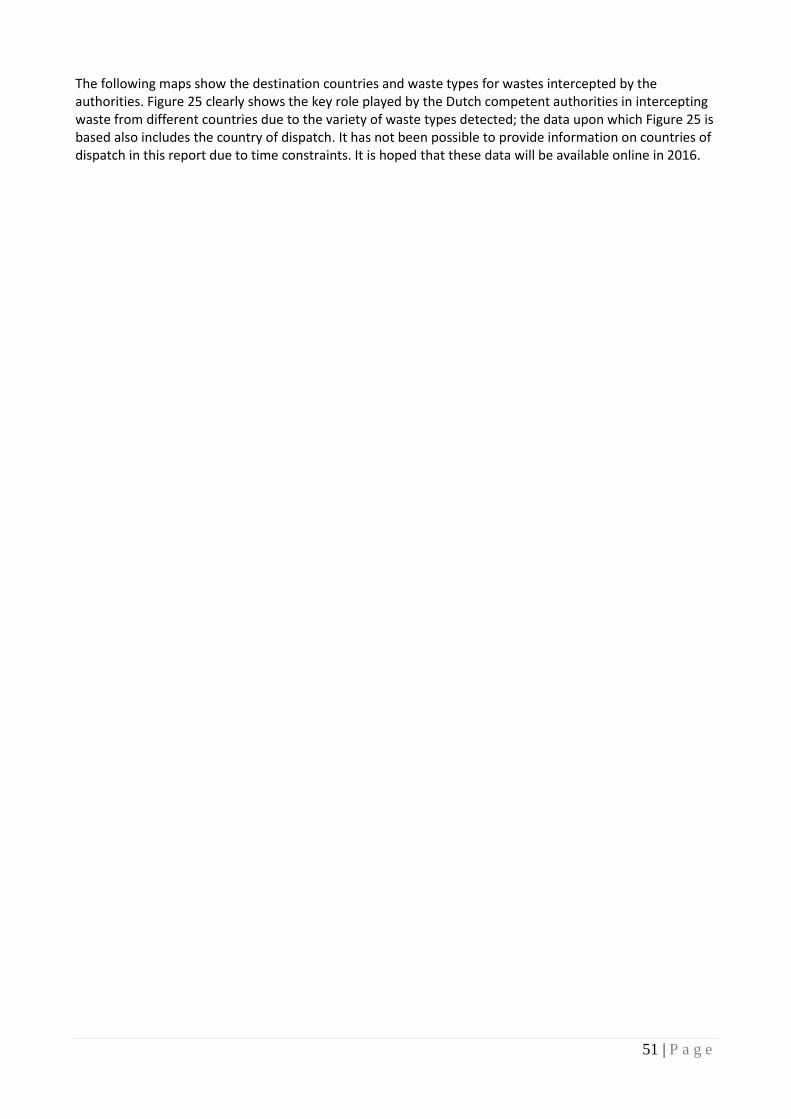
51 | P a g e
The following maps show the destination countries and waste types for wastes intercepted by the authorities. Figure 25 clearly shows the key role played by the Dutch competent authorities in intercepting waste from different countries due to the variety of waste types detected; the data upon which Figure 25 is based also includes the country of dispatch. It has not been possible to provide information on countries of dispatch in this report due to time constraints. It is hoped that these data will be available online in 2016.
52 | P a g e
Figure 25:– Dutch interceptions: Intended destinations whole year data (2013-14)

53 | P a g e
Figure 26: Interceptions by Republic of Ireland (2013-2015)
Figure 27: Interceptions by Scotland (2013-2014)

54 | P a g e
Figure 28: Interceptions by England (2014-2015) The variation in types of waste intercepted by each country and the intended destinations are a function of geography and targeting. It is clear from the Republic of Ireland, Scottish and English data that these authorities are targeting a narrower range of waste streams. It is possible to do this given that Great Britain largely exports waste, and that all material must leave the country via a seaport. All the UK and Irish data shows that the waste originates in that country. This is not true of The Netherlands. The Dutch authorities intercepted waste from many countries, with the highest tonnage coming from Belgium:
Country of dispatch Tonnage intercepted
Belgium 20587.56
Germany 16785.83
The Netherlands 15204.9
UK 5650.28
Norway 2400
Switzerland 1960.96
Poland 135.12

55 | P a g e
Sweden 129.41
Ireland 99.1
France 96.8
Australia 87.64
Austria 69.66
Portugal 54.36
Denmark 42
United States 36.94
Finland 28.44
India 27.52
Israel 25.02
HRV - Croatia 24
RKS - Kosovo 24
DNK - Denmark 21.73
Latvia 20.92
IT - Italy 20
Suriname 19.56
CAN - Canada 7.2
Egypt 1.07
UAE - United Arab Emirates 0.35
Malaysia 0.35
Table M: Tonnage of waste intercepted by Dutch authorities 2013-2014, by country of origin
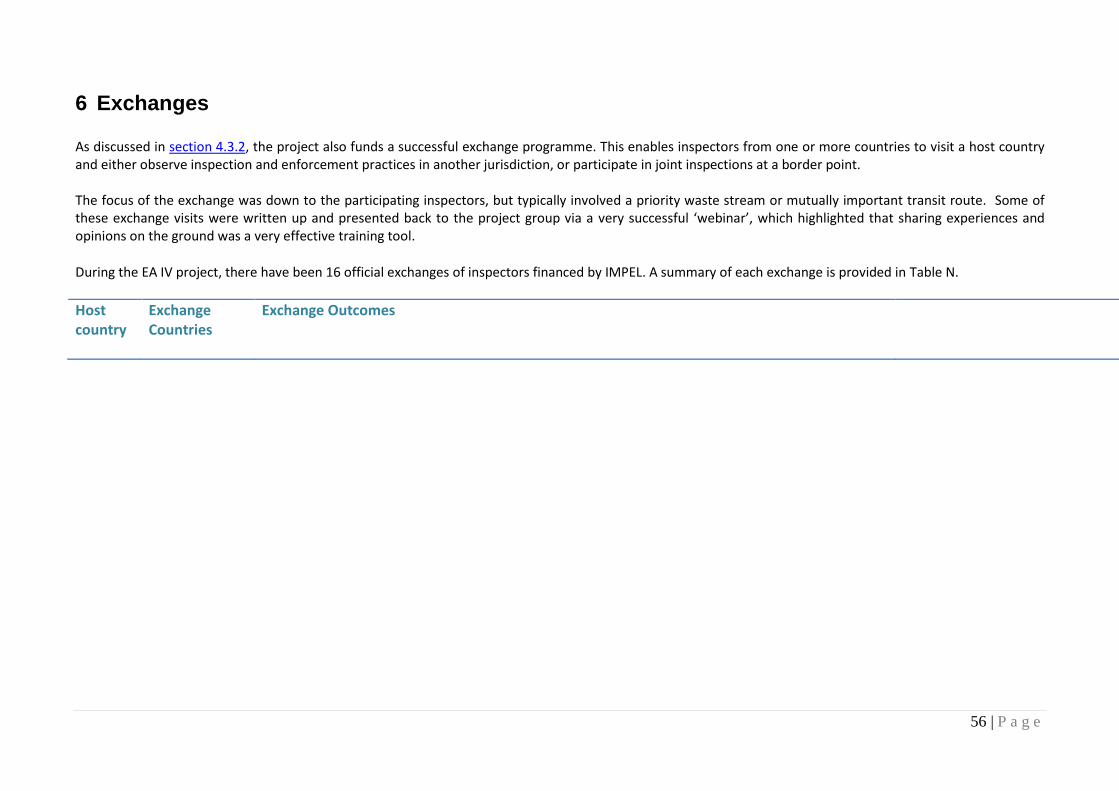
56 | P a g e
6 Exchanges As discussed in section 4.3.2, the project also funds a successful exchange programme. This enables inspectors from one or more countries to visit a host country and either observe inspection and enforcement practices in another jurisdiction, or participate in joint inspections at a border point. The focus of the exchange was down to the participating inspectors, but typically involved a priority waste stream or mutually important transit route. Some of these exchange visits were written up and presented back to the project group via a very successful ‘webinar’, which highlighted that sharing experiences and opinions on the ground was a very effective training tool.
During the EA IV project, there have been 16 official exchanges of inspectors financed by IMPEL. A summary of each exchange is provided in Table N.
Host country
Exchange Countries
Exchange Outcomes
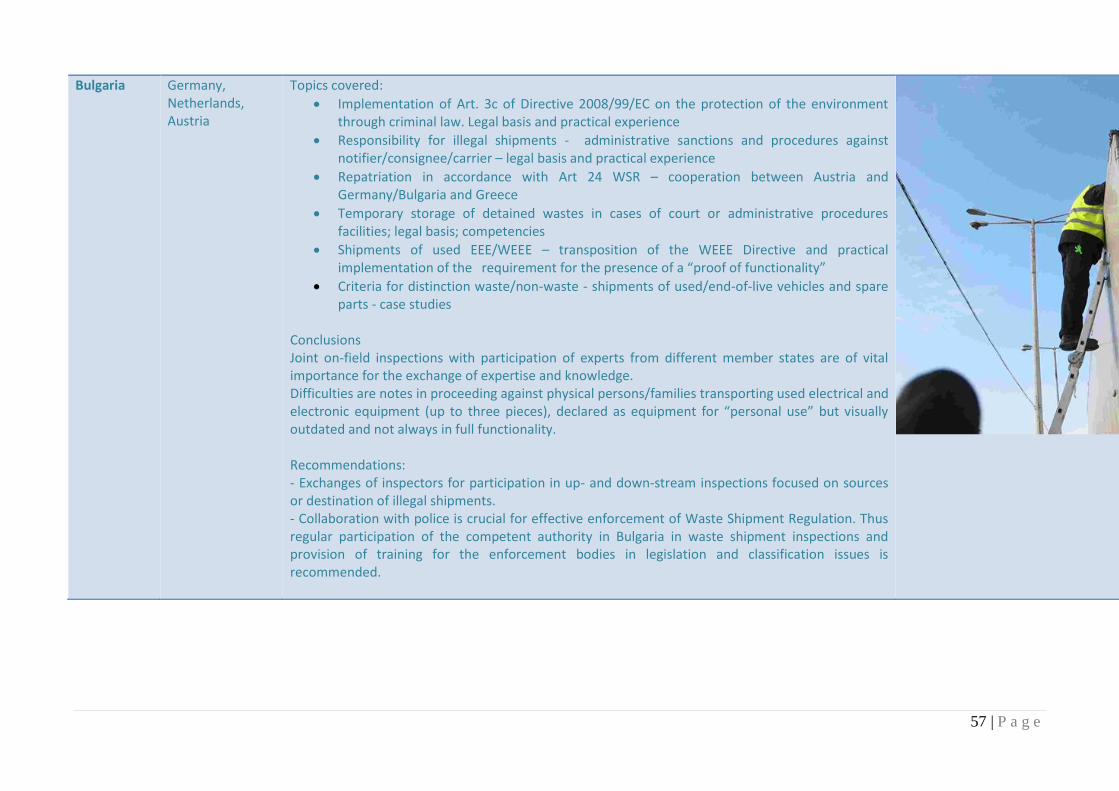
57 | P a g e
Bulgaria Germany, Netherlands, Austria
Topics covered:
Implementation of Art. 3c of Directive 2008/99/EC on the protection of the environment through criminal law. Legal basis and practical experience
Responsibility for illegal shipments - administrative sanctions and procedures against notifier/consignee/carrier – legal basis and practical experience
Repatriation in accordance with Art 24 WSR – cooperation between Austria and Germany/Bulgaria and Greece
Temporary storage of detained wastes in cases of court or administrative procedures facilities; legal basis; competencies
Shipments of used EEE/WEEE – transposition of the WEEE Directive and practical implementation of the requirement for the presence of a “proof of functionality”
Criteria for distinction waste/non-waste - shipments of used/end-of-live vehicles and spare parts - case studies
Conclusions Joint on-field inspections with participation of experts from different member states are of vital importance for the exchange of expertise and knowledge. Difficulties are notes in proceeding against physical persons/families transporting used electrical and electronic equipment (up to three pieces), declared as equipment for “personal use” but visually outdated and not always in full functionality. Recommendations: - Exchanges of inspectors for participation in up- and down-stream inspections focused on sources or destination of illegal shipments. - Collaboration with police is crucial for effective enforcement of Waste Shipment Regulation. Thus regular participation of the competent authority in Bulgaria in waste shipment inspections and provision of training for the enforcement bodies in legislation and classification issues is recommended.

58 | P a g e
Austria Slovenia The main aim of the exchange action was sharing information, experiences and good practices. This was done primarily through joint inspections at the Austrian – Slovenian border Conclusions
Joint on-site inspections with participation of experts from different member states are of vital importance for the exchange of expertise and knowledge.
To understand the broader scope of waste management in different countries inspections and on-site discussions are crucial.
Collaboration between Austria in Slovenia will continue with joint inspections and exchange of information
We highly welcome the efforts made by the IMPEL TFS enforcement action team to make these exchanges possible
Sweden Finland, Cyprus Joint inspections between:
The Norwegian Environmental Agency The Swedish Environmental Protection Agency The Cypriot Ministry of Agriculture, Rural Development and Environment The Finnish Centre for Economic Development, Transport and the Environment The County Govenor of Nordland The Municipality of Kiruna The County Administrative Board of Norrbotten. Outcome: In total 25 transports were checked by environmental authorities, of these 21 were transboundary shipments of waste. 21 (100%) of these transports were in violation of transboudary waste shipment regulation, ranging from minor administrative infringements to serious violations. Two transports were denied entry into the EU before better documentation could be shown to the authorities.
Romania Switzerland

59 | P a g e
Scotland Ireland Conclusions: 1. Since 2013 SEPA’s waste shipment unit carried out inspections at Material Recovery Facilities to understand quality of waste plastics and waste fibre destined for green-list export. 2. ELV training is provided to SEPA inspectors regulating ELV sites to understand depollution process and therefore an aid to interpreting whether a vehicle that may be destined for export is waste or not. 3. SEPA’s waste shipment officers trained in PAT testing and carry out PAT testing of electrical and electronic items against exporter’s testing to differentiate whether an item is EEE or WEEE. 4. SEPA adopts targeted inspections at port through the use of intelligence aided by fieldwork and experience of site operators processes. 5. SEPA controls waste facilities unlike NTFSO Dublin as sites in Republic of Ireland regulated by the Irish EPA.
Ireland Scotland The aim of the exchange was to understand recyclate collection, sorting and quality practices in the
Republic of Ireland. The purpose of the exchange was to gain knowledge on the recyclate industry in the Republic of Ireland, recyclate flows between the Republic of Ireland and Scotland and any waste brokers/dealers/exporters operating in both jurisdictions. SEPA officers also gained insight into the processes and treatment standards for RDF destined for export at one site. The exchange identified that the collection of household mixed recyclate in the Republic of Ireland is predominantly carried out by private waste management companies which differs in some respects to Scotland. The exchange benefited participants through knowledge sharing and discussions centring on Annex VII paperwork, recyclate quality (discussions centred on co-mingled and separately collected waste streams, sorting and storage practices on site, target/non-target material, recyclate value), waste brokers and inspection practices.

60 | P a g e
Netherlands, Belgium & Germany
Sweden, Spain, Portugal
Joint inspections undertaken in Rotterdam, Antwerp and the German road border with The Netherlands. Procedures discussed included: • Joint working with Customs and the Police • Scanning technology • ELV terminal inspections in Antwerp
Germany Sweden Items covered:
Profiling and selection of vehicles, • Procedures for inspection of a vehicle incl. safety protocols and equipment to protect officers from accidents and contamination from fumigants and radioactivity • Trends and Modi Operandi • Cooperation with other agencies and co-ordinating activities, • How to work within Swedish police and Bremen police on intelligence, inspections, crimes etc. • Conduct inspections on the road/harbour and to visit an upstream waste site Conclusions • To improve the working environment for the Swedish Police Officers it is stressed that the gas and radioactive measuring tools are installed as standard equipment • It was noted that Swedish cars seems to be the only cars that are still carrying the registration plate when they are exported outside the EU. Cars from other member states seem to be un-registered before the export • It is also needed improved training in Sweden for the Police Officers and to improve the selection method the “A” sign would be welcomed • Furthermore, it is important to continue to cooperate and conduct exchanges between different countries in the European Union in the field of transboundary waste transports
Germany Austria, Romania, Bulgaria
Conclusions: 1. The exchange of information and the establishment of a direct contact with other competent authorities are expected to significantly improve the communication and co-operation in cases of
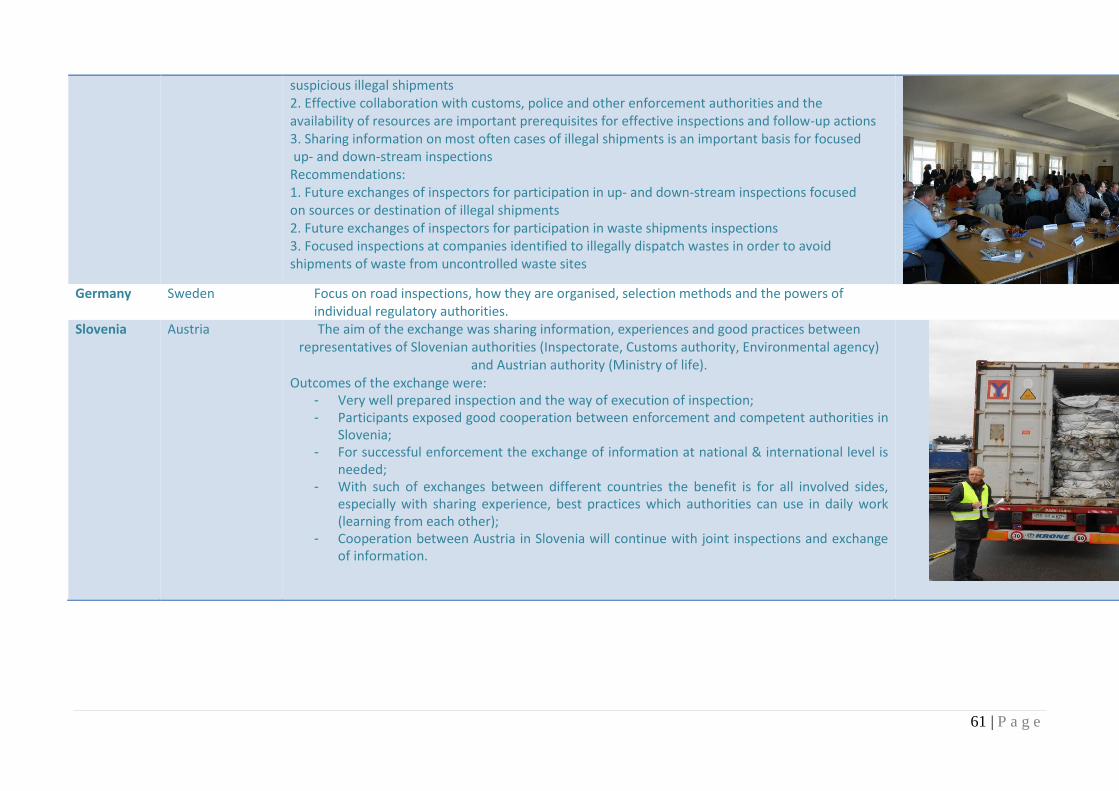
61 | P a g e
suspicious illegal shipments 2. Effective collaboration with customs, police and other enforcement authorities and the availability of resources are important prerequisites for effective inspections and follow-up actions 3. Sharing information on most often cases of illegal shipments is an important basis for focused up- and down-stream inspections Recommendations: 1. Future exchanges of inspectors for participation in up- and down-stream inspections focused on sources or destination of illegal shipments 2. Future exchanges of inspectors for participation in waste shipments inspections 3. Focused inspections at companies identified to illegally dispatch wastes in order to avoid shipments of waste from uncontrolled waste sites
Germany Sweden Focus on road inspections, how they are organised, selection methods and the powers of
individual regulatory authorities.
Slovenia Austria The aim of the exchange was sharing information, experiences and good practices between representatives of Slovenian authorities (Inspectorate, Customs authority, Environmental agency)
and Austrian authority (Ministry of life). Outcomes of the exchange were:
- Very well prepared inspection and the way of execution of inspection; - Participants exposed good cooperation between enforcement and competent authorities in
Slovenia; - For successful enforcement the exchange of information at national & international level is
needed; - With such of exchanges between different countries the benefit is for all involved sides,
especially with sharing experience, best practices which authorities can use in daily work (learning from each other);
- Cooperation between Austria in Slovenia will continue with joint inspections and exchange of information.

62 | P a g e
The Netherlands
England, Norway Exchange of information on organisational structure and how inspections are carried out. Joint inspections undertaken in Rotterdam, Antwerp and the German road border with The Netherlands. Procedures discussed included: • Joint working with Customs and the Police • Use of intelligence • Scanning technology
Scotland Norway Items discussed included:
Different organisational set-ups and ways of working, including powers
SEPA’s work on regulating green-list movements of waste plastics and waste paper/cardboard and associated challenges
RDF exports
Movements of offshore wastes
SEPA’s waste crime team Joint inspections at sites of loading for e-waste and at ports also undertaken.

63 | P a g e
Slovenia The Netherlands and Estonia
Exchange of information on organisational structure and how inspections are carried out. Joint inspections undertaken in highway near Ljubljana, border crossing Obrežje (SI/HR) together with colleagues from Croatia, port of Koper and railway inspection in Ljubljana. Antwerp and the German road border with The Netherlands. Conclusions: • The cooperation in Slovenia between national and international involved organisations is very good and there is an open communication; • Customs and Police are very well aware about the topic • Joint inspections are still needed for awareness raising for environmental and other organisations; • Challenge will be to keep the level of knowledge at the same level or even to improve it; • The cooperation with some neighbouring countries will stay challenging, with others the cooperation is very good; • The cooperation with third countries (destination) has to be improved, Slovenia is being used as a transit country for waste coming from other countries and which is destined for third countries. Slovenian port will be last port of EU and in case of repatriation or other detected illegal shipments Slovenia will be most likely held responsible and the waste will be repatriated to Slovenia; • The possibility to see the work methods of Inspectorate of Republic of Slovenia for agriculture and the environment, Slovenian Environment Agency, Slovenian customs and the Slovenian police. It was a great opportunity to exchange experiences with Slovenian and Dutch colleagues. • Received a very thorough overview of the illegal shipments of waste problem in Slovenia and the difference with Estonia; • Easier to exchange information between customs of Port of Koper and Port of Muuga; • Getting a lot of knowledge about the Slovenian customs and their work methods.
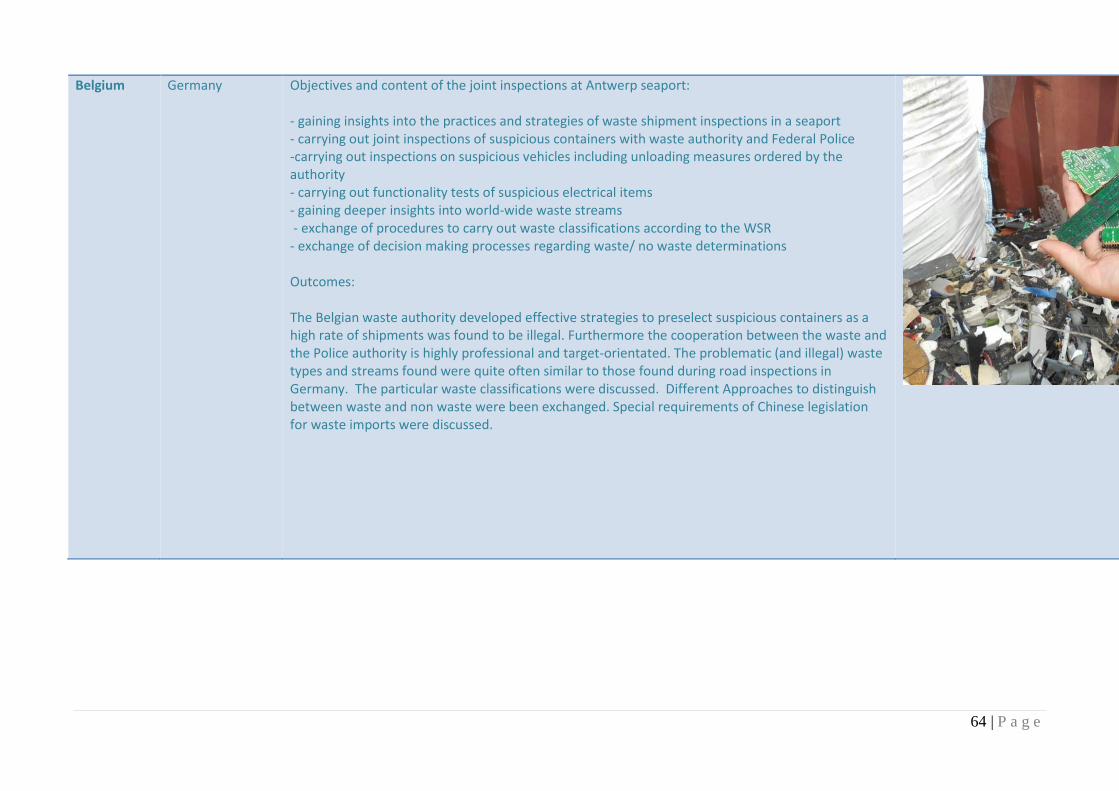
64 | P a g e
Belgium Germany Objectives and content of the joint inspections at Antwerp seaport: - gaining insights into the practices and strategies of waste shipment inspections in a seaport - carrying out joint inspections of suspicious containers with waste authority and Federal Police -carrying out inspections on suspicious vehicles including unloading measures ordered by the authority - carrying out functionality tests of suspicious electrical items - gaining deeper insights into world-wide waste streams - exchange of procedures to carry out waste classifications according to the WSR - exchange of decision making processes regarding waste/ no waste determinations Outcomes: The Belgian waste authority developed effective strategies to preselect suspicious containers as a high rate of shipments was found to be illegal. Furthermore the cooperation between the waste and the Police authority is highly professional and target-orientated. The problematic (and illegal) waste types and streams found were quite often similar to those found during road inspections in Germany. The particular waste classifications were discussed. Different Approaches to distinguish between waste and non waste were been exchanged. Special requirements of Chinese legislation for waste imports were discussed.

65 | P a g e
Italy Sweden Both joint and separate sessions for investigative and intelligence services was held during the exchange in order to maximise the exchange. Demonstrations and field trips was also organised to receive more information on methodology and equipment. Conclusions: The exchange clearly shows that a closer collaboration between authorities and agencies in Europe are necessary to combat environmental crimes. The opponents that the agencies and authorities are against will remain highly dynamic and quick to exploit changes in the legislation and the knowledge of combating environmental crimes in the member states of the EU. It is challenging for the law enforcement authorities across EU to keep pace with criminals. Therefore training and awareness raising measures for the public and for Police Officers are important. Exchanges between Police Authorities in the EU are an important tool for that via e.g. IMPEL.

66 | P a g e
7 Conclusions and Recommendations
The development in 2014 and 2015 confirmed that the Enforcement Actions IV (EA IV) project has been very successful. It further contributed to the overall objective of improved enforcement of the EU Waste Shipment Regulation, both in number and quality of inspections performed, as well as in level of knowledge and expertise shared between participating countries.
7.1 Conclusions
From a review of the inspection information provided by the participant countries during EA IV inspection periods, 11 key conclusions have been reached:
1. The number of participating countries rose from 29 during EAIII to 31, with 26 countries now submitting results, compared to 24 in EAIII.
2. Enforcement Actions IV reported a total of 17,183 physical and administrative transport inspections, of which 4,923 (28.28%) were related to transfrontier shipment of waste. The total number of inspections is lower than EA III which reported 22,414 inspections, but the number of waste inspections was considerably high (4,923 when compared to 3,162 (14.1%) in EAIII). Transport inspections are most frequently carried out at the roadside, accounting for the high number of intra-EU movements reported in the project. This was also the case in EAIII. In EA III, the percentage of transport inspection violations found as a result of physical inspections was 31.97%; this has reduced to 16.6% in EA IV. This does not necessarily mean that countries are becoming less able to target illegal shipments or that these shipments are less prevalent. When the results are compared to the EAII project, the violation rate has not dropped significantly: EAII showed a violation rate of 21%2. The reasons behind any decrease in violation rate should be investigated thoroughly before any conclusions are drawn. Reasons may include officers having less time to focus on targeted inspections due to reduced resources. This would accord with the findings from the online survey, which showed that there has been a reduction in intelligence capacity amongst participating countries and that few authorities directed their inspections on specific operators and waste streams. The cohort of inspectors was also newer in their jobs and enforcement capacity within inspectorates had declined since the previous project. However, it is equally likely that structural and reporting changes have affected the results; for example, Belgium previously reported port inspections only for EAIII, but during EAIV reported port and road inspection.
3. The total number of company inspections related to transfrontier shipment of waste in EA IV was
486 whereas 354 were carried out in EA III. Overall, 14 countries reported company inspections in EA IV, compared with 11 during EA III. The company violation rate during EAIV was 14.9%.
4. Major waste streams involved in transport violations were: Metals (19%), Paper & Cardboard (14%), Plastics (13%), WEEE (12%) and ELVs & Car Parts (11%). This is broadly similar to EA III. RDF was by far the biggest problem material for company inspections.
5. China and Hong Kong were still the most common Asian destinations, with plastics, paper and card still being the major materials involved in violations. West Africa (particularly Nigeria) was still the most common destination for African violations, with WEEE, ELVs & car parts accounting for the majority of violations. African destinations have decreased over the last 5 years, more significantly
2 Anke Joas; Alexander Greßmann; ‘IMPEL-TFS Enforcement Actions II, Enforcement of EU Waste Shipment
Regulation “Learning by doing”’. Final Project Report (October 2008 – February 2011).

67 | P a g e
than Asian destinations. The EU was been the most common destination region for illegal shipments again.
6. The total annual violation statistics for the Republic of Ireland, The Netherlands, Scotland and England show 907 violations, of these violations, the vast majority 647 (71%) were stopped as they were contrary to the export ban on the export of hazardous waste to non-OECD countries. The most likely outcome for these shipments was that they were blocked from onwards movement and forced back to the site of loading. Thirty-nine shipments resulted in a warning being issued. Prosecutions and administrative penalties were applied in 11.3% of cases. These data are considerably different from the ‘snapshot’ data which shows that Europe is the main destination of illegal shipments. There are likely to be several reasons that account for this, including the use of intelligence by these four authorities, not being land locked and therefore having the opportunity to screen shipments with shipping line and customs data, and the lower number random or ad-hoc inspections as a proportion of the total number of inspections carried out.
7. Exchange of inspectors remained an invaluable project tool for training officers and sharing best practice. This was confirmed during webinar discussions and online presentations surrounding various exchanges.
8. The staging of regular webinars began during EA IV, whereby a different host country leads an
online presentation to the group on a chosen topic, has proved popular amongst participants. The full list of online presentations is detailed in Section 5.7.
9. The level of co-operation with other authorities (e.g. police and customs) remained high when
compared to EAIII. Availability of resources is generally a consideration for inspecting agencies, and external agency assistance helps improve efficiency. Collaboration was an aspect that was regularly promoted, as it is always possible to improve links, so all countries were encouraged to foster links with other regulatory bodies.
10. The project had clearly having a positive impact on the daily inspection and enforcement work of
participating countries. This is evidenced by survey responses which indicated that participants want the project to continue, and suggested the project had been very helpful to them. It provided guidance for identifying illegal transports, better understanding of legal requirements, sharing of best practice, increasing co-operation, joint control at border crossings and streamlined repatriations.
11. Although considerable improvements in participation had been made, bilateral and multilateral
collaboration remains a problem in certain regions. The effect is that the Waste Shipment Regulation is not completely implemented and an uneven playing field of waste shipment controls still exists. Illegal trafficking within Europe and port hopping remain on-going challenges and risks. Recent evidence of ‘road-hopping’ by waste carriers means that authorities have to remain vigilant.
7.2 Recommendations
Based on the EA IV project results, 10 key recommendations for future joint enforcement actions and follow-up projects can be given for future project work:
1. Continue to improve on cooperation with customs, police and other regulatory authorities, for example via formal agreements, in order to build on the benefits already achieved.

68 | P a g e
2. Expand on the number of countries participating in the project and encourage more existing members to provide inspection data for the next project phase. Support by the European Commission may improve participation and involvement of countries not yet sharing inspection practice and results.
3. Increase effectiveness of collaboration on a global level (e.g. the Asia collaboration project) to
improve understanding of the impacts of the transport of waste to non-OECD countries and ensure that verification of waste shipments is carried out.
4. Clarity of data reporting should be a target area for future inspection periods. The reporting of
administrative and physical inspections should be closely monitored to ensure reliability and consistency of data for future projects. It is important that authorities record the waste classification they consider appropriate rather than that declared by the exporters; this may provide a clearer view of the problem waste streams. It is also suggested that officers indicate how many of their inspections were intelligence-led/ risk-based/ random so that conclusions can be drawn on the relative success of these approaches to inspection selection.
5. Continue use of exchange platforms via electronic communications and physical meetings. In particular the use of webinars and exchanges between countries has proved to be beneficial for all participants, and new exchanges should be arranged during the next project to allow other countries to benefit first hand.
6. Given that the results of the EA IV inspection periods indicate that most of the illegal shipments are
from EU to EU countries, further work in targeting specific waste streams or operators may be beneficial.
7. For future transport inspections, dry recyclables (such as wood, paper, card, metals and plastics)
would be a key area to focus on.
8. Carry out an additional member survey at the next project phase, as the responses received during EA IV have been useful in improving the way in which the project is executed.
9. Encourage participating authorities to provide data on their annual waste shipment inspections to provide further detail on waste shipment violations.
10. Develop the online tool used to map violations for the ‘total annual’ dataset so that problem waste flows can be identified and joint working on them can be fostered. This may also be of use as competent authorities in their inspection planning.

69 | P a g e
8. Literature and References
Final Report for Enforcement Actions II Project
Anke Joas; Alexander Greßmann; ‘IMPEL-TFS Enforcement Actions II, Enforcement of EU Waste Shipment Regulation “Learning by doing”’. Final Project Report (October 2008 – February 2011).
Reports for Enforcement Actions III Project
Katie Willis; Adam Liddle; ‘IMPEL-TFS Enforcement Actions III, Enforcement of the European Union Waste Shipment Regulation’, Interim Project Report September-October 2011’
Katie Olley; Adam Liddle; Mark Keegan; Jane Bond; Nicky Leggatt; ‘IMPEL – TFS Enforcement Actions III, Enforcement of the European Waste Shipment Regulation’, Project Report for Year 1 (March – October 2012).
Katie Olley; Naomi Ross; Adam Liddle; Mark Keegan; Nicky Leggatt; ‘IMPEL – TFS Enforcement Actions III, Enforcement of the European Waste Shipment Regulation’, Project Report for Year 2 (January – September 2013).
Katie Olley, Naomi Ross, Jamie Morris, Adam Liddle, Mark Keegan, Nicky Leggatt, ‘IMPEL – TFS Enforcement Actions III Project Report Final Report: Enforcement of the European Waste Shipment Regulation (March 2012 – December 2013)
Websites and reports
Basel Convention: http://www.basel.int/
IMPEL: http://www.impel.eu/
http://www.impel.eu/projects/enforcement-actions/
UNEP: http://www.unep.org/delc/Portals/119/publications/rra-wastecrime.pdf
European Commission: http://ec.europa.eu/environment/waste/shipments/index.htm
Austria: http://www.bundesabfallwirtschaftsplan.at/
Denmark:
http://mst.dk/service/publikationer/publikationsarkiv/2015/feb/regulations-on-the-export-of-
used-electronic/
http://eng.mst.dk/media/mst/70098/guideline%20Greenlistet%20waste_120316.pdf
France:
http://www.developpement-durable.gouv.fr/IMG/pdf/note_TTD_taille_OK_BPGD-13-144-1.pdf
Germany / Federal Environment Agency:
http://www.umweltbundesamt.de/en/topics/waste-resources/transfrontier-shipment-of-wastes
Germany / Bavaria:
http://www.abfallratgeber.bayern.de/gewerbe_unternehmen/abfallimport_export/index.htm

70 | P a g e
Germany / Hessen:
http://www.hlnug.de/themen/abfall/hessian-database-for-waste-transports.html
Ireland / City of Dublin:
http://www.dublincity.ie/sites/default/files/content/WaterWasteEnvironment/Waste/National_TF
S_Office/Documents/GuideforShipmentsofUsedVehiclesVehiclePartsandElectricalEquipment.pdf
Malta: https://www.mepa.org.mt/waste-tfs
The Netherlands: https://www.ilent.nl/english2/international_shipment_of_waste/
UK / England: https://www.gov.uk/guidance/importing-and-exporting-waste
UK / Scotland: http://www.sepa.org.uk/regulations/waste/transfrontier-shipment-of-waste/
Norway: http://www.miljodirektoratet.no/old/klif/publikasjoner/2516/ta2516.pdf
Switzerland: http://www.bafu.admin.ch/abfall/01508/06061/08974/index.html?lang=de

71 | P a g e
Annex I: Participants
Project team
Katie Olley, UK Naomi Ross, UK Pádraig O’Shea, UK Alfred Sharples, Malta Anno Loonstra, Netherlands Mark Preston, Northern Ireland Katharina Aiblinger-Madersbacher , Germany Sébastien Nochez, France
Participants
Austria - Walter Pirstinger Belgium - Bart Palmans Bulgaria - Lina Patarchanova Croatia - Jelena Manenica Cyprus - Demetris Demetriou Czech Republic - Jitka Jensovska Denmark - Dorte Skjøtt Jakobsen, Maria Lauesen Estonia - Rene Rajasalu Finland - Emma Nurmi France - Caroline Mackaie, Sebastien Nochez Germany - Bettina Voigt, Jürgen Braun, Maria Polixa, Greece – Alexandos Mouzakis Hungary – Andrea Szabo Ireland - Marese Feeney, Vivienne Ahern Italy – Barbara Villani Latvia - Lilija Dukalska (tbc), Evita Muizniece Lithuania - Audrius Zelvys Luxembourg - Frank Thewes Macedonia – Darko Blinkov Netherlands - Anno Loonstra Norway - Hilde Sundt, Magdalena Kwarta, Thor Jostein Dahlstrøm Poland - Edyta Kozlowska, Justyna Mordon Portugal - Marco Candeias Romania - Lucian Popa Serbia - Branislav Galesev Slovenia – Bojan Pockar Spain – Francisco Rico Sweden - Jonas Lundin, Mattias Lindgren, Pär Kollberg, Viktor Forsell Switzerland - Simonne Rufener United Kingdom - Laith Yasseen, and Mark Rhodes

72 | P a g e
Annex II: Terms of Reference
TOR Reference No.: Author(s): Katie Olley
Version: 4 (Final) Date: 2 February 2015
TERMS OF REFERENCE FOR WORK UNDER THE AUSPICES OF IMPEL
1. Work type and title
1.1 Identify which Expert Team this needs to go to for initial consideration
Industry
Waste and TFS
Water and land
Nature protection
Cross-cutting – tools and approaches -
x
1.2 Type of work you need funding for
Exchange visits
Peer reviews (e.g. IRI)
Conference
Development of tools/guidance
Comparison studies
Assessing legislation (checklist)
Other (please describe):
x
X (best practice meeting) x
1.3 Full name of work (enough to fully describe what the work area is)
IMPEL TFS Enforcement Actions on waste shipments
1.4 Abbreviated name of work or project
Enforcement Actions
2. Outline business case (why this piece of work?)
2.1 Name the legislative driver(s) where they exist (name the Directive, Regulation, etc.) Regulation 1013/2006/EC on shipments of waste Article 50(2) – ‘2. Member States shall, by way of measures for the enforcement of this Regulation,
provide, inter alia, for inspections of establishments, undertakings, brokers and dealers in
accordance with Article 34 of Directive 2008/98/EC, and for inspections of shipments of waste and
73 | P a g e
of the related recovery or disposal.’
Article 50(2a) also requires Member States to list their ‘arrangements for cooperation between
authorities involved in inspections’
Article 50(5) – ‘Member States shall cooperation, bilaterally or multilaterally, with one another in order to facilitate the prevention and detection of illegal shipments’
2.2 Link to IMPEL MASP priority work areas
1. Assist members to implement new legislation
2. Build capacity in member organisations through the IMPEL Review Initiatives
3. Work on ‘problem areas’ of implementation indentified by IMPEL and the
European Commission
x
x
2.3 Why is this work needed? (background, motivations, aims, etc.) The Enforcement Actions project was set up for the following reasons:
- Competent authorities expressed the need for a formalised project framework in order to
integrate enforcement inspections in their own countries;
- International cooperation is essential to tackle international environmental problems; and
- The network of enforcers in the field needs to be maintained and extended to cover all Member
States to ensure an effective inspection regime.
These reasons are still valid for continuing the Enforcement Actions project. Enforcements Actions
III allowed participants to gain valuable experience on inspection methods, enforcement structures,
planning inspections and exchange of staff and information.
Participants of the Enforcement Actions project have given resounding support for the project and
revealed how continued co-ordinated effort amongst competent authorities could further enhance
the effectiveness of waste shipment inspections, and overcome the ‘problem’ areas for regulatory
authorities that have been identified during the project.
The Enforcement Actions projects have formed the bedrock of practical activity of the IMPEL-TFS cluster for some time. The outcomes and data provided by the project are seen as very important by the European Commission and were used in its recent impact assessment for the revision of the Waste Shipment Regulation (660/2014). The objectives of this project are: 1. To work towards an adequate level of inspections in all Member States and a consistent level of
enforcement at all exit points of the EU
2. Promote site inspections at points of loading and encourage a cradle-to-grave approach to
inspection to minimise illegal shipments
3. To verify waste destination and the treatment at their destination within or outside Europe;
4. To provide an easily accessible European enforcement project for all co-operate with each

74 | P a g e
other, and also with other regulatory authorities, e.g. Police and Customs
5. To detect illegal shipments and deter future ones through effective communication and
guidance
6. To facilitate take-back procedures after an illegal shipment has taken place and
7. Demonstrate that the Member States take the enforcement of the WSR seriously
2.4 Desired outcome of the work (what do you want to achieve? What will be better / done differently as a result of this project?) The network will primarily seek to maintain and improve the network of front line waste shipment inspectors, inspection methods, exchange of information and inspectors’ knowledge on the Waste Shipment Regime. Co-operation with other regulatory authorities continues to develop within the project with Police and Customs officers frequently taking part in joint activity. The project has recently focussed on the importance of bilateral and regional co-operation and joint inspections and officer exchanges will foster this. This aspect is of particular importance as new countries join or re-enter the project, and new officers come through the system. The project is looking to introduce ‘smarter exchanges’ focussing on certain waste streams and operators that act across national borders. One particular exchange that has been suggested is with the involvement of the environmental protection agencies of Norway, Sweden, Finland, Estonia and Lithuania. This will involve GPS trackers being installed in waste by selected municipalities. The selected waste that that is often the subject of theft, such as WEEE, lead acid batteries or metal. The movement of the waste will be tracked from the point of origin to the end destination outside the borders of the country where the waste originates from. The snapshot data derived from the inspections are particularly important in highlighting the areas of weakness in inspection regimes and focussing future inspections. Different inspection locations, e.g. railheads will also be targeted by participants. ‘Repatriation’ was the most common outcome in Year I of the Enforcement Actions III project and it can be a cumbersome and protracted process as different authorities have different procedures and evidential requirements. The ‘Repatriation Manual’ is being re-drafted under the project and it is hoped that this will lead to a streamlined approach to returning illegal shipments of waste to the country of dispatch or otherwise dealt with in an environmentally sound manner. The best practice meeting in June 2015 would discuss the revisions to the Waste Shipment Regulation and participants’ experiences with it on an operational level.
2.5 Does this project link to any previous or current IMPEL projects? (state which projects and how they are related) Yes, follow on project from the Seaport I & II projects, the Verification I & II projects and the Enforcement Actions I, II and III projects. These projects showed the need for cross-border collaboration at an operational level in order to implement and enforce the WSR effectively. Participation has been increasing since the first Seaport project and needs to be maintained through the formalised structure that this project offers. Exchanges would also be open to participants of other IMPEL-TFS projects. Participants would be encouraged to use the Waste Sites II manual for company inspections.
75 | P a g e
3. Structure of the proposed activity
3.1 Describe the activities of the proposal (what are you going to do and how?) The main activities can be summarised as follows (in addition to the daily exchange of information):
- Co-ordinated inspections during three months in 2015 (three days per inspection month) to
provide a ‘snapshot’ of inspection data revealing the problem shipment routes, waste types and
destinations.
- undertaking an adequate level of inspections with other competent authorities (such as
Police and customs) on waste shipments (harbours, trains, companies and road traffic)
- Chain approach: competent authorities to check sites of loading and storage, verify
transport arrangements and the final recovery facility in order to ensure that a shipment accords
with the principle of ‘environmentally sound management’. Also verification with non-OECD
countries which have interrelation with IMPEL- TFS Asia project.
- Communication about this project and the different inspections via bi-monthly online
meetings and newsletters
- Collation and analysis of the results of the inspections
- Organisation of an ‘annual best practice’ meeting
- 16 exchanges of front-line inspectors during inspections periods each year. The focus will be
on bringing new countries in to the project and inspecting waste streams and illegal routes of
mutual concern between countries.
- Neighbouring countries will be asked to arrange border inspections in an effort to increase
participation.
- Attendance at National Contact Point meeting 2015 to reflect upon project and discuss
requirements and proposals for next phase.
3.2 Describe the products of the proposal (what are you going to produce in terms of output / outcome?) - A report that contains the following information:
The results of the exchanges and the lessons learned by inspectors;
An evaluation of existing enforcement gaps, based on the results of inspections and
verifications, Member State Annex IX reporting, Enforcement Actions outcomes and co-
ordinated analysis by competent authorities;
Recommendations for future activities.
- A network of contacts in countries needed for the collaboration on enforcement of the
Regulation, e.g. the Police and Customs.

76 | P a g e
- Update newsletter to participants
- Webex presentations for exchange of best practice
- Updated Repatriation Manual
- ‘Snapshot’ inspection data to assist Member States and the Commission in planning
- Contributions to the IMPEL photo library
- Press releases on the findings of participants.
- Maintenance of a network of operational contacts, extending to all Member States (if
possible); incorporating the principles of Article 50 of the EU Waste Shipment Regulation
3.3 Describe the milestones of this proposal (how will you know if you are on track to complete the work on time?) March 2015 – Inspection and exchange period June 2015 – Best Practice meeting and meeting of Project Group June 2015 – Inspection and exchange period October 2015 – Inspection and exchange period October 2015 – Update to NCP meeting November 2015 – Collation on 2015 results and Update to General Assembly December 2015 – Finalisation of project report February 2016 – Approval of final report Spring 2016 – Presentation of final report to General Assembly In addition – quarterly accounts reporting to IMPEL Secretariat
3.4 Risks (what are the potential risks for this project and what actions will be put in place to mitigate these?) There is a risk that some competent authorities will be unable to participate for part or the entire project due to staff cut backs and re-organisations in their respective organisations. Support will be offered to those countries, and neighbouring countries will be asked to assist in taking on the responsibility for arranging joint border inspections where possible.
4. Organisation of the work
4.1 Lead (who will lead the work: name, organisation and country) – this must be confirmed
prior to submission of the TOR to the General Assembly) Katie Olley, Scottish Environment Protection Agency, UK
4.2 Project team (who will take part: name, organisation and country) Alfred Sharples, MEPA, Malta Carl Huijberts, ILT, Netherlands Mark Preston, NIEA, Northern Ireland Katharina Aiblinger-Madersbacher , Regierung von Niederbayern, Germany Naomi Ross, Scottish Environment Protection Agency, UK (Due to re-organisations in Malta and NL, this has to be confirmed from January 2015)
4.3 Other IMPEL participants (name, organisation and country)

77 | P a g e
4. Austria - Walter Pirstinger
5. Belgium - Bart Palmans
6. Bulgaria - Lina Patarchanova, Viktoriya Belokonska
7. Croatia - Jelena Manenica
8. Cyprus - Demetris Demetriou
9. Czech Republic - Jitka Jensovska
10. Denmark - Dorte Skjøtt Jakobsen, Maria Lauesen
11. Estonia - Rene Rajasalu
12. Finland - Emma Nurmi
13. France - Caroline Mackaie, Sebastien Nochez
14. Germany - Bettina Voigt, Jürgen Braun, Maria Polixa, Thomas Ormond (communication and
exchanges with Waste Sites project)
15. Ireland - Marese Feeney, Vivienne Ahern
16. Italy – Marco Avanzo
17. Latvia - Lilija Dukalska (tbc), Evita Muizniece
18. Lithuania - Rasa Didjurgyte
19. Luxembourg - Frank Thewes
20. Macedonia – Darko Blinkov
21. Netherlands - Anno Loonstra
22. Norway - Hilde Sundt, Magdalena Kwarta, Thor Jostein Dahlstrøm
23. Poland - Edyta Kozlowska, Justyna Mordon -
24. Portugal - Maria Falcão
25. Romania - Lucian Popa
26. Serbia - Branislav Galesev
27. Slovenia – Bojan Pockar
28. Spain - Santiago Davila
29. Sweden - Jonas Lundin, Mattias Lindgren, Pär Kollberg, Viktor Forsell
30. Switzerland - Beat Frey, Isolde Erny, Simonne Rufener

78 | P a g e
31. United Kingdom - Allison Townley, Laith Yasseen, Linda Cheung, Mark Rhodes
4.4. Other non-IMPEL participants (name, organisation and country) National Police, National Customs, Port authorities, EU Commission, local authorities
5. High level budget projection of the proposal. In case this is a multi-year project,
identify future requirements as much as possible
Year 1 (exact)
Year 2 Year 3 Year 4
How much money do you require from IMPEL?
35000 570
How much money is to be co-financed
staff time Staff time
Total budget 35000 590
6. Detailed event costs of the work for year 1
Travel € (max €360 per return journey)
Hotel € (max €90 per night)
Catering € (max €25 per day)
Total costs €
Event 1 10800 5400 1500 17700
Type of event: Best Practice Meeting
Date: June 2015
Location: Scotland
No. participants: 30
No. days/ nights: 2
Event 2 8320 5400
1450 15170
Type of event: Exchange of inspectors
Date: March, June and October 2015
Location: Various locations
<No. of participants>23
<No. of days/nights> 3
Event 3 360 180 50 590
<Type of event> Attendance NCP
<Data of event>
<Location>
<No. of participants>
<No. of days/nights>
Event 4
<Type of event>

79 | P a g e
<Data of event>
<Location>
<No. of participants>
<No. of days/nights>
Total costs for all events
19480 10980 3000 33460
7. Detailed other costs of the work for year 1
7.1 Are you using a consultant?
xNo
7.2 What are the total costs for the consultant?
7.3 Who is paying for the consultant?
7.4. What will the consultant do?
7.5 Are there any additional costs?
Yes
Staff time Also 1540 Euros for the Nordic exchange for the purchase of equipment
7.6 What are the additional costs for?
SEPA staff for project management, data collation, analysis, newsletter production and editing (+ any additional hosting costs arising for best practice meeting) 1540 request for this to be met by IMPEL
7.7 Who is paying for the additional costs?
SEPA
7.8. Are you seeking other funding sources?
No
7.9 Do you need budget for communications around the project? If so, describe what type of activities and the related costs
Yes No
Namely:
8. Communication and follow-up (checklist)
What By when

80 | P a g e
8.1 Indicate which communication materials will be developed throughout the project and when (all to be sent to the communications officer at the IMPEL secretariat)
TOR*
Interim report*
Project report*
Progress report(s)
Press releases
News items for the website*
News items for the e-newsletter
Project abstract*
IMPEL at a Glance
Other, (give details): Template
presentation on Enforcement
Actions work
September 2014 December 2015 February 2016 May 2015 (+updates to Steering Committee) December 2016 March 2015 (or as requested) May 2015 (or as required) January 2015
8.2 Milestones / Scheduled meetings (for the website diary)
June 2015 – Annual Best practice meeting Spring 2016 – Publication of final report (Most of the webinars are for IMPEL members only but there may be an opportunity to host one for externals too on a specific subject)
8.3 Images for the IMPEL image bank
Yes
8.4 Indicate which materials will be translated and into which languages
The Waste (S)Watch continues to be translated in to other languages (at participating authorities’ cost)
8.5 Indicate if web-based tools will be developed and if hosting by IMPEL is required
No
8.6 Identify which groups/institutions will be targeted and how
European Commission, through contact with desk officers (offer of help to assist with reaching additional countries and speaking at meetings) Basel Convention Secretariat and INECE – dissemination of Repatriation Manual and collaboration to minimise overlaps Customs Network – through UK Border Force & participation in future Operation Demeters (Specific illegal waste operators through co-ordinated action)
8.7 Identify parallel developments / events by other organisations, where the project can be promoted
Basel Convention side event IMPEL-TFS update to EU Correspondents meeting CWIT Project
) Templates are available and should be used. *) Obligatory
9. Remarks Is there anything else you would like to add to the Terms of Reference that has not been covered above?

81 | P a g e
In case of doubts or questions please contact
the IMPEL Secretariat.
Draft and final versions need to be sent to the
IMPEL Secretariat in word format, not in
PDF.
Thank you.

82 | P a g e
Annex III: Newsletter
Newsletter The Waste Shipment Regulation (1013/2006/EC) requires Member States to inspect shipments of waste and co-operate with each other. The Impel-TFS Enforcement Actions project was established to support this obligation and enable effective enforcement of the waste shipment rules. The Enforcement Action project objectives include carrying out inspections on waste shipments, knowledge exchange and capacity building in order to harmonise the level of enforcement and expertise within the participating countries. For this purpose joint activities are to be carried out over six inspection periods throughout 2014 and 2015. If you have enquiries or need more information about any of the items covered in the update, please contact [email protected].
Update from the project Thirty-one countries are now participating in the project; these were Austria, Belgium, Bulgaria, Czech Republic, Cyprus, Denmark, Estonia, Finland, France, Germany, Greece, Ireland, Italy, Latvia, Lithuania, Luxembourg, Macedonia, Malta, The Netherlands, Norway, Poland, Portugal, Romania, Slovenia, Spain, Sweden, Switzerland, England, Wales, Scotland and Northern Ireland, of which 20 have so far submitted results for 2014 inspections. A total of 8190 inspections have been submitted so far this year. Twenty percent of these have been waste shipments. Further analysis on the data will be done once all countries have provided their results. Thank you to all authorities who have so far submitted their results. For those who have yet to give us their results, please do submit via Basecamp or to [email protected] as soon as you can! The following officer exchanges have been co-ordinated through the project this year:
The Netherlands Scotland
Scotland Ireland
Estonia & The Netherlands Slovenia
Bulgaria Germany
Norway Scotland
Norway & England The Netherlands
Norway & England The Netherlands
Sweden Italy
Germany Belgium
Sweden Germany

83 | P a g e
If you would like to suggest an exchange for 2015, please do get in touch with Katie. The draft Terms of Reference for 2015 work have been submitted to allow work under the project to continue in to 2015. Fingers crossed that we will be able to continue our worthwhile work.
Update from The Netherlands: E-waste from Germany to Ivory Coast & Nigeria In April and May 2014, customs in the port of Rotterdam checked three containers moving from Germany to Ivory Coast and Nigeria. The containers were filled with poorly packed used televisions and refrigerators, which were not accompanied by testing reports. Inspectors of the Human Environment and Transport Inspectorate in the Netherlands got involved in the case. After close collaboration between the Environment Authorities in Düsseldorf and Dutch Inspectors, the containers were sent back to the place of loading in Essen, Düsseldorf. The containers were unloaded and the items were tested in Germany, to determine whether they were waste or not. It turned out that many of the refrigerators contained CFCs and many of the used televisions did not function properly, therefore they were regarded as waste. More than a hundred electrical appliances were disposed of in a treatment facility in Düsseldorf.
Update from Germany: E-waste & ELV from Austria to Nigeria Two particularly interesting cases of illegal shipments of WEEE and ELV from Austria to Nigeria started in February and March 2014 in Lower Bavaria, South-East Germany. Environment officers stopped the truck and they were sent back to the country of dispatch. In both cases it was the same notifier. On 4th June 2014, an illegal shipment of WEEE and ELV from Austria to Nigeria sent by the same notifier, was stopped in the German Federal State of Saxony by Customs. As the exporter’s shipments had been stopped twice in the region, he changed his transport route, despite this being a longer route (from Austria, Czech Republic, Germany). This was to avoid regions where these trucks are inspected regularly, and is an example, not of port hopping but of "road hopping".

84 | P a g e
This demonstrates the importance of carrying out port and road inspections everywhere on the same level.
Exchange: UK and Norwegian inspectors visit ILT and Rotterdam Between 13th and 16th October two English and two Norwegian inspectors (from competent authorities and customs) visited the Dutch authority, ILT, in Rotterdam as a part of the EA III exchange programme. The exchange days were planned meticulously by the Dutch colleagues and the whole stay could be described as 'great success'. The programme of the exchange days comprised of both visits in the ILT offices in Utrecht and Rotterdam, and trips on more practical level to DFDS terminal Vlaardingen, and visiting Dutch Customs in the Maasvlakte. The Norwegian participants even had time for a trip to Belgium seeing how the Belgian inspectors perform their WSR related port-inspections.
The office visits and presentation given by the Dutch colleagues resulted in eager discussions on subjects such as tools used for answering questions from the media, centralising a service desk, types and numbers of TFS inspections, cooperation of the enforcement authorities, risk assessment, selection of the shipments and selection tools etc. The physical checks of containers were made with active participation from all participants. This resulted in immediate discussions and observations on the officers’ similar and different approaches, which were educational for all concerned. One specific case involving contaminated plastic took most of our attention, and brought up lots of useful discussion. Visiting the Dutch Customs with their office placed on the newly reclaimed land was impressive, and getting on board of a DFDS ferry on its way to Felixstowe, and getting to talk to the captain was a nice bonus.

85 | P a g e
Planning: Future dates
Date Event
Now Inspection Period 3 (October)
19-21 November UK – Ireland exchange
2 – 4 December Norway – UK exchange
8 -12 December Sweden – Italy exchange
December 2014 General Assembly Update
March 2015 Inspection period 4
Slovenia – Austria exchange
23-27 March 2015 Bulgaria – Germany – Netherlands – Greece exchange
20-21 May 2015 Best Practice meeting, Landshut
June 2015 Inspection period 5
And finally…. We would like to say a fond farewell to Carl Huijberts, Project Manager for the predecessor projects to Enforcement Actions III. Carl, we’ve really valued your support and contributions and wish you all the best in your new role in ILT.