Embed Size (px)
Citation preview

Technical Note 10: Impacts on the
Air Freight Industry, Customers
and Associated Business Sectors
ImpactsontheAirFreightIndustry,Customers
andAssociatedBusinessSectors

2
Contents
Executive Summary ................................................................................................... 3
1 Introduction ............................................................................................... 8
2 Air Cargo Trends ....................................................................................... 9
3 Air Cargo Forecasts ................................................................................ 22
4 Value of Constrained Air Cargo .............................................................. 29
5 Impacts on Businesses and Customers ................................................ 37
6 References ............................................................................................... 42

3
Executive Summary
Aviation infrastructure is critically important to the air freight industry. London’s six airports,
Heathrow, Gatwick, Stansted, Luton, London City and Southend are important to the UK’s air
freight industry, as London area airports facilitate 76% of the UK’s air cargo. Sustaining enough
aviation capacity to meet future air freight demand is the first step in encouraging future trade
growth. Capacity constraints at London’s airports, however, are not the only factor holding back air
cargo growth. For example, the price of jet fuel has increased significantly since 2000 and has
made it especially attractive for short-haul cargo to shift to other modes of transport.
This note examines how increased airport capacity (or conversely the lack of additional new
capacity) could affect airfreight and the economy.
It is part of a series of technical notes by Oxford Economics and Ramboll, prepared for Transport
for London in support of Lot 4 of the Mayor’s Aviation Work Programme – the assessment of socio-
economic effects. The Aviation Work Programme, in turn, has been conducted in order to develop
a submission to the Airports Commission (or “Davies Commission”) which has been charged with
examining the need for additional UK airport capacity.
The notes prepared by Oxford Economics have been designed to address specific questions and
issues posed within paragraph 3.16 of Aviation Commission (2013) Guidance Document 01: While
the notes prepared by Oxford Economics are separate, there is nonetheless some degree of
interaction between the issues they examine. The issues and results from some of the key
technical notes prepared by Oxford Economics are summarised in the table below:
Table 1: Summary of key Oxford Economics Technical Notes
Davies
Commission
Question/Issue
Results/Key messages
Impacts on the
UK economy
through the
provision of
international
connectivity -
Alignment with
the likely growth
in demand for
travel and ability
to service that
demand.
� This note used an econometric model to
examine connectivity benefits likely to be
generated through building a new hub airport
in the South East.
� The model suggests that a 10 per cent
increase in business related connectivity
increases economy-wide productivity – and
hence GDP - by 0.5 per cent in the long-run.
� The long-term economic benefit of expanding
airport capacity in the London area,
consistent with the Department for
Transport’s “unconstrained” capacity
forecasts for 2050, is found to be equivalent
to a GDP boost of £6.9 billion a year (at
today’s prices).
Impacts on the
local economy
through the
direct effects of
airports -
Impacts on the
� This note examined the employment and
Gross Value Added (GVA) impacts of
construction and operation of a new hub
airport at Stansted, the Isle of Grain or the
Outer Estuary.
� On a gross national basis, the total economic

4
local and
national
economy
through both
direct and
indirect effects
on employment
and skills.
impacts of operating a new airport and
associated ground transport at Stansted, the
Isle of Grain or the Outer Estuary in 2050
vary from 377,000-392,000 jobs (depending
on the option chosen) and £42bn of GVA
� On a net local basis, the operation of a new
hub airport at Stansted, the Isle of Grain or
the Outer Estuary means employment in the
local area is 123,000-134,000 higher and
GVA is £16.2-£16.6 billion higher than would
otherwise have been the case in 2050.
Impacts on the
local economy
through the
direct effects of
airports -
Impacts on
other airports.
� This note modelled the economic impacts of
the closure of Heathrow in the event of a new
hub airport being developed.
� Excluding local redevelopment impacts,
Heathrow local area employment would be
77,000 lower in 2050 (compared to a
business as usual baseline) if the airport
were to close though unemployment is only
modestly higher (3.5% rather than 3.0%).
� If the effects of a subsequent residential
redevelopment scenario of the old Heathrow
site are allowed for, in addition to the impacts
of closure, then local area employment would
be 33,500 lower compared to the baseline,
while unemployment would stand at 3.6%.
� Local area employment falls should not be
confused with increases in unemployment. A
local area resident who is subsequently re-
employed outside the local area (e.g. at the
new hub or elsewhere) would be a “job loss”
from the point of view of the local area but
would not be unemployed.
� Regardless of closure, local population,
employment and housing stock all increase
between 2029 and 2050. This is even more
true for the closure plus redevelopment
scenario, where local population is 136,000
higher than the baseline population.
Consumer
impacts -
Impacts on the
air freight
industry, its
customers and
associated
business
sectors
• This note examined how increased airport
capacity (or conversely the lack of additional
new capacity) could affect airfreight and the
economy.
• Capacity constraints at Heathrow may have
set in as early as 2005 and future cargo
growth is threatened by the inability of
London area airports to keep up with
demand.

5
• Modelling using the central case of a range
of forecast scenarios suggests that by 2050,
the value of air cargo lost to London due to
capacity constraints would equate to £106
billion per annum. However, this is not equal
to a net national GDP loss as much of this
freight may be traded via other UK airports,
or enter the UK indirectly.
• An alternative, economic welfare based
approach, suggests that by 2050 net national
losses due to airfreight capacity constraints
could equate to £3.9 billion per annum.
In 2012, goods sent by air represented 35% of the UK’s non-EU trade, a value of approximately
£120 billion. Non-EU trade, in turn, made up 49% of the UK’s trade in 2012. While air freight
accounts for less than 1% of the tonnage of EU27 trade, it makes up over 22% of the value of
EU27 trade1. In 2012, 93% of the UK’s bellyhold cargo volumes were sent through London area
airports. This is primarily due to the strength of Heathrow’s long-haul network. Capacity constraints
at Heathrow, however, set in as early as 2005 and future cargo growth is threatened by the inability
of London area airports to keep up with demand.
More cargo by volume is sent on long-haul rather than short-haul routes. This is consistent with the
idea that for short-haul routes within the UK and the EU, there are more choices available for mode
of transport, with road and rail being viable options. Only about half of UK short-haul cargo is
handled by London area airports, with Heathrow handling the most. Heathrow’s share of short-haul
cargo, however, has fallen in recent years and is close to falling behind Stansted. In all likelihood,
short-haul cargo may have fallen due to both capacity constraints at Heathrow and freight
forwarders substituting road or rail transport for short-haul destinations. Which phenomenon is
more important? Volumes of short-haul cargo peaked around the time the Channel Tunnel opened
in 1994 and have fallen ever since. Therefore, this hints that much of the decrease in short-haul
volumes may be due to the lower-cost option of truck transport to continental Europe rather than
capacity constraints at London area airports.
The difference between forecasts through 2050 of air cargo and the DfT’s constrained forecasts of
total ATMs represents economic activity that may not pass through London. It is likely that surplus
demand in the London area for air cargo business may be met using airports outside the London
area or even airports in continental Europe, though at a higher cost (i.e. it represents a welfare
loss). The lost value of traded goods is illustrated using four scenarios: a comparison of DfT model
parameters, an Oxford Economics lower bound forecast, an Oxford Economics central case and an
Oxford Economics upper bound forecast.
1 “The Economic Impact of Express Carriers in Europe,” Oxford Economics, November 2011.

6
Under these four scenarios there is a range of lost value of trade via air in 2050 that goes from £0
in the OE lower bound scenario to £270 billion in the OE upper bound scenario, with a central
scenario at £106 billion. DfT assumptions imply an even larger lost value of £550 billion2.
In the DfT framework in 2020, £42 billion worth of air cargo would be lost to London airports due to
capacity constraints. In the year 2050, that amount stands at £550 billion.
Under Oxford Economics’ lower bound scenario, the forecast for freight ATMs is below the DfT’s
constrained forecast (showing the point at which London Area Airports can no longer
accommodate flights based on current development). Therefore, there is surplus capacity for air
cargo in this scenario. Under Oxford Economics’ upper bound scenario, in 2020, £21 billion worth
of air cargo would be lost to London airports due to capacity constraints. In the year 2050, that
amount stands at £270 billion, due to an increase in capacity constraints. The Oxford Economics
central case, on the assumption that there is an equal probability of cargo growth across the
forecast range, predicts that in 2050, the value of air cargo lost to London equals £106 billion.
Such a wide range indicates the sensitivity of the predicted value of constrained air cargo to the
growth rate assumed. In considering these figures it should be noted that “lost trade” via air does
not equate to a GDP loss as it essentially relates to the gross sum of imports and exports which
could potentially be transported via air through London airports. Further, some of this trade may
divert to other airports (inside or outside the UK) or other modes, where practical. Nonetheless,
most economists agree that reduced trade with the outside world will have a negative impact on
GDP in the long run. So to the extent that some of this trade is indeed lost to the UK this could be
expected to have a long run negative economic impact. Moreover, to the extent that use of other
airports or modes is a “second best option”, this would also imply negative economic effects.
Considering these issues, another way of estimating economic losses due to capacity constraints is
via a microeconomic framework. This uses a derived demand curve to estimate the welfare loss
from capacity constraints on air freight at London area airports. Some economists see this
approach as providing a clearer picture of net economic effects. In the Oxford Economics lower
bound scenario in 2050, this would of course be £0. In the DfT scenario this would be £5.1billion in
2050. In the Oxford Economics upper bound scenario, this would be £4.3billion in 2050 and in the
Oxford Economics central case, this would be £3.9 billion in 2050.
Yet another method is to use multiplier analysis to estimate the GVA impact of a decreased
expenditure on air freight. The total multiplier for the industry is reported to be 3.66 by Steer Davies
Gleave, meaning that a £1 decrease in GVA in the industry translates into a £3.66 decrease in
GVA for the UK economy. Using this multiplier, one can in theory estimate the amount of air cargo
that would not be traded. In practice, the data requirements for this approach are complex and this
approach requires more assumptions and so it has not been attempted here.
The strength of London’s economy creates strong passenger demand for long-haul flights. In turn,
this provides a demand for bellyhold capacity to these long-haul destinations. In this sense, a hub
airport is very important for bellyhold cargo. Therefore, a new hub airport for London, with enough
capacity to meet demand for the next 30 to 40 years, would be particularly important for the growth
of bellyhold cargo. In the context of a discussion around a new hub airport for London, it should be
2 Estimations using the DfT framework does not take into account the design capacity of a new hub airport at Stansted or
the Thames Estuary. The Oxford Economics upper bound forecasts do allow for this. Accordingly, the upper bound Oxford
Economics forecasts are lower than those implied by use of the DfT framework.

7
recognised that both the Stansted hub option and the Inner Estuary hub option, although offering
greater bellyhold capacity than Heathrow, may not have any night time capacity for dedicated
freight due to restrictions on night time flights and due to greater passenger flights at night based
on the current engineering specifications. Therefore, dedicated freight will likely continue to rely on
Stansted airport for flights, and the growth of night flights will be constrained by the night quota
period in effect at Stansted (provided the Stansted hub doesn’t displace dedicated freight flights). A
new hub in the Outer Estuary, however, would likely not have night flight restrictions and may
therefore offer the best dedicated freight capacity out of all three options. It should be recognised
though, that if cargo were to grow as fast as it did during the 1990s, then the combination of the
new hub and other London area airports (except for Heathrow) would not be able to offer enough
aircraft movements to satisfy the demand for air cargo

8
1 Introduction
1.1 The Air Freight Industry
According to the Eddington study, aviation may be as important to global trade and economic
growth in the 21st century as the railways and shipping were for the 20
th century
3. Trade, a key
determinant of economic growth and prosperity, will become more important in the future. Oxford
Economics’ global trade forecasts predict that world trade will increase by nearly 90% over the next
decade4. Aviation infrastructure is critically important to the air freight industry. London’s six
airports, Heathrow, Gatwick, Stansted, Luton, London City and Southend are important to the UK’s
air freight industry, as they facilitate 76% of the UK’s air cargo. Sustaining enough aviation capacity
to meet future air freight demand is the first step in encouraging future trade growth.
In 2012, goods sent by air represented 35% of the UK’s non-EU trade, a value of approximately
£120 billion. Non-EU trade made up 49% of the UK’s trade in 2012. While air freight accounts for
less than 1% of the tonnage of EU27 trade, it makes up over 22% of the value of EU27 trade5.
London area airports carried 93% of the UK’s bellyhold cargo in 2012. Heathrow, London’s only
hub airport, facilitated 87% of the UK’s bellyhold cargo. In fact, Heathrow is the UK’s largest port
(by value) for non-EU trade, comparable to the combined total trade of Felixstowe and
Southampton, the UK’s two biggest container ports6. This is due to the strength of London area
airports in catering to long-haul destinations on a frequent basis and in particular, the strength of
Heathrow as London’s only hub airport.
Capacity constraints at Heathrow, however, set in as early as 2005 and future cargo growth is
threatened by the inability of London area airports to keep up with demand. A new hub airport for
London, with enough capacity to meet demand for the next 30 to 40 years, would be particularly
important for the growth of bellyhold cargo.
1.2 Note Structure
The remainder of the note is structured as follows:
� Section 2 discusses air cargo trends.
� Section 3 compares and estimates forecasts for air cargo.
� Section 4 discusses the value of constrained air freight.
� Section 5 speaks to the impacts of constrained air freight on customers and the industry.
� Section 6 concludes.
3 The Eddington Transport Study, “The Case for Action: Sir Rod Eddington’s Advice to Government,” December 2006.
4 “The Economic Impact of Express Carriers in Europe,” Oxford Economics, November 2011.
5 “The Economic Impact of Express Carriers in Europe,” Oxford Economics, November 2011.
6 “Air Freight: Economic and Environmental Drivers and Impacts,” Steer Davies Gleave, March 2010.

9
2 Air Cargo Trends
This section discusses trends in air cargo from 1990 to the present. Several segments of the
market are assessed, including dedicated cargo, bellyhold cargo, long-haul cargo, short-haul cargo
and express cargo. Lastly, the value of cargo passing though London area airports is discussed.
Key points
� Total cargo volumes increased from 1990-2012, with fast growth in the 1990s followed by
stagnation. A significant increase in the price and price volatility of kerosene and jet fuels
since 2000 could be a contributing factor in the stagnation of volumes since 2000.
� In 1990, 49% of dedicated cargo in the UK was sent via London area airports, but by 2012,
only 41% of dedicated cargo was flowing through London area airports. This is partly due to
the rise of East Midlands Airport as a national freight hub. Although less dedicated cargo
now originates from London, London airports, and particularly Stansted, are still important,
especially for express shipments originating/going to London.
� The strength of London’s economy creates strong passenger demand for long-haul flights.
In turn, this provides ample bellyhold capacity to these long-haul destinations. In this sense,
a hub airport is very important for UK bellyhold cargo.
� More cargo by volume is sent on long-haul rather than short-haul routes. This is consistent
with the idea that for short-haul routes within the UK and the EU, there are more choices
available for mode of transport, with road and rail being viable options.
� Over the 1996-2012 period, the real value per kilogram of imports and exports (net of tax)
flown through Heathrow increased by 50%. A portion of the value increase per kilogram of
50% may represent the adverse effect of capacity constraints on freight customers.
2.1 Definition of Cargo
The cargo volumes studied in this note include both mail and freight for both bellyhold cargo flown
on passenger flights and dedicated cargo flown on air freighters. A breakdown of trends by the
following categories is provided in the next few sections: dedicated cargo, bellyhold cargo, long-
haul cargo, short-haul cargo and express cargo.
2.2 Overall Cargo Trends
Chart 2.1 shows that total cargo volumes increased from 1990-2012, with fast growth in the 1990s
followed by stagnation. A significant dip occurred around the period of the financial crisis. The chart
shows that London area airports (LAA) provide the majority of cargo movements for the UK
(between 75 to 80% over the 1990-2012 period). This means that infrastructure for air cargo in
London is critically important for the movement of UK cargo. The dominance of London in the air
cargo market can be explained by the fact that London, as a large city, is a consolidation point for
the UK, a key centre of demand and has by far the most extensive long-haul network.

10
Chart 2.1: Total Cargo Volumes for the UK and London from 1990-2012
Chart 2.2 below shows the producer price index of Kerosene and Jet Fuels. A significant increase
in the price and price volatility of this commodity occurred from 2000. This could be a contributing
factor to the stagnation in cargo volumes seen from 2000.
Chart 2.2: Kerosene and Jet Fuel Producer Price Index from 1990-2012y
Chart 2.3 shows the breakdown by London area airport. Heathrow facilitates the vast majority of
cargo volumes in the London area, with volumes doubling over the 1990 to 2012 period. In 2012,
Heathrow carried 62% of total UK cargo by volume and 81% of total LAA cargo by volume. The
dominance of Heathrow’s role is due to its extensive long-haul network. In addition, London
Stansted has also been playing an increasing role in the air freight industry, with volumes growing
by over 600% from 1990 to 2012.
0
50
100
150
200
250
300
350
400
450
1990 1992 1994 1997 1999 2001 2004 2006 2008 2011
1982 = 100
Source : US Bureau of Labor Statistics
0
200
400
600
800
1,000
1,200
1,400
1,600
1,800
2,000
1990 1993 1996 1999 2002 2005 2008 2011
Thousand Tonnes
Source : CAA
Total LAA Cargo
Total UK Cargo

11
Chart 2.3: Total Cargo Volumes by London Airport from 1990-2012
2.3 Dedicated vs. Bellyhold Cargo
A small portion of total cargo volume is represented by dedicated cargo flown on freighters. Over
the 1990-2000 period, the volumes of dedicated air cargo approximately doubled, and remained
steady afterwards. The share of dedicated cargo being sent via London airports, however, has not
kept pace. In 1990, 49% of dedicated cargo in the UK was sent via London area airports, but by
2012, only 41% of dedicated cargo was flowing through London area airports. This is partly due to
the rise of East Midlands Airport as a national freight hub. The volume of cargo carried at East
Midlands in 2012 makes up approximately 62% of the gap between cargo flown from London and
the total cargo flown from the UK. Although less dedicated cargo now originates from London,
London airports - particularly Stansted - are still important, especially for express shipments
originating from/going to London.
Chart 2.4: Dedicated Cargo Volumes for the UK and London from 1990-2012
0
200
400
600
800
1,000
1,200
1,400
1,600
1990 1993 1996 1999 2002 2005 2008 2011
Gatwick
Heathrow
London City
Luton
Southend
Stansted
Thousand Tonnes
Source : CAA
0
200
400
600
800
1,000
1,200
1990 1993 1996 1999 2002 2005 2008 2011
Thousand Tonnes
Source : CAA
LAA
UK

12
Chart 2.5 below displays shipments of dedicated air cargo by airport over this period. In the early
1990s, Heathrow was the primary facilitator of dedicated cargo in London, but was soon overtaken
by Stansted airport, which now facilitates the majority of dedicated cargo. This phenomenon is
likely to be a symptom of capacity constraints at Heathrow, as traffic distribution rules (TDRs)
restrict day-time cargo only flights at Heathrow7. In 1990, Stansted airport had a 17% share of
dedicated cargo volumes for London area airports. By 2012, Stansted’s share climbed to a
dominant 70%. Similarly, dedicated cargo volumes at Gatwick have drastically declined from about
57,000 tonnes in 2005 to 73 tonnes in 2012. In addition to capacity constraints, the increasing
share of low-cost airlines at Gatwick, who do not freight, plays a role in the decline.
Freight yields are relatively low compared to passenger yields. In addition, dedicated freight
benefits less from flying from a passenger hub than bellyhold cargo. Hence, dedicated freight has
been pushed out to where there is capacity available – i.e. London Stansted.
Chart 2.5: Dedicated Cargo Volumes by London Area Airport from 1990-2012
For the freight market, bellyhold offers flexibility and a cost-effective means to carry shipments on
routes that would not justify deploying a dedicated freight aircraft. For the passenger market,
bellyhold provides useful – and sometimes essential – additional revenue. Bellyhold cargo for the
UK and for London area airports, carried on passenger airplanes, demonstrates a similarly
increasing trend as dedicated cargo at the country level. Chart 2.6 shows an increasing trend of
bellyhold cargo, with a particularly sharp rise over the 1990s and inertia afterwards. In 2012, 93%
of the UK’s bellyhold cargo volumes were sent through London area airports. This is primarily due
to the strength of Heathrow’s long-haul network.
7 Department for Transport, “The air freight end-to-end journey: An analysis of the end-to-end journey of air freight through
UK international gateways,” May 2009.
0
50
100
150
200
250
300
1990 1993 1996 1999 2002 2005 2008 2011
Gatwick
Heathrow
London City
Luton
Southend
Stansted
Thousand Tonnes
Source : CAA

13
Chart 2.6: Bellyhold Cargo Volumes for the UK and London from 1990-2012
Chart 2.7 below, showing bellyhold volumes by London airport, makes clear that Heathrow is the
main game in town. Gatwick facilitates a small portion of London of bellyhold cargo, but Heathrow
flies the majority. In fact, the rising trend of bellyhold cargo is due entirely to increased shipments
sent via Heathrow. The bellyhold cargo volume sent via Heathrow in 2012 represented 87% of total
UK bellyhold cargo volumes. The strength of London’s economy creates strong passenger demand
for long-haul flights. In turn, this provides a demand for bellyhold capacity to these long-haul
destinations. In this sense, a hub airport is very important for bellyhold cargo.
Chart 2.7: Bellyhold Cargo Volumes by London Airport from 1990-2012
0
500
1,000
1,500
2,000
2,500
3,000
1990 1993 1996 1999 2002 2005 2008 2011
Thousand Tonnes
Source : CAA
LAA
UK
0
200
400
600
800
1,000
1,200
1,400
1,600
1,800
1990 1993 1996 1999 2002 2005 2008 2011
Gatwick
Heathrow
London City
Luton
Southend
Stansted
Thousand Tonnes
Source : CAA

14
2.4 Long-Haul vs. Short-Haul Routes
More cargo by volume is sent on long-haul rather than short-haul routes. This is consistent with the
idea that for short-haul routes within the UK and the EU, there are more choices available for mode
of transport, with road and rail being viable options8. Chart 2.8 shows the volume of cargo shipped
via short-haul routes. Only about half of UK short-haul cargo is handled by London area airports,
with Heathrow handling the most. Heathrow’s share of short-haul cargo, however, has fallen in
recent years and is close to falling behind Stansted. In 1990, Heathrow had a 39% share of all UK
short-haul cargo. In 2012, this share fell to 18%. In all likelihood, short-haul cargo may have fallen
due to both capacity constraints at Heathrow and freight forwarders substituting road or rail
transport for short-haul destinations. In addition, the cost of air cargo is higher on short-haul routes
because a larger portion of the trip is spent on the ground and more time in the air is spent climbing
and descending9. Lastly, the lack of widebody planes on short-haul journeys make bellyhold cargo
less attractive at those distances to begin with.
Chart 2.8: Volume of Cargo Flown on Short-Haul Flights by London Area Airport from 1990
to 2012
Chart 2.9 below shows the volume of cargo flown on long-haul flights by London area airport. In
this distance category, London airports are driving national trends, led principally by Heathrow
airport. None of the other airports come close to the volume of cargo flown on long-haul flights via
Heathrow airport. In 2012, Heathrow facilitated 76% of cargo on UK long-haul flights.
8 Some long-haul cargo originating in London is also sent via other airports. Freight operators with hubs in continental
Europe, will truck cargo to their own hubs for onward shipping to long-haul destinations.
9 The World Bank Group, Transport Paper 26, “Air Freight: A Market Study with Implications for Landlocked Countries,”
August 2009.
0
100
200
300
400
500
600
700
800
1990 1993 1996 1999 2002 2005 2008 2011
Gatwick Heathrow
London City Luton
Southend Stansted
LAA UK
Thousand Tonnes
Source : CAA

15
Chart 2.9: Volume of Cargo Flown on Long-Haul Flights by Airport from 1990 to 2012
The different patterns of short-haul and long-haul dominance in London may be a function of
capacity constraints at Heathrow. Theoretically, a hub airport should facilitate both short-haul and
long-haul bellyhold cargo, as it should have many passengers transferring onto long-haul flights in
London from short-haul flights. Breaking down the long-haul and short-haul patterns further by
dedicated and bellyhold cargo shows that London airports are a gateway for bellyhold cargo, and
particularly Heathrow. For short-haul flights, the volume of dedicated cargo has nearly doubled
from 1990 to 2012. Only about a fifth of that volume, however, is currently carried through London
area airports, with Stansted bearing the lion’s share. This is partly related to the rise of East
Midlands Airport for dedicated freight and freight operators sending freight via other hubs.
Chart 2.10: Volume of Dedicated Cargo Flown on Short-Haul Flights by London Area Airport
from 1990 to 2012
.
0
500
1,000
1,500
2,000
2,500
1990 1993 1996 1999 2002 2005 2008 2011
Gatwick Heathrow
London City Luton
Southend Stansted
LAA UK
Thousand Tonnes
Source : CAA
0
100
200
300
400
500
600
1990 1993 1996 1999 2002 2005 2008 2011
Gatwick HeathrowLondon City LutonSouthend StanstedLAA UK
Thousand Tonnes
Source : CAA

16
Chart 2.11 below shows the pattern for bellyhold cargo over the short-haul distance. Unlike
dedicated cargo volume, bellyhold volume on short-haul flights have clearly fallen over the same
time period. In fact, total volume has fallen by more than 50% since 1990. London area airports
carry most of this volume, and within the London airports, it is Heathrow that carries the vast
majority of it.
The fact that volumes have fallen so dramatically could be due to both capacity constraints at
Heathrow and also to the substitution of air cargo on short-haul distances with rail or truck
transport. Which phenomenon is more important? The opening of the Channel Tunnel in 1994
between the UK and France has made it faster and cheaper to transport cargo by road between
continental Europe and the UK. In terms of truck transport, it is estimated that 97,000 tonnes of air
freight actually crosses the English Channel by truck per year, as compared to 87,000 tonnes flown
on bellyhold10
. In fact, the volume of short-haul cargo peaked around the time the Channel Tunnel
opened and has declined ever since. Therefore, this hints that much of the decrease in short-haul
volumes may be due to the relatively lower cost of truck transport to continental Europe rather than
capacity constraints at London area airports. In other words, the generalised cost of surface
transport (relative to air transport) has decreased, spurring a modal shift on short-haul routes.
Chart 2.11: Volume of Bellyhold Cargo Flown on Short-Haul Flights by Airport from 1990 to
2012
The pattern of dedicated cargo flown on long-haul flights is shown in Chart 2.12. The overall UK
trend shows a peak a few years before the financial crisis. Whereas London area airports used to
be the gateway for the majority of dedicated cargo on long-haul routes, this position has now been
eroded. In 1990, London area airports facilitated 83% of dedicated long-haul cargo. By 2012, they
only facilitated 63% of this cargo. Within London, Stansted airport now carries most of the
dedicated cargo on long-haul flights (this position was held by Heathrow in the early 1990s).
10 “Air Freight: Economic and Environmental Drivers and Impacts,” Steer Davies Gleave, March 2010.
0
50
100
150
200
250
300
1990 1993 1996 1999 2002 2005 2008 2011
Gatwick
Heathrow
London City
Luton
Southend
Stansted
LAA
UK
Thousand Tonnes
Source : CAA

17
Chart 2.12: Volume of Dedicated Cargo Flown on Long-Haul Flights by Airport from 1990 to
2012
Chart 2.13 below shows the volume of bellyhold cargo flown on long-haul routes. The chart
displays an increasing trend, with the fastest increase taking place in the 1990s. London area
airports carry the majority of this cargo, with Heathrow carrying 87% of it in 2012.
Chart 2.13: Volume of Bellyhold Cargo Flown on Long-Haul Flights by Airport from 1990 to
2012
Clearly, Heathrow’s focus on long-haul routes (which are more profitable than short-haul routes) as
capacity constraints have set in has resulted in less short-haul cargo passing through Heathrow, for
0
50
100
150
200
250
300
350
400
450
500
1990 1993 1996 1999 2002 2005 2008 2011
Gatwick
Heathrow
London City
Luton
Southend
Stansted
LAA
UK
Thousand Tonnes
Source : CAA
0
200
400
600
800
1,000
1,200
1,400
1,600
1,800
1990 1993 1996 1999 2002 2005 2008 2011
Gatwick Heathrow
London City Luton
Southend Stansted
LAA UK
Thousand Tonnes
Source : CAA

18
both bellyhold and dedicated cargo. Another dynamic at work has been the substitution from air
cargo to road and rail, partly driven by the rise in aviation fuel prices since 2000 and the availability
of fast transit through the Channel Tunnel. In theory, an unconstrained hub airport would have the
logistical advantage of being able to facilitate large amounts of both short-haul and long-haul
bellyhold cargo as part of its passenger flights and also dedicated cargo. It would still compete,
however, against the phenomena of trucking cargo to short-haul destinations or trucking cargo
onwards to other European hub airports for long-haul flights. Therefore, cost will be an important
factor in determining whether dedicated air cargo would thrive at a new hub airport.
2.5 Express Cargo
Express cargo transported by air is flown both via dedicated freight and bellyhold. Steer Davies
Gleave found that 62% of UK Express freight is carried by the integrators as dedicated freight and
that 35% of Express freight is flown as bellyhold cargo11
. The distinguishing factor of express
delivery services is that it provides customers with a comprehensive service, including collection
and delivery for each customer and customs clearance. It is therefore another sub-sector of air
freight. The types of goods typically transported by express services are high-value/low-weight
items such as electronic components, designer fashions and pharmaceutical products. Currently,
the most important express hub airports in the UK are East Midlands and London Stansted.
Express services rely on night flights to fulfil next-day deliveries. Therefore a hub airport with no
night flight restrictions would provide significant benefits to the express industry.
Express delivery is a €38 billion industry for Europe12
. In 2010, the express delivery sector
delivered about 269 million intra-EU cross-border shipments13
. Express delivery services are used
to deliver around €4 trillion worth of goods, the equivalent of 16% of European businesses’ sales
revenue.14
For the UK, Steer Davies Gleave estimated that express freight represented 430,000
tonnes, about 18% of 2008 freight volumes15
.
2.6 Value of Cargo Passing Through London Area Airports
Cargo transported by air is normally high-value cargo where speed matters. Cargo transported via
air is normally valued at more than $16 per kilogram16
. By value of cargo carried, the
semiconductor/high technology and telecommunications sectors are the largest users of air freight.
In fact, semiconductors made up 17% of the value of all goods transported in 201117
. By weight of
11 Air Freight: Economic and Environmental Drivers and Impacts,” Steer Davies Gleave, March 2010.
12 “The Economic Impact of Express Carriers in Europe,” Oxford Economics, November 2011.
13 Ibid.
14 Ibid.
15 “Air Freight: Economic and Environmental Drivers and Impacts,” Steer Davies Gleave, March 2010.
16 “World Air Cargo Forecast: 2012-2013,” Boeing.
17 “Navigating the Future: Global Market Forecast 2012-2013,” Airbus.

19
cargo carried, the fresh foods sector is the largest customer of air freight18
. Another source of data
on the value of cargo is HMRC. HMRC collects UK-specific data on the net value of imports and
exports passing through the UK by gateway (net of tax). Chart 2.14 below shows this pattern for
London area airports.
Chart 2.14: Real Value of Imports and Exports Sent Via London Area Airports from 1996 to
201219
Cargo by value flowing through London area airports has increased by 60% in real terms from
1996 to 2012. Heathrow, in fact, has carried 85% of the cargo by value through London area
airports over this time period. Chart 2.15 below shows the pattern by weight of imports and exports.
18 Ibid.
19 Data is not available for Southend airport.
0
10
20
30
40
50
60
70
80
90
1996 1999 2002 2005 2008 2011
Total
London City
London Gatwick
London Heathrow
London Stansted
Luton
£ Billions
Source : HMRC

20
Chart 2.15: Weight of Imports and Exports Sent Via London Area Airports from 1996 to 2012
As above, Heathrow airport carries most of the cargo by weight. There is, however, a significant dip
around the financial crisis. In fact, levels today by weight have not recovered to pre-crisis levels,
even though by value they have surpassed levels seen before the financial crisis. This indicates
that perhaps businesses are using air freight for the lightest, highest-value goods and less so for
bulkier items, a phenomena that could be related to the soaring cost of aviation fuel since 2000.
Chart 2.16 below normalises the real value of imports and exports by weight in order to gauge an
average real £ sterling value per kilogram of goods flowing through London area airports in 2005
pounds sterling20
.
20 London City airport data has been omitted as an individual series as it seems to be inconsistent from the data given for
other airports.
0
200
400
600
800
1,000
1,200
1,400
1996 1999 2002 2005 2008 2011
Total
London City
London Gatwick
London Heathrow
London Stansted
Luton
Million Kgs
Source : HMRC

21
Chart 2.16: Real Value per Kilogram of Imports and Exports Sent Via London Area Airports
from 1996 to 2012 (in £2005)
While the value per kilogram in real terms for London Heathrow has risen at a steady pace, the
trend for other airports fluctuates much more. This is likely due to the far smaller volumes traded
via other airports, making for a less smooth trend. In addition, this could also be due to more
dedicated freight operations at some of these airports that are more cyclical than bellyhold cargo,
the dominant type of air cargo flown through Heathrow.
Over this period, the real value per kilogram of imports and exports (net of tax) flown through
Heathrow increased by 50%. As Heathrow became more and more capacity constrained, the cost
of sending cargo via Heathrow would have risen in order to clear the market. One would expect
that the value of goods shipped via Heathrow would reflect the rising cost of air cargo via
Heathrow. For example, as the cost of air freight rises, one may only send the more valuable cargo
by air freight and truck the rest. Therefore, a portion of the value increase per kilogram of 50% may
represent the adverse effect of capacity constraints on freight customers.
0
50
100
150
200
250
300
350
400
450
1996 2000 2004 2008 2012
Average
London Gatwick
London Heathrow
London Stansted
Luton
£ Sterling per Kg
Source : HMRC, Oxford Economics

22
3 Air Cargo Forecasts
This section presents and analyses air cargo forecasts and assumptions from the Department for
Transport (DfT), Boeing, Airbus and also a forecast range constructed on the basis of past trends.
Key points
� The trend for the UK for the demand for air freight, the share of freight carried on dedicated
cargo flights and the average payload of dedicated cargo flights is assumed by the DfT to
follow the trend over the 1990 to 2011 period, an average rate of growth of 0.4% a year.
� Boeing forecasts a 3.37% growth rate for air freight through 2020. Comparing this forecast
to the DfT’s assumptions of total Air Traffic Movements for their Aviation model implies that
perhaps the Boeing forecasts are overly bullish regarding the growth of air cargo.
� Analysis of average growth rates for air cargo shows two distinct states of the world. Growth
from 2000-2012 was drastically lower than growth from 1990-2012. These two states of the
world are used to predict a range of trend forecasts to compare with Boeing forecasts of
cargo and the DfT model of aviation for London.
� The Oxford Economics forecast calculated on the basis of trend growth from 2000 to 2012 is
actually lower than the DfT’s constrained forecasts for all air traffic movements. Since the
DfT does not model the amount of bellyhold cargo that will be carried on passenger
airplanes, it is reasonable to think that not all passenger ATMs will carry cargo (and indeed,
the low-cost airlines generally do not).
� Conversely the Oxford Economics forecasts calculated on the basis of trend growth from
1990-2012 produce very high estimates for all air traffic movements. Therefore, these “upper
bound” forecasts have been capped to reflect the air transport movements accommodated
within the design assumptions of a new hub at Stansted or the Thames Estuary.
3.1 DfT Forecast for Dedicated Freight
Although the Department for Transport’s UK Aviation Forecasts are primarily focused on passenger
and air traffic movements, they also incorporate an implicit assumption regarding the growth of the
dedicated air freight market. Chart 3.1 below shows freighter Air Traffic Movements (ATMs) for the
UK and London area airports.

23
Chart 3.1: Dedicated Freight ATMs in the UK and London from 1990 to 2011
The trend for the UK for the demand for air freight, the share of freight carried on dedicated cargo
flights and the average payload of dedicated cargo flights is assumed by the DfT to follow the trend
over the 1990 to 2011 period, an average rate of growth of 0.4% a year.21
This is used as an input
into the DfT’s aviation model. Chart 3.2 below shows the ATMs by London area airport over the
same time period.
Chart 3.2: Dedicated Freight ATMs by London Area Airport from 1990 to 2011
21 “UK Aviation Forecasts”, Department for Transport, January 2013.
0
20,000
40,000
60,000
80,000
100,000
120,000
1990 1993 1996 1999 2002 2005 2008 2011
ATMs
Source : CAA
LAA
UK
0
2,000
4,000
6,000
8,000
10,000
12,000
14,000
16,000
1990 1993 1996 1999 2002 2005 2008 2011
GatwickHeathrowLondon CityLutonSouthendStansted
ATMs
Source : CAA

24
While giving a forecast of dedicated freight air traffic movements, the DfT forecasts do not explicitly
forecast bellyhold cargo demand, which is an important component of air cargo, especially for
London area airports.
3.2 Boeing and Airbus Forecasts for Air Cargo
Boeing and Airbus both produce forecasts for all air cargo, both bellyhold and dedicated. Table 3.1
below summarises cargo traffic forecast growth for Europe:
Table 3.1: Boeing and Airbus Forecasts of Air Cargo Growth Rates from 2012 – 2031
Weighing these forecasts by the percentage of trade between the UK and these regions allows one
to estimate a single weighted average air cargo growth rate for the UK. This results in a 3.37%
growth rate using the Boeing forecast and a 3.99% growth rate using the Airbus forecast. As a
comparator, for the segment of air cargo that is express delivery services, Oxford Economics
predicted a growth rate of 3.9% per annum through 202022
.
Applying the slightly more conservative Boeing forecast of 3.37% to historical data on bellyhold and
dedicated cargo tonnage and assuming that the same growth rate continues through to 2050
results in a predicted tonnage of air cargo via London area airports through 2050. In addition, an
assumption that the same proportion of dedicated versus bellyhold cargo as 2012 will continue is
22 “The Economic Impact of Express Carriers in Europe,” Oxford Economics, November 2011.
Region Boeing Forecast Airbus Forecast
Intra-Europe 2.4% 4.1%
Europe - North America 3.6% 3.4%
North America - Europe 3.3% 4.3%
Africa - Europe 3.9% 4.8%
Europe - Africa 5.4% 4.8%
Europe - Asia 5.6% 5.0%
Asia - Europe 5.8% 2.9%
Europe - Middle East 5.7% 5.1%
Middle East - Europe 5.8% 2.0%
Central America - Europe 4.4% 4.4%
Europe - Central America 5.9% 4.9%
Europe - South America 5.5% 5.1%
South America - Europe 5.1% 4.5%
CIS - Europe 6.0% 3.2%
Europe - CIS 5.1% 4.6%
Caribbean - Europe 4.2% --
Europe - Caribbean 3.3% --
Europe - Pacific -- 3.8%
Pacific - Europe -- 2.6%
Source: Boeing, Airbus.

25
made23
. Chart 3.3 below shows the resulting forecast through 2050 of London area airports’
bellyhold cargo, dedicated cargo, and total cargo24
.
Chart 3.3: Actual and Forecast London Area Airport Air Cargo Growth from 1990-2050
The lack of runway capacity at London area airports constrains air cargo shipments. In order to
value the difference between constrained and unconstrained air cargo, a conversion in units from
tonnes of cargo to ATMs must be made for both dedicated freight and bellyhold. In order to do so,
the relationship between cargo volumes and ATMs is used to convert future predicted volumes in
tonnes to a measure of ATMs. It is expected that payload per aircraft will rise over time for
freighters. Boeing divides freighter airplanes into three categories: large airplanes with a capacity
greater than 80 tonnes, medium widebody planes with a capacity between 40 to 80 tonnes and
standard-body planes with a capacity of less than 45 tonnes. In 2011, the dedicated freighter mix
consisted of 31% large planes, 33% medium widebody planes, and 36% standard-body planes. By
2031, Boeing predicts that more medium widebody planes will be substituted by large airplanes
and that the share of large airplanes will rise to 36%. In the absence of more specific data as to
how the payload might look over time, however, a conservative assumption of no growth in payload
beyond the year 2012 was employed. For bellyhold cargo, the same assumption was made. This
is because industry interviews indicate that airplanes, in response to high fuel costs, are gradually
getting smaller and lighter and may therefore carry less bellyhold cargo in the future.
Applying the conversion factors to predicted air cargo tonnage results in a forecast of ATMs for
both bellyhold and dedicated cargo. Chart 3.4 below displays forecast ATMs.
23 Past historical trends have shown that the proportion of bellyhold and dedicated freight cargo has remained steady from
1990 to 2012, ranging from 77 to 83% for bellyhold and 17-23% for dedicated cargo.
24 This chart combines air mail and other air freight, whereas Boeing have treated air mail as a separate category.
0
1,000
2,000
3,000
4,000
5,000
6,000
7,000
8,000
1990 2000 2010 2020 2030 2040 2050
Forecast
Thousand Tonnes
Source : Boeing, CAA, Oxford Economics
LAA Total Cargo
LAA Belly Hold
LAA Dedicated Cargo
26
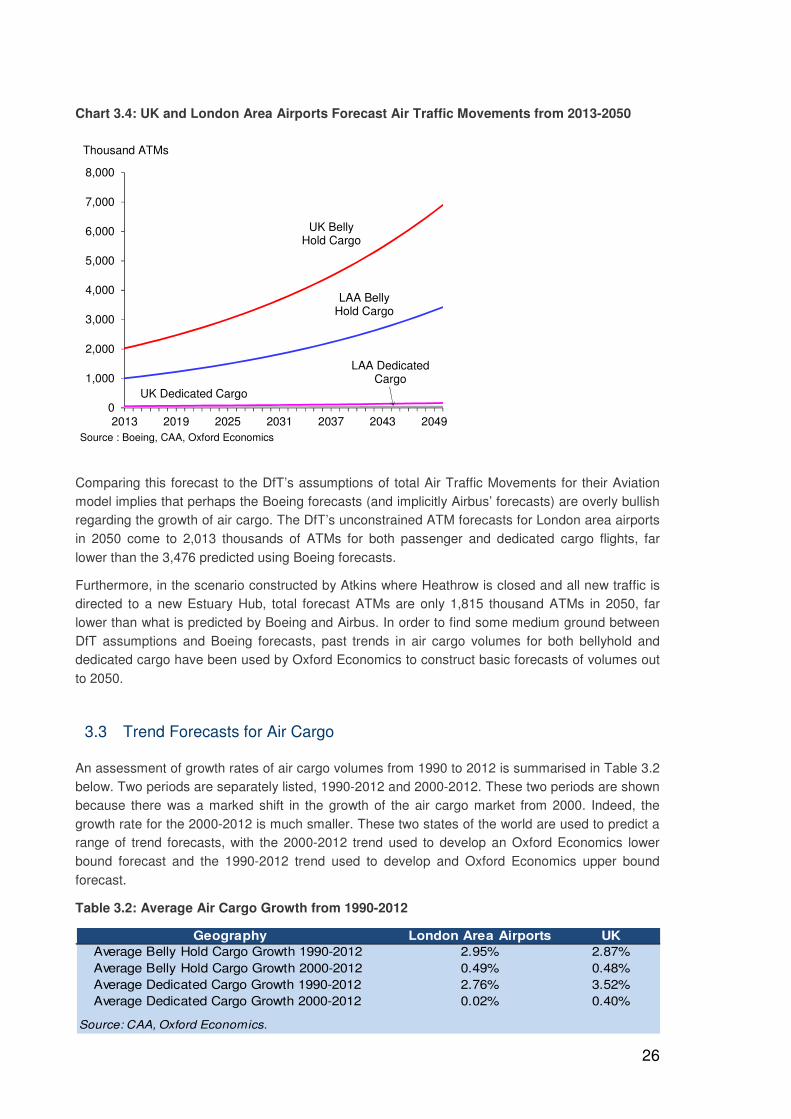
Chart 3.4: UK and London Area Airports Forecast Air Traffic Movements from 2013-2050
Comparing this forecast to the DfT’s assumptions of total Air Traffic Movements for their Aviation
model implies that perhaps the Boeing forecasts (and implicitly Airbus’ forecasts) are overly bullish
regarding the growth of air cargo. The DfT’s unconstrained ATM forecasts for London area airports
in 2050 come to 2,013 thousands of ATMs for both passenger and dedicated cargo flights, far
lower than the 3,476 predicted using Boeing forecasts.
Furthermore, in the scenario constructed by Atkins where Heathrow is closed and all new traffic is
directed to a new Estuary Hub, total forecast ATMs are only 1,815 thousand ATMs in 2050, far
lower than what is predicted by Boeing and Airbus. In order to find some medium ground between
DfT assumptions and Boeing forecasts, past trends in air cargo volumes for both bellyhold and
dedicated cargo have been used by Oxford Economics to construct basic forecasts of volumes out
to 2050.
3.3 Trend Forecasts for Air Cargo
An assessment of growth rates of air cargo volumes from 1990 to 2012 is summarised in Table 3.2
below. Two periods are separately listed, 1990-2012 and 2000-2012. These two periods are shown
because there was a marked shift in the growth of the air cargo market from 2000. Indeed, the
growth rate for the 2000-2012 is much smaller. These two states of the world are used to predict a
range of trend forecasts, with the 2000-2012 trend used to develop an Oxford Economics lower
bound forecast and the 1990-2012 trend used to develop and Oxford Economics upper bound
forecast.
Table 3.2: Average Air Cargo Growth from 1990-2012
Geography London Area Airports UK
Average Belly Hold Cargo Growth 1990-2012 2.95% 2.87%
Average Belly Hold Cargo Growth 2000-2012 0.49% 0.48%
Average Dedicated Cargo Growth 1990-2012 2.76% 3.52%
Average Dedicated Cargo Growth 2000-2012 0.02% 0.40%
Source: CAA, Oxford Economics.
0
1,000
2,000
3,000
4,000
5,000
6,000
7,000
8,000
2013 2019 2025 2031 2037 2043 2049
Thousand ATMs
Source : Boeing, CAA, Oxford Economics
LAA Dedicated Cargo
UK Dedicated Cargo
LAA Belly Hold Cargo
UK Belly Hold Cargo

27
There is a marked difference in the range of growth of dedicated cargo for London Area Airports,
as compared to the UK-wide growth rate. This is likely due to the high number of passenger flights
originating in London compared to the rest of the UK, which allows for more bellyhold cargo growth
as opposed to dedicated cargo growth. As mentioned in Section 2.2, one of the reasons for the
much slower growth rate of cargo after 2000 is likely the steep rise in the price of aviation fuel. The
fan charts below (charts 3.5 to 3.8) show the range of Oxford Economics trend forecasts for the UK
and London area airports25
. The upper range of the forecast implies that after 2033, the higher
range of cargo growth forecasts cannot even be met with a new hub airport. Therefore, the Oxford
Economics upper bound forecast has been capped at the line shown in the charts at the capacity
that can be built.
Charts 3.5 and 3.6: Actual and Forecast London Trend Bellyhold and Dedicated Freight
Growth from 1990-2050
Charts 3.7 and 3.8: Actual and Forecast UK Trend Bellyhold and Dedicated Freight Growth
from 1990-2050
25 Note that the Upper Bound ATM forecast has been capped from 2030 in order to match the ATM supply that could be
delivered, using Atkins data.
0
1,000,000
2,000,000
3,000,000
4,000,000
5,000,000
6,000,000
1990 2000 2010 2020 2030 2040 2050
Source : CAA, Oxford Economics
BellyholdForecast
Tonnes
Max Capacity
0
1,000,000
2,000,000
3,000,000
4,000,000
5,000,000
6,000,000
1990 2000 2010 2020 2030 2040 2050
Source : CAA, Oxford Economics
Dedicated CargoForecast
Tonnes
Max Capacity
0
1,000,000
2,000,000
3,000,000
4,000,000
5,000,000
6,000,000
1990 2000 2010 2020 2030 2040 2050
Source : CAA, Oxford Economics
BellyholdForecast
Tonnes
Max Capacity
0
1,000,000
2,000,000
3,000,000
4,000,000
5,000,000
6,000,000
1990 2000 2010 2020 2030 2040 2050
Source : CAA, Oxford Economics
Dedicated CargoForecast
Tonnes
Max Capacity

28
Again, to value the difference between constrained and unconstrained air cargo, a shift in units
from tonnes of cargo to ATMs must be made. The same relationship between cargo volumes and
ATMs as elaborated on in Section 3.2 is used to convert future predicted volumes in tonnes to a
measure of ATMs. Applying these conversion factors to forecast tonnage results in a forecast of
ATMs for both bellyhold and dedicated cargo using past trend growth.
Table 3.3 below compares the DfT’s Air Traffic Movement forecasts for both passenger and
dedicated freight flights for London against Oxford Economics’ trend forecast range for key years.
In addition, a central case has been created on the assumption that there is an equal probability of
cargo growth across the forecast range. If the air cargo sector displayed the high growth rate that
the uncapped upper bound Oxford Economics forecast predicts (shown in charts 3.5 and 3.6),
some of the cargo would have to be accommodated by other means of transport. In the scenario
where Heathrow is closed and all new traffic is directed to a new Estuary Hub (or a new Stansted
hub), 1364 thousand ATMs are available in 2030, rising to 1,815 thousand ATMs by 2050.
Therefore, the upper bound forecast has been capped from 2030 to match the capacity that could
be built. This is the forecast shown in table 3.3.
Table 3.3: Comparison of DfT and Oxford Economics London Area Airports ATM Forecasts
The Oxford Economics forecast calculated on the basis of trend growth from 2000 to 2012 (the
lower bound forecast) is actually lower than the DfT’s constrained forecasts for all air traffic
movements. Since the DfT does not model the amount of bellyhold cargo that will be carried on
passenger airplanes, it is reasonable to think that not all passenger ATMs will carry cargo (and
indeed, the low-cost airlines generally do not). The capped Oxford Economics forecast calculated
on the basis of trend growth from 1990-2012 (the upper bound forecast) is slightly lower than the
DfT’s unconstrained forecasts for all air traffic movements, however, by definition, the DfT
unconstrained forecasts do not take design capacity issues at the new hub into account.
It is possible to estimate how much lost value these unconstrained forecasts entail against the
DfT’s constrained forecasts using assumptions on the average tonnes of cargo per ATM flown and
the average £ sterling value per kg of cargo. This is calculated in the next section.
Year DfT LAA Unconstrained DfT LAA Constrained OE LAA Lower Bound OE LAA Central Case OE LAA Upper Bound
(Thousand ATMs) (Thousand ATMs) (Thousand ATMs) (Thousand ATMs) (Thousand ATMs)
2020 1,184 1,148 1,025 1,134 1,244
2030 1,411 1,294 1,074 1,219 1,364
2040 1,689 1,301 1,127 1,361 1,596
2050 2,013 1,293 1,182 1,498 1,815
Note: OE Upper Bound estimates capped from 2030 according to supply-side estimates by Atkins.
Source: DfT, Oxford Economics.

29
4 Value of Constrained Air Cargo
This section discusses the value of constrained air cargo. First, the lost value of air freight to
London due to constrained air traffic movements is measured using the DfT constrained air traffic
movement forecasts for London area airports against the Oxford Economics trend forecasts of air
cargo growth. Second, willingness to pay for air cargo is discussed. Lastly, the economic impact of
the air cargo sector is elaborated on.
Key points
� The difference between forecasts through 2050 of air cargo and the DfT’s constrained
forecasts of total ATMs represents the value of freight that may not pass through London. It
is likely that surplus demand in the London area for air cargo business may be met using
airports outside the London area or even airports in continental Europe.
� There is a range of lost value of freight via air in 2050 that goes from £0 in the OE low
growth scenario to £270 billion in the OE high growth scenario, with a central scenario at
£106 billion. DfT assumptions imply a lost value of £550 billion. Such a wide range clearly
indicates the sensitivity of the predicted value of constrained air cargo to the growth rate
assumed.
� Using the four scenarios to measure the amount and value of constrained air cargo at
London area airports, an estimate of the welfare loss arising from air cargo taking one extra
day in transit can be calculated. The total welfare loss in the Oxford Economics lower bound
scenario would be £0 in 2050. In the DfT scenario constructed using the difference between
unconstrained and constrained forecasts, this would be £5.1 billion in 2050. In the Oxford
Economics upper bound scenario, this would be £4.3 billion and in the Oxford Economics
central case this would be £3.9 billion in 2050.
� The three different hub options being put forth by TfL have similar implications for total air
traffic movements, but the different locations mean that some may be more favourable for
dedicated air freight. A new hub in the Outer Estuary, however, would likely not have night
flight restrictions as the Inner Estuary and Stansted hubs would and may therefore offer the
best dedicated freight capacity out of all three options.
4.1 Lost Value of Air Freight Due to Constrained Air Cargo
The difference between forecasts through 2050 of air cargo and the DfT’s constrained forecasts of
total ATMs represents activity that may not pass through London. It is likely that some of the
surplus demand in the London area for air cargo business would be met using airports outside the
London area (but within the UK) or even airports in continental Europe. This is a second-best
option as it most likely involves higher transport costs and more delays. If the cost of transport
becomes too high relative to the value of the item being traded, however, it is possible that trade for
these types of goods will be lost to the UK. While it is difficult to be sure on the precise split of
these losses, there is a clear risk that some proportion of trade would be lost to the UK and to
London in particular.
Although, freighters use a hub and spoke model, like passenger airlines, so they may continue to
choose to truck cargo to their hub airport of choice and then transfer the cargo to a long-haul flight
regardless of the capacity available at London area airports. Table 4.1 below summarises the

30
predicted volumes and (traded) value of the difference between constrained and unconstrained
ATMs for air cargo, assuming all aircraft movements hold cargo, using the DfT’s aviation forecasts.
Table 4.1: Predicted Annual Volumes and Value of Constrained Air Cargo Using DfT
Aviation Forecasts26
This calculation involves three key assumptions: the average tonnes of cargo per ATM flown, the
proportion of bellyhold and dedicated cargo and the projected real £ sterling value per kg of cargo
(based on past trends). The average tonnes of cargo per ATM flown were discussed in section 3.2.
The proportion of bellyhold and dedicated cargo was constructed using DfT forecasts of dedicated
freight ATMs as a percentage of total forecast ATMs. Finally, the real £ sterling value per kg of
cargo was calculated from 1996 – 2012 (shown in Chart 2.16). This real £ sterling value per kg of
cargo comes from custom declarations and is net of taxes and transport costs. From the trend of £
sterling per kg of cargo, the average growth was calculated and used to predict the value of cargo
out to 2050 in 2005 £ sterling27
.
Comparing the DfT constrained and unconstrained results, in 2020, £42 billion worth of air cargo
would be lost to London airports due to capacity constraints. In 2050, that amount rises to £550
billion.
Table 4.2 below shows the predicted volumes (only) of constrained air cargo using the lower bound
of the Oxford Economics trend forecast, which represents the difference between predicted
demand and the DfT’s constrained forecast.
Table 4.2: Predicted Annual Volumes of Constrained Air Cargo Using OE Lower Bound
Trend Forecasts
26 Southend Airport has not been included as part of London Area Airports here, as per DfT tables. It has, however, been
reflected in the Oxford Economics forecasts.
27 HMRC data does not distinguish between bellyhold and dedicated cargo. One would expect dedicated cargo to have a
higher value than bellyhold; however, the average value is used for both.
LAA Constrained Cargo Belly Hold Dedicated Belly Hold Cargo Dedicated Cargo
Cargo Cargo
Year (Thousand ATMs) (000 ATMs) (000 ATMs) (Kgs) (Kgs)
2020 -123 -122 -2 -199,007,217 -41,551,049
2030 -220 -217 -3 -354,390,025 -72,674,570
2040 -174 -172 -2 -281,370,352 -56,671,816
2050 -111 -110 -1 -179,940,132 -35,596,283
Source: DfT, Oxford Economics.
LAA Constrained LAA Constrained LAA Constrained Projected Belly Hold Dedicated Total Cargo
Cargo Belly Hold Cargo Dedicated Cargo Cargo Value Cargo Value Cargo Value Value
Year (kg) (kg) (kg) (£/kg) (£ m) (£m) (£m)
2020 385,901,399 311,847,496 74,053,903 £110 £34,214 £8,125 £42,338
2030 841,237,763 695,017,765 146,219,998 £148 £102,621 £21,590 £124,211
2040 1,371,711,802 1,156,295,065 215,416,737 £199 £229,770 £42,806 £272,576
2050 2,056,299,334 1,774,432,696 281,866,638 £267 £474,535 £75,379 £549,915
Source: DfT, Oxford Economics.

31
As discussed in section 3, the lower bound forecast for freight ATMs is below the DfT’s constrained
forecast (showing the point at which London Area Airports can no longer accommodate flights
based on current development). Therefore, there is surplus capacity for air cargo in this scenario
and there is no loss to London airports in terms of forgone cargo value.
Table 4.3 below shows the predicted volumes and value of constrained air cargo using the capped
upper bound of the Oxford Economics trend forecast. The volumes here represent the difference
between predicted demand in the Oxford Economics upper bound scenario and DfT constrained
forecasts.
Table 4.3: Predicted Annual Volumes and Value of Constrained Air Cargo Using OE Upper
Bound Trend Forecasts
In 2020, £21 billion worth of air cargo would be lost to London airports due to capacity constraints
in this upper bound scenario. After 2020, the quantity of air cargo demand exceeds available ATMs
that could be supplied in London and therefore the losses are capped by the amount that can be
supplied with a new hub airport in the estuary. By 2050, the value of capped air cargo lost to
London rises to £270 billion.
The Oxford Economics central case, on the assumption that there is an equal probability of cargo
growth across the forecast range, provides a midpoint estimate of air cargo losses to London
airports due to capacity constraints. Table 4.4 below shows the predicted volumes and values of
constrained air cargo using the central case of the Oxford Economics trend forecast. The volumes
here represent the difference between predicted demand in the Oxford Economics central case
and the DfT constrained forecasts.
Table 4.4: Predicted Annual Volumes and Value of Constrained Air Cargo Using OE Central
Case Trend Forecasts
The central case forecast predicts that demand for air cargo will not exceed the constrained supply
of ATMs in 2020 and 2030. However, in 2040 and 2050, the forecast predicts a deficit in supply so
that in 2050, the value of air cargo lost to London stands at £106 billion. Therefore there is a range
of lost value of trade via air in 2050 that goes from £0 in the Oxford Economics lower bound
scenario to £270 billion in the Oxford Economics upper bound scenario, with a central scenario at
£106 billion. DfT assumptions imply an even higher lost value of £550 billion (though the DfT
unconstrained forecasts are not capped like the Oxford ones). Such a wide range indicates the
sensitivity of the predicted value of constrained air cargo to the growth rate assumed.
LAA Constrained Belly Hold Dedicated Belly Hold Dedicated Projected Belly Hold Dedicated Total Cargo
Cargo Cargo Cargo Cargo Cargo Cargo Value Cargo Value Cargo Value Value
Year (000 ATMs) (000 ATMs) (000 ATMs) (Kgs) (Kgs) (£/kg) (£ m) (£m) (£m)
2020 96 95 1 154,672,622 32,294,355 £110 £16,970 £3,543 £20,513
2030 70 69 1 112,960,704 23,164,790 £148 £16,679 £3,420 £20,099
2040 295 291 4 476,166,397 95,906,389 £199 £94,620 £19,058 £113,678
2050 522 515 7 842,454,190 166,656,750 £267 £225,297 £44,569 £269,866
Source: DfT, Oxford Economics.
LAA Constrained Belly Hold Dedicated Belly Hold Dedicated Projected Belly Hold Dedicated Total Cargo
Cargo Cargo Cargo Cargo Cargo Cargo Value Cargo Value Cargo Value Value
Year (000 ATMs) (000 ATMs) (000 ATMs) (Kgs) (Kgs) (£/kg) (£ m) (£m) (£m)
2020 -14 0 0 0 0 £110 £0 £0 £0
2030 -75 0 0 0 0 £148 £0 £0 £0
2040 60 60 1 97,398,023 19,617,287 £199 £19,354 £3,898 £23,252
2050 205 202 3 331,257,029 65,530,233 £267 £88,588 £17,525 £106,113
Source: DfT, Oxford Economics.

32
In considering these figures it should be noted that “lost trade” via air does not equate to a GDP
loss as it essentially relates to the gross sum of imports and exports which could potentially be
transported via air through London airports but now would not be.
As this trade no longer passes through London airports, there are essentially four possibilities in
terms of what might happen to it:
1. Some of this trade may divert to other UK airports;
2. Some of this trade may divert to other modes, where practical;
3. Some of this trade may divert to foreign airports;
4. Some of this trade may never occur at either UK or foreign airports.
These possibilities are not mutually exclusive. For example it might be that some of the trade lost to
London airports trade diverts to other UK airports whilst other trade diverts to foreign airports.
Further, some trade initially diverting into foreign airports might enter the UK by other means (e.g.
offloaded onto lorries). Conversely some trade passing through foreign airports might never enter
the UK.
Most economists agree that reduced trade with the outside world will have a negative impact on
GDP in the long run. So to the extent that some of this trade is indeed lost to the UK (possibilities 3,
in part, and 4) this could be expected to have a long run negative economic impact on the UK (and,
indeed, the world, under possibility 4). Moreover, to the extent that use of other airports or transport
modes is a “second best option”, (possibilities 1 ,2 and 3) this would also imply negative economic
effects on the UK.
4.2 Willingness to Pay and Value of Time
Another way to measure the social benefit of a good or service is to assess willingness to pay.
Microeconomic theory predicts that the price someone is willing to pay for a good or service reflects
the perceived utility gained from purchasing that good or service. Therefore, willingness to pay is a
measure of the benefit derived by a consumer from a good or service. Some economists see this
approach as providing a clearer picture of net economic effects of a transport constraint or a new
transport initiative.
Steer Davies Gleave calculated the willingness to pay for air freight as compared to sea and road
transport for 4 sample routes. They found that air freight was 49% more expensive than shipping
by sea and the average time saved by choosing air freight over sea transport was 30 days. This
implies that the consumer values the 30 days at approximately 1.5 times the rate of container
shipping. When compared to road transport, air freight was 34% more expensive and the average
time saved was 3 days. The premiums paid for air freight in these cases reflect the extra utility
derived from the time saved compared to the alternative shipping method, which is a measure of
the value of air cargo to its customers.
The price differential paid for faster air transit is also known as the value of time. Time savings
account for a significant amount of the benefits of transport projects. For freight, the value of
reliability of transport mode is also quite important. While there are no UK-specific values of time
for air freight, work by Hummels and Schaur (2012) estimated air freight-specific values for the US,
finding that each day in transit is equal to an ad valorem tariff of 0.6%-2.3% of the value of the
good in question. HMRC trade data for non-EU trade shows the average value of air cargo
transiting via London area airports was £86.51 per kilogram. If we applied the US estimates to this
value, each day in transit would be valued between £0.52 and £1.99 per kilogram per day.

33
As transport valuations differ markedly across regions, though, it is quite important to use UK-
specific values of time. In the absence of aviation-specific figures for the UK, a surface access
value of time for express freight is used instead. Recent studies of freight transport costs suggest
that the value of time for express freight is around £5 per kilogram per 24 hours28
. As the cost of
air freight rises at London’s constrained airports, more shipments will be either diverted to less
expensive modes of transport or not traded at all if the value of time for that good is less than the
cost of sending it.
Using the four scenarios (the same scenarios as in Sections 3.3 and 4.1) to measure the amount
and value of constrained air cargo at London area airports, an estimate of the welfare loss arising
from air cargo taking one extra day in transit can be calculated. (Of course, under Oxford
Economics’ lower bound scenario, there is no constrained cargo at all.)
A representative 24 hour delay is used in the absence of data on how much of a delay cargo that
cannot pass through London airports may suffer. This constrained cargo can either pass through
another UK airport (with probably less than a day’s delay) or another hub airport outside the UK
(with a range of possible delay times) or it can be transported by truck (here delay depends on the
distance to be travelled). Of course, it does not take into account trade that no longer occurs. The
increased cost of £5 per kilogram for this 24 hour period is then weighted across all freight shipped
to reflect an overall rising market cost of all freight shipments (as demand exceeds supply) for an
overall cost increase of £1.4 per kilogram for all freight shipments.
Table 4.4 below shows a summary of the DfT scenario and Oxford Economics’ central case and
upper bound scenarios for one segment of the market, the portion of “constrained” cargo.
Table 4.5: Annual Welfare Loss Arising from 1 Extra Day in Transit for “Constrained” Air
Cargo
By 2050, the welfare loss for this segment of the market is £1.4 billion according to the DfT
scenario. Note that the DfT scenario displays a much higher welfare loss in 2050 than the Oxford
Economics upper bound scenario, due to the fact that the Oxford Economics upper bound scenario
is capped at the supply that is proposed to be built. In the Oxford Economics lower bound scenario,
the welfare loss is £0 in 2050, in the Oxford Economics upper bound scenario it is £710 million and
it is £279 million in the Oxford Economics central case.
The potential welfare loss measured above only measures a portion of the total potential welfare
loss due to constrained air freight, because it only indicates the loss from “constrained” freight, i.e.
freight that would drop out of the transport system if the overall market price did not rise. Figure 4.1
illustrates the total potential welfare losses (assuming a flat supply curve).
28 Oxford Economics, “Response to the Department for Transport’s Night Flights Consultation,” April 2013.
LAA Constrained Value 24 Hour Delay LAA Constrained Value 24 Hour Delay LAA Constrained Value 24 Hour Delay
Cargo - DfT Model DfT Constrained Cargo Cargo- OE Upper Bound OE Constrained Cargo Cargo- OE Central Case OE Central Constrained Cargo
Year (kgs) (2012 £) (kgs) (2012 £) (kgs) (2012 £)
2020 385,901,399 £271,694,222 186,966,977 £131,634,266 0 £0
2030 841,237,763 £592,274,194 136,125,494 £95,839,275 0 £0
2040 1,371,711,802 £965,754,911 572,072,787 £402,768,353 117,015,310 £82,384,733
2050 2,056,299,334 £1,447,739,372 1,009,110,940 £710,465,453 396,787,262 £279,358,424
Source: Oxford Economics.

34
Figure 4.1: Welfare Losses Due to Constrained Air Cargo (Not to Scale)
The triangle ABC is the welfare loss quantified in Table 4.5 – i.e. the amount of freight which drops
out of London’s aviation system. The total welfare loss, however, is the sum of triangle ABC and
rectangle P1P2AC. The price of £1.4 represents the price rise per kilogram of freight shipped (as
prices will need to rise in order to clear the market). In 2050, the welfare loss represented by
rectangle P1P2AC will be £0 in the Oxford Economics lower bound scenario and £3.6 billion for the
DfT scenario, the Oxford Economics upper bound scenario and the Oxford Economics central case
(all scenarios use the DfT constrained forecast as a base against which to measure what demand
cannot be met and the modelled price rise of £1.4 per kg of freight, so therefore the welfare loss
represented by P1P2AC is the same in all scenarios other than the lower bound scenario, which
does not predict constraints on air freight).
By adding the area of the triangle and the rectangle, one can then approximate the total welfare
loss. In the Oxford Economics lower bound scenario, this would of course be £0 in 2050. In the DfT
scenario this would be £5.1billion in 2050. In the Oxford Economics upper bound scenario, this
would be £4.3 billion and in the Oxford Economics central case, this would be £3.9 billion in
2050.These figures indicate the loss in economic welfare to the broader economy as a result of the
constraints on airport capacity.
Note that this model, for reasons of parsimony, assumes a flat supply curve. In practice, the supply
curve is unlikely to be flat. Hence the welfare losses estimated above are likely to be conservative
estimates. While they allow for welfare losses elsewhere in the economy (e.g. to businesses and
other consumers who must pay more for freight) they do not account for losses in producer surplus
(i.e., roughly speaking, profits) to aviation system “producers” themselves – e.g. airports, airlines.
Aviation system producers would also face a potential loss in profits due to the reduced level of air
traffic associated with constraints on airport capacity.
D
Q1Q2
P2
P1
A
B
C
£1.4/ kg
Kgs
Constrained
Cargo

35
4.3 Economic Impact of the Air Cargo Industry
Yet another approach to valuing the economic losses from constrained air cargo is the economic
impact approach. Oxford Economics, in 2011, conducted an economic impact of the express air
industry in Europe, showing that it supported 579,000 European jobs and contributed to over €23.4
billion of EU27 GDP. Steer Davies Gleave, however, conducted a study of the impacts of the entire
air cargo industry in 2010 for the DfT. They calculated the gross value added (GVA) of the air cargo
industry, that is, the industry’s contribution to the UK economy. Table 4.6 below summarises the
economic footprint of the air freight services sector.
Table 4.6: Economic Footprint of Air Freight Services
As its title suggests, the direct impact represents the direct economic impact of the companies
making up the air freight services industry, whereas the total economic impact represents the total
impact of the air freight services industry across the UK economy as a whole. In the case of
backward linkages the total economic impacts take into account direct effects as well as effects
such as supply chain impacts and employee wages on other sectors of the economy. In the case of
forward linkages, the total economic impacts include direct effects as well as the provision of
services from the air freight services industry to its clients.
The multipliers used by Steer Davies Gleave to calculate the economic impacts lie in a range from
1.6 to almost 4.0, implying that the economic impact of the air freight sector and related services
are between 1.6 and almost 4 times larger than the sectors. The total (backward linkages)
multiplier for the industry – i.e. taking into account supply chain and employee wage impacts - is
reported to be 3.66. This means that a £1 decrease in GVA in the industry translates into a £3.66
decrease in GVA for the UK economy. Using this multiplier, one can in theory estimate the impact
of the air cargo that would not be traded on the UK economy. In practice, the data requirements for
this approach are more complex than the data requirements for the approach in section 4.2 and so
it has not been attempted here. However, these figures illustrate how the forgone value in air
freight would impact the economy as a whole.
4.4 What Different Hub Options Mean for Air Freight
The three different hub options being put forth by TfL have similar implications for total air traffic
movements, but the different locations mean that some may be more favourable for dedicated air
Air Freight Services
Backward Linkages Forward Linkages
Direct Impact
GVA (£m)
Employment (000s)
Income (£m)
Total Economic Impact
GVA (£m) 7,339 6,939
Employment (000s) 135 147
Income (£m) 4,090 4,178
Source: Steer Davies Gleave.
2,004
39
1,354

36
freight. The first option is to close Heathrow and create a new hub at Stansted (in addition to
current low-cost airline operations at Stansted). The second option is to close Heathrow and create
a new hub in the Inner Estuary. The third option is to close Heathrow and create a new hub in the
Outer Estuary.
In the absence of specific airport operational data on this issue, the preceding modelling has not
taken a position on the bellyhold/dedicated freight split at individual airports. Rather, it is guided by
total ATMs at these airports as supplied by Atkins and the DfT.
In considering the Inner Estuary option, in particular, it should be recognised that this option,
although offering greater bellyhold capacity than Heathrow, may not have any night time capacity
for dedicated freight. This is due to restrictions on night time flights and due to greater passenger
flights at night. However, this is based on current engineering designs indicated by Atkins. If the
specifications changed, it would be possible to accommodate a higher level of dedicated freight
night flights.
Therefore, dedicated freight could continue to rely on Stansted airport for flights, both day and night
and the growth of night flights will be constrained by the night quota period in effect at Stansted.
For bellyhold cargo, the Inner Estuary hub will offer better capacity than London Heathrow. It
should be recognised though, that if cargo were to grow as fast as it did during the 1990s, then the
combination of the Inner Estuary hub, Stansted, Luton, London City, Southend and Gatwick will not
be able to offer enough aircraft movements to satisfy the demand for air cargo.
Similarly, a new hub at Stansted will likely have the same night flight restrictions in effect at
Stansted today and would therefore not provide greater dedicated freight capacity. A new hub in
the Outer Estuary, however, would likely not have night flight restrictions and may therefore
currently offer the best dedicated freight capacity out of all three options. Once again, it should be
noted, however, that the modelling undertaken in this note has been guided by inputs on total
ATMs, rather than by any specific data on precise freight operations at these airports. In the case
of the Outer Estuary – as in the case of the other two hub options – no specific assumptions have
been made by Atkins on the extent or nature of dedicated freight operations.
In this context, it is also worth considering the issues raised in section 5. If there is an industry
desire for a 24/7 hub airport, then the limitations discussed above should be kept in mind when
considering future airport service delivery and sitting options.

37
5 Impacts on Businesses and Customers
This section discusses the likely impacts on businesses and customers, with an initial focus on the
regional distribution of air cargo trade, as well as the product type distribution of such trade. Then,
a discussion of the results an interview with representatives of the Association of International
Courier and Express Services (AICES) is summarised.
Key points
� The two main regions that the UK trades with are Asia and Oceania and North America.
London area airports handle 26% of the UK’s trade with Asia and Oceania and 39% of the
UK’s trade with North America.
� There are four categories of goods where London area airports facilitate at least a third of
UK trade: chemicals & related products, manufactured goods classified by material,
machinery & transport equipment, and miscellaneous manufactured articles.
� Previous studies conducted by Oxford Economics have shown that express services follow
the cyclical growth of the economy. During economic upswings the demand for express
services typically grows more strongly than GDP. Further, the demand for express services
falls heavily when the economy slows. Thus, the need for future capacity is heavily
dependent on economic growth in the UK and its trading partners.
� The infrastructure needs for passengers and for freight are very different. Express services
cannot use passenger infrastructure such as railways because they cannot rely on other
bodies to take responsibility of the cargo.
� From the perspective of freight companies, the key feature of any new hub airport is that it
should be a 24 hour and 7 day operation.
5.1 Regional Dimension of Air Cargo Trade
The two main regions that the UK trades with are Asia and Oceania and North America. London
area airports facilitate a significant amount of the trade going to and from these regions. By value,
London area airports facilitate 50% of the UK’s non-EU trade. London area airports handle 26% of
the UK’s trade with Asia and Oceania and 39% of the UK’s trade with North America. London area
airports also handle a significant amount of the UK’s trade by value with the Middle East and North
Africa and Sub-Saharan Africa (28% and 32%, respectively). Of course, within London area
airports, Heathrow facilitates the majority, carrying 88% of the London area’s imports and exports
with non-EU nations by value.

38
Chart 5.1: Non-EU Trade by Region – 2012
5.2 Product Dimension of Air Cargo Trade
In terms of products traded via London area airports, there are four categories of goods where
London area airports facilitate a significant portion of UK trade: chemicals & related products,
manufactured goods classified by material, machinery & transport equipment, and miscellaneous
manufactured articles. In these categories, London area airports carry between 33 and 37% of UK
trade with non-EU countries.
Chart 5.2: Non-EU Trade by SITC1 Code - 2012
9 - Commodities/transactions not class'd elsewhere in SITC
8 - Miscellaneous manufactured articles
7 - Machinery & transport equipment
6 - Manufactured goods classified chiefly by material
5 - Chemicals & related products, nes
4 - Animal & vegetable oils, fats & waxes
3 - Mineral fuels, lubricants & related materials
2 - Crude materials, inedible, except fuels
1 - Beverages & tobacco
0 - Food & live animals
0
20
40
60
80
100
120
140
160
180
200
Asia and Oceania Latin America andCaribbean
North America Western Europe excEC
LAA UK
£ Billions
Source : HMRC
£0
£20
£40
£60
£80
£100
£120
£140
9 8 7 6 5 4 3 2 1 0
UK LAASource : HMRC
Billions

39
Within these four categories, there is a further subset of goods where trade via London area
airports makes up at least 35% of total UK trade by value. They are listed in Table 5.1 below.
Table 5.1: Trade by SITC2 Category for Frequently Traded Goods via LAA - 2012
5.3 Discussion with Freight Companies
To assess the importance of air freight for UK businesses and the future role of air cargo we have
conducted an interview with Association of International Courier & Express Services (AICES).
AICES is the trade organisation in the United Kingdom for companies handling international
express documents and package shipments. The current members range from huge multinational
companies, such as DHL, FedEx, TNT and UPS, to smaller operators offering niche services for
particular products or between specific countries. The discussion below is structured around the
results of the interview, which took place in May 2013.
5.3.1 The Current and Future Market
The express business follows UK trade trends. This means that the main UK export markets (USA,
EU and China) are the most important markets. Further, the emerging economies and especially
the BRIC countries are very important markets for the sector. The importance of non-EU markets is
supported by an Oxford Economics survey from 2011 on the economic impact of Express Carriers
in Europe. The survey reports that 21 % of European businesses frequently use express shipments
to send consignments to destinations outside the EU27. Further, the survey finds that UK
businesses are more dependent on express services than businesses based in continental Europe.
The current freight markets are also expected to be the most important markets in the future.
However it is expected that emerging markets will be even more important as these economies will
increasingly drive world GDP. The IMF world GDP forecasts indicate that the 8 largest emerging
markets will account for more than half of the worldwide GDP growth within the next 10 years.
5.3.2 Bellyhold and Dedicated Freight
There are two main components that affect the choice of mode (i.e. bellyhold vs. dedicated freight).
The first component is economic growth where the trends for dedicated freight show that it is a
highly cyclical market segment, which relies on the growth of world trade. On the other hand
bellyhold freight does not seem to be so sensitive to trade cycles. The second component is the
operations of the individual freight companies. There are several elements in the decision-making
SITC2 Category LAA UK
87 - Professional, scientific & controlling ins & app n.e.s. £4,875,022,927 £9,555,279,136
88 - Photographic & optical goods, n.e.s.; watches & clocks £1,390,387,810 £2,373,986,519
89 - Miscellaneous manufactured articles n.e.s. £11,164,341,928 £24,798,445,765
71 - Power generating machinery & equipment £11,932,782,385 £26,032,195,346
75 - Office machines & adp machines £4,456,462,131 £8,123,647,797
76 - Telecomms & sound recording & reproducing app. & eqp. £7,362,064,988 £11,686,335,532
79 - Other transport equipment £6,129,194,107 £13,128,453,359
66 - Non-metallic mineral manufactures n.e.s. £7,242,906,887 £10,381,869,506
68 - Non-ferrous metals £5,517,734,711 £11,565,387,381
51 - Organic chemicals £3,639,962,908 £7,495,847,903
54 - Medicinal & pharmaceutical products £7,367,768,435 £17,259,772,056
Source: HMRC.

40
of the individual freight company. Is use of bellyhold (rather than own aircraft) the best choice
regarding cost, distance, volume etc.? Are the aircraft actually available (flying rights, aircraft
availability)? Does the passenger flight offer something ones’ own network does not? Some freight
companies use only dedicated freight flights while others are 100 per cent dependent on bellyhold
cargo. However it is expected that all types of cargo operations (dedicated freight and bellyhold
cargo) are expected to grow as economic growth improves.
Some of the cargo transported by the different modes is the same type of cargo. However, there
are some constraints on bellyhold cargo with limits regarding size and weight. This means that
dedicated freight offers a wider range of cargo types than bellyhold cargo. Bellyhold cargo (around
93% of London area cargo in 2012) offers flexibility and a cost-effective means to carry shipments
on routes that would not justify deploying a dedicated freight aircraft. It remains an important part of
the freight market in the future.
5.3.3 Short-Haul and Long-Haul Traffic
In the future, both short haul and long haul traffic are expected to remain important for the freight
market. It is important to stress that the freight companies are transport companies and not just
airlines. Today some short haul freight is carried by truck on short haul distances. Thus, freight
companies only use air transport only when necessary to meet their customers' demands e.g. next-
day delivery.
AICES believes that there is no sign that demand for next-day delivery and hence short haul air
traffic will decrease in the future. A recent Oxford Economics survey found that around half of
companies reported that they would be badly affected if international next-day delivery were no
longer available. Further, the survey reported that 9 per cent of respondents expected their use of
express delivery services to rise by more than 10 per cent over the next five years, while 23 per
cent expect to increase their use of express delivery services by between 5-10 per cent over the
next five years.
5.3.4 Need for New Capacity?
Previous Oxford Economics studies have shown that express services follow the cyclical growth of
the economy. During economic upswings the demand for express services typically grows more
strongly than GDP. Further, the demand for express services falls heavily when the economy
slows. Thus, the need for future capacity is heavily dependent on economic growth in the UK and
its trading partners. The key issue regarding new capacity is to ensure that the South East has
sufficient capacity to air cargo growth. Under the current arrangements, this means sufficient
bellyhold capacity at Heathrow or a new hub airport to enable direct connectivity with long haul
destinations and sufficient night time movements at Stansted.
Currently, many airlines are changing their fleets from Boeing 777-300 to Airbus A380. The A380
has a larger passenger volume but at the same time only has around half the bellyhold capacity as
the Boeing 777-300. This means that an increase in the passenger volume does not necessary
mean an increase in the bellyhold capacity. Further, there is also a need to have sufficient night
time movements at Stansted to fulfil customer needs. A previous study has demonstrated that the
night time aircraft movement limit is reached at Stansted in two to five years, depending on the
timing and strength of the UK’s economic recovery.
It is also essential that there is enough capacity for the UK to maintain its position as a hub. A key
feature of the express industry is the use of the ‘hub-and-spoke’ distribution model. International
packages are consolidated with packages from other countries for transportation on to their final

41
destination (Transhipments). The UK offers a good geographical location to act as a hub between
The USA and the rest of Europe. The market is competitive and the UK competes directly with
other EU airports in e.g. France and Holland. The hub status also helps to sustain the range of
destinations currently serviced in the UK and are needed to ensure that guaranteed next-day
delivery is not limited to large ‘point-to-point’ routes.
5.3.5 Important Features of a New Hub Airport for London
As previously mentioned, a survey in 2011 reported that around half of companies stated that they
would be badly affected if international next-day delivery were no longer available. The express
services need a hub operation in the South East in order to ensure overnight deliveries to UK
business. The key feature of any new hub airport is that it should be a 24 hour and 7 day
operation. This is important to allow express operators to satisfy customer demands for overnight
deliveries and to enable transhipment activity. It is important to stress that an airport does not
operate in isolation. Warehouses, parking and road infrastructure is necessary to enable next day
delivery. Thus, it is necessary to consider these in the planning phase of a new airport. A new hub
at Stansted or the Inner Estuary, however, would likely not provide enough capacity as there are
likely to be night flight restrictions.
The infrastructure needs for passengers and for freight are very different. Express services cannot
use passenger infrastructure such as railways because they cannot rely on other bodies to take
responsibility of the cargo. There are several reasons why the use of passenger rail or even
dedicated freight trains is not viable: 1)The schedules are not flexible; 2) Freight takes second
place to passengers and is therefore routinely sacrificed; 3) Maintenance work takes place at night
and at weekends slowing and disrupting transit times; 4) Rail depots are not usually near the
facilities which require additional time for mode transfers; 5) and most of all, the freight companies
don’t have control of their customer’s freight whilst it is with the rail operator.
Finally, AICES Members are concerned that a considerable number of their customers have
located their businesses around existing airports such as Heathrow. Their location in close
proximity to express services has the advantage of the latest possible collection times in the
working day. A new hub airport will also imply moving of all those businesses if their access to the
airport and their global competitiveness is to be retained. Further consideration also needs to be
given to all the businesses that service those businesses close to current airports e.g. catering and
cleaners. These businesses would experience a welfare loss in the short term.

42
6 References
Airbus, “Navigating the Future: Global Market Forecast 2012-2013.”
Boeing, “World Air Cargo Forecast: 2012-2013.”
Civil Aviation Authority, UK Airport Statistics, 1990-2012.
Department for Transport, “UK Aviation Forecasts”, January 2013.
Department for Transport, “The air freight end-to-end journey: An analysis of the end-to-end
journey of air freight through UK international gateways,” May 2009.
HM Revenue and Customs, Overseas Trade Statistics, 1996-2012.
Hummels, David and Georg Schaur, “Time as a Trade Barrier,” NBER Working Paper No. 17758,
January 2012.
Oxford Economics, “The Economic Impact of Express Carriers in Europe,” November 2011.
Oxford Economics, “Response to the Department for Transport’s Night Flights Consultation,” April
2013.
Steer Davies Gleave, “Air Freight: Economic and Environmental Drivers and Impacts,” March 2010.
The Eddington Transport Study, “The Case for Action: Sir Rod Eddington’s Advice to Government,”
December 2006.
The World Bank Group, Transport Paper 26, “Air Freight: A Market Study with Implications for
Landlocked Countries,” August 2009.

OXFORD
Abbey House, 121 St Aldates
Oxford, OX1 1hb, UK
Tel: +44 1865 268900
LONDON
Broadwall House, 21 Broadwall
London, SE1 9PL, UK
Tel: +44 207 803 1400
BELFAST
Lagan House, Sackville Street
Lisburn, BT27 4AB, UK
Tel: +44 28 9266 0669
NEW YORK
817 Broadway, 10th Floor
New York, NY 10003, USA
Tel: +1 646 786 1863
PHILADELPHIA
303 Lancaster Avenue, Suite 1b
Wayne PA 19087, USA
Tel: +1 610 995 9600
SINGAPORE
No.1 North Bridge Road
High Street Centre #22-07
Singapore 179094
Tel: +65 6338 1235
PARIS
9 rue Huysmans
75006 Paris, France
Tel: + 33 6 79 900 846
email: [email protected]
www.oxfordeconomics.com