Embed Size (px)
Citation preview

Introduction
Extreme climate events are expected to become more frequent as a result ofclimate change. Climate extremes can have devastating effects on human soci-eties. History records widespread disasters, famines and disease outbreaks trig-gered by droughts and floods. These complex, large-scale disruptions exert theirworst effects in poor countries but even the richest industrial societies are notimmune. Extreme weather events are, by definition, rare stochastic events. Thereare two categories (1):
• extremes based on simple climate statistics, such as very low or very high temperatures;
• more complex, event driven extremes: droughts, floods, or hurricanes—these do not necessarily occur every year at a given location.
With climate change, even if the statistical distribution of simple extreme eventsremains the same, a shift in the mean will result in a non-linear change in thefrequency of extreme events. The detection of change in simple climate extremesis more likely than the detection of changes in event-driven extremes.
Climate variability can be expressed at various temporal scales (by day, seasonand year) and is an inherent characteristic of climate, whether or not the climatesystem is subject to change. Much attention has focused on the influence of ElNiño-Southern Oscillation (ENSO) on weather patterns in many parts of theworld. In sensitive regions, ENSO events may cause significant inter-annual per-turbations in temperature and/or rainfall within a loose 2–7 year cycle. However,it is important that such perturbations are not confused with climate change. Inreality, these fluctuations introduce more noise into the long-term trends,making it more difficult to detect the climate change signal.
The effect of climate change on the frequency and/or amplitude of El Niño isuncertain. However, even with little or no change in amplitude, climate changeis likely to lead to greater extremes of drying and heavy rainfall and increase therisk of droughts and floods that occur with El Niño in many regions.
A range of physical, ecological and social mechanisms can explain an associ-ation between extremes of climate and disease (Figure 5.1, Table 5.1 and Table5.2). Social mechanisms may be very important but are difficult to quantify: forexample, droughts and floods often cause population displacement. Outbreaksof infectious disease are common in refugee populations due to inadequate public
79
CHAPTER 5
Impacts on health of climate extremesS. Hales,1 S.J. Edwards,2 R.S. Kovats2
1 Wellington School of Medicine, University of Otago, Wellington, New Zealand.2 London School of Hygiene and Tropical Medicine, London, England.

health infrastructure, poor water and sanitation, overcrowding and lack ofshelter. Climate also can affect infectious diseases that are spread via contami-nated water or food. Water-related diseases are a particular problem in poorcountries and communities, where water supplies and sanitation often are inad-equate. Outbreaks of cholera, typhoid and diarrhoeal diseases can occur afterflooding if the floodwaters become contaminated with human or animal waste,while drought reduces the water available for washing and sanitation and alsotends to increase the risk of disease.
There is a web of interactions between ecosystems, climate and human soci-eties, which influences the occurrence of infections. For example, the resurgenceof communicable diseases in the past few decades is thought to have resultedprimarily from social factors including population growth, urbanization, changesin land use and agricultural practices, deforestation, international travel andbreakdown in public health infrastructure (3). From the opposite perspective,major communicable diseases such as malaria also can severely limit social devel-opment (4).
80 CLIMATE CHANGE AND HUMAN HEALTH
FIGURE 5.1 ENSO and disease. ENSO events cause physical effects such as droughtsand floods (blue circle). Where these overlap and interact with suitable ecological andsocioeconomic conditions (within dotted lines) they may cause disease outbreaks (darkshaded area).
ENSO
Droughts and floods:disruption of food and water supplies
Pathogens:effects of temperature andrainfall on abundance and
distribution
Vectorecology:
(mosquitoes, ticks)and
intermediate hosts(mammals, birds):
• abundance• distribution• behaviour
Economic factors• poverty
• population displacement/travel• housing/urbanisation/population density
• public health infrastructure
• herd immunity• nutritional status
Social factors:• human behaviour
(water storage practices)• land use
(irrigation/forest clearance/livestock)
This chapter summarizes what is known about the historical effects of climateextremes on human health. The following section describes studies of infectiousdiseases and climate extremes related to El Niño Southern Oscillation. The nextconsiders the impacts of short-term extremes of temperature. The final sectioncontains a discussion of climate-related disasters.
El Niño and infectious diseases
There is a well-studied relationship between rainfall and diseases spread by insectvectors which breed in water, and are therefore dependent on surface water avail-ability. The main species of interest are mosquitoes, which spread malaria and
CHAPTER 5. CLIMATE EXTREMES 81
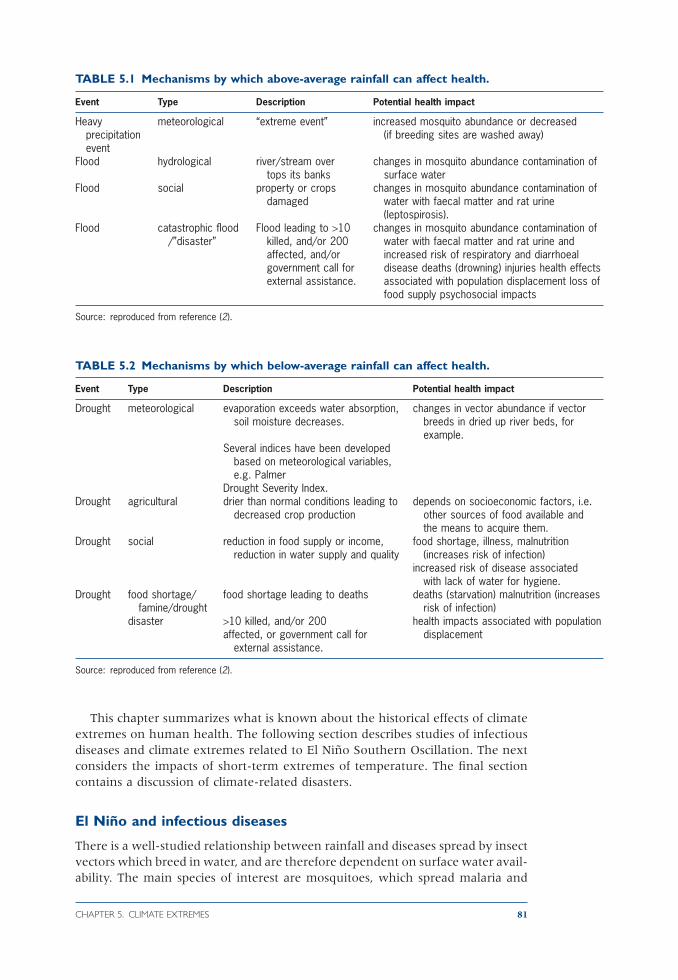
TABLE 5.1 Mechanisms by which above-average rainfall can affect health.
Event Type Description Potential health impact
Heavy meteorological “extreme event” increased mosquito abundance or decreasedprecipitation (if breeding sites are washed away)event
Flood hydrological river/stream over changes in mosquito abundance contamination oftops its banks surface water
Flood social property or crops changes in mosquito abundance contamination ofdamaged water with faecal matter and rat urine
(leptospirosis).Flood catastrophic flood Flood leading to >10 changes in mosquito abundance contamination of
/”disaster” killed, and/or 200 water with faecal matter and rat urine andaffected, and/or increased risk of respiratory and diarrhoealgovernment call for disease deaths (drowning) injuries health effectsexternal assistance. associated with population displacement loss of
food supply psychosocial impacts
Source: reproduced from reference (2).
TABLE 5.2 Mechanisms by which below-average rainfall can affect health.
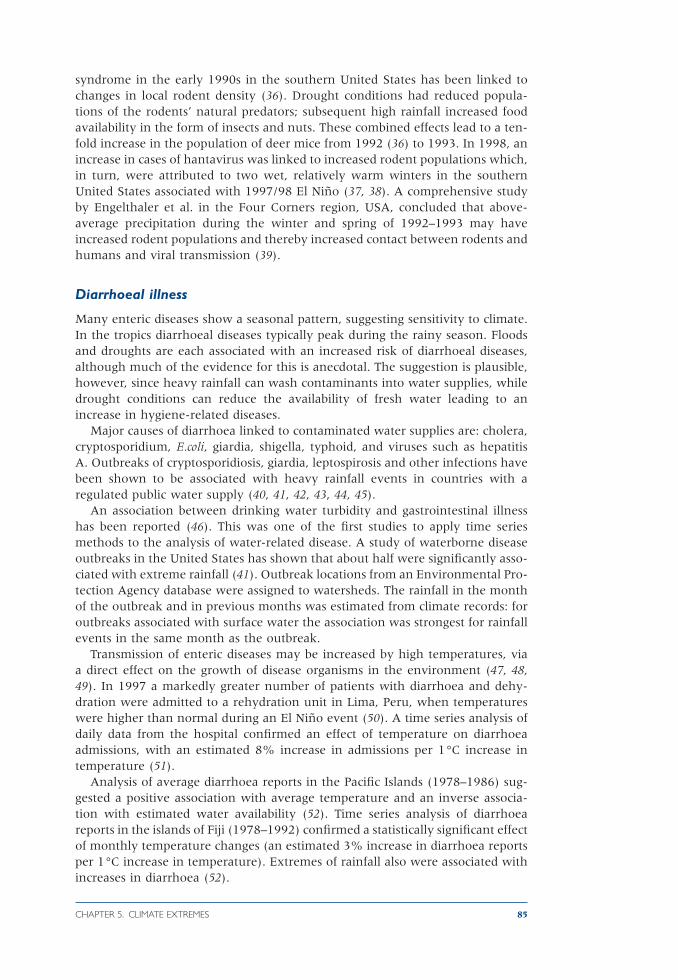
Event Type Description Potential health impact
Drought meteorological evaporation exceeds water absorption, changes in vector abundance if vectorsoil moisture decreases. breeds in dried up river beds, for
example.Several indices have been developed
based on meteorological variables,e.g. Palmer
Drought Severity Index.Drought agricultural drier than normal conditions leading to depends on socioeconomic factors, i.e.
decreased crop production other sources of food available andthe means to acquire them.
Drought social reduction in food supply or income, food shortage, illness, malnutritionreduction in water supply and quality (increases risk of infection)
increased risk of disease associated with lack of water for hygiene.
Drought food shortage/ food shortage leading to deaths deaths (starvation) malnutrition (increases famine/drought risk of infection)
disaster >10 killed, and/or 200 health impacts associated with populationaffected, or government call for displacement
external assistance.
Source: reproduced from reference (2).

viral diseases such as dengue and yellow fever. There is considerable evidencelinking mosquito abundance to rainfall events. Mosquitoes need access to stag-nant water in order to breed—conditions that may be favoured by both wet anddry conditions. For example, heavy rain can create as well as wash away breed-ing sites, while in normally wet regions drought conditions can increase breedingsites by causing stagnation of water in rivers. The timing of rainfall in the year andthe co-variation of other climate factors also are likely to be important.
Vector-borne disease transmission is sensitive to temperature fluctuations also.Increases in temperature reduce the time taken for vector populations to breed.Increases in temperature also decrease the incubation period of the pathogen(e.g. malaria parasite, dengue or yellow fever virus) meaning that vectors becomeinfectious more quickly (5). On the other hand (depending on thresholds thatare species-specific) hot, dry conditions can reduce the lifetime of mosquitoes.Temperature also may affect the behaviour of the vector and human populations,affecting the probability of transmission. Warmer temperatures tend to increasebiting behaviour of the vector and produce smaller adults which may requiremultiple blood meals in order to reproduce.
Malaria
Malaria is the world’s most important vector-borne disease. Over 2.5 billion peopleare at risk, and there are estimated to be 0.5 billion cases and more than 1 milliondeaths from malaria per year (6). Malaria incidence is influenced by the effective-ness of public health infrastructure, insecticide and drug resistance, human popu-lation growth, immunity, travel, land-use change and climate factors.
Very high temperatures are lethal to the mosquito and the parasite. In areaswhere temperatures are close to the physiological tolerance limit of the parasite,a small temperature increase would be lethal to the parasite and malaria trans-mission would therefore decrease. However, at low temperatures a small increasein temperature can greatly increase the risk of malaria transmission (7).
Malaria’s sensitivity to climate is illustrated in desert and highland fringe areaswhere rainfall and temperature, respectively, are critical parameters for diseasetransmission (8). In these regions higher temperatures and/or rainfall associatedwith El Niño may increase transmission of malaria. In areas of unstable malariain developing countries, populations lack protective immunity and are prone toepidemics when weather conditions facilitate transmission. Across the globe,many such areas experience drought or excessive rainfall during ENSO events.
Drought in the previous year has been identified as a factor contributing toincreased malaria mortality. There are several possible reasons for this relation-ship. Drought-related malnutrition may increase an individual’s susceptibility toinfection (9). Also, drought may reduce malaria transmission resulting in a reduc-tion in herd immunity in the human population. Therefore, in the subsequentyear the size of the vulnerable population is increased (10).
Alternatively, a change in ecology of the natural predators may affect mos-quito vector dynamics; mosquito populations recover more quickly than theirpredator populations following a dry year. Famine conditions may have con-tributed to excess mortality during historical epidemics of malaria, for examplefollowing the 1877 El Niño in India. Many deaths occurred after the end of the drought; the proximate cause was malaria when drought-breaking rainsincreased vector abundance, exacerbated by population movement and the concentration of people in feeding camps (11).
82 CLIMATE CHANGE AND HUMAN HEALTH

Many parts of South America show ENSO-related climate anomalies. Seriousepidemics in the northern countries of South America have occurred mainly inthe year after El Niño (year +1). In 1983 following a strong El Niño event,Ecuador, Peru and Bolivia experienced malaria epidemics (12, 13, 14). InVenezuela and Colombia, malaria increased in the post-Niño year (+1) (10, 15,16, 17). A statistically significant relationship was found between El Niño andmalaria epidemics in Colombia, Guyana, Peru, and Venezuela (18). The causalmechanisms are not completely understood. El Niño is associated with a reduc-tion of the normal high rainfall regime in much of Colombia, as well as anincrease in mean temperature, increase in dew point, and decrease in river dis-charges (17). These relationships between malaria and ENSO nevertheless can beused to predict high and low-risk years for malaria, giving sufficient time tomobilise resources to reduce the impact of epidemics (15).
Africa has desert fringe malaria around the Sahara (e.g. the Sudan) and theKalahari (Namibia, Botswana). Of these areas, southern Africa and a region eastof the Sahara show ENSO-related rainfall anomalies. Several recent studies haveexamined evidence of relationships between climate extremes and malaria inAfrica (19, 20, 21).
The 1997/98 El Niño was associated with heavy rainfall and flooding in Kenya,after two years of drought. From January to May 1998, a major epidemic of fal-ciparum malaria occurred. Brown et al. (19) reported an attack rate of approxi-mately 40% in the town of Wajir, Kenya. Three districts in Kenya reported asix-fold increase in malaria cases in the first two months of 1998 compared tothe same period in 1997 (22). The malaria epidemic was compounded by wide-spread food shortages.
Other researchers emphasize the significance of non-climate factors in explain-ing recent malaria epidemiology in Africa (23). A resurgence of malaria in the high-lands of Kenya over the past 20 years has been attributed to resistance toantimalarial drugs (24). Another study did not find a relationship between climatetrends and the timing of malaria epidemics in Kenya. Based on a 30-year timeseries of climate and disease data, it concluded: “. . . intrinsic population dynamicsoffer the most parsimonious explanation for the observed interepidemic periods”(25). One study has reported no significant meteorological trends in four high-altitude sites in East Africa where increases in malaria have been reported (26).This study used spatially averaged climate data that may be unreliable for thispurpose. An association between rainfall, temperatures and the number of inpa-tient malaria cases three to four months later has been reported recently (27).
Dengue
Dengue is the most important arboviral disease of humans, occurring in tropicaland subtropical regions worldwide. In recent decades, dengue has become anincreasing urban health problem in tropical countries. The disease is thought tohave spread mainly as a result of ineffective vector and disease surveillance; inad-equate public health infrastructure; population growth; unplanned and uncon-trolled urbanization; and increased travel (28, 29). The main vector of dengue isthe domesticated mosquito, Aedes aegypti, that breeds in urban environments inartificial containers that hold water. Dengue also can be transmitted by Aedesalbopictus, which can tolerate colder temperatures.
Dengue is seasonal and usually associated with warmer, more humid weather.There is evidence that increased rainfall in many locations can affect the vector
CHAPTER 5. CLIMATE EXTREMES 83

density and transmission potential. ENSO may act indirectly by causing changesin water storage practices brought about by disruption of regular supplies (5).Rainfall may affect the breeding of mosquitoes but this may be less important inurban areas: Aedes aegypti breed in small containers, such as plant pots, whichoften contain water in the absence of rain.
Between 1970 and 1995, the annual number of epidemics of dengue in theSouth Pacific was positively correlated with the Southern Oscillation Index (SOI)(30). This is plausible since, in this part of the world, high positive values of theSOI (denoting La Niña conditions) are associated with much warmer and wetterconditions than the average—ideal for breeding of mosquitoes. In a subsequentstudy, Hales et al. examined the relationship between ENSO and monthly reportsof dengue cases in 14 island nations in the Pacific (31). There were positive cor-relations between SOI and dengue in ten countries. In five of these (AmericanSamoa, Nauru, Tokelau, Wallis and Western Samoa) there were positive corre-lations between SOI and local temperature and/or rainfall. During La Niña, thesefive islands are likely to experience wetter and warmer than normal conditions.Local weather patterns may trigger an increase in transmission in larger, morepopulated islands where the disease is endemic, but infected people then carrythe disease to smaller neighbouring islands. This implies that the effect of climateon vector-borne diseases is not necessarily confined to the region affected byaltered climate, suggesting that forecasts may need to take account of regionalsocial and environmental factors too.
A study of dengue in Viet Nam, found that the number of cases increased inEl Niño years (32). In Thailand, which does not have a strong ENSO signal, therewas no correlation (25). Many countries in Asia experienced an unusually highlevel of dengue and dengue haemorrhagic fever in 1998, some of which may beattributable to El Niño-related weather (5). Gagnon et al. reported positive asso-ciations between El Niño and dengue epidemics in French Guyana, Indonesia,Colombia and Suriname, regions that experience warmer temperatures and lessrainfall during El Niño years (33).
These studies do not identify unequivocally the environmental risk factors forincreases in dengue cases. Further regional or global scale studies are needed todetermine whether El Niño is associated with a change in dengue activity and ifso, what climate parameters (temperature, rainfall, humidity, sea level or windvelocity) primarily are responsible.
Rodent-borne diseases
Rodents act as reservoirs for a number of diseases whether as intermediateinfected hosts or as hosts for arthropod vectors such as ticks. Certain rodent-borne diseases are associated with flooding including leptospirosis, tularaemiaand viral haemorrhagic diseases. Other diseases associated with rodents and ticksinclude plague, Lyme disease, tick borne encephalitis (TBE) and hantavirus pulmonary syndrome (HPS).
Rodent populations have been shown to increase in temperate regions follow-ing mild wet winters (34). One study found that human plague cases in NewMexico occurred more frequently following winter-spring periods with above-average precipitation (35). These conditions may increase food sources for rodentsand promote breeding of flea populations. Ticks also are climate sensitive.
Infection by hantaviruses mainly occurs from inhalation of airborne particlesfrom rodent excreta. The emergence of the disease hantavirus pulmonary
84 CLIMATE CHANGE AND HUMAN HEALTH
syndrome in the early 1990s in the southern United States has been linked tochanges in local rodent density (36). Drought conditions had reduced popula-tions of the rodents’ natural predators; subsequent high rainfall increased foodavailability in the form of insects and nuts. These combined effects lead to a ten-fold increase in the population of deer mice from 1992 (36) to 1993. In 1998, anincrease in cases of hantavirus was linked to increased rodent populations which,in turn, were attributed to two wet, relatively warm winters in the southernUnited States associated with 1997/98 El Niño (37, 38). A comprehensive studyby Engelthaler et al. in the Four Corners region, USA, concluded that above-average precipitation during the winter and spring of 1992–1993 may haveincreased rodent populations and thereby increased contact between rodents andhumans and viral transmission (39).
Diarrhoeal illness
Many enteric diseases show a seasonal pattern, suggesting sensitivity to climate.In the tropics diarrhoeal diseases typically peak during the rainy season. Floodsand droughts are each associated with an increased risk of diarrhoeal diseases,although much of the evidence for this is anecdotal. The suggestion is plausible,however, since heavy rainfall can wash contaminants into water supplies, whiledrought conditions can reduce the availability of fresh water leading to anincrease in hygiene-related diseases.
Major causes of diarrhoea linked to contaminated water supplies are: cholera,cryptosporidium, E.coli, giardia, shigella, typhoid, and viruses such as hepatitis A. Outbreaks of cryptosporidiosis, giardia, leptospirosis and other infections havebeen shown to be associated with heavy rainfall events in countries with a regulated public water supply (40, 41, 42, 43, 44, 45).
An association between drinking water turbidity and gastrointestinal illnesshas been reported (46). This was one of the first studies to apply time seriesmethods to the analysis of water-related disease. A study of waterborne diseaseoutbreaks in the United States has shown that about half were significantly asso-ciated with extreme rainfall (41). Outbreak locations from an Environmental Pro-tection Agency database were assigned to watersheds. The rainfall in the monthof the outbreak and in previous months was estimated from climate records: foroutbreaks associated with surface water the association was strongest for rainfallevents in the same month as the outbreak.
Transmission of enteric diseases may be increased by high temperatures, viaa direct effect on the growth of disease organisms in the environment (47, 48,49). In 1997 a markedly greater number of patients with diarrhoea and dehy-dration were admitted to a rehydration unit in Lima, Peru, when temperatureswere higher than normal during an El Niño event (50). A time series analysis ofdaily data from the hospital confirmed an effect of temperature on diarrhoeaadmissions, with an estimated 8% increase in admissions per 1°C increase intemperature (51).
Analysis of average diarrhoea reports in the Pacific Islands (1978–1986) sug-gested a positive association with average temperature and an inverse associa-tion with estimated water availability (52). Time series analysis of diarrhoeareports in the islands of Fiji (1978–1992) confirmed a statistically significant effectof monthly temperature changes (an estimated 3% increase in diarrhoea reportsper 1°C increase in temperature). Extremes of rainfall also were associated withincreases in diarrhoea (52).
CHAPTER 5. CLIMATE EXTREMES 85

In summary, there is good evidence of associations between several importantcommunicable diseases and climate on several temporal and geographical scales.This is true of vector-borne diseases, many enteric illnesses and certain water-related diseases. These associations are not found everywhere—hardly surpris-ing given the complexity of the causal pathways involved. Relationships betweenyear-to-year variations in climate and communicable diseases are most evidentwhere these climate variations are marked, and in vulnerable populations in poorcountries. Major scientific reviews agree that El Niño can provide a partial ana-logue for the effects of global climate change on communicable diseases (53).However, the Intergovernmental Panel on Climate Change (IPCC) cautions:
“Policymakers should appreciate that although our scientific capacity toforesee and model these various health outcomes of climate change continues toevolve, it is not possible to make precise and localized projections for many healthoutcomes . . .” (3).
Temperature extremes: heatwaves and cold spells
In recent years there has been a great increase in interest in time series studiesof temperature and mortality. These are seen as the most satisfactory method for
86 CLIMATE CHANGE AND HUMAN HEALTH
BOX 5.1 Impact of climate extremes on malaria in Irian Jaya
Beginning in late August 1997, a significant increase of unexplained deaths wasreported from the central highland district of Jayawijaya. The alarming number of fatal-ities rapidly escalated into September, dropping off precipitously by late October. Morethan 550 deaths due to “drought-related” disease had been officially reported fromthe district during this 10-week period. The outbreaks occurred in extremely remoteareas of steep mountainous terrain inhabited by shifting agriculturist populations.
Microscopic evidence and site survey data implicated malaria as the principal cause ofthe excess morbidity and mortality at elevations between approximately 1000 and2200m. The dramatic increase in malaria and associated deaths was related indirectlyto the prolonged and severe drought created by the prevailing 1997–98 El Niño affect-ing the Australasian region.
Clinical cases of malaria were described as severe, due in large part to the low levelof naturally acquired immunity in these highland populations and the predominanceof Plasmodium falciparum infection. Disease may have been further exacerbated by thepopulation’s compromised nutritional status because of drought-related severe short-ages of staple foods. Based on a retrospective investigation, an a posteriori epidemio-logical explanation of the probable interrelated causes of the epidemic is presented:
“Beginning in late July 1997, drought conditions resulted in numerous transientpools of standing water along zones of steep gradient streams normally associatedwith fast-flowing water. This permitted sufficient and rapid increases in vector pop-ulations (Anopheles punctulatus complex) that could sustain recently introduced orintensified local low-level malaria transmission. Moreover, water and food short-ages contributed to increased demographic movement and exposure to high riskmalaria endemic lowlands, thus increasing the prevalence of human infections andinfectious reservoirs in those populations returning to the highlands.”
Source: Based on reference (54)

quantifying the short-term associations between ambient temperatures and dailymortality. Any long-term patterns in the series (e.g. seasonal cycles) are removed.The effect of a hot day is apparent only for a few days in the mortality series; incontrast, a cold day has an effect that lasts up to two weeks. In many temperatecountries mortality rates in winter are 10–25% higher than death rates insummer but the causes of this winter excess are not well understood (61).
It is likely that different mechanisms are involved in heat and cold relatedmortality; cold related mortality in temperate countries is related in part to theoccurrence of seasonal respiratory infections. High temperatures cause somewell-described clinical syndromes such as heatstroke (62). Very few deaths arereported as attributed directly to heat. Exposure to high temperatures increasesblood viscosity and it is plausible that heat stress may trigger a vascular eventsuch as heart attack or stroke (63). Studies have shown that elderly people haveimpaired temperature regulation (62, 64, 65, 66). Physiological studies in theelderly indicate that low temperatures are associated with increased blood pres-sure and fibrinogen levels (67, 68).
The impact of heatwave events on mortality
Heatwaves can kill. In July 1995 a heatwave in Chicago, USA, caused 514 heat-related deaths (12 per 100000 population) and 3300 excess emergency admis-sions (69). The morgues were full and bodies had to be stored in refrigeratedtrucks. From 12 to 20 July, daily temperatures ranged from 34–40°C, with the
CHAPTER 5. CLIMATE EXTREMES 87
BOX 5.2 Cholera
Traditionally cholera is viewed as a strictly faecal–oral infection but increased atten-tion is being paid to the environmental determinants of this disease. The discovery ofa marine reservoir of the cholera pathogen and its long term persistence with variousmarine organisms (in the mucilaginous sheath of blue-green algae and copepods) helpsto explain the endemicity in certain regions, such as the estuaries of the Ganges andBramaputra in Bangladesh (55). Recent work has suggested links between the sea-sonality of cholera epidemics and seasonality of plankton (algal blooms) and the marinefood chain. A study of Vibrio cholerae 01 in Bangladesh (1987–90) found that abun-dance increases with the abundance of copepods (which feed on phytoplankton) incoastal waters (55). Analysis of cholera data from Bangladesh showed that the temporal variability of cholera exhibits an interannual component at the dominant frequency of El Niño (56, 57).
Several cholera outbreaks occurred in 1997 following heavy rains. Countries in EastAfrica were severely affected: major cholera outbreaks occurred in the United Repub-lic of Tanzania, Kenya, Guinea-Bissau, Chad and Somalia (2, 58). Outbreaks also werereported in Peru, Nicaragua and Honduras (59, 60). However, the total number ofcholera cases reported to WHO in 1997, globally and by region, was similar to thatin 1996. Countries that experienced increased cholera incidents in 1997 are at riskof increases in cholera in subsequent years. In 1997, the regional WHO cholera sur-veillance team was aware of the forecasts of an El Niño-related drought in south-eastAfrica.The team was able to institute measures to help reduce the severity of a choleraoutbreak in Mozambique by increased monitoring and heightened preparedness ofhealth care institutions (60).

highest temperatures on 13 July. The maximum number of deaths occurred on15 July (70).
During heatwaves, excess mortality is greatest in the elderly and those withpre-existing illness (71). Much of this excess mortality is due to cardiovascular,cerebrovascular and respiratory disease. The mortality impact of a heatwave isuncertain in terms of the amount of life lost: a proportion of the deaths occur insusceptible persons who were likely to have died in the near future. Neverthe-less, there is a high level of certainty that an increase in the frequency and inten-sity of heatwaves would increase the numbers of additional deaths due to hotweather.
There is no standard international definition of a heatwave. Operational def-initions are needed for meteorological services. As meteorological agencies arebecoming more commercialized they are keen to develop practical applicationsof their forecasts and tailor them to user needs. The Netherlands meteorologicalbureau uses the following definition to trigger advance warnings in the mediaand directly to health services: at least 5 days with maximum temperature above25°C of which at least 3 days with maximum temperature above 30°C. The evi-dence on which this is based is not clear. In the United States, the NationalWeather Service suggest that a heat advisory (early warning) be issued when thedaytime heat index reaches 40.6°C and a night time minimum temperature of26.7°C persists for at least 48 hours (72). Local definitions are used: in Dallas themedical examiners office define a heatwave as three consecutive days of temperatures over 37.8°C.
It is surprisingly difficult to define a heatwave as responses to very high tem-peratures vary between populations and within the same population over time.A 1987 heatwave in Athens resulted in 926 deaths classified as heat-related,although the attributable excess mortality was estimated to be more than 2000(73). A subsequent heatwave in 1988 was associated with a much smaller excessmortality. This has been observed also in Chicago following the 1995 heatwave(74).
Few analyses have looked at the impacts of heatwaves in developing coun-tries and the evidence is largely anecdotal. A heatwave in India in June 1998was estimated to have caused 2600 deaths over 10 weeks of high temperatures(75). In Ores, the temperature rose to 49.5°C and was reported to have caused1300 deaths. The high temperatures were exacerbated by recurrent power failures that affected cooling systems and hospital services in Delhi.
Important behavioural factors may be specific to certain countries: in Japan,young children are often affected when left in motor vehicles. Not all heat relateddeaths are due to weather conditions. For example, in the United States in 1994,221 heat related deaths were recorded, but only 101 (46%) were due to ambientweather conditions. The rest were due to overexertion during exercise, forexample. During the period 1979–1994, heat-related mortality due to weatherconditions was 2.7–3.7 per million population in the four highest reporting states(Arizona, Arkansas, Kansas, and Missouri) (72). Most of these deaths occurredin the over-55 age group. Overall the impact of mortality is underestimatedbecause death rates from other diseases increase during heatwaves. This is truein all populations where it has been investigated.
Rooney et al. estimated the excess mortality associated with the 1995 heat-wave in the United Kingdom (76). An estimated 619 extra deaths (8.9% increase)were observed relative to the expected number of deaths, based on the 31-daymoving average for that period. Excess deaths were apparent in all age groups
88 CLIMATE CHANGE AND HUMAN HEALTH

but most marked in females and for deaths from respiratory and cerebrovascu-lar disease. A heatwave in Belgium in 1994 was associated with excess mortal-ity. Part of the excess was due to mortality displacement, since there was a deficitin deaths in the elderly following the heatwave (no deficit was apparent for agegroup 0–64 years) (77).
Vulnerability to temperature-related mortality
Indicators of vulnerability to heat and cold that have been investigated include:
• age and disease profile• socioeconomic status• housing conditions• prevalence of air conditioning• behaviour (e.g. clothing).
These factors also have counterparts in individuals as risk factors for heat relatedmortality or morbidity, such as presence of air conditioning at time of death.
Both individual and population level studies provide strong and consistent evi-dence that age is a risk factor for heat-related mortality. Studies vary on the ageat which the vulnerability is increased. There are physiological reasons why theelderly are more vulnerable.
An important study was undertaken following the Chicago heatwave in 1995.Semenza et al. interviewed the relatives of those who died during the heatwaveand controls who lived near the case, matched for age and neighbourhood (78).Individual risk factors for dying in the heatwave were identified: chronic illness;confined to bed; unable to care for themselves; isolated; without air condition-ing. A comparison of mortality rates in three Illinois heatwaves (1966) by agegroup, sex and ethnic group (white vs. other) found that women and whitepeople were at more risk (79).
Winter mortality
In many temperate countries there is a clear seasonal variation in mortality (80,81), death rates during winter being 10–25% higher than those in summer. Themajor causes of winter death are cardiovascular, cerebrovascular, circulatory andrespiratory diseases (82, 83).
Annual outbreaks of winter diseases such as influenza, which have a largeeffect on winter mortality rates, are not strongly associated with monthly wintertemperatures (84). Social and behavioural adaptations to cold play an importantrole in preventing winter deaths in high latitude countries. Sensitivity to coldweather (measured as the percentage increase in mortality per 1°C change intemperature) is greater in warmer regions. Mortality increases to a greater extentwith a given fall in temperature in regions with warmer winters, in populationswith less home heating and where people wear lighter clothes (85).
The elderly (aged 75 and over) are particularly vulnerable to winter death,having a winter excess of around 30%. This vulnerability is not yet well under-stood but may arise through a combination of physiological susceptibility, behav-ioural factors and socioeconomic disadvantage. Excess winter mortality is animportant problem in the United Kingdom where there has been much debateabout the role of poor housing, fuel poverty and other socioeconomic issues forthe elderly population (86). Several studies have linked routine mortality data at
CHAPTER 5. CLIMATE EXTREMES 89

ward or enumeration district level with small-area indicators of housing anddeprivation. A study of ischaemic heart disease morbidity in Stockport foundhigher winter excess in the higher social class groups although a clear gradientwas not observed (87). A small-area study found that inadequate home heatingand socioeconomic deprivation were the strongest independent predictors ofward-level variation in excess winter death in England and Wales (88). Ingeneral, however, studies have found only weak or absent relationship betweenexcess winter mortality and deprivation (86).
The potential impact of climate change on temperature related mortality
Global climate change is likely to be accompanied by an increase in the frequencyand intensity of heatwaves, as well as warmer summers and milder winters (2).Extreme summer heat’s impact on human health may be exacerbated byincreases in humidity. There has been significant warming in most regions in thelast 25 years (see chapter 5) some of which the IPCC has attributed to humanactivities. However, it is not clear that the frequency of heatwaves has beenincreasing, although few studies have analysed daily temperature data to confirmthis (1). There is much regional variation in the trends observed. Gaffen and Rosslooked at data from 1961–1990 for 113 weather stations in the United States andfound that the annual frequency of days exceeding a heat stress thresholdincreased at most stations (89).
Predictive modelling studies use climate scenarios to estimate future temper-ature related mortality. Those studies which use the empirical statistical model(based on coefficients derived from linear regression of the temperature mortal-ity relationship) find that reductions in winter deaths are greater than increasesin summer deaths in temperate countries (84, 90). However, other methods indi-cate a more significant increase in summer deaths. Kalkstein and Green estimatedfuture excess mortality under climate change in United States’ cities (91). Excesssummer mortality attributable to climate change, and assuming acclimatization,was estimated to be between 500–1000 for New York and 100–250 for Detroitby 2050, for example.
Populations can be expected to adapt to changes in climate via a range of phys-iological, behavioural and technological changes. These will tend to reduce theimpacts of future increases in heatwaves. The initial physiological acclimatizationto hot environments can occur over a few days but behavioural and technologicalchanges, such as changes to the built environment, may take many years.
While it is well established that summer heatwaves are associated with shortterm increases in mortality, the extent of winter-associated mortality directlyattributable to stressful weather is difficult to determine and currently beingdebated. Limited evidence indicates that, in at least some temperate countries,reduced winter deaths would outnumber increased summer deaths. The netimpact on mortality rates will vary between populations. There are no clearimplications of climate change for non-fatal outcomes as there is a lack of relevant studies.
Natural disasters
The health effects of disasters are difficult to quantify because secondary effectsand delayed consequences are poorly reported and communicated. Information
90 CLIMATE CHANGE AND HUMAN HEALTH

on natural disasters generally is gathered by the organisations and bodies directlyinvolved in disaster relief and reconstruction. As a result, information usually iscollected for specific operational purposes not as a database; figures are estimated,not measured directly (92). This is especially true of flood events and windstormswhere the actual deaths and injuries directly caused by the event are small compared to the problems that arise as a result, including deaths from com-municable diseases and the economic losses sustained (93, 94, 95) (see Box 5.3on Hurricane Mitch).
El Niño has an effect on the total number of persons affected by natural dis-asters (96, 97). Worldwide, disasters triggered by droughts are twice as frequentduring the year after the onset of El Niño than other years (97). This risk is con-centrated in southern Africa and south-east Asia. The El Niño effect on disastersis strong enough to be apparent at the global level (96). In an average El Niñoyear, around 35 per 1000 persons are affected by a natural disaster. This is overfour times greater than the rate in non El Niño years, based on analysis of datafrom 1963 to 1992. This difference in risk is much stronger for famine disasters;El Niño’s global disaster footprint is largely determined by the consequences ofdrought.
In 1997/98 Kenya was particularly hard hit by flooding and excess rainfall.Ecuador and northern Peru experienced severe flooding and mudslides along thecoastal regions which severely damaged the local infrastructure (98). In Peru,9.5% of health facilities were damaged, including 2% of hospitals and 10% ofother health centres (98). At the other extreme, Guyana, Indonesia and PapuaNew Guinea were severely affected by drought. Although not all natural disas-ters in 1997/98 should be attributed to the El Niño event, global estimates of theimpact vary from 21000 (99) to 24000 (100) deaths.
Trends in weather disasters
Globally, there is an increasing trend in natural disaster impacts. An analysis bythe reinsurance company Munich Re found a three-fold increase in the numberof natural catastrophes in the last ten years, compared to the 1960s (94). This is primarily from global trends affecting population vulnerability rather thanchanges in the frequency of climatological triggers.
Developing countries are poorly equipped to deal with weather extremes. Thenumber of people killed, injured or made homeless by natural disasters is increas-ing alarmingly. This is due partly to population growth and the concentration ofpopulation in high-risk areas like coastal zones and cities. Large shanty-townswith flimsy habitations often are located on land subject to frequent flooding. Inmany areas the only land available to poor communities may be that with fewnatural defences against weather extremes. Direct hits of extreme events ontowns and cities tend to cause large losses. In recent decades there has been alarge migration to cities and more than half the world’s population now lives inurban areas. Such migration and increasing vulnerability means that evenwithout increasing numbers of extreme events, losses attributable to each eventwill tend to increase (101).
There are several sources of information but the largest, most used and most reliable is a database created in 1988 with support from the World HealthOrganization and the Belgium Government (EM-DAT). The objective of EM-DAT is:
CHAPTER 5. CLIMATE EXTREMES 91

“. . . to serve the purposes of humanitarian action at national and internationallevels. It is an initiative aimed to rationalise decision-making for disaster prepared-ness, as well as providing an objective base for vulnerability assessment and prior-ity setting” (92).
The Centre for Research on the Epidemiology of Disasters (CRED) records eventswhere at least 10 people were reported killed; 100 people were reported affected;there was a call for international assistance; or declaration of a state of emer-gency. There are increasing trends of economic and insured losses from disasterevents, and economic annual losses have increased ten-fold since the 1950s(102). However, much of the upward trend in economic losses probably is dueto societal shifts and increasing vulnerability to weather and climate extremes(103).
Data for the 1980s and 1990s are shown in Table 5.3. This shows the numbersof events, people killed and people affected by weather-related natural disastersin each decade, by region of the world. Some regions are more severely affectedthan others, although some show a decrease in the number of people killed(Africa and eastern Mediterranean) and the number of people affected (Africa,Americas and south-east Asia).
Reasons for the observed increases include:
• increasing concentration of people and property in urban areas• settlement in exposed or high risk areas (e.g. flood plains, coastal zones)• changes in environmental conditions (e.g. deforestation can increase flood
risk).
There has been an apparent recent increase in the number of disasters but littlechange in the number of people killed (94). In 2000 there were over 400 disas-ters, with 250 million people affected (94). This paradox may be explained bytechnological advances in the construction of buildings and infrastructure alongwith advancements in early warning systems, especially in more developedregions. Although there are pronounced year-to-year fluctuations in thenumbers of deaths due to disasters, a trend towards increased numbers of deathsand numbers of people affected has been observed in recent decades (94).
The health impacts of disasters
Extreme weather events directly cause death and injury and have substantialindirect health impacts. These indirect impacts occur as a result of damage to the
92 CLIMATE CHANGE AND HUMAN HEALTH
TABLE 5.3 Number of events, people killed and affected, by region of the world for the 1980sand 1990s.
Region 1980s 1990s
Events Killed Affected Events Killed Affected
Africa 243 416851 137758905 247 10414 104269095Eastern Europe 66 2019 129345 150 5110 12356266Eastern Mediterranean 94 161632 17808555 139 14391 36095503Latin America & Caribbean 265 11768 54110634 298 59347 30711952South East Asia 242 53853 850496448 286 458002 427413756Western Pacific 375 35523 273089761 381 48337 1199768618Developed 563 10211 2791688 577 5618 40832653Total 1848 691857 1336185336 2078 601219 1851447843
N.B. Regions used in this table correspond to the map of regions used in chapter 7.

local infrastructure, population displacement and ecological change. Direct andindirect impacts can lead to impairment of the public health infrastructure, psy-chological and social effects, and reduced access to health care services (104). Thehealth impacts of natural disasters include (105, 106):
• physical injury;• decreases in nutritional status, especially in children;• increases in respiratory and diarrhoeal diseases due to crowding of sur-
vivors, often with limited shelter and access to potable water;• impacts on mental health which may be long lasting in some cases;• increased risk of water-related and infectious diseases due to disruption of
water supply or sewage systems, population displacement and overcrowding;• release and dissemination of dangerous chemicals from storage sites and
waste disposal sites into flood waters.
FloodsFloods are associated with particular dangers to human populations (107). Imme-diate effects are largely death and injuries from drowning and being swept againsthard objects. Local infrastructure can be affected severely during a natural dis-aster. El Niño related damage may include: flood damage to buildings and equip-ment, including materials and supplies; flood damage to roads and transport;problems with drainage and sewerage; and damage to water supply systems.
During and following both catastrophic and non-catastrophic flooding, thereis a risk to health if the floodwaters become contaminated with human or animalwaste. A study in populations displaced by catastrophic floods in Bangladesh in1988 found that diarrhoea was the most common illness, followed by respira-tory infection. Watery diarrhoea was the most common cause of death for all agegroups under 45 (108). In both rural Bangladesh and Khartoum, Sudan, the pro-portion of severely malnourished children increased after flooding (109, 110). Indeveloped countries, both physical and disease risks from flooding are greatlyreduced by a well maintained flood control and sanitation infrastructure andpublic health measures, such as monitoring and surveillance activities to detectand control outbreaks of infectious disease. However, the recent experience offlooding in Central Europe, in which over 100 people died, showed that floodscan have a major impact on health and welfare in industrialised countries too(111).
CHAPTER 5. CLIMATE EXTREMES 93
TABLE 5.4 Theoretical risk of acquiring communicable diseases, by type of disaster.
Type Person to person Water borne Food borne Vector borne
Earthquake M M M LVolcano M M M LHurricane M H M HTornado L L L LHeatwave L L L LColdwave L L L LFlood M H M HFamine H H M MFire L L L L
H = High.M = Medium.L = Low.Source: Reproduced from reference 106.

Floods also cause psychological morbidity. Following flooding in Bristol, UK,primary care attendance rose by 53% and referrals and admissions to hospitalsmore than doubled (112). Similar psychological effects were found followingfloods in Brisbane, Australia, in 1974 (113). An increase in psychological symptoms and post-traumatic stress disorder, including 50 flood-linked suicides,were reported in the two months following the major floods in Poland in 1997(99).
A number of studies have established a link between dampness in the home,including occasional flooding, with a variety of respiratory symptoms. Forexample, a Canadian study found that flooding was linked significantly to childhood experience of cough, wheeze, asthma, bronchitis, chest illness, upperrespiratory symptoms, eye irritation and non-respiratory symptoms (114).
Windstorms and tropical cyclonesImpoverished and high-density populations in low-lying and environmentallydegraded areas are particularly vulnerable to tropical cyclones, the majority ofdeaths caused by drowning in the storm surge (106, 115).
Bangladesh has experienced some of the most serious impacts of tropicalcyclones this century, due to a combination of meteorological and topographicalconditions and the inherent vulnerability of a low-income, poorly resourced pop-ulation. Improved early warning systems have decreased the impacts in recentyears. However, the experience of Hurricane Mitch demonstrated the destruc-tive power of an extreme event on such a region (116).
DroughtsA drought can be defined as “a period of abnormally dry weather which persistslong enough to produce a serious hydrologic imbalance” (118), or as a “periodof deficiency of moisture in the soil such that there is inadequate water requiredfor plants, animals and human beings” (92). There are four general types ofdrought, all which impact on humans, but in different ways (118):
1. meteorological: measured precipitation is unusually low for a particularregion;
2. agricultural: amount of moisture in the soil is no longer sufficient for cropsunder cultivation;
3. hydrological: surface water and groundwater supplies are below normal;4. socioeconomic: lack of water affects the economic capacity of people to
survive, i.e. affects non-agricultural production.
The health impacts on populations occur primarily on food production. Famineoften occurs when a pre-existing situation of malnutrition worsens: the healthconsequences of drought include diseases resulting from malnutrition (105). Inaddition to adverse environmental conditions political, environmental or eco-nomic crises can trigger a collapse in the food marketing systems. The major foodemergency in Sudan during 1998 illustrates the interrelationship between climatic triggers of famine and conflict.
In times of shortage, water is used for cooking rather than hygiene. Thisincreases the risk of diarrhoeal diseases (due to faecal contamination) and water-washed diseases (trachoma, scabies). Outbreaks of malaria can occur due tochanges in vector breeding sites (119) and malnutrition increases susceptibilityto infection.
94 CLIMATE CHANGE AND HUMAN HEALTH

Forest firesThe direct effects of fires on human health are burns and smoke inhalation. Lossof vegetation on slopes may lead to soil erosion and increased risk of landslides,often exacerbated when an urban population expands into surrounding hilly andwooded areas.
Air pollution is linked to increased mortality and morbidity in susceptiblepersons, and increased risk of hospital and emergency admissions. Assessmentsare being undertaken of the short-term impacts on mortality and morbidity associated with the 1997 El Niño episode. However, such assessments often arelimited by lack of baseline data. WHO has published health guidelines for episodicvegetation fires (120, 121).
Conclusions
The increasing trend in natural disasters partly is due to more complete report-ing, as well as increasing vulnerability of populations. Poverty, population growthand migration are major contributory factors affecting this vulnerability. Partic-
CHAPTER 5. CLIMATE EXTREMES 95
BOX 5.3 Hurricane Mitch
Hurricane Mitch was the worst disaster to strike Central America in the twentieth century (95). Itbegan when a tropical depression, subsequently named Mitch, formed in the southern Caribbean Seaon 21 October 1998. Between 22–26 October, Mitch increased in intensity, developed into a tropi-cal storm and then a Category 5 hurricane (117). Winds of up to 295km per hour struck the coast-lines of Nicaragua, Honduras, El Salvador, Guatemala and Belize, followed by heavy continuous rainfallfor over 5 days (95).
Mitch caused around 9550 deaths; destroyed or affected around 137851 homes; and affected a pop-ulation of around 3174700 people (95, 116). Yet the effects of the tropical storm/hurricane wereworse than these high numbers indicate. This was due to the damage to infrastructure and servicesthat worsened the secondary effects. These secondary effects and additional impacts included (93, 95):
• increase in vectors leading to increased transmission of vector-borne diseases, especially malariaand dengue;
• increases in communicable diseases such as gastrointestinal and respiratory diseases; losses in theproduction sector: Honduras lost over 70% of banana, coffee and pineapple crops;
• set-backs to development plans: in Honduras reported to be 50 years;• set-backs in progress in public health;• set-backs in environmental health caused by flooding of wells and latrines, destruction of water
and sanitation systems and leakage of septic tanks and sewerage systems.
Factors that increased the vulnerability of the population of these countries to the effects of thisnatural disaster include (116).
• increased population pressure;• migration of the population to the more vulnerable areas, such as the low lying coastal areas and
along river banks;• urbanization of the population leading to increased numbers living in poorly constructed houses
with little access to health, water and sanitation services;• marginalisation of the population.
Economic losses were estimated at over US$ 7 billion for the region as a whole (95).

ularly in poor countries, the impacts of major vector-borne diseases and disas-ters can limit or even reverse improvements in social development; even underfavourable conditions recovery from major disasters can take decades.
Quantitative public health forecasts, based on statistical associations betweenclimate variability and health outcomes, will be highly uncertain because futuresocial and economic trends will influence strongly the effects of climate change.It will be possible to carry out qualitative assessments for policy purposes basedon less-than-perfect scientific evidence.
There is the potential to use seasonal forecasts to reduce the burden of disease.At present, seasonal forecasts are of most use in the mitigation of drought, foodshortages and famine disasters, but the relationships described above couldprovide the basis for early warning systems for epidemics. Currently availablepredictive models of climate variability and communicable disease are insufficiently reliable to provide early warning of epidemics. Policy use probablyshould await validation of these models by analysis of prospective epidemic forecasts.
Seasonal forecasting is only part of an early warning system that must incor-porate monitoring and surveillance, as well as adequate response activities. Fore-casts of climate extremes could improve preparedness and reduce adverse effects.Focusing attention on extreme events also may help countries to develop bettermeans of dealing with the longer-term impacts of global climate change.
Conversely, the pressures on the biosphere that drive climate change maycause critical thresholds to be breached, leading to shifts in natural systems that are unforeseen and rapid. Studying historical extremes of climate cannotforewarn on the consequences of such events. Rapid changes in climate during extreme events may be more stressful than slowly developing changesdue to the greenhouse effect. Thus climatic variables that have the greatest influ-ence in the short-term may not be those with the biggest impact in the longerterm.
Adaptive social responses to rapidly occurring periodic extremes of climatemay be less effective in the face of progressive climate shifts. For example,increased food imports might prevent hunger and disease during occasionaldrought, but poor countries are unlikely to be able to afford such measures indef-initely in response to gradual year-by-year drying of continental areas.
Analogue studies of extreme climate events and human health provide impor-tant clues about the interactions between climate, ecosystems and human societies that may be triggered by long-term climate trends. Whilst the short termlocalized effects of simple climate extremes are most readily quantifiable, studiesof complex climate extremes provide important qualitative insights into theserelationships and the factors affecting population vulnerability.
References
1. Easterling, D.R. et al. Climate extremes: observations, modelling and impacts.Science 289: 2068 (2000).
2. Kovats R. El Niño and health. Geneva, Switzerland, World Health Organization1999.
3. Intergovernmental Panel on Climate Change (IPCC) Climate change 2001: IPCCthird assessment report. Geneva, Switzerland, Intergovernmental Panel onClimate Change 2001a.
4. Sachs, J. & Malaney, P. The economic and social burden of malaria. Nature 415:680–686 (2002).
96 CLIMATE CHANGE AND HUMAN HEALTH

5. MacDonald, G. The epidemiology and control of malaria. Oxford, UK, Oxford Uni-versity Press 1957.
6. World Health Organization (WHO). El Niño and its health impacts. Weekly Epidemiological Record 20: 148–152 (1998b).
7. Bradley, D.J. Human tropical diseases in a changing environment. Environmen-tal Change and Human Health. Ciba Foundation Symposium 175: 146–162 (1993).
8. Bouma, M.J. & van der Kaay, H.J. Epidemic malaria in India’s Thar Desert. Lancet373: 132–133 (1995).
9. Gill, C.A. The relationship of malaria and rainfall. Indian Journal of MedicalResearch 7(3): 618–632 (1920).
10. Bouma, M.J. & Dye, C. Cycles of malaria associated with El Niño in Venezuela.Journal of the American Medical Association 278: 1772–1774 (1997).
11. Diaz, H.F. et al. Climate and human health linkages on multiple timescales.Climate and climatic impacts through the last 1000 years. Jones, P.D. et al. Cambridge,UK, Cambridge University Press 2000.
12. Cedeno, J.E. Rainfall and flooding in the Guayas river basin and its effects onthe incidence of malaria 1982–1985. Disasters 10(2): 107–111 (1986).
13. Nicholls, N. ENSO, drought and flooding rain in south-east Asia. In: South-eastAsia’s environment future: the search for sustainability. Brookfield, H. & Byron, Y.Tokyo, Japan, United Nations University Press/Oxford University Press: pp.154–175 1993.
14. Russac, P.A. Epidemiological surveillance: malaria epidemic following the Niñophenomenon. Disasters 10(2): 112–117 (1986).
15. Bouma, M.J. et al. Predicting high-risk years for malaria in Colombia using para-meters of El Niño Southern Oscillation. Tropical Medicine and International Health2(12): 1122–1127 (1997b).
16. Poveda, G. et al. Climate and ENSO variability associated to malaria and denguefever in Colombia. In: El Niño and the Southern Oscillation, multiscale variability andglobal and regional impacts. Diaz, H.F. & Markgraf, F. Cambridge, UK, CambridgeUniversity Press: pp. 183–204 2000.
17. Poveda, G. et al. Coupling between annual and ENSO timescales in the malariaclimate association on Colombia. Environmental Health Perspectives 109(5):307–324 (2001).
18. Gagnon, A. et al. The El Niño Southern Oscillation and malaria epidemics inSouth America. International Journal of Biometeorology 46: 81–89 (2002).
19. Brown, V. et al. Epidemic of malaria in north-eastern Kenya. Lancet 352:1356–1357 (1998).
20. Kilian, A.H. et al. Rainfall patterns, El Niño and malaria in Uganda. Transactionsof the Royal Society of Tropical Medicine and Hygiene 93: 22–23 (1999).
21. Lindblade, K.A. et al. Highland malaria in Uganda: prospective analysis of an epi-demic associated with El Niño. Transactions of the Royal Society of Tropical Medicineand Hygiene 93: 480–487 (1999).
22. Allan, R. et al. MERLIN and malaria epidemic in north-east Kenya. Lancet 351:1966–1967 (1998).
23. Mouchet, J. et al. Evolution of malaria in Africa for the past 40 years: impact ofclimatic and human factors. Journal of the American Mosquito Control Association 14:121–130 (1998).
24. Malakooti, M.A. et al. Re-emergence of epidemic malaria in the highlands ofwestern Kenya. Emerging Infectious Diseases 4(4) (1998).
25. Hay, S.I. et al. Etiology of interepidemic periods of mosquito-borne disease. Proceedings of the National Academy of Sciences 97(16): 9335–9339 (2000).
26. Hay, S.I. et al. Climate change and the resurgence of malaria in the East Africanhighlands. Nature 415: 905–909 (2002).
27. Githeko, A.K. & Ndegwa, W. Predicting malaria epidemics in the Kenyan high-lands using climate data: a tool for decision makers. Global Change and HumanHealth 2: 54–63 (2001).
CHAPTER 5. CLIMATE EXTREMES 97

28. Gubler, D.J. Dengue and dengue hemorrhagic fever: its history and resurgenceas a global public health problem. In: Dengue and dengue hemorrhagic fever. Gubler,D.J. & Kuno, G. New York, USA, CAB International: 1–22 1997.
29. Rigau-Perez, J.G. et al. Dengue and dengue haemorrhagic fever. Lancet 352:971–977 (1998).
30. Hales, S. et al. Dengue fever epidemics in the South Pacific region: driven by ElNiño Southern Oscillation? Lancet 348: 1664–1665 (1996).
31. Hales, S. et al. El Niño and the dynamics of vector-borne disease transmission.Environmental Health Perspectives 107: 99–102 (1999).
32. Lien, T.V. & Ninh, N.H. In: Currents of change: El Niño’s impact on climate and society.Glantz, M.H. Cambridge, UK, Cambridge University Press 1996.
33. Gagnon, A.S. et al. Dengue epidemics and the El Niño Southern Oscillation.Climate Research 19(1): 35–43 (2001).
34. Mills, J.N. et al. Long-term studies of hantavirus reservoir populations in thesouthwestern United States: rationale, potential and methods. Emerging InfectiousDiseases 5: 95–101 (1999).
35. Parmenter, R.R. et al. Incidence of plague associated with increased winter-springprecipitation in New Mexico. American Journal of Tropical Medicine and Hygiene 61:814–821 (1999).
36. Wenzel, R.P. A new hantavirus infection in North America. New England Journalof Medicine 330: 1004–1005 (1994).
37. Hjelle, B. & Glass, G.E. Outbreak of hantavirus infection in the Four Cornersregion of the United States in the wake of the 1997–1998 El Niño-SouthernOscillation. Journal of Infectious Diseases 181(5): 1569–1573 (2000).
38. Rodriguez-Moran, P. et al. Hantavirus infection in the Four Corners region ofUSA in 1998. Lancet 352: 1353–1353 (1998).
39. Engelthaler, D.M. et al. Climatic and environmental patterns associated withhantavirus pulmonary syndrome, Four Corners region, United States. EmergingInfectious Diseases 5: 87–94 (1999).
40. Atherton, F. et al. An outbreak of waterborne cryptosporidiosis associated witha public water supply in the UK. Epidemiology and Infection 115: 123–131 (1995).
41. Curriero, F. et al. The association between extreme precipitation and waterbornedisease outbreaks in the United States, 1948–1994. American Journal of PublicHealth 91(8): 1194–1199 (2001).
42. Kriz, B. et al. Monitorování Epidemiologické Situace V ZaplavenyCh OblastechV Èeské Republice V Roce 1997. [Monitoring the epidemiological situation in flooded areas of the Czech Republic in 1997.] In: Konference DDD ‘98; Kongresové Centrum Lázeòská Kolonáda Podìbrady, 11.–13. Kvìtna 1998 [Proceedings of the Conference DDD ‘98, 11–12th May, 1998, Prodebrady, CzechRepublic.]. Prodebrady, Czech Republic: 19–34 1998.
43. Lisle, J.T. & Rose, J.B. Cryptosporidium contamination of water in the USA andUK: a mini-review. Aqua 44(3): 103–117 (1995).
44. Rose, J.B. et al. Climate and waterborne outbreaks in the US. Journal of the Amer-ican Water Works Association 2000.
45. Rose, J.B. et al. Climate variability and change in the United States: potentialimpacts on water- and food-borne diseases caused by microbiologic agents. Envi-ronmental Health Perspectives 109 Supplement 2: 211–221 (2001).
46. Schwartz, J. & Levin, R. Drinking water turbidity and health. Epidemiology 10:86–89 (1999).
47. Bentham, G. & Langford, I.H. Climate change and the incidence of food poison-ing in England and Wales. International Journal of Biometeorology 39: 81–86 (1995).
48. Bentham, G. & Langford, I.H. Environmental temperatures and the incidence offood poisoning in England and Wales. International Journal of Biometeorology 45(1):22–26 (2001).
98 CLIMATE CHANGE AND HUMAN HEALTH

49. Madico, G. et al. Epidemiology and treatment of cyclospora cayetenanis infec-tion in Peruvian children. Clinical Infectious Diseases 24: 977–981 (1997).
50. Salazar-Lindo, E. et al. El Niño and diarrhoea and dehydration in Lima, Peru.Lancet 350: 1597–1598 (1997).
51. Checkley, W. et al. Effects of El Niño and ambient temperature on hospital admis-sions for diarrhoeal diseases in Peruvian children. Lancet 355(2000).
52. Singh, R.B.K. et al. The influence of climate variation and change on diarrhoealdisease in the Pacific Islands. Environmental Health Perspectives 109: 155–159(2001).
53. Jaenisch, T. & Patz, J. Assessment of associations between climate and infectiousdiseases. Global Change and Human Health 3: 67–72 (2002).
54. Anonymous. El Niño and associated outbreaks of severe malaria in highland pop-ulations in Irian Jaya, Indonesia: a review and epidemiological perspective. South-east Asian Journal of Tropical Medicine & Public Health 30: 608–619 (1999).
55. Colwell, R.R. Global climate and infectious disease: the cholera paradigm. Science274: 2025–2031 (1996).
56. Pascual, M. et al. Cholera dynamics and El Niño Southern Oscillation. Science 289:1766–1767 (2000).
57. Rodo, X. et al. ENSO and cholera: a nonstationary link related to climate change?Proceedings of the national Academy of Sciences 99: 12901–12906.
58. Kovats, S. El Niño and human health. Bulletin of the World Health Organization78(9): 1127–1135 (2000).
59. Franco, A.A. et al. Cholera in Lima, Peru, correlates with prior isolation of Vibriocholerae from the environment. American Journal of Epidemiology 146:1067–1075(1997).
60. World Health Organization. Cholera in 1997. Weekly Epidemiological Record 73:201–208 (1998).
61. Curwen, M. & Devis, T. Winter mortality, temperature and influenza: has therelationship changed in recent years? Population Trends 54: 17–20 (1988).
62. Kilbourne, E.M. Illness due to thermal extremes. In: Public health and preventativemedicine. Last, J.M. & Norwalk, W.R.B. Connecticut, US, Appleton Lang: pp.491–501 1992.
63. Keatinge, W.R. et al. Increased platelet and red cell counts, blood viscosity, andplasma cholesterol levels during heat stress, and mortality from coronary andcerebral thrombosis. American Journal of Medicine 81: 795–800 (1986).
64. Drinkwater, B. & Horvath, S. Heat tolerance and ageing. Medicine and Science inSports and Exercise 11: 49–55 (1979).
65. Mackenbach, J.P. et al. Heat-related mortality among nursing home patients.Lancet 349: 1297–1298 (1997).
66. Vassallo, M. et al. Factors associated with high risk of marginal hyperthermia inelderly patients living in an institution. Postgraduate Medical Journal 71: 213–216(1995).
67. Woodhouse, P.R. et al. Seasonal variation of blood pressure and its relationshipto ambient temperature in an elderly population. Journal of Hypertension 11(11):1267–1274 (1993).
68. Woodhouse, P.R. et al. Seasonal variations of plasma fibrinogen and factor VIIactivity in the elderly: winter infections and death from cardiovascular disease.Lancet 343: 435–439 (1994).
69. Whitman, S. et al. Mortality in Chicago attributed to the July 1995 heatwave.American Journal of Public Health 87(9): 1515–1518 (1997).
70. Dematte, J.E. et al. Near-fatal heat stroke during the 1995 heatwave in Chicago.Annals of Internal Medicine 129: 173–181 (1998).
71. Kilbourne, E.M. Heat waves. In: The public health consequences of disasters. Gregg,M.B. Atlanta, US, US Department of Health and Human Services, Centers forDisease Control: 51–61 1989.
CHAPTER 5. CLIMATE EXTREMES 99

72. Centers for Disease Control and Prevention (CDC). Heat-related deaths–Dallas,Wichita, and Cooke Counties, Texas, and United States, 1996. Journal of the Amer-ican Medical Association 278: 462–463 (1997).
73. Katsouyanni, K. et al. The 1987 Athens heatwave [Letter]. Lancet ii: 573–573(1988).
74. Palecki, M.A. et al. The nature and impacts of the July 1999 heatwave in the midwestern United States: learning from the lessons of 1995. Bulletin of theAmerican Meteorological Society: 1353–1367 (2001).
75. Kumar, S. India’s heatwave and rains result in massive death toll. Lancet 351:1869–1869 (1998).
76. Rooney, C. et al. Excess mortality in England and Wales, and in Greater London,during the 1995 heatwave. Journal of Epidemiology and Community Health 52:482–486 (1998).
77. Sartor, F. et al. Temperature, ambient ozone levels and mortality during summer1994 heatwave in Belgium. Environmental Research 70(2): 105–113 (1995).
78. Semenza, J.C. et al. Heat-related deaths during the July 1995 heatwave inChicago. New England Journal of Medicine 335: 84–90 (1996).
79. Bridger, C.A. & Helfand, L.A. Mortality from heat during July 1966 in Illinois.International Journal of Biometeorology 12: 51–70 (1968).
80. Laake, K. & Sverre, J.M. Winter excess mortality: a comparison between Norwayand England plus Wales. Age Ageing 25: 343–348 (1996).
81. Sakamoto, M.M. Seasonality in human mortality. Tokyo, Japan, University of TokyoPress (1977).
82. Donaldson, G.C. et al. Winter mortality and cold stress in Yekaterinberg, Russia:interview survey. British Medical Journal 316: 514–518 (1998).
83. West, R.R. & Lowe, C.R. Mortality from ischaemic heart disease: inter-town vari-ation and its association with climate in England and Wales. International Journalof Epidemiology 5(2): 195–201 (1976).
84. Langford, I.H. & Bentham, G. The potential effects of climate change on wintermortality in England and Wales. International Journal of Biometeorology 38:141–147 (1995).
85. Donaldson, G.C. et al. Outdoor clothing and its relationship to geography,climate, behaviour and cold related mortality. International Journal of Biometeorol-ogy 45: 45–51 (2001).
86. Mitchell, R. Short days—shorter lives: studying winter mortality to get solutions.International Journal of Epidemiology 30: 1116–1118 (2001).
87. Watkins, S.J. et al. Winter excess morbidity: is it a summer phenomenon? Journalof Public Health Medicine 23(3): 237–241 (2001).
88. Wilkinson, P. et al. Case-control study of hospital admission with asthma in chil-dren aged 5–14 years: relation with road traffic in north-west London. Thorax54(12): 1070–1074 (1999).
89. Gaffen, D.J. & Ross, R.J. Increased summertime heat stress in the US. Nature 396:529–530 (1998).
90. Guest, C. et al. Climate and mortality in Australia: retrospective study,1970–1990, and predicted impacts in five major cities. Climate Research 13: 1–15(1999).
91. Kalkstein, L.S. & Greene, J.S. An evaluation of climate/mortality relationshipsin large US cities and the possible impacts of climate change. Environmental HealthPerspectives 105(1): 84–93 (1997).
92. Office of U.S. Foreign Disaster Assistance (OFDA)/Centre for Research on the Epidemiology of Disasters(CRED). EM-DAT: The International Disaster Database. Brussels, Belgium, Université Catholique de Louvain (2001).http://www.cred.be/emdat/intro.html
93. Glantz, M. & Jamison, D.T. Societal response to Hurricane Mitch and intra-versusintergenerational equity issues: whose norms should apply? Risk Analysis 20(6):869–882 (2000).
100 CLIMATE CHANGE AND HUMAN HEALTH

94. Munich Re Group Topics: Natural Catastrophes 2000 2001.95. Pan American Health Organization (PAHO). Disasters and health in 1998: a report
of the Pan American Health Organization’s Emergency Preparedness and Disaster Relief Coordination Program, PAHO 1999b.
96. Bouma, M.J. et al. Global assessment of El Niño’s disaster burden. Lancet 350:1435–1438 (1997a).
97. Dilley, M. & Heyman, B. ENSO and disaster: droughts, floods, and El Niño/Southern Oscillation warm events. Disasters 19(3): 181–193 (1995).
98. Pan American Health Organization (PAHO). El Niño and its impact on health1998.
99. International Federation of Red Cross and Red Crescent Societies (IFRC). Worlddisasters report. Geneva, Switzerland, International Federation of Red Cross andRed Crescent Societies 1999.
100.National Oceanic and Atmospheric Administration (NOAA). An experiment in theapplication of climate forecasts: NOAA-OGP activities related to the 1997–98 El Niño event.Boulder, US, Office of Global Programs, US Dept of Commerce 1999.
101.Guha-Sapir, D. Rapid assessment of health needs in mass emergencies: reviewof current concepts and methods. World Health Statistics Quarterly 44: 171–181(1991).
102.Intergovernmental Panel on Climate Change (IPCC). Summary for policymakers toclimate change 2001: Synthesis report of the IPCC Third Assessment Report. Geneva, Switzerland, IPCC 2001.
103.Changnon, S.A. et al. Human factors explain the increased losses from weatherand climate extremes. Bulletin of the American Meteorological Society 81(3): 437–442(2000).
104.Greenough, G. et al. The potential impacts of climate variability and change onhealth impacts of extreme weather events in the United States. EnvironmentalHealth Perspectives 109(Supplement 2): 191–198 (2001).
105.McMichael, A.J. et al. Climate change and human health: an assessment preparedby a task group on behalf of the World Health Organization, the World Meteo-rological Organization and the United Nations Environment Programme.Geneva, Switzerland, World Health Organization 1996.
106.Noji, E.N. The public health consequences of disasters. New York, US, Oxford Uni-versity Press 1997.
107.Menne, B. Floods and public health consequences, prevention and control measures.Rome, Italy, World Health Organization European Centre for Environment andHealth (WHO-ECEH) 1999.
108.Siddique, A.K. et al. 1988 floods in Bangladesh: pattern of illness and causes ofdeath. Journal of Diarrhoeal Disease Research 9(4): 310–314 1991.
109.Choudhury, A.Y. & Bhuiya, A. Effects of biosocial variable on changes in nutri-tional status of rural Bangladeshi children, pre- and post-monsoon flooding.Journal of Biosocial Science 25: 351–357 (1993).
110.Woodruff, B.A. et al. Disease surveillance and control after a flood: Khartoum,Sudan, 1988. Disasters 14(2): 151–163 (1990).
111.Red Cross. Death toll rises in central Europe’s epic floods (2002).http://www.redcross.org/news/in/flood/020819europe.html
112.Bennet, G. Bristol floods 1968: controlled survey of effects on health of localcommunity disaster. British Medical Journal 3: 454–458 (1970).
113.Abrahams, M.J. et al. The Brisbane floods, January 1974: their impact on health.Medical Journal of Australia 2: 936–939 (1976).
114.Dales, R.E. et al. Respiratory health effects of home dampness and molds amongCanadian children. American Journal of Epidemiology 134: 196–203 (1991).
115.Alexander, D. Natural disasters. London, UK, UCL Press 1993.116.Pan American Health Organization (PAHO). The devastating path of Hurricane
Mitch in central America. Disasters: preparedness and mitigation in the Americas (Sup-plement 1): S1–S4 (1999a).
CHAPTER 5. CLIMATE EXTREMES 101

117.National Oceanic and Atmospheric Administration (NOAA). Hurricane Mitchspecial coverage, NOAA’s National Environmental Satellite, Data and InformationService (NESDIS) (2002). http://www.osei.noaa.gov/mitch.html.
118.National Oceanic and Atmospheric Administration (NOAA). Droughts. NationalOceanic and Atmospheric Administration 2002.
119.Bouma, M.J. & van der Kaay, H.J. The El Niño Southern Oscillation and the his-toric malaria epidemics on the Indian subcontinent and Sri Lanka: an earlywarning system. Tropical Medicine and International Health 1(1): 86–96 1996.
120.Sastry, N. Forest fires, air pollution and mortality in south-east Asia. Demography39(1): 1–23 (2002).
121.Institute of Environmental Epidemiology (IEE). Health guidelines for vegetation fireevents. Schwela, D.H. et al. eds. Singapore, Singapore: Institute of Environmen-tal Epidemiology 1999.
102 CLIMATE CHANGE AND HUMAN HEALTH