Embed Size (px)
Citation preview

1
Impacts of Volatile Organic Compounds from Compost on Ozone Formation
Peter G. Green, Anuj Kumar, Isabel Faria,Walter Ham and Prof. Mike Kleeman
Dept of Civil & Environmental Engineering,Univ.Calif.Davis,
plus Bob Horowitz, CalRecycle,
and Greg Kester, CASA.
PGGreen @ UCDavis.edu
Funding: CASA, CalRecycle, and previously from StopWaste.org, Composting Businesses, and USDA.

2
My interests and background• Air quality, and also water quality as well
• All areas of Environmental Chemistry:Agriculture, transportation, ecology, clinical, mines…
• Recent VOC-ozone projects -- 7 papers published (plus 2 reports.)– Insecticide solvents and oil pesticides– Dairy and livestock studies: animals, fresh waste, feeds– Green scrap compost, biosolids co-composting
• Finding Solutions – practical, cost-effective, sustainable

Field Team and Apparatus for VOC-to-ozoneSpring 2010, studying VOCs from post-composting over-sized material
3

4
City of Santa RosaBiosolids co-compostingFacilty – lava rock biofilter

One figure to summarize the main conclusion: compost VOCs are generally weak
5

Good ozone vs. bad ozone -- and where does bad ozone come from?
Ozone in the stratosphere (higher than airplanes) is good -- it protects us from the strongest ultraviolet light from the sun
Ozone at ground level hurts our lungs, and comes from reactions between sunlight and 2 pre-cursors:nitrogen oxides (NOx), and volatile organic compounds (VOCs) 6


8

California’s efforts so far:
• Develop an inventory of all VOC and NOx sources
• Large reductions in VOCs from urban sources
• Also reductions in VOCs from non-urban sources
• Reductions in NOx from cars
• New focus on NOx reductions from diesel engines

8-hour average O3, max, South Coast
10

8-hour average ozone, max, SJV
11
12
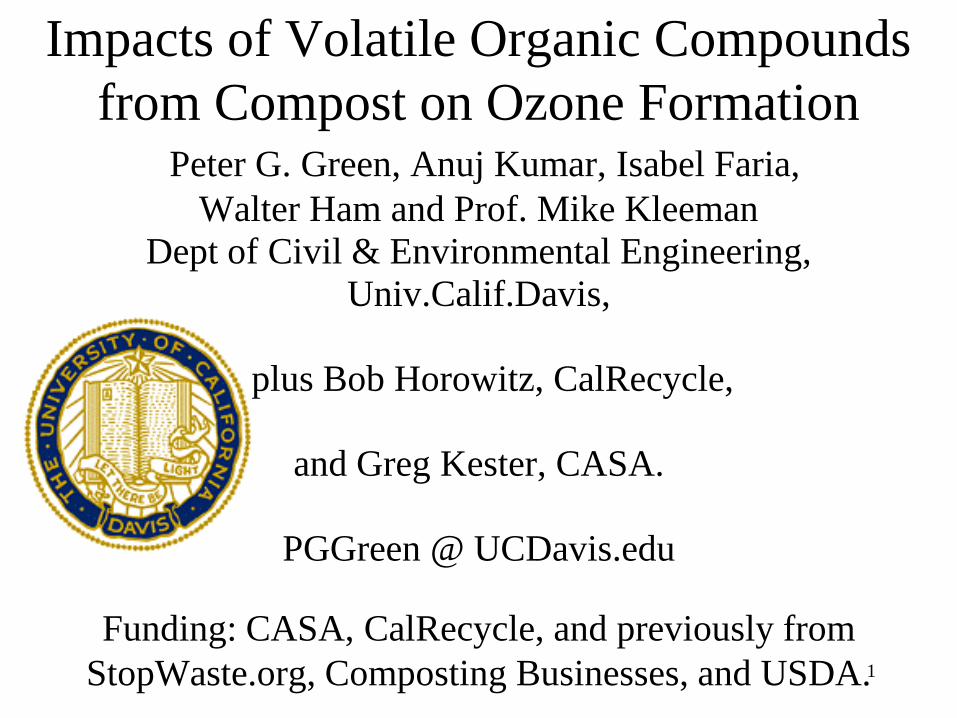
Complexity of ozone formation
• Diverse mixture of VOCs, some unknown• Even with multiple measurement
techniques, there is no ‘total’ VOC• Regulations treat all reactive VOCs equally
on a pound-for-pound basis• (Methane and a few others are exempt.)• However, different VOCs are different
molecules – they react differently• Hence, Ozone Formation Potential

13
Great variation in formation potential (lbs. ozone per lb. VOC) even among similarly volatile molecules
From a regulator: Unfortunately, this may be one issue where the legal system hinders [progress]. We are legally required … the inventory is calculated based on mass not reactivity.
Also considerable variation within a family of VOCs, e.g. alcohols, etc…
Molecule Boiling Point, C MIRacetic acid 118 0.5butyl acetate (n-) 118 0.89octane 126 1.11butanol (n-) 125 3.34octene (1-) 121 3.45toluene 111 3.97xylene (para,ortho,meta) 139 4.2,7.5,10.6
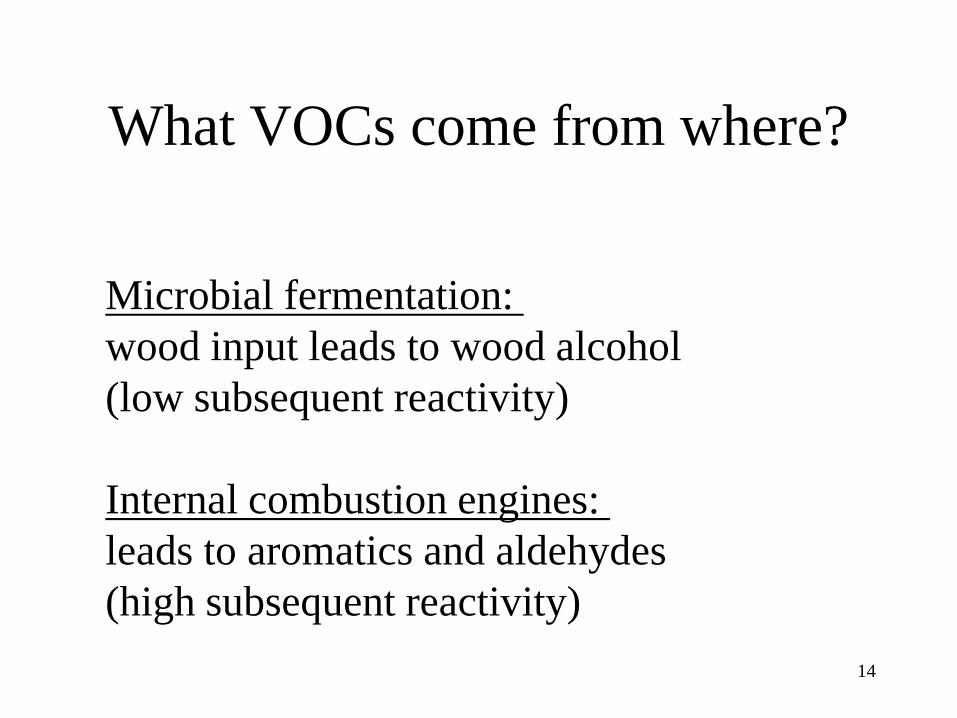
What VOCs come from where?
14
Microbial fermentation: wood input leads to wood alcohol(low subsequent reactivity)
Internal combustion engines: leads to aromatics and aldehydes(high subsequent reactivity)

15

16

17
Mobile Ozone Chamber Assay (MOChA)

We measure VOCs with multiple techniques.We assess the amount of ozone they actually form (over a few hours), directly at the source.Then match with a photo-chemical model calculation – to assert we have successfully accounted for the overall reactivity.
18

VOCsfound from
compost
19

20
Others,15%Alcohols, 85%
Alkenes / Alkynes, 0.9 ± 0.2% Alkanes / Cyclic alkanes, 0.5 ± 0.3%Aromatic Hydrocarbons, 0.3 ± 0.1% Aldehydes, 1.1 ± 0.5%Ketones, 0.3 ± 0.3% Furans, < 0.1%DMDS, < 0.1% Biogenic Hydrocarbons, 5.4 ± 2.2%Acid / Esters / Others 6.3 ± 4.3%
Others, 34%Alcohols, 66%
Alkenes / Alkynes, 3.3 ± 1.1% Alkanes / Cyclic alkanes, 1.9 ± 0.6%Aromatic Hydrocarbons, 1 ± 0.8% Aldehydes, 1.8 ± 1.9%Ketones, 1.2 ± 1.0% Furans, 0.2 ± 0.2%DMDS, 0.1 ± 0.1% Biogenic Hydrocarbons, 10.3 ± 3.8%Acid / Esters / Others 14.6 ± 6.0%
3-6 Days old windrow
2-3 Weeks old windrow

21
0
10
20
30
40
50
60
70
<0.5 0.5 to 1 1 to 2 2 to 4 4 to 8 8 to 16
MIR (g-O3 g-VOC-1)
TVO
C, %
Figure 3. Average contribution of VOC into the ozone formation according to their reactivity. (Urban VOC average is 3.6 to 3.7, depending on latest model revisions.)
From our recently accepted paper in Atmos. Environment.
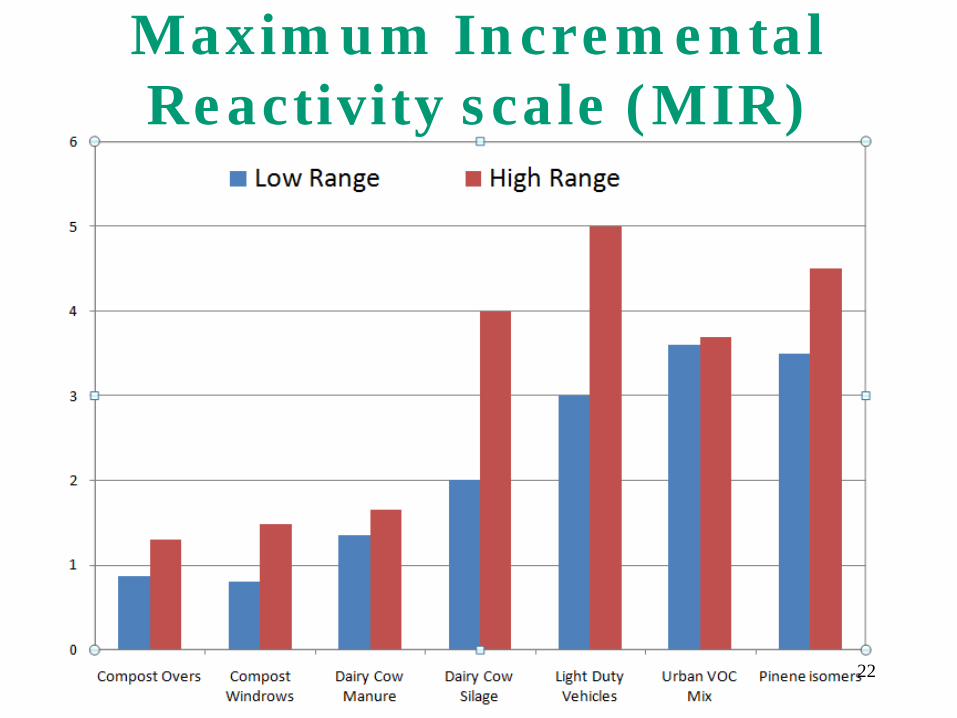
Maximum Incremental Reactivity scale (MIR)
22

Conclusions• Compost VOC emissions are dominated by
low reactivity compounds
• All VOC sources can have a role in improving air quality – however some may be more important to manage for NOx
• The relative value of VOC reductions is higher in urban areas vs. non-urban
• Future regulations (e.g. state implementation plans) will use reactivity more realistically
Additional Results
24
The use of a cap of oversized material (from sievingpreviously finished compost) reduces OFP from VOCsby 25% to 40%.
This could be a cost-effective mitigation, usingotherwise un-sold material (which could go to grinder,or to landfill) and which adds compost microbes andaeration when mixed in during turning.
Biosolids co-composting generally shows similar VOCs, withminor differences not significantly affecting ozone formation.

Thank you, and questions?
pggreen @ ucdavis.edu
25

26
SanJoaquinValleyandLos AngelesCalif.(samescale)

27
Ozone Cycleand the Dependence on NOx and VOC:
Winner, Cass and Harley, Atmos. Env. 1995

28
NOx show a delayed trend/forecast-- and monitoring data suggests may be slower
SJV Summer Emissions Inventory for NOx
0
100
200
300
400
500
600
700
800
900
1000
1975 1985 1995 2005 2015
year
tons
/day Natural
Grand Total

29
Total Reactive Organic Gases (non-exempt VOCs) have actually been quite greatly reduced.
SJV Summer Emissions Inventory for ROG (non-exempt VOC)
0
200
400
600
800
1000
1200
1400
1600
1800
1975 1985 1995 2005 2015
year
tons
/day Natural
Grand Total

Los Angeles VOC inventory-- and forecast

The San Joaquin Valley is different from Los Angeles.
State has authority over stationary sources, not transportation.

San Joaquin Valley NOx emissions inventory, summer season

33
Ground-level ozone improving, but slowly