Embed Size (px)
Citation preview
1
Impact of Hiked Prices of Food and Basic
Commodities on Poverty in Cambodia: Empirical
Evidences from CBMS Five Villages
By
Try Sothearith and So Sovannarith

2
Table of Contents
Page
Executive summary 3
Acknowledgement 5
Acronyms 6
I. Introduction 7
II. Research Methodology 8
2.1 Site Selection 8
2.2 Instrument Design 9
2.3 Enumerators Recruitment 9
2.4 Training Activities 10
2.5 Manual Editing Training 11
2.6 Training of Data Processors 11
2.7 Computer Processing 11
2.8 Analysis and validation of the survey results 11
III. Trend in Prices of Food and Non-Food Items 12
3.1 National Trend in Prices of Food and Non-food Items 12
3.2 Government and Donor Responses to the Rising Prices to
Ensure Food Security and Sustain Growth for Poverty Reduction 13
3.3 Rising Price of Farm Inputs and Farm Productivity 14
3.4 Impacts of Hiked Prices of Food Security 15
3.5 Increased Incomes and Household Food Security 16
IV. Impact on Poverty Reduction at the Village Level 17
V. Household Coping Strategies 19
VI. Conclusion and Policy Implications 20 Annex 1: Change in the returns from rice crops 23
Annex 2: Percentage of source of income by villages, 2008 23
Annex 3: Reasons for Borrowing Money 24
Annex 4: Questionnaire Design 25

3
Executive Summary
The study of impact of hiked prices of food and basic commodities on poverty is designed as
a follow up CBMS survey in 2006 in five villages of Battambang or a Northwest province of
Cambodia. The survey used the original CBMS questionnaires and added a number of
questions concerning the impacts of hiked prices and coping strategies that people used to be
able to cope and retain status quo of their livelihoods and food security. This follow up
survey creates a panel data of 1,132 households surveyed in 2006 and again in 2008. The
CBMS panel data prove to be a powerful and cost effective tool for not only monitoring
poverty but also assessing the impact of hiked prices on poverty, food security and coping
strategies that rural people used in response to hiked prices. In the long run, it also a useful
tool to be able to keep track of community development, growth and the challenges that each
community faces during periods of experiencing hiked prices. It is useful as well for effective
local planning and implementation of national policy for a stronger community to be able to
cope with any unexpected shock and crisis.
The hiked prices in Cambodia and in CBMS sites occurred when there were changes in
demand and prices of patrol, food and other consumer goods at the international market. All
consumer goods in rural area increased at a more alarming rate, by 86 % higher than national
rate (34 %) of inflation the last three year periods. Food and non-food items, on average, were
94 % or 71 % in September 2008 were more expensive than September in 2005. High price
for agricultural produce, however, is often short lived compared to low prices as being
indicated by this micro-study. Despite the price of food consumer items start to decline after
reaching it highest record of annual inflation rate at 37 % in August 2008, it still remains 32
% in November 2008 higher than a year ago.
During the hiked prices, only about 23 % of CBMS households were able to seize
opportunities to increase their income. These people were large landholding farmers, petty
trade and/or money lenders. About 77 % of households including the landless and land poor
who hold one hectare or less were and become net buyers of food were struggling to earn
enough food for household consumption. Some of the affected households had to take their
children out of school to help family cope with food short-shortage or to sustain a business.
Every family member has to work harder to earn enough income to offset increased rate of
food prices. About half of CBMS households reported to take and used loan for food
consumption rather than for productive purpose in the last eight months prior to the survey
period in September 2008. Some have to sell out their productive assets or small plots of land
in order to repay a loan, sustain food needs and relieved on income from selling labour when
they become landless. The rising price has immediately resulted in food insecurity for many
people and push small landholders into indebtedness and deteriorated the capacity of the poor
to cope with any future shocks or crises.
This requires a stronger social safety net programme to support the smaller farmers to remain
in the producer group, poor children to stay in school, and better targeting policy intervention
to support the poor and vulnerable. The social safety net programme can be implemented
more effectively if the capacity of commune council can be further enhanced and
strengthened and empowered to implement national policy.
The higher prices is often viewed as constraints and opportunities to farmers to increase
agricultural intensification and diversification. Lack of saving, ineffective extension services
and imperfect markets are still obstacles to agricultural development. Therefore, small
landholding farmers have been eventually pushed out of producer group since they have not

4
received adequate support. The findings from the CBMS survey support stronger commitment
and timely intervention to support small farmers and the poor. The policy action should
accelerate efforts of rural infrastructure development: road and irrigation facilities,
outreaching effective extension service to support both crops and livestock production. For
landless poor, however, special social safety programme and vocational training should be
reflected in the community development planning and funding.

5
Acknowledgement
The authors are grateful to all the people in three communes under study (Prek Norint,
Samrong Khnong, and Prek Luong communes from Ek Phnom district of Battambang
province) most especially to the heads of villages, commune council members, and
government officials from the provincial Department of Planning. Without their contribution,
this study would not have been possible. We are grateful to IDRC and CBMS International
Network for providing funding support for the project. Many thanks to H.E. Mr. San Sy Than,
The Director General of the National Institute of Statistics for the unending support and
proper motivation given to the team. Finally, many thanks to Dr. Celia Reyes PEP-Co
Director and CBMS Network Leader, for her valuable comments and support.

6
Acronyms
CBMS Community-Based Monitoring System
NIS National Institute of Statistics
PL Poverty Line
CDRI Cambodia Development Resource Institute
CPI Consumer Price Index
ADB Asian Development Bank
MFI Micro-Finance Institution
CSES Cambodia Socio-Economic Survey

7
I. Introduction
Cambodia has strengthened its capacity in order to respond to abnormal inflation of food and
non food prices for the purpose of sustainable growth, securing food security and poverty
reduction. Prices of food and non food items rose gradually since the mid 2000 along with the
rising price of energy, and suddenly increased more rapidly after January 2008 and reached
double digits between May and October 2008. Although the prices of consumer goods show
reversed trends after October 2008, many consumer and productive goods in December 2008
remained higher than one year earlier. This abnormal phenomenon has provoked enormous
policy debates and responses to retain food security and speed of poverty reduction in
Cambodia.
Cambodia is one of the net importing countries in terms of oil and many recorded consumer
goods except rice1. The integration of its economy to international market has enhanced
economic performance and poverty reduction of the country in the last decade or so. Any
change in demands of its produce and prices of important products will unduly affect the
productivity and society as a whole. While the economic and administrative reforms and
infrastructure development are on progress, Cambodia is still behind its neighbouring
countries to curb with any shocks or seize economic opportunities generated by rising prices.
The recent fluctuation in prices has somehow undermined the government efforts of poverty
reduction is obvious through many dimensions. Like other countries the poor landless are
hardly affected. For subsistence site of the effect of hiked prices, about 20 % of rural
population who are landless are characterised as net food buyers. They have to take a variety
of measures such as reducing food consumption and therefore result in poor nutritional intake,
or taking children out of schools or even working harder to earn enough income to buy food
commodities. In addition, 45 % of the Cambodians in the rural areas are land poor, they own
one hectare or less to grow rice for own household consumption (Chan 2008). Rice growers
accounted for dominant agricultural producers in the country. Most of large farm rice
producers did not make any profits from selling their rice since the rising price began after the
harvests and they had already sold out their produces before the time of rising prices between
July 2007 and July 2008. About 30 % of its population or 4 million people who are poor are
strangling to earn meagre income to survive although the wage labour has been doubled or
tripled in many cases and irregular jobs has limited their earning ability. As a result, poor
children are taken off from the school to help earn income for buying food items or since their
parents cannot continue to support their schooling fees2.
This article draws the evidences of rural people’s experiences in response to abnormal
inflation and change in prices of agricultural produce in the five CBMS sites. It is divided
into 7 sections. Section II lays out the research methodology and discussion of why five
CBMS sites were selected for the purpose of the study. Section III discusses trends in prices
of food and non-food items that are commonly consumed by rural dwellers and reflects
government policy responses when the prices rose. Section IV show the impact of rising
prices on poverty reduction at the village level while section V documents coping strategies in
response to the hiked food prices. Section VI is the conclusion and policy implication from
the micro perspectives for more effective and appropriate interventions to curb with the hiked
prices or any upcoming abnormal economic phenomena.
1 http://www.un.org.kh/attachments/060_RisingFoodPrices-UN_DiscussionPaper_June%202008.pdf
2 http://www.caritascambodia.org/document/csostatement.pdf

8
II. Research Methodology
This study was designed to use a survey method in order to generate evidences of both
positive and negative effects of surging prices on rural livelihoods and poverty in five CBMS
sites. In addition, it was also designed to build up on CBMS method and create a panel
household dataset or households that were interviewed in 2006 and again in 2008 for poverty
monitoring and improving local planning in CBMS sites. The evidences from this micro
survey were expected to provide policy recommendations to mitigate the negative effects and
promote the positive ones. The focus was particularly given to household experiences and
poverty in the five CBMS sites. In addition, this is designed to understand coping strategies
that the poor households used in response to hiked prices. Assessment was made to focus on
any possible food shortages in the lean period (May-October 2008) and on existing
interventions to prevent people from falling and deepening into poverty. As for the positive
effects, local farmers and producers were assessed whether they were able to gain any benefits
from the hiked food prices to produce surplus for sale to increase income and improve food
security. Some questions were added to the CBMS questionnaire in 2006 to capture the
changes in the livelihood conditions and constraints for longer term expansion of agricultural
production for both curbing with any unexpected shocks and boosting agricultural and rural
development.
2.1. Site Selection
With financial support from CBMS network, supported by IDRC, the survey was conducted
in three communes of Krattie and Battambang province and six communes of Kompong
Thom province in 2006. All villages and households were included in the survey. For this
survey, Battambang were selected since the province is located in a fast growing and
developing area. It is also known as one of the rice surplus producing provinces in Cambodia.
In addition, Battambang province has experienced more dynamic economic activities and
growth than other two CBMS province. Five villages (Samraong Outrea, Bak Amraek, Svay
Chrum, Reach Dounkeo, and Sdei Leu) under Phase I and II of CBMS site were chosen from
Prek Norint, Samrong Khnong, and Prek Luong Ek Phnom district of Battambang province.
Table 1 shows the number of total panel households and characteristics of each village.
1. Village selection characteristics
Village NHHs Commune Village characteristics
Svay Chrum 216 Prek Norin Close to the market centre, rice farming
and petty trade are main source of
income
Reach Dounkeo 150 Prek Norin Remote village, wet and dry season rice
and fishing
Samraong Outrea 343 Samrong Khnong Good road access and connection to
market, rice farming, fruit trees and petty
trade
Sdei Leu 234 Prek Luong Cash crop and wet rice farming
Bak Amraek 189 Prek Luong Wet and dry season rice farming and
fishing
Total 1132
For this survey, the households interviewed in 2006 were also selected to be interviewed in
September 2008 to create the 1132 panel household data and shaped the main findings that
will shed lights of the discussion in this article.
9
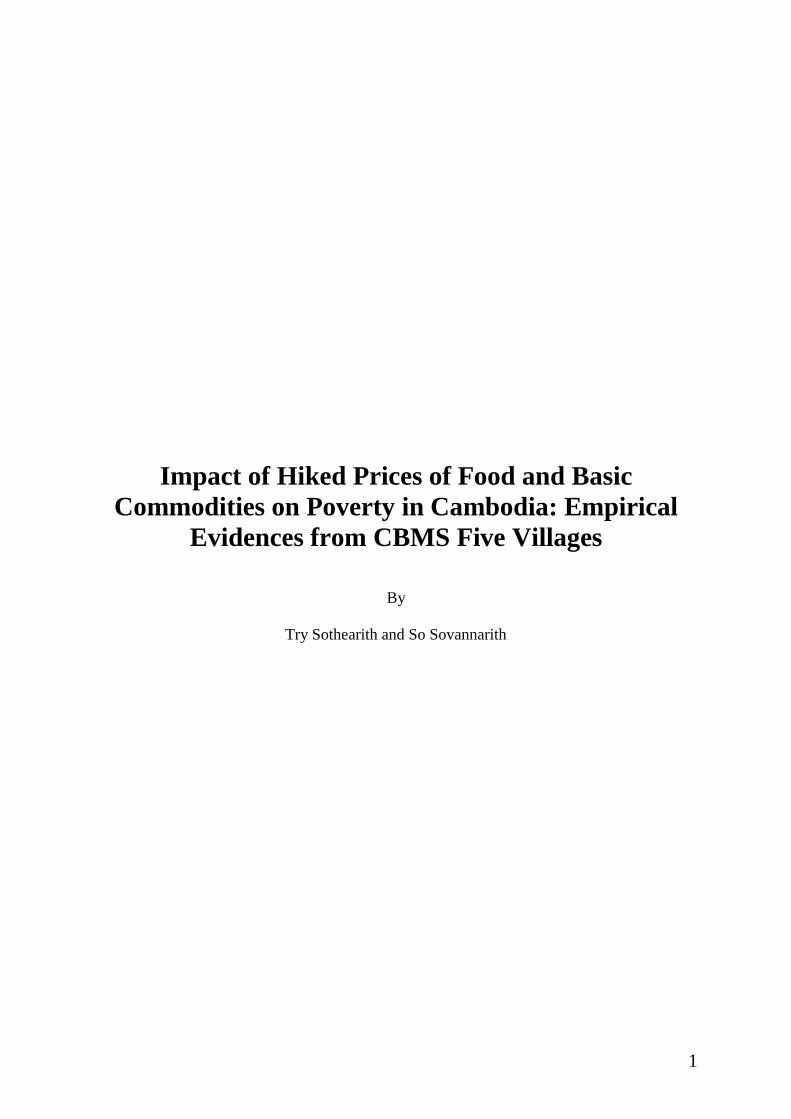
2.2. Instruments Design
The questionnaire(s) were developed and revised based on the last CBMS questionnaire. As
recommended during the CBMS local team meeting, individual information is adopted to be
used in this study. Items such as marital status, age, sex, literacy level, education, access to
school, access to health care, reasons children drop out of school, occupation, child labour, the
question on disabilities and information related prices were added to the questionnaire. To
update the instruments, consultations were made with the advisory team. Pre-testing of the
questionnaires was also done to discover its weaknesses and be the basis for its revision.
Finally, the instruments were adopted to use for data collection to cover the indicators
collected from household. Total 156 indicators focusing on impact of rising prices were
included in the questionnaire.
There are two forms use in this study:
Form A: Household Listing Form is used to record preliminary information of each household
and at the same time, for the purpose of mapping of each household in the village. This tool is
used in conducting household interview(s) (see Annex 1).
Form B: Household Questionnaire is the tool used to collect data from household. Basic
information on the characteristics of each person includes sex, age, relationship to the head of
the household, education and disabilities, etc. The topics of the household questionnaire are
covered Demography, Education, Occupation, Disabilities, Health information, Housing
condition, Energy ( source of light, fuel, etc), Source of drinking water and sanitation,
Household expenditures, Household Income, About crises or household disadvantages,
Household property, Feeding animal, Agricultural land, Violence, and Security and Order,
Mortality, Food, transportation, credit access, employment, recreation and present status of
well-being (see Annex 2).
Other Forms:
- House Sticker (see Annex 5)
- Control form for supervisor (see Annex 6)
- Summation Sheet of Daily Supervision for commune councillor (see Annex 7)
- Daily report form for enumerator (see Annex 8), and
- Age conversion (see Annex 9, Khmer Version)
2.3. Enumerators recruitment
Schoolteachers were employed as enumerators in the project. Usually,
schoolteachers were employed to conduct the population census and to
administer the general election in Cambodia as well. The schoolteachers would
105 indicators:
Quantitative CBMS panel, 2006
and 2008
51 indicators
(people‘s perception): Changes in 8 month
period
Demography, housing and amenities,
education, health, employment and
occupation, income and expenditure,
assets, land ownership and
productivity, shocks/crises, domestic
violent and security.
Food, transportation, credit access,
employment, recreation and present status of
well-being

10
be hired for this purpose for one month. The timing to hire schoolteachers is
good for this CBPMS survey since it coincides with the school year break.
Partially, members of the Village Development Committee, which have become
part of the voluntary Commune Planning and Budgeting Committee, have been
recruited jointly by the commune councils and the Supervisory Team. They
were later trained to become enumerators. Those with a good command of
quantitative skills will also be trained to be data processor(s).
The village chief was not considered for any substantial role in the survey. Village chief has a
lot to offer and could play a helpful role without acting as interviewer. As in phase II, the
village chiefs assisted the enumerators with regards geographical locations, mapping and
arrangement of appointments with the households. Commune councillors act as supervisors,
field editors and did manual data processing and analysis as well.
2.4. Training Activities
Field Operation Training (supervisors and Enumerators)
Training on data collection was conducted for a total of 30 trainees including village chiefs
and commune councillor(s). The training took three (3) days including one extra day for pre-
testing of the questionaire. It was found that the school teachers absorbed instructions more
quickly than the non-teachers. Former enumerators in CBMS phase II were found to
understand quickly.
At the third day of the training, the participants were requested to interview each other using
the household questionnaire. The respondent acted as a head of household and was made to
answer all the questions as read by the interviewer and then vice versa. The exercises using
the questionnaires were collected and corrected by lecturers (supervisory members).
Feedbacks were received after each exercise and were discussed during the lecture time. The
exercises were done in all of the training sessions of data collection.
Pre-tests
Pre-testing of the system instruments was adopted. The trainees spent one day for pre-testing.
Each enumerator was requested to interview at least two households, one small and one large,
to experience different sizes of households. The pre-testing was aimed to get feedback from
the enumerators and possibly rectify any unclear questions or omit questions that are not
applicable. During the pre-testing, supervisors and supervisory members visited and observed
every enumerator while interviewing the household.
After each session of data collection training, a pre-testing training was conducted to test the
trainees on the following capabilities: 1) absorption, 2) strength capacity of field supervisors,
3) ability to encode for enumerators and 4) accuracy in checking for local supervisors. After
each pre-testing session, feedbacks were discussed, adjustments and recommendations were
made.
The pre-testing of the questionnaire was to the advantage of the actual census. The
questionnaire became error-free and more accurate. The enumerators and supervisors became

11
well versed in interviewing, encoding and checking for errors. Problems and constraints
encountered during the pre-testing were easily solved since it was discussed in the presence of
advisory team.
2.5. Manual Editing Training
Manual coding training was conducted for commune councillors who were involved in the
project. Interviewed questionnaires were checked, verified and the answers were coded by the
trained commune council members. These commune council members are supervised by the
district and provincial CBMS team members and after manual coding is accomplished, the
questionnaires are then submitted to the provincial leader for computer machine processing.
Manual editing tools have been developed. Manual editing is divided into three parts: (i) the
enumerators check all questions and answers for every interview questionnaire in their
village, (ii) data was checked by the commune councillors (supervisor during data collection)
in their commune by using the instruction manual for editing data, and (iii) although the field
supervisors had checked the questionnaires, preliminary checking were carried out at the
districts by the district and the provincial CBMS team member before the questionnaires were
accepted. All completed and checked questionnaires are sent to the NIS for machine
processing (data entry, analysis and results). The instruction manual for manual editing and
coding is in Khmer language. All the data and results will be sent to the CBMS network after
it is translated into English.
2.6. Training of data processors
At the NIS, the team selected and trained 10 statistics officials to perform computerised data
entry. An application frame in SPSS was developed and installed for them. It was useful to
have involved the statistics officials in this job. Some of them already had experience in data
entry. However, there were not enough computers with the capacity to install the SPSS
program and thus we had to use Excel instead.
2.7. Computer processing
After manual data cleaning, data entry is done at NIS. Before entering data, the CBMS team
members at the NIS have to undergo training of SPSS software program which includes data
entry, data cleaning and analysis. The CBMS supervisory team members from the central
office supervised the data entry and data cleaning. In cases where there are errors the
concerned enumerator were requested to re-interview the said household. Errors were mostly
related to household income, expenditure and assets.
The input documents were derived from the CBMS questionnaires and the data entry system
was designed to input data of each type of questionnaire separately. The household
questionnaire (Form B) were created separately in two parts (i) individual data file called
individual file (File A), and (ii) household data file (File B). The listing Form (Form A) and
the household questionnaire (Form B) were used to create separate files for each village.
2.8. Analysis and validation of the survey results
The most challenging effort here was to determine the poverty line for each commune and the
proportion of poor households in the village and commune. This was done on the basis of
consumption expenditure per capita, in line with the adopted national definition. The Poverty
Line (PL) defines as follow:

12
– Using national rural poverty line in 2004 as a base to generate PL for 2006 and 2008.
– Adjusted with rural inflation based on CDRI/NIS rural price survey of 106 items, 2005
- 2008.
– PL: 1,753 riels in 2004 as base:
• PL 2006= 2,079 riels (1,753 riels adjusted with 18.59 % inflation between 2004 and
2006)
• PL 2006= 2,427 riels (1,753 riels adjusted with 38 % inflation between 2004 and
2008)
• Movement in and out of poverty of panel households between 2006 and 2008
III. Trends in Prices of Food and Non-Food Items
3.1. National Trends in Prices of Food and Non-Food Items
The consumer prices in Cambodia somewhat remained stable between 2000 and 2003;
however, prices increased since mid-2004 and reached the highest record in the period of May
and October 2008. Although the price of food consumer items start to decline after reaching
its highest record of annual inflation rate at 37 % in August 2008, it still remains 32 % in
November 2008 higher than one year ago. The key concerns about food security and poverty
reduction in Cambodia is about the hiked prices of stable food, especially rice. The official
statistics show price of rice become more stable or showing a decline trends. However,
average price of rice in November 2008 is 2,780 Riels per kilogram or still 77 % higher than
one year ago while price of meats such as pork, beef and chicken remain 17 % more
expensive.
The official rural CPI is still not available from the Ministry of Planning. Therefore, for the
purpose of this study, the author have to use the changes in prices from CDRI price surveys of
106 food and non food items conducted in a number of village and district/provincial markets
in October 2005 and again in March and September 2008. The survey suggests price of all
food and non food consumer items in rural were much higher than the national rate of price
increase that released by the government. All consumer goods in rural area increased by 86 %
that indicates even more at alarming rate than only 34 % reported by the official CPI in
Phnom Penh in the last three year periods. The price gaps between urban and rural area may
be due to high transaction and transportation cost of goods and services since the
infrastructure development is on progress. Food and non-food items, on average, were 94 %
or 71 % in September 2008 higher than that in same referent month in 2005; or further
increased by 13 % for food and 30 % for non food consumer items in rural area.
Figure 1 shows the changes in prices of selected agriculture commodities in Cambodia since
the mid-2005 along with rising price of oil, and the increases in demand for cereal and oil
crops at the international markets (FAO June 2008). High price events, like low price events,
are not rare incidence in agricultural markets and farmers in Cambodia. High prices are often
short lived compared with low prices, which persist for longer periods. What distinguishes the
current situation of agricultural markets is the concurrence of the hiked price for Cambodia
farmers of not just a selected few, but nearly all major food and other necessary commodities
and the possibility that the prices may continue to remain high after the effects of short-term
shocks dissolve.
Causes of recent rising prices is mostly driven by changes in demand and prices of food and
oil at international markets where the concerns about food security and poverty reduction

13
should be focused on short, medium and long term impacts. The prices of food and other
necessary commodities historically highly volatised and started to rise along with rising oil
price since 20033. The upward trend continued and reached double digits between 2007 and
2008 in most development countries, (ADB, April 2008). Initial causes of the late 2006 price
spikes included unseasonable droughts in grain producing nations and rising oil prices. Oil
prices further increased the costs of fertilizers, food transport, and industrial agriculture. Other
causes were due to the increasing use of bio-fuels in developed countries to substitute the
need for fossil oil and an increasing demand for a more varied diet (especially meat) across
the expanding middle-class populations of Asia. These factors coupled with falling world
food stockpiles all contributed to the dramatic worldwide rise in food prices. Short and
medium causes and impacts on poverty reduction in developing countries remain a topic of
debate of poverty reduction, inequality and growth in developing countries. These may
include structural changes in trade and agricultural production, agricultural price supports and
subsidies in developed nations, diversions of food commodities to high input foods and fuel,
commodity market speculation, and climate change.
Figure 1: Price of Selected Agricultural Products, 2000-November 2008
(CPI, NIS, Ministry of Planing)
-
5,000
10,000
15,000
20,000
25,000
Jan
-00
Jan
-01
Jan
-02
Jan
-03
Jan
-04
Jan
-05
Jan
-06
Jan
-07
Jan
-08
Rei
ls
Rice
Prok
Beaf No. 1
Dressed
chicken
No1Fish
Vetables &
Fruit
Gasoline
Diesel fuel
3.2. Government and Donor Responses to the Rising Prices to Ensure Food Security and
Sustain Growth for Poverty Reduction
The Government and donors in Cambodia have been working together to set up the
immediate policy in response to food crises and sustainable growth for poverty reduction. The
3 Andrew Bounds (2007-09-10). "OECD Warns Against Biofuels Subsidies". Financial Times”

14
policy measures include (1) Government and ADB fund of 3.5 million USD for food security
and (2) government temporary action to prohibit the export of paddy rice in order to increase
internal stocks and sell paddy rice for cheap price to the poor before the national election in
2008. In order to secure employment and labour migration support, the government decided to
issue passport to Cambodian cross-border migrants free of charge; and to encourage the
Recruitment Company to pay the visa fee for the migrants in credit in the late 2008. In
addition, the poor can also benefit from health equity fund to improve health access for the
poor that came into effect in 2007. The agricultural producers can also take advantage of the
government’s subsidy on advanced farming practice and productivity. The government has
also come up with its import policy of agricultural machinery and commitment to further
boost agricultural growth through infrastructure development and development strategies.
3.3. Rising Price of Farm Inputs and Farm Productivity
The price of farm inputs including fuels/transport, fertilisers and wage labour also increased at
an alarming rate. For example in May 2008, the gasoline and diesel prices increased by 50 %
and 80 %, respectively one year go. At the same time, the prices of fertilisers and wage labour
also increased by 80-200 % and 50 % respectively. This increased prices of farm inputs
pushed up the production cost by 30 % for dry season rice, by 70 % for wet season rice and
by 45 % for maize, cassava and soybean production between May 2007 and May 20084. The
increased cost of farm inputs and inadequate irrigation were cited as limiting factors to
agricultural intensification and diversification in the CBMS sites.
Table 2 shows the yield of rice harvested by landholding groups in each study villages in the
crop calendar of 2007-2008. On average, farmers in the CBMS villages produced around
2,380 kilograms of paddy rice per hectare. This yield was higher than national average of rice
(1,889 kilograms per hectare) for wet season rice. In contrast for the dry season rice, the yield
obtained by CBMS farmers was lower than that of the national average yield of 3,684
kilograms per hectare in the same harvest season of 2008. While most of CBMS villages
obtained good harvest due to good weather condition, Samraong Outrea experienced the
lowest yield of paddy rice. About 68 % and 22 % of farming households in Samraong Outrea
respectively reported lower and same returns from their farming although there was good rain
(Annex 1) while remarkably smaller proportion of farming households in the other village
experienced decline or no change in the yield of paddy rice that they obtained in the same
harvesting periods.
Only large landholding farmers, traders and dry-season rice growers are able to grasp benefits
from the opportunities generated by rising food prices (CDRI 2008, and Fitzgerald and SO.,
2007). In CBMS sites, only 11 % of farming households who are dry season rice growers
could have gained from rising prices of paddy rice through selling some of their harvest.
Therefore, large majority of farmers who were wet season rice growers did not make any gain
or if any, only meagre marginal profits from their farming as an implication of high
production cost. Small landholding farmers were more productive than large landholding
farmers in terms of the amount of paddy rice harvested per hectare (Table 2). However, only
20 % of small farmers who cultivated one hectare or less of rice land compared to 47 % of
large landholding farmers reported to obtain better returns from their rice farming than one
year ago due to rising price and demand for their paddy rice.
4 Sources: Quoted from Chan Sophal and Phim Runsinarith’s Presentation at CDRI, 12 August 2008

15
About half of small farmers could not afford the hiked prices of farm inputs to increase farm
productivity; and received no change in the yield of paddy rice and lower net profits from
their rice farming (figure 2). While increasing demand and rising prices of agricultural
produces opened up economic opportunities for many farmers in other areas of the country
(Chan 2008) to produce surplus for sale, such opportunities were not cited by the village
leaders and panel households in CBMS sites. Large majority of wet season rice, in contrast to
dry season rice growers received no gains from the rising price of the paddy rice since most of
them had to sell their produces immediately after harvest or before the price of rice started to
rise in February 2008.
The common constrains to agricultural growth and development in CBMS sites as well as
Cambodian farmers in response to the global phenomena of rising prices are the unpredictable
changes in prices of agricultural produces and farm inputs. High (good) prices and demands
for farm produce are often short-lived while the increasing prices of farm inputs persist for a
longer period. It is unsurprising since most farm inputs are imported from the neighbouring
countries that need to be adjusted due to the
rising prices of fuels and transportation. In
addition, farmers often lack savings and,
therefore, have to take loan either from the
micro credit institution (MFI) or from the
private moneylenders or traders to invest in
their farming. The service of MFI, with
affordable interest rate (3 % per month), is still
on progress and providing limited amount of
loan to farmers. Therefore, many farmers in
CBMS sites buy farm inputs on credit or take
loan with 10-15 % interest rate per month and promise to sell the paddy rice after harvest to
their private credit providers, who in most cases are traders or merchants. In such cases, many
small landholding farmers who often cannot afford increased production expenditure or just
make very marginal gains from their production find it not worthy and those who have
decided to sell out the small plots of their lands are evicted from the producer groups (Table
3).
3.4. Impacts of Hiked Prices of Food Security
In CBMS sites, about 56 % of the total 1,132 panel households were farmers. The rest of
households (44 %) who are landless get their livelihood from off-farm income activities.
Almost half (60 %) of rice producing households, who are cultivated one hectare or less of
land, produced rice only enough for maximum of 4-6 months a year. Therefore, they also
become the net buyers of rice especially between May and October 2008. Only about 21 % of
Table 2: Rice Yield of Landholding Groups by Village, 2008
Village <0.5 ha
0.5-
0.99 ha
1-1.99
ha
2-2.99
ha >3 ha Total
Svay Chrum
3,425
2,300
2,122
1,379
1,273
2,509
Reach
Dounkeo
4,201
1,754
2,092
1,812
1,638
2,610 Samraong
Outrea
2,291
1,801
1,623
1,918
1,686
1,967
Sdei Leu
3,598
2,056
1,711
1,700
1,471
2,565
Bak Amreak
3,172
1,555
1,694
1,750
1,687
2,455
Total
3,181
1,914
1,828
1,730
1,515
2,380
Table 3: Percentage of households with no
agricultural land
Village 2006 2008 % change
Svay Chrum 45 47 2
Reach Dounkeo 33 39 6
Samraong Outrea 45 50 5
Sdei Leu 35 38 3
Bak Amreak 44 40 -4
Total 41 44 3
Figure 2: Changes in Rice Inco me
byLlandho lding Ho us eho lds Co mpared to The
P rio us Cro pping Calenda in 2006-2007
(% o f 448 res po dent ho us eho lds )
20
19
31
47
47
29
51
49
40
31
33
44
29
32
29
22
20
28
0% 20% 40% 60% 80% 100%
<0.5 ha
0.5-0.99 ha
1-1.99 ha
2-2.99 ha
>3 ha
To ta l
Increas ed Decreas ed Same

16
rice farmers produced enough rice for their household consumption; and another 19 % of rice
farmers produced surplus rice for sale with high prices (Table 4).
Nonetheless, about 77 % of the households in CBMS villages including landless households
(44 %) and small farmers (33%) who are cultivating less than one hectare and could not
produce enough rice for consumption were the net buyers of rice between May and October
2008. This net buyer group were the ones who were more likely affected by rising prices of
food and other necessary consumer items.
Table 4: Average yield and total production by size of
landholding households
landholding
size NHH
%
HH
Yield
(Kg/ha)
Total Production
(Kgs/hh)
<0.5 ha 272 43 3,181 820
0.5-0.99 ha 104 16 1,914 1,408
1-1.99 ha 136 21 1,828 2,195
2-2.99 ha 59 9 1,730 3,733
>3 ha 65 10 1,515 7,199
Total 636 100 2,380 2,132
3.5. Increased Incomes and Household Food Security
According to CBMS panel data, food expenditure or consumption accounts for about 63 % of
total household expenditure in 2008 which declined from the 73 % of total household
expenditure in 2006. This figure tends to suggest general well-being improvement of people
in CBMS villages. The proportion of food and non food expenditure changes when
households have better income. According to national survey of the impact of rising prices on
food security conducted by CDRI in the mid 2008, an increase of about 47 % of income is
enough to offset the rising rates of food prices between 2007 and 2008. Figure 3 shows the
real per capita income (CPI) of CBMS panel households by landholding groups and the CPI
changes between 2006 and 2008.
Figure 3: Real Per Capita Income and Percentage Changes, 2006-08
1,9
18
1,5
98
2,0
68
1,8
48
1,6
23
1,8
63
1,8
28
3,5
85
3,4
97
4,4
70
4,6
34
5,2
62
9,3
42
4,1
89
119%
224%
401%
129%
151%
116%87%
-
1,000
2,000
3,000
4,000
5,000
6,000
7,000
8,000
9,000
10,000
Landless <0.5 ha 0.5-0.99 ha 1-1.99 ha 2-2.99 ha >3 ha Total
Rie
ls
0%
50%
100%
150%
200%
250%
300%
350%
400%
450%
2006 2008 % change
About 23 % percent of CBMS households
that have annual income growth over 50 %
or more than the need for offsetting the
increased rate of food prices

17
All landholding groups have had dramatically increase in their CPI over 2006 and 2008.
Nonetheless, only about 23 percent of CBMS households with more than one hectare of land
have enjoyed an average annual growth of CPI over than 50 % a year. The landless and land
poor, owning one hectare or less have experienced lower annual growth rate of CPI in a range
of 29 % to 40 % or lower than the level that is enough to offset the rate of increase food prices
(Figure 3).
The respondents were
also asked whether they
have earned enough to
meet the need of
household expenditure;
and whether they have
ever faced any food
shortage in the last 8
month prior to the survey
period in September
2008. The answers are
summarised by
landholding group in
Table 5. The responses
are again confirmed that
the increased income of landless and small landholder is not sufficient to offset the rising rate
of food prices over the last 8 months prior to the time of the survey. The rising food prices
pushed 33 % of CBMS households into food insecurity. The larger proportions of landless
and small landholding accounted for about 41 % and approximately 30 % respectively, have
faced the food shortage since most of them rely heavily on unreliable income from selling
labour (Annex 2).
IV. Impact on Poverty Reduction at the Village Level
While hiked prices between late 2007 and October 2008 have affected every angle of life, the
poor are the hardest hit group since majority of them are either classified as landless or land
poor group who owned one hectare of land or less with limited ability to earn income enough
to offset the increased rates of food prices. There is no official poverty data available in 2008.
The CSES 2004, however, shows that 27 % of households in Battambang were considered
poor in 2004. With one percent rate of poverty reduction (World Bank 2006), the poor
households should reduce from 27 % in 2004 to somewhat around 23 % in 2008. About
42,775 poor households or a total of about 269,217 populations in this province are poor.
They are more likely to get negative effects by rising prices between January and October
2008.
Table 6 shows the proportion and changes in poor households of the five CBMS villages
between 2006 and 2008. CBMS villages have experienced 15 %, on the average, of poverty
reduction over this three year period. With regard to poverty reduction, CBMS villages have
different experiences. Four out of five study villages, nonetheless, have experienced poverty
reduction, by 4 % in Reach Dounkeo, 27 % in Samraong Outrea while Svay Chrum has
experienced poverty increase by 16 % (Table 6). In 2008, about 43 % of the total households
in CBMS villages, or higher than the provincial average statistics, are poor and more likely to
be hard hit by rising prices.
Table 5: Enough Income to Secure Household Expenditure and Food Security
by Landholding Groups with the Last 8 Months Prior to the Survey Period in
September 2008 (% of 1,132 panel households)
Income for Household Expenditure Food Shortage
Enough
Not
enough
Some
saving Total Yes No Total
Landless 13.5 86.3 0.2 100 41 59 100
<0.5 ha 15.4 84.2 0.4 100 33 67 100
0.5-0.99 ha 24.0 75.0 1.0 100 30 70 100
1-1.99 ha 39.7 60.3 0.0 100 21 79 100
2-2.99 ha 39.0 61.0 0.0 100 15 85 100
>3 ha 53.8 44.6 1.5 100 14 86 100
Total 21.7 77.9 0.4 100 33 67 100

18
Table 6 also suggests that the degree of impacts varies according to the location of CBMS
villages. People living in the village closer to the market center tend to suffer the most from
the rising prices due to increase in number of poor households in Savy Chrum village. While
agricultural dependent villages such as Sdei Leu and Bak Amraek tends to gain well-being
improvement from rising food prices through the sale of their farm produce and in turn are
able to improve household consumption; and therefore, have experienced higher rates of
poverty reduction. In contrast, rising prices tend to slow down poverty reduction in the remote
village of Reach Doumkeo.
Table 6: Poverty headcount and village characteristics, 2006 – 2008
Village
NHH
Poverty
Headcount Change
Village characteristics 2006 2008 2006:2008
Svay Chrum 216 28 44 16
Close to the market centre, rice
farming and petty trade are main
source of income
Reach Dounkeo 150 72 68 -4
Remote village, wet and dry season
rice and fishing
Samraong Outrea 343 63 36 -27
Good road access and connection to
market, rice farming, fruit trees and
petty trade
Sdei Leu 234 61 38 -23 Cash crop and wet rice farming
Bak Amraek 189 66 40 -25
Wet and dry season rice farming and
fishing
Total 1132 58 43 -15 Sources: 1,132 CBMS panel households surveyed in 2006 and gain in 2008
Good road access and connection to market for selling farm produces and petty trading help
reduce poverty reduction faster in Samroang Outrea. This study also marks the important role
of infrastructure development such as recent construction of road and irrigation in establishing
rural livelihoods against the negative impacts of rising prices of consumer goods through
agricultural intensification and diversification, trading and labour migration. This argument is
supported by the movement in and out of poverty as summarised in Table 7.
Table 7: Movement In and Out of Poverty of Penal Households, 2006 and 2008
(% of 1132 households)
Village
Stayed
non poor
Moved out of
poverty
Falling into
poverty
Stayed
poor Total
Svay Chrum 47 10 25 18 100
Reach Dounkeo 9 23 19 49 100
Samraong Outrea 27 36 9 27 100
Sdei Leu 35 27 4 34 100
Bak Amraek 25 34 9 31 100
Total 30 27 13 30 100
Percentage of households who have moved out of poverty between 2006 and 2008 is found to
be higher in the villages with good road access and market connection such as Samraong
Outrea and villages with irrigation for dry season rice growing and cash crop production such
as Bak Amraek. In contrast, in the villages that large proportion of household income from
off-farm activities and buying foods from market such as Svay Chrum and remote village of
Reach Dounkeo, proportion of people falling into and remain stuck in poverty and is relative
higher.

19
V. Household Coping Strategies
Increasing Child Labour as One of the Household Coping Strategy
In the CBMS sites, 128 households (or 11 % of the panel households) withdrew their children
from schools to help earn income to cope with rising cost of living. It is surprising that among
the villages under study, increased incident of child labour is high in areas where there is fast
growth and development. The number of migrants either to search employment in other urban
area or to sell labour along the Cambodia-Thai boarder or inside Thailand is on an increasing
trend since the late 1990s. It is gradually become more important and dominant source of
household income for the CBMS villages in 2008 (Annex 2).
According to village leaders consulted during the survey, the number of households who often
encouraged their children to take time off from school to help family in running business or
collecting edible items from the common fields could be higher than 11 %. Since more and
more people are trying to go in search of work elsewhere outside the villages, the labour
shortage for farming also has occurred and often replaced by either elderly and/or child
labour. The wage labour for translation and ploughing are two or three time more expensive
than two or three year ago while at the same time farm inputs such as fertilisers or chemical
pesticide also high. In order to saving some money, children and elderly now become more
valuable assets; or meaning that every household member have to work hard to cope with
rising food prices. The situation is even worse for the poor children whose parents are mobile
labourers. The rising food prices has further limited the ability of poor children to benefit
from the government’s free universal education for all and food for poor children at school
since they are also brought along with their parents to the working destinations. All
respondents and village leaders interviewed wishes for down-price of food stuffs.
Credit Access and Use
Rising prices of food and producer goods have pushed may CBMS households into
indebtedness. About half CBMS penal households has taken loan from either MFI and/or
relatives in the last 8 month prior to the survey period in September 2008. About 53 % of the
poor households and 48 % of non poor households reported outstanding loans. Among the
reasons given by 565 households who took loan within the 8 months prior to the time of the
survey, 51% used the loan to support business accounts, 29% used for buying food and 17%
used for health care purposes (Annex 3).
Table 8: Uses of Loans by Poor and Non Poor Households in the
Last 8 Months (% of 565 households with outstanding loans)
Non poor Poor
MHH FHH Total MHH FHH Total
Farming 4 2 3 4 7 5
Support
business 52 47 51 52 48 51
Food 18 23 19 30 29 30
Health care 21 24 22 11 12 11
Study 3 3 3 0 2 1
Resolving
conflicts 1 0 1 0 0 0
Other 1 2 1 1 2 2
Total 100 100 100 100 100 100
Figure 4: Source of Loans (% of 565
Households With Standing Loans)
51
6758
23
19
21
26
1320
1 0 1
0%
20%
40%
60%
80%
100%
Non P oor P oor Tot a l
MFI/NGO Mo ney lenders /traders
Rela tives /Friends Other

20
Table 8 further shows a breakdown of who uses the loan in the poor and non poor households:
either the male and female heads of the household. During hiked prices of food and other
necessary consumer items, both poor and non poor has spend most of their loan to sustain
their business to retain their consumer satisfaction, especially when the demands for their
services go down. Among the non poor households, the proportion of male head households
who uses the loan for buying food and health care is relative higher than their female
neighbours. This may be since there are fewer female earners and female has lower incomes..
However, in the poor groups, only a little difference have been observed between the male
and female headed household.
The survey also suggests lower proportion of female headed households borrow money for
sustaining business than their male labour during the hiked prices. In rural area, women play
critical roles in running small businesses and are better with regards financial management for
the family. This may be the reason why the female can somehow manage to use their savings
to sustain business before taking loan. A critical point to note here is the recent growth of
micro credit institutions (MFIs) in the last two or three years. Those MFIs are more active in
providing loan with affordable 3 % of interest rates per month to the poor and been cited as of
great help in at least the time of rising food prices. About 67 % of the poor have access to
MFI loans for both productive and consumption purposes with much lower interest rates than
what is charged by the private money lenders of about 10-15 % or even higher per month if
they borrow cash or in kind from them.
Selling Lands
About 4 % of CBMS households decided to sell out their land or their other assets within 8
month prior to the survey as the result of rising prices to repay loan or set up or sustain
business. In addition, about 10 % of households have to seek for additional jobs or work hard
in order to earn enough income to buy food. Nonetheless, 24 % of poor and 21 % of the non
poor became worse off while around 71 percent of the poor and non poor were able to sustain
their livelihoods. Only 5 % of the non poor and 2 % of the poor households were able to
improve living during the hiked prices while about 4 % were uncertain whether they remained
in status quo or not.
VI. Conclusion and Policy Implications
Actually, a number of findings from CBMS have confirmed a number of key lessons learned
about people’s experiences in responding to the recent phenomena of rising prices of food and
other basic commodities. First, the prices of food and other basic commodity still remained
relative high after they peaked at double digits in the history of inflation since the mid 2000.
Although CBMS villages located the rice producing surplus area of the Battambang Province,
only about 23 % of the CBMS households characterised as large rice farmers, petty traders
and/or money-lenders can seize opportunity generated by rising prices to produce surplus for
sale or increase income. In contrast, about 77 % of the households including the landless and
land poor with one hectare of land or less are and/or become net food buyers during the hiked
food prices. Many of them did not earn enough income to offset the rates of price increase and
to meet basic household expenditure, and had to work harder to earn money to buy foods.
Therefore, food security for many became worse.
Second, in response to rising prices, many children has been taken from school to help family
cope with this abnormal phenomena of hiked cost of living. Village-out migration is also
adopted as a coping strategy for many. Children and elderly have to work harder to sustain

21
household income for food and other basic household expenditure. Another coping strategy in
response to rising prices is access to loan for supporting business, purchase of food items and
health care purposes. Rising prices in many cases has contributed to the acceleration of
landless households in the CBMS villages.
The more striking impact of rising prices on poverty are not just increasing food insecurity of
many people but also make the poor become poorer; push many rural people into debts that is
difficult to recover. Rising prices has further change human capital with regard to education
and poor health and loss of productive assets as well as deteriorated capability of the small
landholders and the poor to cope with any future shocks or crises. This requires a stronger
social safety net programme to support the smaller farmers to remain in producer group, poor
children to stay in school, and better targeting policy intervention to support the poor and
vulnerable. The social safety net programme, however, would be implemented effectively
through involvement of local authorities or if the capacity of commune council can be further
enhanced and strengthened for pro-poor and good governance and implementation of national
policy.
Third, like other rural villages, the CBMS farmers and villagers are gradually connected, or
are no longer isolated, to any change in global and international market. That is because the
CBMS villages are located in one of the fast growing and developing Battambang province.
Located at the North-West of Cambodia, aside from having remarkable infrastructure
development there is also cross-boarder integration of trading activities, especially through
formal and informal trades with Thailand. Inter-country connection has been remarkably
taking place. The agricultural producers should seize this lucrative opportunity to increase
production, intensification and diversification from hiked prices and demand. The critical
constraints to agricultural growth, however, persisted in CBMS villages with lack of
agricultural know-how, irrigation and effective extension services. The growth of MFI so far
has been highly appreciated by CBMS villagers for both productive and consumption
purposes. The amount of loan and availability of services have been effective enough to
respond to the needs of small farmers and business entrepreneurs in rural area. Long term
strategy and intervention should be in place to build the capacity of small farmers to
overcome the barriers to production such as high cost of fertilizer, labor shortage, poor
irrigation and road access.

22
Bibliography
ADB, (April 2008), “Special Report on Food Prices and Inflation in Developing Asia:
Is Poverty Reduction Coming to an End?”. ADB: 1550 Metrol Manila.
Chan Sophal, (July 2008). "Policy Brief: IMPACT OF HIGH FOOD PRICES IN
CAMBODIA." CDRI - Cambodia’s Leading Independent Development Policy
Research Institute No. 02.
Fitzgerald Iingrid & So Sovannarith, (September 2007), Moving Out of Poverty?:
Trends in Community Well-Being and Household Mobility in Nine Cambodia Villages
(Phnom Penh: CDRI)
FAO, (April 2008), Soaring Food Prices: Facts, Perspectives, Impacts and Action
Required., HLC/08/INF/1. www.fao.org/foodclimate
Hyun H. Son, (May 2008), “Has Inflation Hurt the Poor? Regional Analysis in the
Philippines, ADB.
NIS, MoP (2006), “Statistical Year Book 2006”, Phnom Penh: Cambodia
PREM, A. a. D. "Rising food prices: policy options and World Bank response." ODI
(April 2008). "Briefing Paper: Rising food prices: A global crisis."
Polaski Sandra, (May 2008) “Rising Food Prices, Poverty, and the Doha Round.”
Policy Outlook. www.un.org/ecosoc/docs/statement08/S_Polaski.pdf
WFP (April 2008). "WFP Media Backgrounder: RISING FOOD PRICES: IMPACT
ON THE HUNGRY."
www.folketinget.dk/samling/20072/almdel/URU/Bilag/99/544785.PDF
United Nation (June 2008), “Rising Food Prices – Discussion Paper”
http://www.un.org.kh/attachments/060_RisingFoodPrices-
UN_DiscussionPaper_June%202008.pdf
ODI (April 2008), “Rising Food Price: A Global Crises”
http://www.odi.org.uk/resources/odi-publications/briefing-papers/37-rising-food-
prices-global-crisis.pdf
Evanic M. & Martin W., (April 2008), “Implications of Higher Global Food Prices for
Poverty in Low-Income Countries”. World Bank: Policy Research Working Paper
4594
World Bank, (2006), “Cambodia Halving Poverty by 2015?: Poverty Assessment
2006”. World Bank: Phnom Penh

23
Annex 1: Change in the returns from rice crops
Landholding size Increased Decreased Same Total
Sv
ay C
hru
m
<0.5 ha 26 47 26 100
0.5-0.99 ha 24 12 65 100
1-1.99 ha 40 27 33 100
2-2.99 ha 71 29 0 100
>3 ha 75 25 0 100
Total 39 29 32 100
Reach
Do
un
keo
<0.5 ha 15 23 62 100
0.5-0.99 ha 67 33 100
1-1.99 ha 44 6 50 100
2-2.99 ha 43 29 29 100
>3 ha 67 17 17 100
Total 32 25 43 100
Sam
raong O
utrea
<0.5 ha 4 72 23 100
0.5-0.99 ha 8 71 21 100
1-1.99 ha 15 68 18 100
2-2.99 ha 17 50 33 100
>3 ha 8 67 25 100
Total 10 68 22 100
Sdei L
eu
<0.5 ha 32 46 21 100
0.5-0.99 ha 24 59 18 100
1-1.99 ha 53 24 24 100
2-2.99 ha 64 21 14 100
>3 ha 71 18 12 100
Total 46 35 18 100
Bak
Am
reak
<0.5 ha 28 43 30 100
0.5-0.99 ha 35 35 29 100
1-1.99 ha 25 40 35 100
2-2.99 ha 44 22 33 100
>3 ha 13 38 50 100
Total 29 39 33 100
Table Annex 2: Percentage of source of income by villages, 2008
Crops Livestock Selling
labour
Petty
Trade CPR Rental Other
Total
average
Svay Chrum 24 10 48 11 1 5 1 100
Reach Dounkeo 36 9 45 6 1 1 2 100
Samraong Outrea 19 9 49 15 0 1 8 100
Sdei Leu 35 17 23 7 5 5 9 100
Bak Amreak 25 20 30 5 1 15 3 100
Total 26 13 39 10 2 5 5 100

24
Annex 3: Reasons for Borrowing Money
Frequency Percent Valid Percent Cumulative
Percent
Valid Producing 22 1.9 3.9 3.9
Purchasing food
135 11.9 23.9 27.8
Treatment diseases
96 8.5 17.0 44.8
Study 11 1.0 1.9 46.7
Conflic settlement
3 .3 .5 47.3
Support to business
290 25.6 51.3 98.6
Loss job 1 .1 .2 98.8
Other, specify 7 .6 1.2 100.0
Total 565 49.9 100.0
Missing System 567 50.1
Total 1132 100.0
Annex 4: Changes in household status of living of poor and
non poor household by the time of the survey compared to 8
months ago
Better
off Normal
Worse
off
No
idea Total
Number of Households
Non
Poor 30 458 138 20 646
Poor 10 338 118 20 486
Total 40 796 256 40 1132
% with same group
Non
Poor 5 71 21 3 100
Poor 2 70 24 4 100
Total 4 70 23 4 100


![[Commodity Name] Commodity Strategy](https://img.dokumen.tips/doc/110x75/568135d2550346895d9d3881/commodity-name-commodity-strategy.jpg)