Embed Size (px)
Citation preview

School of Management and Economics
Supply Chain Management Programme – Bachelor (IBL 341)
Bachelor Thesis
Impacts of RFID on the Information Exchange
in a Retail Supply Chain
Autumn Term 2006/2007
Tutor: Peter Berling
Examiner: Helena Forslund
Authors: Ralf Drauz 850120 [email protected]
Daniel Handel 810623 [email protected]

Executive Summary I
Executive Summary
Automatic identification is nowadays no longer a foreign word in economic context. Besides
existing systems such as Barcode, another identification technology finds its way into business,
called Radio Frequency Identification (RFID). RFID enables contactless and automatic
identification of objects, commodities, and goods using radio waves without necessity of
intervisibility. The use of RFID technology along supply chains encompasses new opportunities
for companies. Besides potential for recognition and avoidance of bottlenecks as well as
accelerated transfer of more accurate and real-time information along supply chains, also
chances for cross-company cooperation arise.
Certain advantages of this new technology were recognized and primarily used by retail
companies such as Tesco PLC, Wal-Mart Stores Inc., and Metro Group, which integrated RFID
technology in processes along their supply chains. By focusing on the retail company Metro
Group, an expedient supply chain, consisting of the distribution center Varena Lagerhaus
GmbH that is responsible for its customer Metro Cash & Carry Deutschland GmbH and Proctor
& Gamble Co. as a representative supplier of Metro Group, was found to enable an insight in
RFID-integrated processes. A combination of RFID technology with the collaborative issue
information exchange resulted in an entirely new arising problem, which has to be solved.
Both aspects combined refer to the impacts of RFID on the exchange of information within the
aforementioned retail supply chain. There are a few scientifically unproved assumptions of how
RFID could change information exchange, but a measurement of certain impacts when using
RFID technology was not attempted so far. With the Degree of Supply Chain Coupling (DSCC)
a well-fitting model is given to exhibit cross-company collaboration by looking on the exchange
of diverse information types, such as demand or inventory data, between the initial company
and its direct supply chain partners. The model with regard to the limited supply chain is applied
twice in order to measure once the degree of coupling without RFID in use and once again after
RFID implementation. Both gathered results are compared to conclude how RFID has affected
the exchange of information between the regarded companies. The analysis reveals a course of
action, which is of interest for Metro Group and other retail companies of the same population.
Hereon based questions, which conduct the research of this Bachelor Thesis, have emerged:
1. What was the DSCC before and what is the DSCC after RFID implementation
between Varena distribution center and its supply chain partners?

Executive Summary II
2. How has RFID changed the information exchange in Varena’s supply chain?
The unexpected outcome of this Bachelor Thesis becomes apparent by answering
aforementioned research questions. Before RFID implementation, the regarded companies are
coupled with a degree of 23.37 per cent, whereas the DSCC with RFID in use takes the value of
21.6 per cent. As nothing else than RFID has changed, its implementation obviously led to a
reduction of information exchange. Thereby, it has to be understood that actual information
exchange only occurs when information is transferred by a sender and also utilized by its
receiver. Consequently, the reason for this negative effect can be explained due to the more
often available information about demand from Metro Cash & Carry Deutschland GmbH after
RFID implementation and simultaneously non-adapted frequency of its utilization.
This explanation results in a course of action, which describes possibilities of handling
information for participating supply chain members and similar constellations in the retail sector
in order to improve cooperation ability. Accordingly, a recommended maxim can be derived –
the more frequently information is available, the more often it has to be used to heighten the
Degree of Supply Chain Coupling and therewith the information exchange between supply
chain members.

Acknowledgement III
Acknowledgement
This Bachelor Thesis was only possible with assistance of many helpful people. Hereby, we
would like to express our gratitude to everyone who contributed with support, time and effort, so
that we were able to fulfill this assignment.
To begin with, we would like to thank our examiner Helena Forslund, who enabled our research
in the first place. We are very grateful for her guidance and constructive comments on our work
throughout the planning meetings. Moreover, we would like to give our appreciation and
gratitude to our tutor Peter Berling. His support as well as helpful advices and remarks
contributed to the advances this thesis has made within the elaboration.
The same applies for the seminar members during the planning meetings. For constructive
criticism, comments, and suggestions of Emmanuelle Chaize, Philip Nordhorn, Fabian
Koschitzki, Dietmar Öller, and Hauke-Christoph Santel we are very beholden. Their feedbacks
helped us a lot to structure and enhance this Bachelor Thesis.
Our special thanks go to our interview partners Hubert Braunshausen and Holger Koch from
Metro Group Logistics GmbH for their effort and time to grant us a practical insight and provide
us with empirical data by answering our questions. Furthermore, we would like to thank
Matthias Robeck from Metro Group Information Technologies GmbH, Mr. Kettner from Metro
Cash & Carry Esslingen and all other involved people at Metro Group, who contributed to our
research.
Finally, we would like to express our thankfulness to the developers of the ‘Degree of Supply
Chain Coupling’ model, Mehmet Barut, Wolfgang Faisst, and John J. Kanet, who supported us
in several correspondences with answers and explanations regarding their model.
Växjö, 11th January 2007
(Ralf Drauz) (Daniel Handel)

Table of Contents IV
Table of Contents
Executive Summary I Acknowledgement III Table of Contents IV
List of Figures VII List of Abbreviations VIII 1 Introduction 1
1.1 Background 1
1.2 Discussion of the problem 3
1.3 Objectives 5
1.4 Limitations 5
1.5 Outline of the thesis 7
2 Methodology 9 2.1 Scientific approach 9
2.2 Scientific paradigm 9
2.3 Research method 12
2.4 Data collection 12 2.4.1 Theoretical data collection 13
2.4.2 Empirical data collection 13
2.5 Scientific creditability 15 2.5.1 Construct validity 15
2.5.2 Internal validity 15
2.5.3 External validity 16
2.5.4 Reliability 16
2.6 Summary of methodology 16
3 Theory 17 3.1 Information exchange in a retail supply chain 17
3.1.1 Information types and directions 17
3.1.1.1 Demand information 18
3.1.1.2 Inventory information 18
3.1.1.3 Capacity information 19
3.1.1.4 Production schedule information 19
3.1.2 Information system 20

Table of Contents V
3.2 Degree of Supply Chain Coupling 21 3.2.1 Indicators describing DSCC 22
3.2.2 Information Extent 22
3.2.3 Information Intensity 24
3.2.4 Determining D, N, C, and S 26
3.3 Automatic identification systems 28 3.3.1 Functionality 29
3.3.2 Types 29
3.3.2.1 Barcode 29
3.3.2.2 Radio Frequency Identification 30
3.3.2.3 Smart Label 32
3.3.2.4 Comparison of RFID with Barcode 33
3.3.3 General benefits of RFID 34
3.4 Hypothetical impacts of RFID on the information exchange 34 3.4.1 Information Extent 35
3.4.2 Information Intensity 35
3.4.2.1 Customer coupling 36
3.4.2.2 Supplier coupling 37
3.4.3 Overview of hypothetical impacts 38
4 Empiric 39 4.1 Company description 39
4.1.1 Metro Group 39
4.1.1.1 Metro Group Logistics GmbH / Varena Lagerhaus GmbH 40
4.1.1.2 Metro Group Information Technology GmbH 41
4.1.1.3 Metro Cash & Carry 41
4.1.2 Procter & Gamble Co. 41
4.2 Metro’s supply chain network 42
4.3 Process description 42 4.3.1 Process without RFID in use 43
4.3.2 Phases of RFID implementation 45
4.3.3 Facts of RFID technology along the process chain 46
4.3.4 Process changes with RFID in use 46
4.4 Questioning 48 4.4.1 Information Extent without RFID 49
4.4.2 Information Intensity without RFID 49
4.4.2.1 Customer coupling 49
4.4.2.2 Supplier coupling 51
4.4.3 Information Extent with RFID 52
4.4.4 Information Intensity with RFID 53

Table of Contents VI
4.4.4.1 Customer coupling 53
4.4.4.2 Supplier coupling 54
5 Analysis 55 5.1 DSCC measurement 55
5.1.1 DSCC results 55
5.1.2 Benchmark of both DSCC results 56
5.2 Measured impacts of RFID on the information exchange 57 5.2.1 Information Extent 58
5.2.2 Information Intensity 58
5.2.2.1 Customer coupling 59
5.2.2.2 Supplier coupling 61
5.3 Results of the analysis 62
6 Conclusion 64 6.1 Results in detail 64
6.2 Course of action 65
7 Additional Comments 66 7.1 Reflection 66
7.1.1 Model criticism and improvement suggestions 66
7.1.2 General aspects 66
7.2 Perspective 67
References 68 Appendix 73

List of Figures VII
List of Figures
Figure 1. Supply chain 2
Figure 2. Limitations of the thesis 6
Figure 3. Structure of the thesis 8
Figure 4. Hermeneutic vs. positivistic paradigm and thesis posture 10
Figure 5. Interview facts 14
Figure 6. Summary of methodology 16
Figure 7. Two indicators of Supply Chain Coupling 21
Figure 8. Illustration of notation used in determining IEd and IEu 23
Figure 9. Ingredients of Information Intensity 25
Figure 10. Specifications of variables 26
Figure 11. Physical construction of a Barcode 30
Figure 12. Different RFID tags 31
Figure 13. RFID components 31
Figure 14. Comparison of active and passive RFID tags 32
Figure 15. Comparison of RFID with Barcode 33
Figure 16. Hypothetical impacts of RFID on DSCC 38
Figure 17. Corporate structure Metro Group 40
Figure 18. High rack at Varena 40
Figure 19. Process chain 43
Figure 20. RFID roll-out phases at Metro 45
Figure 21. Metro Cash & Carry goods receipt 46
Figure 22. Summary of the DSCC variables 48
Figure 23. Results of the DSCC measurement 56

List of Abbreviations VIII
List of Abbreviations
3M 3M (Minnesota Mining and Manufacturing) Company
Auto ID Automatic Identification
AG Aktiengesellschaft
C Capacity Information
Cash & Carry Metro Cash & Carry Deutschland GmbH
Co. Company
D Demand Information
DSCC Degree of Supply Chain Coupling
EAN Electronic Article Number
ELIN Electronic Library Information Navigator
EPC Electronic Product Code
et al. et alteri
ERP Enterprise Resource Planning
e. g. exempli gratia
GHz Giga Hertz
GmbH Gesellschaft mit beschränkter Haftung
H Planning Horizon
HF High Frequency
i. e. id est
IE Information Extent
II Information Intensity
ISO International Standard Organization
IT Information Technology
k kilo
LF Low Frequency
Metro Metro Group
MGI Metro Group Information Technology GmbH
MGL Metro Group Logistics GmbH
MHz Mega Hertz
MPS Master Production Schedule
N Inventory Information
n Number of Periods in the Planning Horizon
OCR Optical Character Recognition

List of Abbreviations IX
P Length of Re-planning
P&G Proctor & Gamble Company
PL n Party Logistics Level n
PLC Public Limited Company
POS Point of Sales
p. page
pp. pages
RFID Radio Frequency Identification
ROI Return on Investment
S Production Schedule Information
Tier n Supplier Level n
UHF Ultra High Frequency
Varena Varena Lagerhaus GmbH

Chapter 1 – Introduction 1
1 Introduction
The introduction chapter is intended to show an overview of the subject, motivation, and process of the thesis.
Opening with a general background, the reader is given a first impression of Automatic Identification in business
correlation. Thereafter, important terms are set in context and explained briefly. Subsequently, this section leads to a
discussion of the problem, whereupon the objectives of this elaboration emerge. The last section of the introduction
chapter contains limitations of the author’s scope and an outline of this research.
1.1 Background
In times of economic slowdown, high competitive environment, and new rising business
challenges, attempts of companies heightening their sales revenue and thus their firms’
profitability are often hard or almost impossible to achieve. Therefore, enterprises are faced with
huge pressure to remove extraneous costs from their business processes.1 The more and more
applied ‘Lean’ thinking of organizations minimizes among other things inventory levels to
extraordinary lows.2 Nevertheless, this has enlarged the pressure on companies to meet
specific needs within a shorter timeframe to maintain determined customer service levels, which
normally abate in line with shrinking inventories. But what can be done? A great part of time is
required to identify material and gain information at different workflow stages. Whenever raw
materials, components or parts are either in transit, arrived at goods receipts or stocked in work-
in-process inventories, identification of items is essential, to know what kind of materials will
reach at what place on which time. Many companies forget to consider such information as an
important value added. However, organizations should utilize all of the available and useful
information due to dramatic “reductions in the costs of obtaining, processing, and transmitting
information”.3
The upcoming trend towards collaboration drives manufacturers working closely together with
suppliers, distributors, and customers to make management of material and information in
existing interfaces more efficient.4 Teamwork between organizations’ functional departments
within a firm is necessary, but not sufficient these days and has to be extended to a
collaborative interaction of all partners consequentially. „A poor relationship at any link in the 1 Wincel, pp. 49-51. 2 Womack / Jones, p. 91. 3 Porter, pp. 75-78. 4 Cohen / Roussel, pp. 139-142.

Chapter 1 – Introduction 2
supply chain can have disastrous consequences for the entire supply chain.”5 A supply chain is
defined as a network that “encompasses all organizations and activities associated with the flow
and transformation of goods from the raw materials stage, through to the end user, as well as
the associated information flows.”6 The following figure shows a typical supply chain in a retail
environment:
Figure 1. Supply chain (adapted from: Chase et al., p. 407)
Collaboration leads to a continuously increasing complexity in handling information along supply
chains due to a larger extent of data necessity and flow.7 Organizations “must be involved in
managing the network of all upstream firms that provide input (directly or indirectly), as well as
the network of downstream firms responsible for delivery and after-market service of the product
to the customer.”8 To cope with the growing complexity, managing and improving information
exchange between supply chain members is an important factor of success. By dint of new
information technologies, which supplement existing information systems, companies could
achieve improved and clearer business processes and thereby better collaboration
opportunities along their supply chains to distinguish from global competitors.9
One supportive technology is automatic identification (Auto ID) of products. At each stage of a
supply chain, Auto ID applications were developed to improve efficiency by using a better
technique for recording and classifying product data.10 Decades ago, the first Auto ID
technology, called Barcoding, has been implemented along supply chains. Barcodes have 5 Handfield / Nichols, p. 25. 6 Handfield / Nichols, p. 20. 7 http://www.managementsoftware.hp.com/solutions/mfg/sg/mfg_sg_rfid_bb.pdf. 8 Handfield / Nichols, p. 20. 9 Stock / Lambert, pp. 73-81. 10 Bhatt / Glover, pp. 2-5.
Retailing
Supply chain
Distribution Center Supplier Network Distribution Channel (End-) Customer
Distributor
B
C
D
E
F
G
H
A
J
K
L
M
N
O
I Tier 2
Tier 1
Tier 2
Tier 1
Tier 2
Tier 1
Tier 2
Tier 2
Tier 1
PL 2
PL 1
PL 2
PL 1
PL 2
PL 1
PL 2
PL 2
PL 1

Chapter 1 – Introduction 3
improved business processes immensely. Nowadays, the most used Auto ID systems are
based on predefined Barcode tags with codes representing information about marked goods.11
However, Barcode labels have significant limitations, by virtue of “being prone to damage, they
require human intervention to be read and provide limited information since they only represent
a product number.”12 Therefore, organizations are dedicating to a more reliable and powerful
technology that stores actively or passively product data and “uses radio waves to automatically
identify physical objects”13, called Radio Frequency Identification (RFID). With the use of RFID
organizations expect enormous improvements in passing on information to suppliers and
customers and vice versa that cannot be provided by using Barcode technology.
To sum up, RFID is not only overcoming Barcode for its technical advantages, but even more
for its potential to cut costs.14 With the expected advantages the open market competition not
only forces an adaption to RFID, but also sets up pressure on supply chain partners to integrate
RFID in their business processes.15
1.2 Discussion of the problem
The search of practical examples has shown that many companies use diverse Auto ID
technologies. Unfortunately, organizations implement indeed a lot of Barcode technology, but
RFID only in certain subareas of their supply chains, for instance simultaneous identification of
products in inventories16 or tracking and tracing opportunities in transit.17 RFID is still in its
infancy, but will doubtlessly complement or completely substitute Barcode in the future.18
Nowadays, only few companies in the retail sector, such as Metro Group, Wal-Mart Stores Inc.,
and Tesco PLC, dare to invest in this high innovative and cost-intensive area and already use
RFID along their supply chains with main suppliers and direct customers.19 With the help of
Metro Group, especially the internal companies Metro Group Logistics GmbH (MGL),
responsible for logistics at the distribution center Varena Lagerhaus GmbH (Varena) and Metro
Group Information Technology GmbH (MGI), a service provider responsible for developing and
11 Finkenzeller, p.1. 12 http://apps.qinetiq.com/perspectives/pdf/rfids.pdf. 13 Lahiri, p. 20. 14 http://www.foodproductiondaily.com/news-by-product/news.asp?id=72609&idCat=147&k=metro-tests-rfid. 15 http://hbswk.hbs.edu/archive/3651.html. 16 Shorey et al., p. 315. 17 Bhatt / Glover, p. 8. 18 http://csdl2.computer.org/comp/proceedings/hicss/2006/2507/06/250760104a.pdf. 19 Correspond to Thomas Neises, Project Manager responsible for ERP and RFID at STZ My eBusiness.

Chapter 1 – Introduction 4
managing projects about new technologies for the internal companies of Metro Group, it was
possible to study RFID along a supply chain.
A few researches explore extensive aspects about applicability, benefits, and limitations of RFID
and are therefore not of interest in this research.20 But an insufficient researched subject is the
change of the information exchange between a distributor and its supply chain partners after
RFID implementation. RFID technology and information exchange in retail supply chains are
examined separately in most cases, but elaborations about the interaction of both elements
combined are very rare or based on scientifically unproved suppositions.21 Most investigators
agree that RFID has general impacts on the information exchange, but a measurement of these
impacts was never done before.22 A suitable model to measure information exchange is the
Degree of Supply Chain Coupling (DSCC). The DSCC model specifies to what degree a firm is
linked with its suppliers and customers and can be used to develop a good diagnosis after
implementation of a new strategy or system, allowing a before and after comparison.23
Information exchange in this model is determined of two indicators, namely Information Extent
and Information Intensity. This thesis deals with the above mentioned measurement of two
different DSCCs, once without RFID and once with RFID in use, in order to show the impacts of
this new technology on the information exchange between supply chain partners in a retail
environment.
These thoughts lead to the following research questions, which will be explored in cooperation
with Metro Group within this Bachelor Thesis:
1. What was the DSCC before and what is the DSCC after RFID implementation
between Varena distribution center and its supply chain partners?
2. How has RFID changed the information exchange in Varena’s supply chain?
20 http://www.rfidupdate.com/contributors. 21 http://www.iml.fraunhofer.de/1720.html, http://www.alexandria.unisg.ch/EXPORT/DL/21492.pdf. 22 Correspond to Dr. Wolfgang Faisst, Vice President SAP AG, Service Strategy and Portfolio Management. 23 Barut et al., p. 162.

Chapter 1 – Introduction 5
1.3 Objectives
The overall objective is to show the impacts of RFID on the information exchange in a retail
supply chain by looking on a predetermined supply chain of Metro Group, which consists of one
supplier Proctor & Gamble with its sub-suppliers, one distributor Varena as the initial point of
view and two Metro Cash & Carry outlets and their clients as customers.
The underlying objectives are reflected in the thesis’ approach in order to gain answers for the
first research question with regard to the aforementioned supply chain. First of all, the DSCC
model with values gathered from a point of view before RFID implementation is applied to get a
degree of how coupled the supply chain is without RFID in use. A further measurement of the
DSCC is done after RFID implementation in order to gain a second result with RFID in use. By
comparing both gathered results, which are expected to diverge, and regarding their difference,
the overall objective stated in the second research question can be answered for the regarded
supply chain at Metro. The outcome of this is a course of action for retail companies heading for
RFID implementation or already having RFID integrated, which helps to handle information in
an effective and efficient way.
1.4 Limitations
Due to the enormous field of the topic, the perspective and considerations of the authors are
narrowed down to economic aspects. Institutional and socio-cultural elements, such as
implementation procedures or safety and security aspects of RFID, are knowingly omitted.
The scope of this research is limited to one example of a retail supply chain, because time is
constricted and nowadays RFID technology implemented and used throughout a supply chain
can be only found in the retail sector. Furthermore, the regarded supply chain only considers
the relationships of one supplier, Proctor & Gamble Co. in Euskirchen and its sub-suppliers, one
distribution center, Varena Lagerhaus GmbH in Unna, and two Metro Cash & Carry
wholesalers, one in Neuss and one in Mülheim, with their clients as customers due to the fact
that the main supply chain members have RFID implemented in their processes. Other
members are ignored, so that the supply chain is more transparent. Besides the material and
finance flow, the flow of information exists in supply chains, which is in turn subdivided in a
horizontal and vertical flow direction. The vertical information flow is of hierarchical nature, the

Chapter 1 – Introduction 6
horizontal information flow is “between two adjacent entities within the supply chain”.24 This
elaboration considers only the impacts of new information technologies on the information
exchange, which is set equal to the horizontal information flow.
The technical part of Auto ID is kept small. It is of course nevertheless important to give an
overview of Auto ID technologies and the reader a basic knowledge in purpose of
understanding further elaborations. Barcode, RFID, and Smart Label are regarded, because
these technologies are mainly in use at the moment and there are only few possibilities to
implement RFID or Smart Labels without having Barcode systems before.
To sum up, the following figure shows the general limitations of this thesis, in what way the
authors interpret and do research, the limitations of analyzed sectors and parts of the supply
chain, as well as the limitations of studied areas of Auto ID technology.
Legend Analyzed areas Non-analyzed areas
Attribute Occurrence
Authors’ perspective Economic Institutional Socio-cultural
Regarded sector Retail Other
Supply chain members Supplier Distributor Customer
Supply chain flows Information Material Finance
Information flow Horizontal Vertical
Auto ID definition Overview Technical
Used Auto ID systems Barcode RFID Smart Label
Figure 2. Limitations of the thesis
24 Stadler, p. 70.

Chapter 1 – Introduction 7
1.5 Outline of the thesis
In order to be able to achieve the purpose of this thesis in the best way possible, the elaboration
is divided into different areas, which have to be investigated.
In the theory chapter, it is first of all necessary to define information exchange. Mainly, the
information types and their directions as well as important information systems are explained. In
order to measure this information exchange, an understanding of the DSCC model is
indispensable for the further research. The objective of the used model is defined and the
measurement method is explained with all its assumptions and variables. The next step is the
exhibition of Auto ID technology, containing an abbreviated history as well as a description of
technical details and functionality of Barcodes, RFID tags and Smart Labels. After having done
previous steps, logical hypotheses of the impacts of RFID on the information exchange can be
formulated based on predefined theory.
In the empirical research, involved companies as well as an example process, once without and
once with RFID, are described. Practical data had to be collected from MGL about Varena and
its supply chain partners. In order to get specific data for the DSCC measurement, an interview
with a questionnaire was done, consisting of questions about general issues and variables of
the model.
The analysis chapter comprises explanations and investigations of the empirical findings. Both
DSCC measures, without and with RFID in use, can be calculated with the answers from the
interviewees. Consequently, gathered results of both measurements are compared and
analyzed to show the actual impacts of this new technology on the DSCC and therewith on the
information exchange in the regarded supply chain. On this basis, a recommended course of
action, concerning the handling of RFID to get a positive effect on the exchange, is given for
retail companies such as Metro.
In the conclusion the research questions are answered and attained findings are summed up.
The last chapter attached highlights a reflection of the research and gives a perspective of
further research.
The structure and approach of this thesis are shown in the overview below:

Chapter 1 – Introduction 8
Figure 3. Structure of the thesis
ADDITIONAL COMMENTS CHAPTER
CONCLUSION CHAPTER
ANALYSIS CHAPTER
EMPIRIC CHAPTER
THEORY CHAPTER
Chapter 5.1 – DSCC measurement
DSCC without RFID DSCC with RFID
Chapter 3.1 – Information exchange
Chapter 3.2 Degree of Supply Chain Coupling (DSCC)
Information types & direction Information system
Chapter 3.3 – Automatic Identification Systems
Barcode
Radio Frequency Identification (RFID)
Smart Labels
Chapter 4.1 – Company description
Chapter 4.3 – Process description
Metro Group Proctor & Gamble Co.
Process without RFID Process with RFID
Chapter 4.4 – Questioning
Information IntensityInformation Extent
Chapter 5.2 – Measured impacts of RFID on the information exchange
Information Intensity (II)Information Extent (IE)Weights of importance
Chapter 6.1 – Results in detail
Chapter 7.2 – Perspective Chapter 7.1 – Reflection
Chapter 4.2 – Metro supply chain
Information ExtentInformation Intensity
Chapter 3.4 – Hypothetical impacts of RFID on the information exchange
Information Intensity Information ExtentWeights of importance
Course of action
Chapter 6.2 – Course of action

Chapter 2 – Methodology 9
2 Methodology
This chapter describes and motivates the chosen methods to accomplish the purpose of this thesis. To begin with,
the scientific perspective and the applied research approach are explained. The consecutive passage deals with the
procedure of data collection within this thesis and grants the reader an insight to the theoretical and empirical
resources used. Following, the quality of this thesis is measured by tests, striving for scientific creditability. Closing,
an overview of the nature of research this Bachelor Thesis follows is given.
2.1 Scientific approach
To research a topic in a scientific manner, there are two main approaches – the research can
be done either deductive or inductive. These approaches “can be seen as seeking the truth
from opposite directions. Through deductive argument we infer the particular from the general,
while through inductive argument we infer general truths from the particular.”25 Consequently,
“deductive research primarily tests existing theory, whereas inductive research primarily
generates new theory.”26
This thesis is meant to examine the impacts of RFID on the information exchange measured
with the DSCC. As a result of using this model and formulating hypotheses of RFID impacts,
this thesis follows a deductive approach, moving from the general seen in the theoretic starting
point to the specific, namely the researched distribution center Varena with relations towards its
supplier Proctor & Gamble Co. and Metro Cash & Carry as customers.27
2.2 Scientific paradigm
A paradigm represents a way of thinking, which embosses the scientific picture of the world in a
period.28 According to this, “a scientific paradigm is a conceptual and logical framework that
25 Walliman, p. 159. 26 Gummesson, p. 64. 27 Gummesson, p. 63. 28 Kropp, p. 10.
Chapter 2 – Methodology 10
provides an explanation for the empirical evidence in a field”29, which means in other words a
“basic orientation to theory and research”.30
There are two main scientific paradigms, namely positivism and hermeneutic. The positivistic
paradigm determines that only valid knowledge is scientific and objective.31 Opposed to this, the
hermeneutic paradigm is a process of personal interpretation with intention of understanding
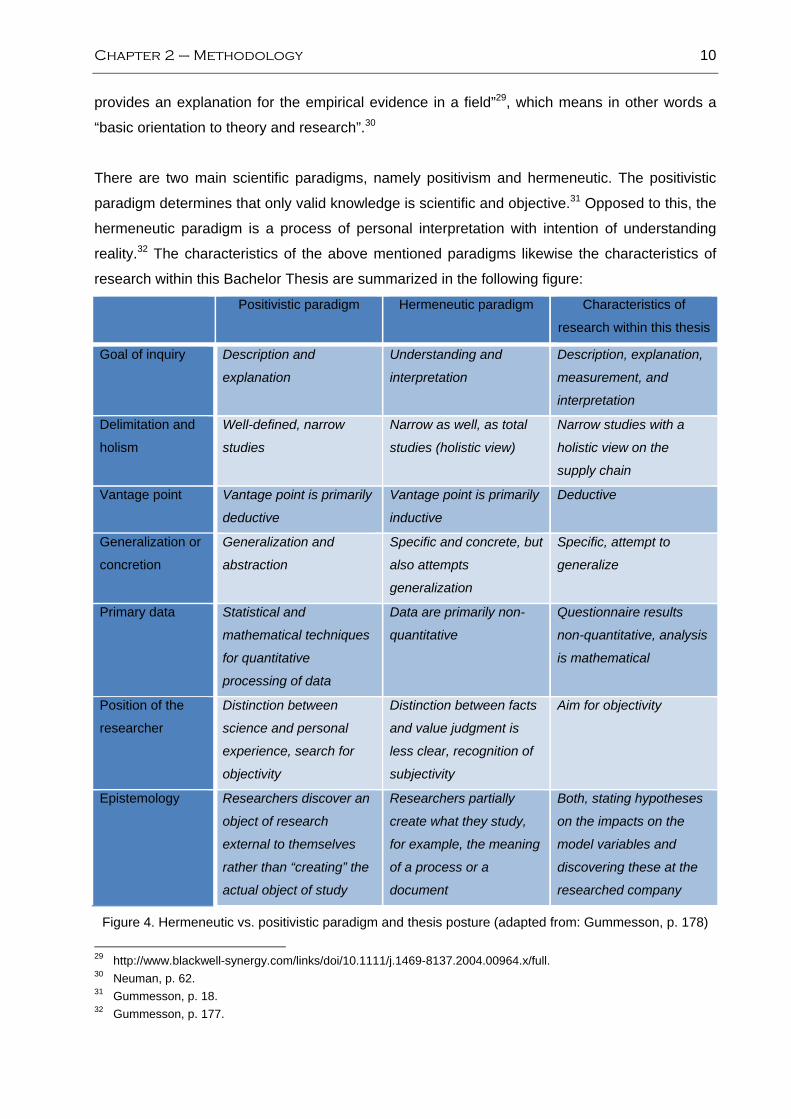
reality.32 The characteristics of the above mentioned paradigms likewise the characteristics of
research within this Bachelor Thesis are summarized in the following figure:
Positivistic paradigm Hermeneutic paradigm Characteristics of
research within this thesis
Goal of inquiry Description and
explanation
Understanding and
interpretation
Description, explanation,
measurement, and
interpretation
Delimitation and
holism
Well-defined, narrow
studies
Narrow as well, as total
studies (holistic view)
Narrow studies with a
holistic view on the
supply chain
Vantage point Vantage point is primarily
deductive
Vantage point is primarily
inductive
Deductive
Generalization or
concretion
Generalization and
abstraction
Specific and concrete, but
also attempts
generalization
Specific, attempt to
generalize
Primary data Statistical and
mathematical techniques
for quantitative
processing of data
Data are primarily non-
quantitative
Questionnaire results
non-quantitative, analysis
is mathematical
Position of the
researcher
Distinction between
science and personal
experience, search for
objectivity
Distinction between facts
and value judgment is
less clear, recognition of
subjectivity
Aim for objectivity
Epistemology Researchers discover an
object of research
external to themselves
rather than “creating” the
actual object of study
Researchers partially
create what they study,
for example, the meaning
of a process or a
document
Both, stating hypotheses
on the impacts on the
model variables and
discovering these at the
researched company
Figure 4. Hermeneutic vs. positivistic paradigm and thesis posture (adapted from: Gummesson, p. 178)
29 http://www.blackwell-synergy.com/links/doi/10.1111/j.1469-8137.2004.00964.x/full. 30 Neuman, p. 62. 31 Gummesson, p. 18. 32 Gummesson, p. 177.

Chapter 2 – Methodology 11
With relation to the first criteria ‘goal of inquiry’, the thesis’ research contains descriptive,
explanative and interpretive parts. The DSCC model as well as Auto ID systems, especially
RFID, are described and explained within the theory chapter. A combination of these issues
exhibits the impacts of RFID on the information exchange as new theory formulated in
hypotheses. Following as a result to that, a case study, collecting data before and after RFID
implementation, measured with the DSCC and representing the empiric part of this thesis, is
presented in an explicative and descriptive way. The analyzing part contains interpretations of
collected data. Given that a clear distinction between positivism, with the researcher having an
observing position, and hermeneutics, when partially creating the studied subject, is not
possible, the authors see themselves in both, positivistic and hermeneutic, research situation.33
Concerning the second argument ‘delimitation and holism’, this approach is in part of a
positivistic nature since the subject is clearly defined and narrowed a lot through the research
questions and limitations stated in the introduction chapter. Nevertheless, there is also a
tendency towards holism through the consideration of the whole supply chain, wherefore this
point is in majority hermeneutic. Bearing in mind the as deductive identified scientific approach,
the ‘vantage point’ is deductive and thereby supports the positivistic paradigm. The fourth
decisive point ‘generalization or concretion’ reveals this research as specific and concrete with
an attempt to generalization. The research is done from the view of the distribution center
Varena towards its supplier Proctor & Gamble and its customers Metro Cash & Carry, which can
be extended to a general retail supply chain within the population, Metro Group was chosen
from. Thus, this point supports the hermeneutic approach. All measures will be gained through
interrogation and questioning of two independent persons of Metro Group Logistics GmbH.
Consequently, the ‘primary data’ is non-quantitative. Despite the analysis of collected data is
done with mathematical and logical techniques, the primary data is of hermeneutic nature.
Moreover, it is the aim of this thesis to preserve objectivity as ‘position of the researcher’, which
is of great importance in the case of an interview. Hereby, the positivistic approach is
contributed. The last aspect ‘epistemology’ shows a positivistic and hermeneutic point of view
due to the above mentioned formulation of hypotheses, which are reviewed in the accomplished
case study.
To summarize these factors, this Bachelor Thesis is classified as positivistic and hermeneutic in
its nature. This can be motivated by two main positivistic points and three main hermeneutic
points out of seven, two points are composites. Resulting, the hermeneutic characteristics
slightly excel the positivistic aspects. The allotment of positivistic and hermeneutic parts and in
some parts also conglomerated approaches within this paper will be beneficial for its result,
33 Gummesson, p. 177.

Chapter 2 – Methodology 12
because it is not restricted to a single angle of view, taking both perspectives with facts and
interpretation into account to support validity.
2.3 Research method
There are different ways to conduct a research, such as experiment, survey, archival analysis,
history and case study. All these conductive strategies follow own logics and offer advantages
as well as disadvantages, depending on the respective situation.34 Therefore, it is compulsive to
select a suitable research conduct.
Because of the contemporary topic of RFID implementation, there is no possibility to choose the
research strategies archival analysis and history. An experiment is not applicable, owing to the
broad field of information exchange in a supply chain and the hardly tangible indicators
Information Extent and Information Intensity. In accordance with that, the utilized DSCC model
exploits an expert-reviewed questionnaire, which was revised and simplified to collect needed
data. This takes place, because there is no quantitative possibility to determine essential
estimations.35 Therefore, the applied research method is case study. Furthermore, an important
aspect, which research conduct has to be used within this study, is “the degree of focus on
contemporary as opposed to historical events”36. This acts in accordance with the utilized
method.
2.4 Data collection
In order to construct an adequate research, it is essential to conduct it through a proper data
collection concerning quality and quantity. This data consolidation contains the collection of
theoretical and empirical data. Theoretical data comprises literature, articles and internet
documents. Empirical data is obtained through “documentation, archival records, interviews,
direct observation, participant-observation, and physical artifacts.”37
34 Yin, p. 3. 35 Barut et al., p. 165. 36 Yin, p. 5. 37 Yin, pp. 83-85.
Chapter 2 – Methodology 13
2.4.1 Theoretical data collection
The initial step to gather theoretical data was the library of Växjö University. Due to the up to
date subject RFID, the range of textbooks is limited on technical views. Finding textbooks about
the general aspects of managing the supply chain entailed no problems. A greater theoretical
data collection was acquired through using the Electronic Library Information Navigator (ELIN) –
the main search engine for articles at Växjö University. Moreover several supply chain related
journals with articles on RFID and its overall impacts were gained hereby. Internet research on
the technical affected subject, this thesis is dealing with, brought some specified contemporary
articles to reflect assumptions and ideas. General keywords for the search were ‘RFID’, ‘supply
chain’, as well as ‘collaboration’ and ‘information exchange’ in several combinations. Using
ELIN with its multiple sources and internet search engines, such as Google, the applied model
was found. To provide general definitions, textbooks from previous courses at Växjö University
and scientific internet resources were used.
2.4.2 Empirical data collection
To obtain a company for the collection of empirical data and to enhance the theoretic
knowledge, the authors visited the RFID Symposium in Stuttgart at 8th of December as well as
the 1st Heilbronn IT dialogue organized by Heilbronn University at 13th December with the day-
topic RFID. After the search for a company in manufacturing industries, which has RFID in use,
no implementation along a supply chain was attained. Through correspondences with RFID
experts, it became apparent that the retail industry represents a suitable example for a research
with the applied model.38 Thereafter, only a low population, namely Tesco PLC, Wal-Mart Stores
Inc., and Metro Group, makes it possible to conduct the empiric part of this research.
Fortunately, a contact could be established through connections over an aunt of one of the
authors, working at Metro Group Buying GmbH in Düsseldorf. Only this connection made
cooperation with Metro Group possible to facilitate the empiric chapter of this thesis. The
empirical data is generated on foundation of a case study at Varena distribution center, which
has implemented RFID with its direct supplier Proctor & Gamble and internal customers Metro
Cash & Carry. Since this research type was already given, empirical data is collected through a
questionnaire coming with the DSCC model. The questionnaire was revised, simplified and
adjusted to the researched retail supply chain. Used questions were discussed and checked
38 Discussions with RFID Experts at the RFID Symposium in Stuttgart at 8th of December: Thomas Neises, Project Manager responsible for ERP and RFID at STZ My eBusiness, Simon Japs, RFID expert responsible for technology, Informationsforum RFID, www.info-rfid.de.

Chapter 2 – Methodology 14
with Dr. Faisst39 to ensure their correctness. A first contact was established to Matthias Robeck,
working at Metro Group Information Technology GmbH. Mr. Robeck contributed information
about the RFID implementation in Metro’s supply chain processes to this research.
Through the family relationship, it was possible to get the telephone number of Mr.
Braunshausen, the Executive Planning Officer responsible for Varena distribution center, from
Metro Group Logistics GmbH in Düsseldorf. Mr. Braunshausen accepted in a telephone inquiry
at 15th of December to fill in the needed questionnaire. He said it would be easier to answer the
questionnaire face-to-face to provide him with further explanations. This personal interview took
place on 19th of December at Metro Group Logistics GmbH in Düsseldorf. After arriving in
Düsseldorf Mr. Braunshausen had no time, but his assistant Holger Koch was instructed to give
support. Mr. Koch is a planning coordinator responsible for the Varena distribution center. As he
was unsure about questions concerning company strategy and weights of importance of
customers and suppliers, the authors moreover had an interview with Mr. Braunshausen himself
later that day. Mr. Braunshausen was furthermore so kind to answer the questionnaire again,
independent from Mr. Koch, contributing to the construct validity of this thesis.
In order to warrant gained data, a process description of the researched supply chain is
essential to realize if changes in the information exchange actually come from the newly
implemented technology or are based on other factors or on interrelated process changes. The
interviewees only stated general information about logistics processes, but the authors had
problems to imagine the processes at a wholesaler. Therefore, a visitation of the Metro Cash &
Carry outlet in Esslingen and a conversation with its store manager was of avail.
Following an overview of the interviews used for the empiric data:
Date Location Interviewee Position Interview type
14th of December
- Matthias Robeck MGI
IT Strategy and RFID expert
Telephone interview
19th of December
Düsseldorf Holger Koch MGL
Planning Coordinator
Personal interview
19th of December
Düsseldorf Hubert Braunshausen MGL
Executive Planning Officer
Personal interview
27th of December
Esslingen Mr. Kettner Metro Cash & Carry
Store Manager
Personal interview
Figure 5. Interview facts
39 E-Mail contact with Dr. Wolfgang Faisst, Vice President SAP AG, Service Strategy and Portfolio Management.

Chapter 2 – Methodology 15
2.5 Scientific creditability
Scientific creditability is the degree of what actually is measured to what was supposed to
measure.40 This is done through evaluating the in social research commonly used tests
construct validity, internal validity, external validity and reliability to found the quality of this
research.41
2.5.1 Construct validity
Construct validity means to establish “correct operational measures for the concepts being
studied”.42 To ensure that, the theoretical data is provided by multiple sources of textbooks,
articles, and internet documents. Empiric data gained with the applied model was verified and
published by the European Journal of Purchasing & Supply Management, thus it is valid. The
model states to be also usable for a before-after control after implementing a new system.43
This is also legitimate for the researched system RFID in a retail supply chain, according to the
developers of the DSCC model.44 To collect empiric data for this thesis a questionnaire provided
by the DSCC model is used in a revised version. Since the original questionnaire is validated
and the adjusted one was checked to provide the needed model measures, the foundation of a
valid research is given. To provide several sources of data, seen in the independently
questioned interviewees and comparison of the results amongst themselves and with the
examples from the used model, construct validity is heeded.
2.5.2 Internal validity
Only causal case studies, in which the goal is to discover if a specified event leads to a
specified consequence, are concerned by this degree.45 The interrelation of RFID
implementation and its impacts have to be seen unaffected from further alterations. Therefore, it
is of great importance for the interviewers to explain the questionnaire and gain a general view
of the process and what has changed besides RFID. Thereby, mistakes resulting from
misunderstanding and incorrect interpretations are eliminated.
40 Tashakkori, p. 276. 41 Yin, p. 33. 42 Yin, p. 34. 43 Barut et al., p. 162. 44 Correspondence with Dr. Wolfgang Faisst, Vice President SAP AG, Service Strategy and Portfolio Management
and Mehmet Barut, Ph.D., Associate Professor of Operations Management, Wichita State University. 45 Yin, p. 36.

Chapter 2 – Methodology 16
2.5.3 External validity
The extent to which the outcome of this research may be generalized above its composition is
called external validity. In this thesis that is to say to other processes, other supply chains, and
on top of that different industry sectors.46 Generalization will scarcely be possible, especially for
other industry sectors, because the case study is only based on interviews in one company and
for one product. Despite that, the authors’ aim for generalization is reflected in the possible
usability of this elaboration in the scope of similar supply chain constellations, within the same
industry, namely other retailing companies among the population Metro Group was chosen
from, and of similar products.
2.5.4 Reliability
The internal consistency and repeatability of a measure is meant with the term reliability. This
means that another investigator, doing the same case study as in this thesis, achieves almost
congruent results, when using the same background and procedures.47 The goal of this test is to
minimize preconceived opinions and errors.48 The theory chapter as background and the
applied questionnaire in the appendix together with the methodology part of this work make
sure that the objectives of reliability are fulfilled.
2.6 Summary of methodology
Subsequent a summary of the resorted methodology within this thesis:
Methodology in general Methodology within this thesis
Scientific approach Deductive
Scientific paradigm Positivistic and hermeneutic
Research approach Case study
Theoretical data collection Articles, textbooks, ELIN, Internet
Empirical data collection Personal interviews, telephone interviews, questionnaire
Scientific credibility Construct validity, internal validity, external validity, reliability
Figure 6. Summary of methodology
46 Yin, p. 37. 47 Gummesson, p. 91. 48 Yin, p. 37.
Chapter 3 – Theory 17
3 Theory
The theory chapter is intended to present all pertinent secondary data to provide the theoretical knowledge required
to answer the research questions. To start over information exchange within a supply chain is described. Then, the
utilized DSCC model is explained with its indicators Information Extent and Information Intensity. Afterwards, RFID
technology and other presently used Auto ID methods are shown with a basic insight in the technique. Eventually,
hypothetical impacts of RFID on the information exchange measured with the DSCC are depicted.
3.1 Information exchange in a retail supply chain
Along a supply chain a lot of information between a firm and its customers and suppliers exists.
“Information is defined as any type of knowledge, that can be exchanged, and this information is
always expressed (i.e. represented) by some type of data.”49 The type and flow direction of
information differs from supply chain to supply chain. For instance, information about demand is
derived from customers and data about inventories, capacities or production schedules from
suppliers in the most cases. The exchange of this information, which “includes coordination and
collaboration with channel partners”50, is important for a company to be able to plan its own
business by forecasting future orders of customers or knowing planning-decisive inventory
levels, capacities of labor and machines, or production workloads of suppliers. Here, it is very
important to understand the meaning of information exchange. Information exchange occurs
when information is transferred by a company and thereafter also used by its receiver.
Information exchange can be measured with a scientific model, called Degree of Supply Chain
Coupling (DSCC). This model will be specified in section 3.2 of this thesis.
3.1.1 Information types and directions
In order to be able to classify information exchange, it is necessary to explain on the one hand
the direction of information and on the other hand the different regarded information types in a
supply chain. Besides the material and finance flow, the flow of information in both directions
along supply chains exists. The information flow is in turn subdivided in a horizontal and vertical
flow direction. Vertical information flow is of hierarchical nature and horizontal information flow,
49 http://nost.gsfc.nasa.gov/isoas/presentations/USDA_19990219/sld013.htm. 50 http://www.cscmp.org/Downloads/Resources/glossary03.pdf.

Chapter 3 – Theory 18
which can be compared with the information exchange, is defined in this research, is “between
two adjacent entities within the supply chain”.51
3.1.1.1 Demand information
Demand results from a need for a specific commodity on a market. Demand can be seen in the
registration “of items sold, generally at the retail level”52 and in addition shrinkage. Thereafter,
information about demand cannot be seen in this context as the actual demand or items sold.
Rather demand information is the anticipated data before the actual order placement. Demand
information is shared in a retail supply chain. Data comes in the relation between a distributor
and its customers from customers and also goes towards suppliers in the relation between this
distributor and its suppliers. From the general maxim to “deliver the right products, to the right
place, at the right time”53 it can be derived that demand information can be among other things:
• Sales structure – What kind of and how many products are going to be sold,
• Location structure – Where products are going to be sold,
• Demand structure – Is demand continuous or not over the time.
3.1.1.2 Inventory information
Inventory is the value of all physical resources to the stock that a business uses in its production
process or has for sale.54 The reasons for carrying inventories are uncertainty of future
demands, uncertainty of delivery lead times, and assured provision of continuing production, as
well as to be able to speculate on future material prices. There are different variants of
inventories, for example for raw materials, work-in-process, or finished goods. Information about
inventory is passed on in a retail supply chain. Data comes in the relation between a distributor
and its suppliers from suppliers and also goes towards customers in the relation between this
distributor and its customers. Inventory Information is used to inform customers about:55
• Storage location structure – What kind of and how many products are in stock,
• Storage location item – Where products are stocked,
• Warehouse location – Where inventories are located,
• Inventory turnover – Ratio of sales to inventory,
• Inventory and service levels – Importance of no stock-outs.
51 Stadler, p. 70. 52 Grant et al., p. 85. 53 Wang, p. 403. 54 http://www.smallbiz.nsw.gov.au/smallbusiness/Resources/Business+Tools/Glossary+of+Business+Terms. 55 Wireman, pp. 120-121.

Chapter 3 – Theory 19
3.1.1.3 Capacity information
“Capacity is defined as the available time for production”.56 More general, it is economically
seen as the maximum possible productivity in a determined time period. Capacity information is
planning data that is forwarded from suppliers towards a distributor and in turn from this
distributor towards its customers in a retail supply chain. Capacity information can be seen in
calculated “equipment and labor requirements to meet product line forecasts”57 and availabilities
of these over a planning horizon. Capacity information can be among other things:58
• Equipment and human capacity occupation,
• Capacity utilization related to location.
3.1.1.4 Production schedule information
Production schedule or Master Production Schedule (MPS) is “a time-phased plan specifying
how many and when the firm plans to build each end item.”59 Production “scheduling concerns
the allocation of limited resources to tasks over time.”60 To make it precisely, a MPS is a set of
work instructions, which tells a manufacturing facility what to make, when, and on which items
of equipment. Each MPS is given an identifying key, which consists of a part number and a
date, as well as the end item part number, and the date that this end item part number will be
available either in inventory or shipped to the customer. The MPS is constrained by and
supports the production plan, and it disaggregates the production plan, by breaking the
production plan down to specific quantities of specific products. Besides the aggregated
production plan, other inputs to the MPS are forecasts, customer orders, additional independent
demand, inventory levels, and capacity constraints. Production planning depends on the
aforementioned information types. “Production planning is based on multiple pieces of
information, including demand forecast and actual demand realization, availability of raw
materials and production capacity, current inventory levels along the supply chain, and previous
backlog. Naturally, the accuracy of the production plan depends on the accuracy of each of
these inputs.”61 Information about production schedules is only shared in the relation between a
supplier/manufacturer and a distributor, coming from the supplier/manufacturer. Schedule
56 Chase et al., p. 725. 57 Chase et al., p. 436. 58 McNair / Vangermeersch, pp. 231-232. 59 Chase et al., p. 634. 60 http://www.productionscheduling.com/production-scheduling.html. 61 Lee, H. L. et al., p. 14.

Chapter 3 – Theory 20
information consists of the data that is necessary to have insight to the production activity of
suppliers. Production schedule information can be among other things:62
• Product structure,
• Production quantity and dates,
• Lead times of the product,
• Degree of utilization of the production facilities.
3.1.2 Information system
An often-arising problem of companies in this context is that either useful information is not
available or data is indeed available, but not utilizable. If information is utilized more often and
earlier, the company gains competitive advantages compared to non-users.63 With the help of
an information system companies are able to separate useful from useless data in order to
make organizational decisions. An information system “consists of the information technology
infrastructure, application systems, and personnel that employ information technology to deliver
information and communications services for transaction processing/operations and
administration/management of an organization. The system utilizes computer and
communications hardware and software, manual procedures and internal and external
repositories of data. The systems apply a combination of automation, human actions, and user-
machine interaction.”64
One common-used information system is the Enterprise Resource Planning (ERP) system. ERP
systems are application systems, which summarize almost all operational functions of a
company as well as internal and external information into a unified system. An ERP system is
an intangible reproduction of the physical flow of products to gain information about goods-
orientated, dispositive, logistics and accounting-related processes in order to accomplish
business issues, such as disposition, ordering, goods receipt, rolling in/out, goods issue, cash
desk handling, stock-taking or reports come to the fore.65
62 Chase et al., p. 634. 63 Hurd / Nyberg, p. 5. 64 Baskerville / Stage et al., p. 67. 65 Zentes et al., pp. 219-221.

Chapter 3 – Theory 21
3.2 Degree of Supply Chain Coupling66
The Degree of Supply Chain Coupling (DSCC) measures to what degree a firm is linked with its
suppliers and customers by looking on their information exchange. The measure can be used to
develop a good diagnosis of an existing system or allowing a before and after comparison after
implementation of a new strategy or system. In order to understand the DSCC, it is necessary to
show the approach and the method of the model. Supply Chain Coupling is measured by using
the information exchange between a firm and its supply chain partners from the firm’s point of
view.
The information exchange is represented by two indicators:
• Information Extent (IE) describes the depth of the information used into the network in
both directions of customers and suppliers, and
• Information Intensity (II) describes the richness of the information used either in the
direction of customers or suppliers.
The next figure serves to clarify these two dimensions of the DSCC. The circle in the middle of
the figure is the point of origin and represents the company, in which the research takes place.
The circles on the left represent suppliers and the circles on the right are customers:
Figure 7. Two indicators of Supply Chain Coupling (Barut et al., p. 163)
66 The following expirations are orientated on the article from Barut et al., pp. 162-171.

Chapter 3 – Theory 22
3.2.1 Indicators describing DSCC
The method generates two percentages indicating the degree of coupling for both, Information
Extent and Information Intensity:
DSCC = (IE, II) = IE * II
A value of zero for both indicators (IE = II = 0) represents the extreme case of no coupling. In
this case, the enterprise is ‘totally uncoupled’. Thus, neither logistical information from
customers about their future demand nor information about supplier’s inventory, production
schedules, and capacity is used. A value of one for both indicators (IE = II = 1) represents the
extreme case of perfect coupling. In this case, the enterprise is ‘totally coupled’. All relevant
information about inventory, capacity, and production schedules from suppliers as well as of
demand from customers is available and used.
3.2.2 Information Extent
The first indicator Information Extent reticulates in two opposed directions of the supply chain:
• Information Extent towards customers (IEd), and
• Information Extent towards suppliers (IEu).
Thus, the degree of Information Extent is defined as the weighted sum of these two
components:
IE = l1 * IEd + l2 * IEu
where l1 and l2 are the weights, each between ‘0’ and ‘1’ and the sum equals ‘1’, for the IE
towards customers (subscript d) and IE towards suppliers (subscript u), respectively. Note that
this model allows the assignment of different weights for different components. Although this
makes the model very general, it also makes it more complicated in the sense that each weight
must be assigned a value. Determining these weights may be critical since the strategic
importance of a supplier and/or customer can be a significant element in information exchange.
For example, the enterprise can give more weight to l2 if being coupled towards their end
customers is more important than being coupled towards their end suppliers. Thus, the weights
are external to the model and are provided by the management of the enterprise.

Chapter 3 – Theory 23
The following notation for determining the two components IEd and IEu is defined:
• ci: The total number of levels toward the ultimate customer the company has in its supply
chain,
• cj: The number of levels of customer information used between the company and its
customers,
• si: The total number of levels toward the ultimate supplier the company has in its supply
chain,
• sj: The number of levels of supplier information used between the company and its
suppliers.
The illustration of this notation is given and clarified in the following supply chain figure:
Figure 8. Illustration of notation used in determining IEd and IEu (Barut et al., p. 164)
The observed firm is shown in the middle of the figure with different levels of its suppliers on the
left side and customers on the right side. The arrows from the firm to the entities of level-1,
level-j, and level-i indicate the existence and direction of information flow. Using this notation,
IEd, defined as the degree of IE towards customers, and IEu, the degree of IE towards suppliers
are defined as
IEd = cj / ci
IEu = sj / si

Chapter 3 – Theory 24
3.2.3 Information Intensity
The second indicator Information Intensity (II) also reticulates in two opposed directions of the
supply chain:
• Information Intensity towards customers (IId), and
• Information Intensity towards suppliers (IIu).
The degree of Information Intensity is defined as the weighted average of these two
components:
II = k1 * IId + k2 * IIu
where k1 and k2 are the weights, each between ‘0’ and ‘1’ and the sum equals ‘1’, for the II
towards customers and II towards suppliers, respectively. Determining these weights is also
critical due to the strategic importance of information sharing. The enterprise can give more
weight to k1 if they believe that information exchange with their suppliers will strengthen and add
more value to their operations, and being coupled towards suppliers is more important than
being coupled towards customers. These weights are also external to the model and provided
by the firm’s management.
Compared to IE, determining the value of II is more complex. Each II-component (IId and IIu) can
be described by four different types of information used:
• Demand (D),
• Inventory (N),
• Capacity (C), and
• Production Schedules (S).
The knowledge of inventory levels, various capacities and production status of the suppliers as
well as demand information from the customers is considered necessary if the entire supply
chain is to be coordinated in cost effective ways.67 Information flow from and towards customers
and suppliers as well as the types of information used to define IId and IIu are shown in the next
figure:
67 Simchi-Levi et al., p. 12.
Chapter 3 – Theory 25
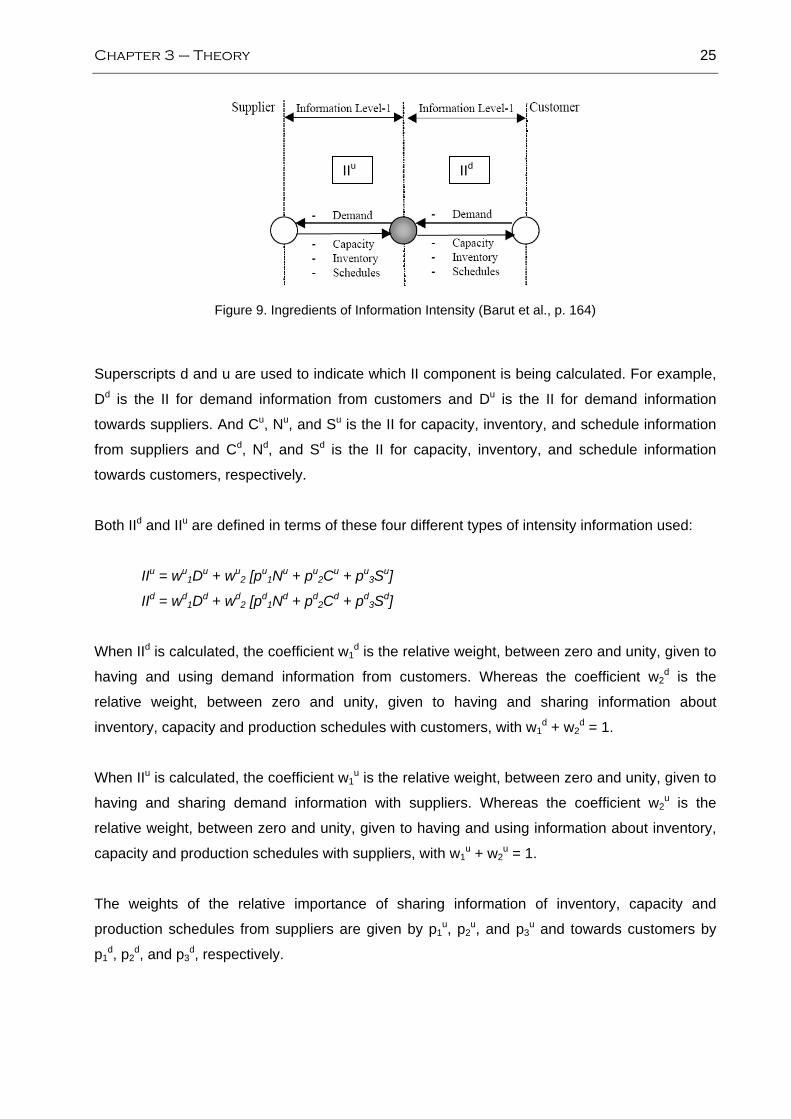
Figure 9. Ingredients of Information Intensity (Barut et al., p. 164)
Superscripts d and u are used to indicate which II component is being calculated. For example,
Dd is the II for demand information from customers and Du is the II for demand information
towards suppliers. And Cu, Nu, and Su is the II for capacity, inventory, and schedule information
from suppliers and Cd, Nd, and Sd is the II for capacity, inventory, and schedule information
towards customers, respectively.
Both IId and IIu are defined in terms of these four different types of intensity information used:
IIu = wu1Du + wu
2 [pu1Nu + pu
2Cu + pu3Su]
IId = wd1Dd + wd
2 [pd1Nd + pd
2Cd + pd3Sd]
When IId is calculated, the coefficient w1d is the relative weight, between zero and unity, given to
having and using demand information from customers. Whereas the coefficient w2d is the
relative weight, between zero and unity, given to having and sharing information about
inventory, capacity and production schedules with customers, with w1d + w2
d = 1.
When IIu is calculated, the coefficient w1u is the relative weight, between zero and unity, given to
having and sharing demand information with suppliers. Whereas the coefficient w2u is the
relative weight, between zero and unity, given to having and using information about inventory,
capacity and production schedules with suppliers, with w1u + w2
u = 1.
The weights of the relative importance of sharing information of inventory, capacity and
production schedules from suppliers are given by p1u, p2
u, and p3u and towards customers by
p1d, p2
d, and p3d, respectively.
IIu IIdIIu IId

Chapter 3 – Theory 26
3.2.4 Determining D, N, C, and S
As known, the different information types are Demand (D), Inventory (N), Capacity (C), and
Schedules (S). Each of these can be formulated as a function of both, time properties of the
information used and the aggregation properties of the information used. For this purpose, the
next step is to define three indices for time properties and two indices for the degree of
aggregation.
Before defining these indices, let
• H be the length of the planning horizon (H > 0)
The planning horizon is a time frame for planning strategic activities and for
accomplishing strategic goals. The length of the planning horizon is commonly
determined by the degree of uncertainty in the environment and depends on the
industry.
• n be the number of periods in the planning horizon (n > 0)
The number of periods in the planning horizon, which are determined by the exact date,
information is available.
• P be the length of the re-planning period (P > 0)
The length of the re-planning period determines how frequent available information is
used.
Thus, the ration ‘H/n’ is the length of each period, showing how often information is available.
The following illustration specifies the variables:
Figure 10. Specifications of variables (Barut et al., p. 164)
First of all, the three indices for time properties of information used are defined:

Chapter 3 – Theory 27
• X1 is defined as the ratio of how often new information is available to how often it is used
to re-plan
A value of 1 indicates that re-planning is done as frequently as new information is
available (0 < X1 <= 1).
• X2 is defined as the frequency of the re-planning
When re-planning is done more frequently, X2 approaches the value of 1 (0 <= X2 < 1).
• X3 is defined as the extent to which the time horizon is divided
A value very close to 1 indicates that information is continuously used over the time
horizon (0 <= X3 < 1).
Secondly, two indices for the degree of aggregation of information used are defined:
• X4: the degree of aggregation with respect to geography (0 <= X4 <= 1)
X4 is minimal (i.e., 0) if all geography information is consolidated and for example the
distances between factories and warehouses or the inventory levels at each warehouse
are not used. It is maximal if all such details about the geography are available and
used. The reason for this index is that if the details are shared by the entities, this might
improve distribution planning. For example, if a supplier knows the geographic location
of individual demand of each customer’s plant, then the supplier might deliver from its
nearest inventory locations.
• X5: the degree of aggregation with respect to product description (0 <= X5 <= 1)
X5 is minimal (i.e., 0) if information is only available and used with respect to the top
level of product structure. It is maximal if the information about all levels of product
structure is available and used. For example, if the firm’s product consists of several
modules and sub-modules, then detailed forecasts of product varieties make it easier for
suppliers to plan the production of components.
The next step, based on these five indices developed above, is the definition of the four different
intensities of information types for both, customers’ and suppliers’ side:

Chapter 3 – Theory 28
where Xuj is the j-th index in the supplier-firm linkage and Xd
j is the j-th index in the firm-
customer linkage. The constant parameters a, b, c, and d are the weights used to reflect the
relative importance of each indices for each information about demand, inventory, capacity and
schedule, respectively, into the model. Note that the fifth index is only used in determining Du
and Dd. Because the degree of aggregation with respect to product description (X5) is not
relevant in calculating Information Intensity for inventory, capacity and production schedule.
3.3 Automatic identification systems
At the very beginnings identification of products and goods in business environments exhibited
an enormous complexity. The traditional applied method was the manual entry of products and
corresponding data in an inventory control system. Nowadays, manual data capture is used in
niche areas and smaller businesses, although this method generates troubles in booking,
administrating, controlling and signing out of relevant information. Besides high error rates and
data inconsistencies, manual data records cause high labor costs as well as time waste in
business processes.68 Therefore, a step away from manual identification towards automatic
identification (Auto ID) often coupled with automatic data capture took place. Task and goal was
to characterize and identify objects and provide attached information with a reduction of the
named drawbacks. Thereby, the physical material flow is interlaced with the information flow.69
To sum up, Auto ID systems are interfaces between IT systems and the real world.
68 http://apps.qinetiq.com/perspectives/pdf/rfids.pdf. 69 Finkenzeller, p. 1.
Chapter 3 – Theory 29
3.3.1 Functionality
Auto ID of objects is achievable by different methods. Specific characteristics of objects like size
and weight can be consulted. However, corresponding methods are deprived due to cost
aspects in competition with other Auto ID systems. In contrast thereto, methods of identification
attached directly to an object and being evaluated over reading devices succeeded in industrial
use.70 To readout an information storage different physical sensor principles can be applied:
mechanic (over contacts), magnetic (with a magnet card or band) or electronic (with electronic
storing). The received data is consequently appraised and transmitted to a superordinated
information system, in which connected processes are set in motion.71
Auto ID systems include Barcodes, Smart Cards, Voice Recognition, biometric technologies,
Optical Character Recognition (OCR) and Radio Frequency Identification (RFID).72 These
methods play a very dissimilar role in nowadays supply chains. Hence, this thesis only deals
with the presently and mainly used Barcode technology and the omnipresent discussed
substitute RFID technology.
3.3.2 Types
3.3.2.1 Barcode
The aforementioned Auto ID technology Barcode is a contactless Auto ID system. It exists since
the 1970s and was able to succeed against other technologies due to low cost and worldwide
standardization. To identify a product a Barcode label is put on its surface to store important
details and information about the item. A traditional (1-dimensional) Barcode is a binary code
consisting of parallel arranged bars with different thicknesses and gaps which are arranged “to
a predetermined pattern and represent data elements that refer to an associated symbol.”73 In a
technical manner “a Barcode is a machine-readable representation of information in a visual
format”.74 It is read through optical laser scanning. There are several Barcode symbols which
can code up to 252 alphanumeric signs, for example the standardized ‘Code 128’ on which
different EAN (Electronic Article Number) standards with the symbols EAN 8, EAN 13, EAN 128
for the consumer goods industry is based on. Nowadays, there are also more sophisticated 70 Duyshart, p. 48. 71 Finkenzeller, p. 7. 72 http://www.rfidjournal.com/faq/16/48. 73 Finkenzeller, p. 3. 74 http://en.wikipedia.org/wiki/Barcode.
Chapter 3 – Theory 30
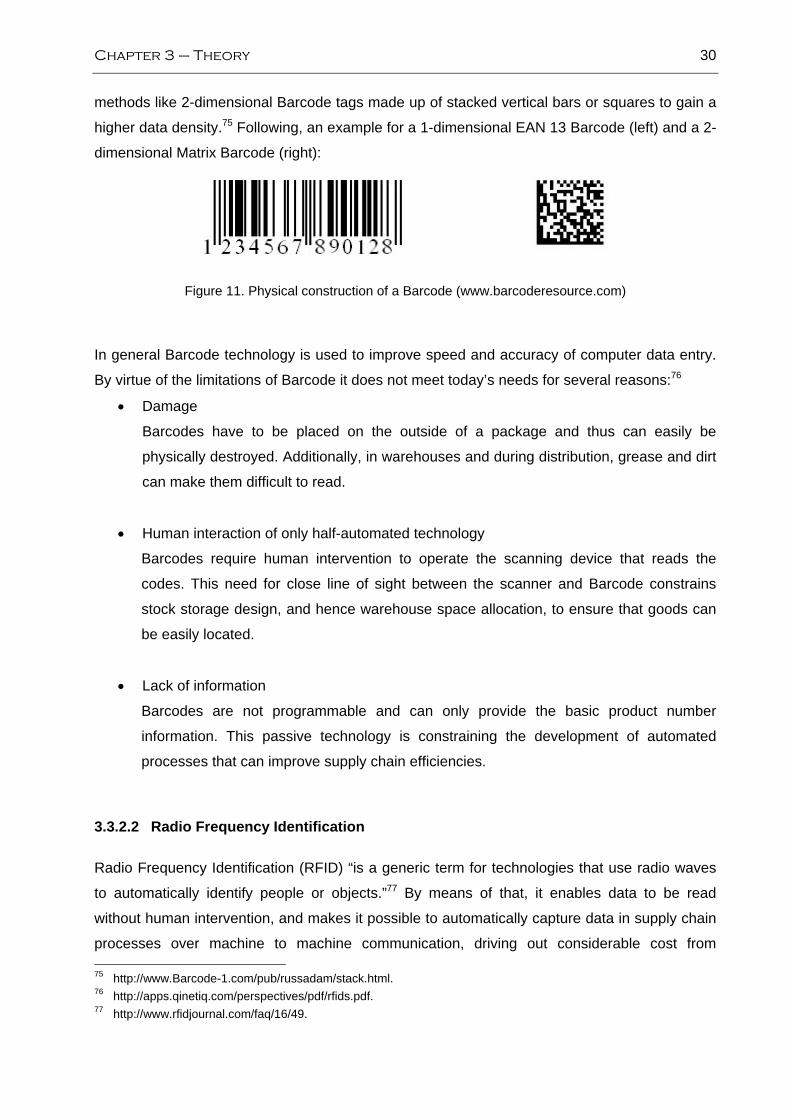
methods like 2-dimensional Barcode tags made up of stacked vertical bars or squares to gain a
higher data density.75 Following, an example for a 1-dimensional EAN 13 Barcode (left) and a 2-
dimensional Matrix Barcode (right):
Figure 11. Physical construction of a Barcode (www.barcoderesource.com)
In general Barcode technology is used to improve speed and accuracy of computer data entry.
By virtue of the limitations of Barcode it does not meet today’s needs for several reasons:76
• Damage
Barcodes have to be placed on the outside of a package and thus can easily be
physically destroyed. Additionally, in warehouses and during distribution, grease and dirt
can make them difficult to read.
• Human interaction of only half-automated technology
Barcodes require human intervention to operate the scanning device that reads the
codes. This need for close line of sight between the scanner and Barcode constrains
stock storage design, and hence warehouse space allocation, to ensure that goods can
be easily located.
• Lack of information
Barcodes are not programmable and can only provide the basic product number
information. This passive technology is constraining the development of automated
processes that can improve supply chain efficiencies.
3.3.2.2 Radio Frequency Identification
Radio Frequency Identification (RFID) “is a generic term for technologies that use radio waves
to automatically identify people or objects.”77 By means of that, it enables data to be read
without human intervention, and makes it possible to automatically capture data in supply chain
processes over machine to machine communication, driving out considerable cost from 75 http://www.Barcode-1.com/pub/russadam/stack.html. 76 http://apps.qinetiq.com/perspectives/pdf/rfids.pdf. 77 http://www.rfidjournal.com/faq/16/49.

Chapter 3 – Theory 31
operations and promoting the supply chain efficiency, which goes in line with the above
mentioned limitations of Barcode technology.78
Identification is possible through information like a serial number stored on a microchip, which is
attached to an antenna, combined called RFID tag. Following, examples of RFID tags:
Figure 12. Different RFID tags (http://ww1.microchip.com/downloads/en/AppNotes/00830b.pdf)
An RFID system infrastructure contains an RFID tag, an interrogator (reader, but also writer)
and an IT system in the background. To record the stored information, special reading devices
are necessary. The reading and sending device generates an electromagnetic field that can be
received by the antenna of the RFID tag. Dependent on the frequency and environmental
influences data can be received over distances between few centimeters to various meters.
Either the tag has the information stored and sends it back, or it responds back a code to the
reading device with an antenna. The reading device forwards that code to the IT system, which
interprets the code and links it to information in a backend database.79
Figure 13. RFID components (Thornton, p. 20)
78 http://apps.qinetiq.com/perspectives/pdf/rfids.pdf. 79 Finkenzeller, p. 7.

Chapter 3 – Theory 32
RFID tags can be distinguished into active and passive tags. An active RFID tag consists of a
microchip, an antenna and a power source, whereas passive tags require no internal battery.
The active RFID tag can be updated with information about the item itself, creating a flexible
record of the item’s current state, and its history. 80 Subsequently, a comparison of active and
passive RFID tags:
Active Passive
Tag power source Internal to tag (battery) Energy transferred from reader via
radio frequency
Availability Always, lifetime dependent on
battery
Only within field of reader, unlimited
lifetime
Price High Low
Data storage Large Small to medium
Rewrite ability Often Once to often
Communication range Long Short
Reading speed Middle to high Small to middle
Figure 14. Comparison of active and passive RFID tags (adapted from:
http://www.autoid.org/2002_Documents/sc31_wg4/docs_501-520/520_18000-7_WhitePaper.pdf)
Already the name Radio Frequency Identification implies the importance of frequency as main
parameter. At the moment the common frequencies are Low Frequency (LF), High Frequency
(HF), Ultra High Frequency (UHF) and frequencies in the Gigahertz-area (GHz).81 Which
frequency is chosen depends on the area a tag shall be used. When it is important to use little
power, penetrate non-metallic substances, and range is secondary, LF tags stand out. HF tags
are considered in a metal area and when high range is important. UHF tags have an even better
read range and are faster, but the disadvantage is, that they need more power and cause
problems in passing through materials.82
3.3.2.3 Smart Label
Nowadays, as RFID is not implemented in majority and still has little malfunctions a redundant
combination of Barcode and RFID called Smart Label is favorable for many companies. A Smart
Label consists of a Barcode with an embedded paper-thin RFID tag.83 Additionally, “various
80 http://www.autoid.org/2002_Documents/sc31_wg4/docs_501-520/520_18000-7_WhitePaper.pdf. 81 Finkenzeller, p. 13. 82 http://www.rfidjournal.com/faq/17/61. 83 Finkenzeller, p. 19.

Chapter 3 – Theory 33
types of information, such as the sender and recipient addresses, product information, and free-
form text, can be printed on the label”.84
3.3.2.4 Comparison of RFID with Barcode
Dissimilar utilizations go hand in hand with different requisitions towards Auto ID systems. For
example, in access control the reliability of an identification system is of greater importance than
its efficiency, whereas in a material flow efficiency and low price have to be considered. The
obvious “difference between Barcode and RFID is bar codes are line-of-sight technology.”85
Therefore the Barcode on an object has to be oriented towards the reading device (scanner) or
the other way round to be read. This is in contrast to RFID, wherefore an object with an RFID
tag has only to be within the RFID systems reader range. Furthermore, standard Barcodes only
identify the manufacturer or product and not the unique item. “The bar code on one milk carton
is the same as every other, making it impossible to identify which one might pass its expiration
date first.“86 The following table shows a summarizing comparison of the two systems:
System parameters Barcode RFID
Typical data quantity (bytes) 1-100 Typically 16-64k
Data density Low Very high
Readability by machine Good Good
Readability by people Limited Impossible
Influence of dirt/damp Very high No influence
Influence of (opt.) covering Total failure No influence
Influence of direction and position Low No influence
Degradation/wear Limited No influence
Relevant Standards EAN Code 39, Code
128
EPC Class 0 / 1, ISO
15693, ISO 18000-X
Purchase costs Very low Medium
Operating costs (e.g. printer) Low None
Security High Very high
Reading speed (including handling of data carrier) Slow ~4s Very fast ~0,5s
Maximum distance between data carrier and reader 0-50 cm 0-5m
Simultaneous registration of items No Yes
Figure 15. Comparison of RFID with Barcode (adapted from: Finkenzeller, p. 8)
84 Lahiri, p 7. 85 http://www.rfidjournal.com/faq/16/50. 86 http://www.rfidjournal.com/faq/16/50.

Chapter 3 – Theory 34
3.3.3 General benefits of RFID
The benefits of RFID in a supply chain are multifariously. The major benefits of RFID are
• inventory reduction (improved visibility into store activities by higher accuracy of data),
• labor reduction (efficient processing in production and dock / carrier utilization),87 and
• out-of-stock reduction (more accurate demand data).88
Sub benefits are among others:89
• improved warehouse management,
• improved demand planning,
• reduction in theft,
• reduction of counterfeited products,90
• avoidance of misplacing,
• more efficient processing in dock operations and carrier utilization,
• improved quality control through writeable transponders.91
3.4 Hypothetical impacts of RFID on the information exchange
Having defined theoretical issues as information exchange in a retail supply chain and its
measuring with the DSCC model as well as RFID technology, hypotheses about impacts of
RFID on the information exchange in a retail supply chain can be emerged. Information
exchange is composed in the DSCC model of both indicators Information Extent and
Information Intensity, which multiplied and weighted result in the DSCC measure. By looking on
the gained DSCC measure, information exchange can be directly read off. If at least one of
these indicators is altered, the DSCC measure will be changed.
As mentioned in the DSCC model, all weights of importance remain constant and have not to be
analyzed further. These weights consist of the general importance of customers (l1 and k1) or
suppliers (l2 and k2), the importance of sharing information with customers (w1d, w2
d) or suppliers
(w1u, w2
u) and the relative importance of sharing supply information with customers (p1d, p2
d, p3d)
or suppliers (p1u, p2
u, p3u). Moreover, the importance of time properties and aggregation for
87 http://retailindustry.about.com/cs/it_rfid/a/bl_atk111003.htm. 88 Jilovec, p. 100. 89 http://apps.qinetiq.com/perspectives/pdf/rfids.pdf. 90 Bhatt / Glover, p. 2. 91 Finkenzeller, p. 345.

Chapter 3 – Theory 35
demand information from customers (a1d, a2
d, a3d, a4
d, a5d) or towards suppliers (a1
u, a2u, a3
u, a4u,
a5u), for inventory, capacity, and schedule information towards customers (b1
d, b2d, b3
d, b4d), (c1
d,
c2d, c3
d, c4d), and (d1
d, d2d, d3
d, d4d) or from suppliers (b1
u, b2u, b3
u, b4u), (c1
u, c2u, c3
u, c4u), and (d1
u,
d2u, d3
u, d4u), respectively.
3.4.1 Information Extent
Repeating, Information Extent is the level of how far a firm shares information with its partners,
expressed with the number of levels of customer information a company uses (cj) and the
number of levels of supplier information a company uses (sj). In general, Information Extent
would be modified, if the use of RFID changes the depth of information used towards customers
as well as suppliers in a supply chain network.92
Companies in supply chain networks strive to give and also receive information to adjust
across-company spanning processes on each other.93 Through the use of RFID the quantity of
data captured and transmitted to an information system is enlarged and simultaneously more
accurate and in real-time.94 Therefore, information can be automatically shared via the
information system with customers as well as suppliers, even across supply chain members,
which in turn plan with this data. This sharing of information proceeds in turn up to the ultimate
customer as well as supplier. By means of that, RFID can be seen as a catalyst to a company
spanning information system coordinating a supply chain.
A hypothesis concerning the Information Extent can be formulated. The number of levels of
information used could be increased through RFID to the theoretical maximum, given with the
total number of levels towards the company’s ultimate customer (ci) as well as ultimate supplier
(si). That means that Information Extent in sum can be increased up to the theoretical maximum
of 100 per cent.
3.4.2 Information Intensity
Information Intensity is the knowledge of mutual information about demand (D), capacity (C),
inventory (N), and production schedule (S). Each of these information types can be formulated
as a function of both, time and aggregation properties of the information used. In general, 92 Barut et al., p. 163. 93 Wærn, Y., p. 118. 94 http://apps.qinetiq.com/perspectives/pdf/rfids.pdf.
Chapter 3 – Theory 36
Information Intensity would be affected, if RFID changes the richness of information used in
both directions, from and towards customers, called customer coupling, and from and towards
suppliers, known as supplier coupling.
The relation and information sharing between a distributor and its suppliers as well as between
this distributer and its customers are interdependent within a retail supply chain. Thus, it can be
assumed that the consequences of an RFID implementation have the same tendency for both
relations. Because it can be said that information in general becomes more accurate, real-time,
and data amount is higher with RFID in use, information sharing rises.95
3.4.2.1 Customer coupling
The intensity of customer coupling could be increased, if information about demand from
customers as well as information about inventory, capacity, and schedule towards customers
increases.
Information about demand from customers:
RFID provides more accurate and real-time information for each level of a supply chain.96 For
the supplier, this information is provided through RFID “with timely and accurate information on
actual sales level at the retail store (…) [to] reduce its safety stock levels, thus allowing it to
lower its investment in inventory”.97 Demand management thereby becomes more and more
consumption-based; forecasts with customer demand and historical information replaced by
real-time demand signals, loose of importance.98 All this leads to the hypothesis that RFID
increases demand information from customers.
Information about inventory, capacity, and production schedule towards customers:
By utilizing RFID, totally automated identification of products along a supply chain increases
“inventory visibility through out the entire supply chain. The improved inventory visibility will
benefit every player of the system.”99 Studies have shown that sharing of inventory information
between suppliers, a distributor and its customers not only improves supply chain fill rate, but
also reduces supply chain inventory.100 RFID “can be used to provide an accurate picture of
95 http://apps.qinetiq.com/perspectives/pdf/rfids.pdf. 96 Baskerville / Mathiassen et al., p. 149. 97 Lee, H. L. et al., pp. 14-15. 98 http://www.k2b.net/pdfs/k2b_resourcelibrary_forrester.pdf. 99 Lee, Y. M. et al., p. 2. 100 Li et al., p. 2.

Chapter 3 – Theory 37
actual inventory levels along the supply chain.”101 That means, with real-time information about
the quantity and location of goods customers can be provided with requested lead times and
other useful information about inventory. And these thoughts hypothesize that RIFD can
heighten inventory information towards customers.
With RFID and resulting “proper planning the need for over-time and last minute spending on
extra capacity from external resources diminishes.“102 Information about capacity can get more
accurate and processed faster due to the improved planning through RFID. The authors guess
that capacity information towards customers gets higher by RFID due to the above mentioned
reasons.
Production schedule information does not exist in the relation between a distributor and its
customers, because the distributor has no production and therefore no production schedules.
Consequently, an influence of RFID on the production schedule information towards customers
is not derivable.
3.4.2.2 Supplier coupling
The intensity of supplier coupling could be increased, if information about demand towards
suppliers as well as information about inventory, capacity, and schedule from suppliers
increases.
Information about demand towards suppliers:
Demand information of a distributor is established dependent on the demand information
coming from the relation between this distributor and its customers. Therefore, the same
hypothesis as in this relation can be stated for demand information passed on towards suppliers
in the relation between this distributor and its suppliers. All this leads to the same hypothesis as
in the customer coupling that RFID increases demand information from customers.
Information about inventory, capacity, and production schedule from suppliers:
Because the general rational arguments in the relation between a distributor and its customers
result in heightened inventory information sharing, it can also be assumed that RFID can
heighten inventory information from suppliers as in the customer coupling.
101 Lee, H. L. et al., p. 14. 102 Lee, H. L. et al., p. 15.

Chapter 3 – Theory 38
By virtue of the conclusive arguments in the relation between a distributor and its customers,
the hypothesis can be derived that capacity information from suppliers also increases through
RFID in the supplier coupling.
Production schedule information exists in the relation between a distributor and its suppliers.
Production scheduling can be improved through RFID, reducing among others changeover
cost.103 As stated in section 3.1.1.4, production scheduling depends on the other information
types shared. Consequently, it can be assumed that information about production schedules
from suppliers can be higher by using more accurate RFID data in production scheduling.
3.4.3 Overview of hypothetical impacts
To sum up the hypothetical impacts of RFID on the DSCC measure, the following table gives a
short overview of the possible changes of each affected DSCC variable:
Information Extent towards customers (IEd) Information Extent towards suppliers (IEu)
cj increasing sj increasing
Information Intensity - Customer Coupling (IId) Information Intensity - Supplier Coupling (IIu)
Dd increasing Du increasing
Sd constant Su increasing
Nd increasing Nu increasing
Cd increasing Cu increasing
Figure 16. Hypothetical impacts of RFID on DSCC
103 Lee, Y. M. et al., p. 15.

Chapter 4 – Empiric 39
4 Empiric
This chapter contains the empiric data collected through a case study performed at Metro Group. To begin with,
involved companies and interview partners are introduced. The following paragraphs present the regarded supply
chain and process without as well as with RFID in use. Subsequently, a questioning for both processes with the
DSCC variables weights of importance, Information Extent, and Information Intensity is shown.
4.1 Company description
4.1.1 Metro Group
Metro Group (following called Metro) is the world's third-largest wholesaling and retailing
company. Metro operates in 30 countries with about 2500 locations and approximately 240.000
employees. Its headquarters is located in Düsseldorf, Germany. Metro was created in 1996 with
the merger of leading retail companies.104
The strength of Metro is based on its sales brands, which agitate independent on the market:105
• Metro Cash & Carry – Global market leader in self service wholesaling,
• Real hypermarkets and Extra supermarkets,
• Media Markt and Saturn – European market leader in consumer electronic retailing,
• Galeria Kaufhof – System leader in the department store business.
As a holding company Metro AG is responsible for strategic management. Operative business
with its sales divisions are divided into “wholesale, food retail, non-food specialty stores and
department stores.”106 Furthermore, cross-divisional service companies provide logistics,
procurement, IT, marketing, real estate, and gastronomy.
An overview of the corporate structure is shown in the following figure:
104 http://www-03.ibm.com/industries/retail/doc/content/news/pressrelease/1244842101.html. 105 http://www.rfidatlas.de/images/stories/RFID_Fallstudien/Metro_Apr06_Konzeption.pdf. 106 http://www.metrogroup.de/servlet/PB/menu/1000080_l2_ePRJ-MetroDE-MAINPAGE/index.html.

Chapter 4 – Empiric 40
Figure 17. Corporate structure Metro Group
(http://www.metrogroup.de/servlet/PB/menu/1000080_l2/index.html)
4.1.1.1 Metro Group Logistics GmbH / Varena Lagerhaus GmbH
Metro Group Logistics GmbH (MGL) is a cross-divisional company of Metro providing all of its
companies worldwide with logistics service. MGL controls from its location in Düsseldorf the
material flows and is responsible for transportation and distribution. Its main task is to handle
merchandize transports from manufacturers to sales divisions.107
Varena Lagerhaus GmbH (Varena) is a warehousing location of MGL.108 Varena supplies the
goods for all Metro Cash & Carry wholesalers in Germany.109 It is the largest RFID-enabled
distribution center in Europe with its 58 RFID gates in goods receiving and goods leaving.110 In
order to give the reader an impression of the Varena distribution center, the following figure
shows a forklift at work at a high rack of Varena:
Figure 18. High rack at Varena (http://www.fir.rwth-aachen.de/ihr/dateien/041203unterlagen-quiede-
zusatz4.pdf) 107 http://www.metrogroup.de/servlet/PB/menu/1000098_l2_ePRJ-MetroDE-MAINPAGE/index.html. 108 http://www.metro-link.com/metro-link/html/en/10731/index.html. 109 http://www.rfidinaction.net/?section=articles&page=114&refid=100&PHPSESSID=
27c3df830e363ed799b313058685c711. 110 According to Hubert Braunshausen, Executive Planning Officer, MGL.

Chapt
The int
assistan
4.1.1.2
Metro G
compan
main ta
network
Therefo
flow at M
4.1.1.3
Metro C
and the
GmbH i
Mülheim
Kettner,
case lev
4.1.2
Procter
world. It
busines
health c
among
Euskirc
Smart L
111 http://112 http://113 http://114 http://115 http://
er 4 – Em
erviewees
nt Holger Ko
Metro Gro
Group Infor
nies worldw
asks are sy
k services,
ore MGI rep
Metro. Matt
Metro Cas
Cash & Car
e global ma
is represen
m are the f
, Store Man
vel yet, to g
Procter
& Gamble
t “manufact
ss divisions,
care; and f
Metro’s big
hen, produc
Labels, and
/www.metrogro/h20219.www2/www.research/h20219.www2/www.rfidatlas
piric
at MGL w
och, Planni
oup Inform
rmation Te
wide – a cro
ystem deve
IT purchas
presents the
thias Robec
sh & Carry
ry (Cash &
arket leade
ted with 61
irst that im
nager of Me
get an insigh
& Gamble
Co. (P&G)
tures and m
, namely “ba
food and b
ggest suppl
cing among
delivering t
oup.de/servlet2.hp.com/servhandmarkets.c2.hp.com/serv.de/images/st
were Hubert
ng Coordin
mation Tech
echnology G
oss-division
elopment, co
se optimiza
e leading p
ck, IT strateg
y
Carry) is o
er in self se
outlets in G
plemented
etro Cash &
ht into good
e Co.
is one of th
markets con
aby, feminin
everage”113
iers, P&G a
g others dis
these cases
t/PB/menu/10vices/cache/83com/reports/2
vices/cache/83ories/RFID_Fa
t Braunsha
ator, both re
hnology Gm
GmbH (MG
al company
onsulting, o
ation and “
part in RFID
gy and RFI
one of Metro
ervice who
Germany. T
RFID on c
& Carry Ess
d receipt pro
he biggest c
nsumer prod
ne, and fam3, offering o
adapted RF
posable dia
s to Varena
000099_l2/inde3969-0-0-225-225503. 3969-0-0-225-allstudien/Pro
ausen, Exec
esponsible
mbH
GI) is the IT
y which is l
operation o
“group-wide
D implemen
D expert wa
o’s internal
lesaling. M
The Cash &
case level. A
lingen, whic
ocesses.
consumer p
ducts for ev
mily care; fa
over 300 b
FID in diver
apers in cas
distribution
ex.html. -121.aspx.
-121.aspx. cter%20&%20
cutive Plan
for Varena.
T service p
located in D
of computer
e coordinat
ntation and
as interview
customers,
etro Cash
& Carry who
An interview
ch has not
packaged go
veryday use
abric and ho
rands in 16
rse process
ses, which a
n center.115
0Gamble_Apr
nning Office
.
provider fo
Düsseldorf
r centers, p
ion of IT s
manages
wed at MGI.
, as mentio
& Carry D
olesalers in
w took plac
RFID imple
oods compa
e.”112 P&G h
ome care; b
60 countrie
ses. Especia
are in turn t
r06.pdf.
41
er, and his
r all Metro
as well. Its
provision of
strategy.”111
information
ned above,
Deutschland
Neuss and
ce with Mr.
emented on
anies in the
has several
eauty care;
es.114 Being
ally P&G in
tagged with
s
o
s
f
n
d
d
n
e
l
g
n
h

Chapter 4 – Empiric 42
4.2 Metro’s supply chain network
At this point, the authors would like to annotate that they are fully aware that every supply chain
is unique. Processes along supply chains differ dependent on company size and industry
sector, and therefore the ways in which certain RFID technology is used, differ as well.
In order to select the population, the authors only consider involved supply chain members,
which have RFID implemented in their processes. Since this research looks upon a retail
environment, a supply chain in this sector normally consists of suppliers, a distributor, and
customers. As mentioned in the limitations of the thesis, the population of the regarded supply
chain contains one supplier, namely P&G, providing its diaper cases with RFID tags and
supplying them to Varena, being in here the distributor and the point of origin of the DSCC
model. The customers are two Cash & Carry outlets located in Neuss and Mülheim, which have
RFID implemented on case level. Cash & Carry as an internal subsidiary of Metro Group is
indeed not a typical customer, but also interacts with upstream and downstream supply chain
partners like all customers from other sectors and can be seen in this case as a ‘real’ customer
from Varena distribution center. The difference of this customer view is only in drawing up the
annual accounts, which are in the case of Metro Group represented in consolidated accounts
and not done for Varena and Cash & Carry separately. This explanation is in line with the
supply chain definition in the theory chapter and only mentioned as a clarification.
4.3 Process description
The herein described process shows the flow of diaper cases from its fabrication in Euskirchen
towards the final supply chain destination Cash & Carry and can be seen as an example for all
processes with similar products in a retail environment. The empiric makes it necessary to
differentiate between several process steps at each of the three entities in the given supply
chain. The steps do not represent a complete activity list for a retail supply chain, because this
thesis has its focus on process steps, involving RFID on case level. The process steps are
mainly those dealing with the physical flow of goods. The information flow proceeding alongside
the material flow is also described in the text, because herein the exchange of information is
important for the DSCC measurement. In order to understand what opportunities can be derived
from RFID on case level, one needs an understanding of the current process and of the
changes with the adaption of RFID. A typical scenario of the workflow is shown in the next
figure. The red marks show where RFID use is possible:

Chapter 4 – Empiric 43
Figure 19. Process chain (adapted from: http://www.rfid-ready.de/49-0-rfid-geschaeftsprozesse.html)
4.3.1 Process without RFID in use
P&G plant in Euskirchen:116
1. Production – Disposable diapers with the brand name Pampers are fabricated at the
P&G factory in Euskirchen.
2. Packaging – Pampers are packed in packages and in turn in cases. Every case receives
a Barcode label or print. The cases with the diaper packages inside are finally put on a
pallet. When the pallet is full, it is shrink-wrapped and also tagged with a Barcode.
Afterwards, the full pallets are sent to P&G’s warehouse.
3. Goods issue and dispatch – In the warehouse, the pallet is either rolled in or immediately
made ready for dispatch. At the pickup at the shipment dock, a bill of delivery is
generated on the basis of the received order form and is attached to the pallet or given
to the truck driver with an identification number which is relatable to the order. The driver
has to sign the bills and load the pallet onto his truck. The warehouseman inscribes the
leaving pallet in the ERP system, so that the ERP knows the dispatch of the pallet.
Varena distribution center in Unna:117
4. Shipment receipt – The truck arrives with the shipment. The bill of delivery that was
attached to one of the pallets or given to the driver is then checked with the order data in
the goods receipt. The Barcode on the pallet is scanned manually when the pallet is
unloaded. The cases on the pallet are manually counted to compare the physical
delivery with the bill of delivery and are checked for quality and damage. A new barcode
label is attached on each received pallet and is deposited in the in house ERP system to
know product, quantity, and delivery data of the pallet.
116 http://www.rfidatlas.de/images/stories/RFID_Fallstudien/Procter%20&%20Gamble_Apr06.pdf. 117 http://www.alexandria.unisg.ch/EXPORT/DL/21492.pdf.

Chapter 4 – Empiric 44
5. Rolling in and out – A forklift driver manually reads the new barcode on pallet for
identification and transfers the pallet to a storage area. Either the forklift driver manually
scans the barcode on the pallet again or enters the pallet location in the inventory
management system to update goods in stock and pallet location data.
6. Picking / packing – Accordant to the orders from each Cash & Carry outlet, the pallet is
scanned manually at storage location and corresponding supplies are transferred to the
picking area. A Picker picks the indicated number of cases and inscribes the number of
cases picked for verification in Cash & Carry’s ERP system. The cases are packed on a
new pallet. Pampers pallets are usually sent as full pallets, in case of small quantities
pallet is mixed. Thereafter, the pallet is shrink-wrapped. The shrink-wrapped pallet gets
a Barcode associated to the order information from Cash & Carry and is prepared for
dispatch. The driver signs the new bills of delivery and Barcode is manually scanned
with a reader to verify delivery before loading onto the truck.
7. Transportation – Transportation takes place directly without transshipment processes.
Cash & Carry in Neuss or Mülheim:118
8. Order receipt – The truck arrives at a Cash & Carry outlet two times a week in average
and the delivery is manually identified via the Barcode on the pallet and via the bill of
delivery in order to know the content. The delivery is manually checked for completeness
and quality and is compared with the bill of delivery. The bill is in turn compared with the
order data. The delivery gets logged in an internal ERP system with product data,
quantity, and delivery date. Afterwards the registered pallet is stored in a backroom
storage from which the store floor shelves are replenished if needed.
9. Analysis of consumption and forecasting of demand – When Pampers are sold, the point
of sales (POS) data is recorded at the cash desk. The ERP system automatically
generates the actual quantity by subtracting the POS from the debit quantity or the
amount which should be always in shelf. An employee, which is responsible for ordering
diapers, prints out a material-disposition list, representing an actual and debit position of
all P&G products in the outlet. With this list, the employee matches the actual inventory
in shelf with the actual quantity on paper and in case of disparity (shrinkage) corrects the
ERP quantity data. The difference between debit position and actual quantity in shelf is
used to place an order. The order is transferred to MGL over a separate order mask,
which is linked with MGL’s ERP system. This data is in turn the information for MGL
about forecasted demands, because only needed products are placed in shelves for
sale. The continuous demand for Pampers goes in line with this attitude. 118 http://www.alexandria.unisg.ch/EXPORT/DL/21492.pdf, Correspondent to Mr. Kettner, Store Manager, Metro Cash & Carry Esslingen.

Chapter 4 – Empiric 45
4.3.2 Phases of RFID implementation
Metro began to implement RFID in its supply chain in November 2004. 20 suppliers adapted
passive Smart Labels on pallets within the start of the first roll-out phase.119 Successively, the
number of suppliers will be raised to 100.120 In this roll-out eight distribution centers and 269
retailers/wholesalers take part, among them the distribution center Varena, responsible for
supplying all 61 Cash & Carry wholesalers in Germany.121 So far not all Cash & Carry outlets
have RFID in use. Only two of the mentioned 61 wholesalers have RFID implemented on case
level already.122 To help further partners and in-house companies with the preparation of RFID
implementation, an innovation center was established in Neuss, where simulations of processes
concerning RFID along a supply chain are possible.123 In July 2006, the RFID processes at
Metro are converted to a new standard, namely EPCglobal Class1 Gen. 2 transponder
generation.124 After that, the second implementation phase standing for RFID implementation on
retail units, namely cases and cartons started in September 2006. In the future, the projected
third roll-out phase intends to continue RFID implementation on retail units and included inner
packs. An item level tagging in broader range than pilot studies is not in the RFID roll-out focus
at the moment.125 The following figure shows a timetable of the RFID implementation phases at
Metro.
Figure 20. RFID roll-out phases at Metro
119 http://www.warehouse-logistics.com/download/DE_Vortrag_WMS2005_5.pdf. 120 http://www.metrogroup.de/servlet/PB/menu/1011429_l1/index.htm. 121 http://www.rfidatlas.de/images/stories/RFID_Fallstudien/Metro_Apr06_Konzeption.pdf. 122 According to the telephone interview with Matthias Robeck, IT Strategy and RFID expert, MGI. 123 http://www.metrogroup.de/servlet/PB/menu/1011429_l1/index.htm. 124 http://www.ikr.uni-stuttgart.de/Content/itg/fg524/Meetings/2006-01-27-Bremen/1-1-IBM-workshop-uni-bremen.pdf. 125 http://www.etrics.org/workshops/etrics2006_metro_robeck.pdf.
Phase 1
Logistic Units (Pallets)Start: 11/2004
Phase 2
Retail Units (Cases)Start: 09/2006
Phase 3
Retail Units (Inner Packs)
Start: Future

Chapter 4 – Empiric 46
4.3.3 Facts of RFID technology along the process chain
To identify pallets and cases, Varena has 58 RFID equipped dock-doors. For Auto ID at Cash &
Carry’s goods receipt, RFID gates are installed for automatic identification of incoming
deliveries. A specialty of the applied RFID technology is the support of standard requirements of
Metro stores and also Wal-Mart Stores Inc.126 Used tags are Smart Labels in a passive format
with a ‘write once’ and ‘read many’ capability. The used frequency is UHF 865 MHz. IBM
Websphere RFID Device Infrastructure is used as middleware, connecting the identification of
items with Varena’s ERP system. The read performance at Varena is 99.6 per cent compared to
Barcode, which has only a read accuracy of 87 per cent.127 To get an impression of the named facts the following figure shows the goods receipt at Cash &
Carry in Neuss. RFID-enabled delivery is driven through the RFID gate for automatic
identification:
Figure 21. Metro Cash & Carry goods receipt (http://logging.mgi.de/ObjectTracking/www.future-
store.org/servlet/PB/show/1004005/off-presse-Bildmat-Rollout-Abb02.zip)
4.3.4 Process changes with RFID in use
P&G plant in Euskirchen:128
1. Production
2. Packaging – Instead of a Barcode every case receives a Smart Label in order to
guarantee readability in case of having problems with RFID equipment.
3. Goods issue and dispatch – Identification before placing at the shipment dock happens
via automatic scanning of Smart Labels on cases, when the pallet passes through an
RFID gate. 126 http://www.rfidatlas.de/images/stories/RFID_Fallstudien/Metro_Apr06_Konzeption.pdf. 127 http://www.rfidinaction.net/?section=articles&page=114&refid=100&PHPSESSID=27c3df830e363ed799b3130586
85c711. 128 http://www.rfidatlas.de/images/stories/RFID_Fallstudien/Procter%20&%20Gamble_Apr06.pdf

Chapter 4 – Empiric 47
Varena distribution center in Unna:129
4. Shipment receipt – Smart Labels on the cases are automatically scanned when the
pallet is unloaded and driven through the RFID gate. The physical delivery is
automatically compared with an electronic bill and a storage area is automatically
assigned by the inventory management system.
5. Rolling in and out – When forklift driver arrives, Smart Labels on the cases are
automatically captured to identify the product. When the pallet is placed on the storage
area assigned by the information system, the forklift driver confirms accomplishment of
the storage task, and the inventory management system updates goods in stock.
6. Picking / packing – Smart Labels on the cases are automatically read when forklift
transfers the pallet to the picking area. In the picking area, Smart Labels on cases are
automatically read again in order to record and verify the number of cases picked. As
picking accuracy has already been assured in the picking process by reading the Smart
Labels of the cases picked, there is no longer a need to conduct sample counting. When
the pallet with the picked cases is loaded onto the truck, Smart Labels on the cases are
automatically read in order to verify delivery when driving through an RFID gate.
7. Transportation
Cash & Carry in Neuss and Mülheim:130
8. Order receipt – The delivery is automatically identified via the Smart Labels on the
cases, when pallet is unloaded and driven through an RFID gate. Information, which is
gained from Smart Labels on the cases, can be used to automatically compare the
physical delivery with an electronic bill of delivery. Smart Labels on the cases moving
between the backroom storage and the store floor are automatically read, when passing
the RFID gate that is located between the backroom storage and the store floor. Cash &
Carry’s ERP system is used to realize a separation between inventory in backroom and
on store floor.
9. Analysis of consumption and forecasting of demand – The demand of disposable
diapers is automatically generated, when diaper cases are transferred through the RFID
gate at the exit of the backroom storage in order to replenish the shelves in the store.
The ERP system automatically forwards the quantity of diaper cases, which passes
through the RFID gate between backroom and store floor, to MGL at the end of the day.
With this information, MGL can plan future orders, which will surely be initiated by Cash
& Carry at a later date.
129 http://www.alexandria.unisg.ch/EXPORT/DL/21492.pdf. 130 http://www.alexandria.unisg.ch/EXPORT/DL/21492.pdf.
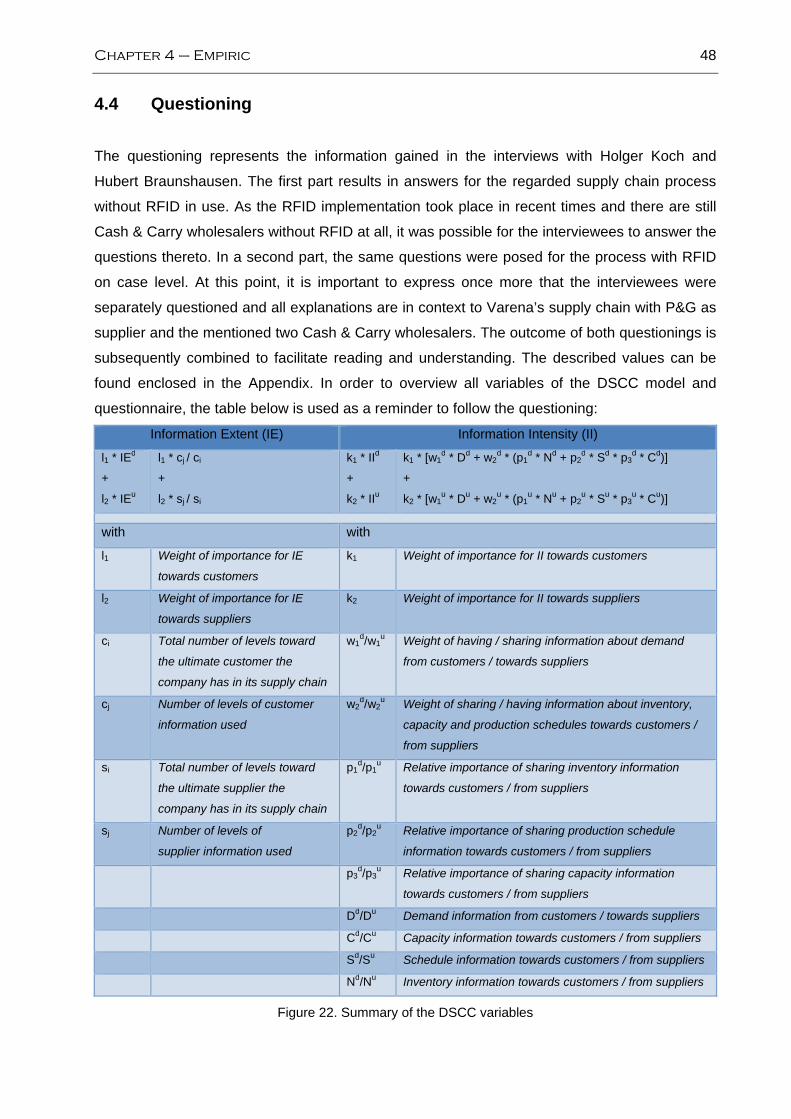
Chapter 4 – Empiric 48
4.4 Questioning
The questioning represents the information gained in the interviews with Holger Koch and
Hubert Braunshausen. The first part results in answers for the regarded supply chain process
without RFID in use. As the RFID implementation took place in recent times and there are still
Cash & Carry wholesalers without RFID at all, it was possible for the interviewees to answer the
questions thereto. In a second part, the same questions were posed for the process with RFID
on case level. At this point, it is important to express once more that the interviewees were
separately questioned and all explanations are in context to Varena’s supply chain with P&G as
supplier and the mentioned two Cash & Carry wholesalers. The outcome of both questionings is
subsequently combined to facilitate reading and understanding. The described values can be
found enclosed in the Appendix. In order to overview all variables of the DSCC model and
questionnaire, the table below is used as a reminder to follow the questioning:
Information Extent (IE) Information Intensity (II)
l1 * IEd
+
l2 * IEu
l1 * cj / ci
+
l2 * sj / si
k1 * IId + k2 * IIu
k1 * [w1d * Dd + w2
d * (p1d * Nd + p2
d * Sd * p3d * Cd)]
+
k2 * [w1u * Du + w2
u * (p1u * Nu + p2
u * Su * p3u * Cu)]
with with
l1 Weight of importance for IE
towards customers
k1 Weight of importance for II towards customers
l2 Weight of importance for IE
towards suppliers
k2 Weight of importance for II towards suppliers
ci Total number of levels toward
the ultimate customer the
company has in its supply chain
w1d/w1
u Weight of having / sharing information about demand
from customers / towards suppliers
cj Number of levels of customer
information used
w2d/w2
u Weight of sharing / having information about inventory,
capacity and production schedules towards customers /
from suppliers
si Total number of levels toward
the ultimate supplier the
company has in its supply chain
p1d/p1
u Relative importance of sharing inventory information
towards customers / from suppliers
sj Number of levels of
supplier information used
p2d/p2
u Relative importance of sharing production schedule
information towards customers / from suppliers
p3d/p3
u Relative importance of sharing capacity information
towards customers / from suppliers
Dd/Du Demand information from customers / towards suppliers
Cd/Cu Capacity information towards customers / from suppliers
Sd/Su Schedule information towards customers / from suppliers
Nd/Nu Inventory information towards customers / from suppliers
Figure 22. Summary of the DSCC variables

Chapter 4 – Empiric 49
4.4.1 Information Extent without RFID
Analogous to the questionnaire, the authors started the formal part of their interview with the
indicator Information Extent. The distribution center Varena seen before RFID implementation
has two total levels towards the final customer (ci), because between Varena and the consumer
there is only Cash & Carry as an intermediary in this supply chain constellation. The consumer
is provided with diapers by Cash & Carry wholesalers. In supplier direction, there are three total
levels of suppliers (si), the first level is the direct supplier Procter & Gamble producing diapers,
on the second level are Tier-2 suppliers, for example 3M Company as producer of adhesive
tapes for diapers, and at least on the third level raw material suppliers of 3M. In this context,
information is only shared with the direct customer Cash & Carry on the first level (cj) and with
the direct supplier P&G on the first level (sj) as well. Mr. Koch saw the weight of importance
towards customers (l1) higher than towards suppliers (l2), but was unsure about a concrete
value, because the weights are a strategic question of policy. Fortunately, Mr. Braunshausen
was able to rate these weights later on and determined the importance of customers with 0.7
and of suppliers with 0.3 going in line with the estimation of his planning coordinator. He
furthermore explained that these weights have to be seen holistic. For instance, in the view of
the purchasing department the numbers could be the other way round. For most companies
customer promotion and resulting demand are more important than supplier collaboration that is
secured with long-term contracts in most cases and based on a mutual dependency.
4.4.2 Information Intensity without RFID
For the weights of time and aggregation properties of information, Mr. Braunshausen sadly did
not see graduation of the parameters, so they are all weighted equal. For the parameters b, c,
and d the weight is 0.25 and for the parameters a 0.2, because demand information furthermore
depends on product structure (X5).
4.4.2.1 Customer coupling
Mr. Braunshausen determined the weight of Information Intensity towards Cash & Carry (k1)
with the value of 0.7, since Varena and Cash & Carry outlets as Metro Group members regard
customer needs as more important. Mr. Braunshausen saw greater importance in having
demand information from Cash & Carry outlets than giving information about inventory,
schedules, and capacity towards Cash & Carry. Thus, he weighted the importance of having

Chapter 4 – Empiric 50
demand information from Cash & Carry (w1d) with 0.8 and of giving information about inventory,
schedule, and capacity towards Cash & Carry (w2d) with 0.2.
Information about demand from customers:
Independently, both interviewees stated a long-term planning horizon (H) of one year, seen as
364 days to match a daily time-scale. MGL assumes that there is a steady demand from Cash &
Carry for the logistics planning at Varena. MGL uses one year as the longest planning horizon
at all. Mr. Koch described that current orders from Cash & Carry are used as forecast basis,
because of representing consumer demand in the future. For the product Pampers, it can be
assumed that demand in a following week is nearly the same as the current demand seen in
orders. This forecasted demand data from Cash & Carry was received between one and three
times a week when Cash & Carry placed an order by using an order system that transferred the
order data via a mask of MGL’s ERP system to MGL. The order can be seen here as forecasted
demand information. Mr. Koch additionally explained that demand information should optimally
be sent every day Cash & Carry is opened. But in reality, a material-disposition list for P&G
products was only filled in one to three times a week and transferred to MGL, because it was
impossible to determine actual need of diapers on another way due to shrinkage. Mr.
Braunshausen estimated that demand information was received two times a week and was
therefore able to state a more exact value compared to his assistant. Summarizing, this means
an interval between new forecasted demand information of two times a week and therefore two
multiplied by 52 weeks a year is equivalent to 104 periods (n), in which the planning horizon is
divided. For the regarded product Pampers, re-planning took place every week with the
consequence of 7 days re-planning length (P). While only researching the supply chain of
Varena as one distribution center, Varena is the direct supplier of all German Cash & Carry
outlets and does not have further locations. This provides full information about geographic data
such as demand data of each Cash & Carry location for distribution planning, and therefore both
interviewees see the degree of aggregation with respect to geography (X4) in the definition of
the DSCC model at 100 per cent. Forecasted demand information is completely aggregated to
the top-level of product structure and not shared in detail by describing sub-components of a
diaper. The degree of aggregation with respect to product description (X5) is therefore zero
accordant to Mr. Koch and Mr. Braunshausen.
Information about inventory, capacity, and production schedule towards customers:
The inventory information from Varena was available for Cash & Carry outlets on a daily data
basis (H/n), but only used when placing an order twice a week (P). Mr. Koch saw difficulties in
combining this information with a planning horizon. The product availability as a provided status
of MGL’s ERP system used by Cash & Carry has to be set to the lowest possible planning

Chapter 4 – Empiric 51
length (H), because the inventory status is only renewed when looking in the order mask twice a
week to have actual inventory levels. Therefore Cash & Carry’s planning is adjusted due to the
fact that inventory information is getting outdated. As the planning horizon (H) is quantified as
three and a half days, the number of periods adapted to three and a half periods (n) therewith.
Mr. Braunshausen stated that inventory information is always available for Cash & Carry, but
only used every order day when getting an order acceptance. Mr. Braunshausen determined
the weight for sharing inventory information with the customer (p1d) at 0.8. Varena did not
provide Cash & Carry with capacity information and schedule information. Although, no capacity
and schedule information is given to Cash & Carry, these weights are independent from the use
of this information types and are indispensable for the DSCC measurement. Mr. Braunshausen
weighted the importance of sharing capacity information (p2d), which is hard to quantify for a
distribution center of this size, with 0.2. He explained that with available capacity information
Cash & Carry could be provided with more accurate information for allocating their orders to
different distributors, but information about capacity is not used and Varena is only one
distribution center meanwhile. Consequently, there is no importance of sharing scheduling
information (p3d), resulting in a weight of zero. Because Varena has not more than one
distribution center for delivering Cash & Carry wholesalers, information about geography of
Varena’s logistics locations is not used for the planning of Cash & Carry. Therefore, the degree
of aggregation with respect to geography (X4) is zero.
4.4.2.2 Supplier coupling
Mr. Braunshausen determined the weight of Information Intensity towards P&G (k2) with a value
of 0.3 as a result of the in the customer coupling defined value k1 (0.7). He saw greater
importance in sharing demand information from Varena with P&G than receiving information
about inventory, production schedules, and capacity. Thus, he weighted the importance of
giving demand information towards P&G (w1u) with 0.6 and of receiving the other information
types from P&G (w2u) with a value of 0.4.
Information about demand towards suppliers:
Mr. Koch and Mr. Braunshausen saw the time horizon (H) of forecasted demand information
used by P&G in a quarterly range (91 days) because of frame contracts in this time-span.
Varena’s forecasted demand data was given to P&G every week to provide an aggregation of
Cash & Carry demand forecasts. Therefore, the planning horizon was divided into 13 time
periods (n). Mr. Koch was unsure about the further use of demand information at P&G. Mr.
Braunshausen explained that transmitted order data was used for re-planning (P) as provided
by MGL weekly (re-planning length is 7 days) to calculate a sufficient delivery throughout the
Chapter 4 – Empiric 52
week from the side of P&G. Because Varena has only one supplier for Pampers, namely the
Procter & Gamble plant in Euskirchen, geography information cannot be used, and therefore the
degree of aggregation with respect to geography (X4) is zero. Forecasted demand information
was completely aggregated to the top-level of the product, and not shared in detail by
describing sub-components of a diaper. Therefore, the degree of aggregation with respect to
product description (X5) is also zero. Mr. Braunshausen added that an aggregated information
passing-on is used for all products at Varena distribution center.
Information about inventory, capacity, and production schedule from suppliers:
Mr. Koch said that neither inventory nor schedule or capacity information is shared from P&G.
This was stated again by Mr. Braunshausen, commenting that the Pampers supply is arranged
through a mutual frame contract between P&G and Varena and is based on future demand
information of Varena. The greatest importance for MGL would be in having inventory
information (p1u) from P&G, which results in a weight of 0.6. Quantifying his expectations of
shared schedule and capacity information, Mr. Braunshausen weighted schedule information
from P&G (p2u) with 0.1 and capacity information from P&G (p3
u) with 0.3. As in the customer
relation, the constant parameters a, b, c and d were quantified equal in their allocation. Because
P&G has not more than one production facility for Pampers, responsible for Varena, information
about geography of P&G’s production and logistics locations is not used for MGL’s planning.
Therefore, the degree of aggregation with respect to geography (X4) is zero.
4.4.3 Information Extent with RFID
The second execution of the questionnaire started with the same levels of suppliers and
customers for the regarded supply chain. Both interviewees declared that from the two levels
(ci) in customer direction only one level (cj) is used, seen in the direct customer. Also still only
one (sj) out of three total levels (si) in supplier direction is used for information sharing. Mr. Koch
explained this is the case because the RFID implementation is still in its infancy and only
implemented in the relation towards direct suppliers and direct customers, such as P&G and
Cash & Carry. Similar to the questionnaire without RFID, Mr. Koch could not provide the authors
with values for the weights, but said that strategic decisions are normally not affected by the
implementation of a new technology. This means, according to Mr. Braunshausen that the
weights of importance towards customers (l1) and towards suppliers (l2) stay equal.

Chapter 4 – Empiric 53
4.4.4 Information Intensity with RFID
Mr. Braunshausen declared that all weights of sharing information with customers (k1) and
suppliers (k2), the weights of receiving demand information from customers (w1d) and giving
supply information towards customers (w2d), as well as the weights of receiving supply
information from suppliers (w1u) and giving demand information towards suppliers (w2
u) are
equally weighted as in the previous considerations without RFID. The weights of information
about inventory, capacity, and schedules are also still the same, because RFID does not affect
predetermined strategic management decisions, which are expressed in these weights.
Moreover, the same applies for the weights of time and aggregation properties (a, b, c, d) of
information used.
4.4.4.1 Customer coupling
Information about demand from customers:
The planning horizon (H) stays long-term with one year for Mr. Koch and Mr. Braunshausen.
Forecasted demand data is received daily due to automated data forwarding through RFID and
therefore the number of periods in the planning horizon (n) is increased to 364 days. Mr. Koch
sees a great advantage in this enlarged information flow, because planning gets smoother for
MGL. Mr. Braunshausen stated the same. The operative re-planning is according to Mr. Koch
still at one week for Pampers and therefore the length of re-planning period (P) is seven days.
The question arose, why re-planning is not done more frequently for having a larger data-basis.
Mr. Koch as well as the second interviewee Mr. Braunshausen explained that with the given
work force re-planning is only possible once a week. Both interviewees were sure that RFID
does not change the degree of aggregation with respect to geography (X4) and the degree of
aggregation with respect to product description (X5).
Information about inventory, capacity, and production schedule to customers:
Mr. Koch stated that also with RFID implemented, Varena does not provide Cash & Carry
wholesalers with capacity information and schedule information. He believes that none of these
information types will be shared in the near future. According to Mr. Koch, the inventory
information shared is still the same. Mr. Koch said that inventory information is only used from
Cash & Carry when looking it up in the information system. Therefore, both interviewees
assumed this frequency stays the same.

Chapter 4 – Empiric 54
4.4.4.2 Supplier coupling
Information about demand towards suppliers:
Both interviewees remarked that all variables are not affected with the use of RFID technology.
Mr. Koch stated that there were no changes in the information passing on to P&G and
forecasted demand data is still aggregated after RFID implementation. The time horizon (H) and
number of periods herein (n) stayed equal, because the frame contract with P&G is independent
of RFID. Therefore, the length of the re-planning period (P) remains at the same level.
Information about inventory, capacity, and production schedule from suppliers:
RFID does also not affect the information sharing in the supplier relation towards P&G stated
Mr. Koch in line with Mr. Braunshausen, because still no information is shared from P&G
through RFID.

Chapter 5 – Analysis 55
5 Analysis
In the analysis chapter the findings of the applied questionnaire are inserted in the DSCC model and computed. Both
gathered results of the DSCC measurement, before and after RFID implementation, are benchmarked. With their
difference the impacts of RFID on DSCC and therewith on the information exchange can be explained. Subsequently,
the results of the analysis are summarized.
5.1 DSCC measurement
The used model measures the degree of coupling between a firm and its customers as well as
suppliers. With the gained empirical data the DSCC and therewith the information exchange can
be measured between Varena and its supplier P&G as well as its customers Cash & Carry. Two
different results are gathered by measuring the DSCC without RFID and once again with RFID
in use. The authors are aware of the problem that both results cannot be seen as absolute
measures. However, the difference of both results indicates in fact the change of the information
exchange by using RFID technology.
5.1.1 DSCC results
The results of the DSCC measurements with regard to Varena’s supply chain are calculated
with the use of a self-made Microsoft Excel sheet [See Appendix 2 a) and b) for measurement
details] and summarized in the next table:
Weights Scores without RFID Scores with RFID
Information Extent (IE) = 45% 45%
- towards customers (IEd) 0.7 50% 50%
• Level of used customer info (cj) 1 1
• Total levels of customers (ci) 2 2
- towards suppliers (IEu) 0.3 33.33% 33.33%
• Level of used supplier info (sj) 1 1
• Total levels of suppliers (si) 3 3
Information Intensity (II) = 51.92% 48%
- Customer coupling (IId) 0.7 59.54% 53.93%
• Information from customers 0.8

Chapter 5 – Analysis 56
o Demand (D) 1 69.42% 62,42%
• Information towards customers 0.2
o Inventory (N) 0.8 25% 25%
o Capacity (C) 0.2 0% 0%
o Production Schedules (S) 0 0% 0%
- Supplier coupling (IIu) 0.3 34.15% 34.15%
• Information from suppliers 0.4
o Inventory (N) 0.6 0% 0%
o Capacity (C) 0.3 0% 0%
o Production Schedules (S) 0.1 0% 0%
• Information towards suppliers 0.6
o Demand (D) 1 56.92% 56.92%
Figure 23. Results of the DSCC measurement
• DSCC without RFID
The Information Extent is 45 per cent, because the value of information towards the
customers (IEd) achieves 50 per cent and towards suppliers (IEu) 33.33 per cent. The
Information Intensity between Varena and its customers Cash & Carry (IId) takes the
value of 59.54 per cent and between Varena and its supplier P&G (IIu) the value of 34.15
per cent. In sum, the Information Intensity is 51.92 per cent. The DSCC without RFID at
Varena’s supply chain achieves a value of 23.37 per cent.
• DSCC with RFID
The Information Extent in sum is still 45 per cent, because the values of the Information
Extent towards customers (IEd) and towards suppliers (IEu) are equal to the results of the
DSCC measurement without RFID, so 50 per cent and 33.33 per cent, respectively. The
Information Intensity between Varena and its customers Cash & Carry (IId) has changed
to 53.93 per cent. The Information Intensity between Varena and its supplier P&G (IIu) is
equal to the DSCC before RFID implementation with the value of 34.15 per cent. In sum,
the Information Intensity has declined to 48 per cent. With RFID in use the DSCC in
Varena’s supply chain is 21.6 per cent.
5.1.2 Benchmark of both DSCC results
As a result of both DSCC measures, the information exchange between Varena and its supply
chain partners is obviously lower when using RFID (21.6 per cent) than without RFID (23.37 per
cent). As mentioned before, both results cannot be seen as absolute measures and only the
Chapter 5 – Analysis 57
difference of both DSCC measures is essential to show the impacts of RFID on the information
exchange in Varena’s supply chain. In order to calculate the difference of both DSCC
measures, other possible influencing factors, which could be included in the DSCC measure
with RFID, have to be considered. The implementation of RFID technology could additionally
bring influences along, such as an adaption of the existing information system or an integration
of a new one. If influencing factors exist, they have to be deducted. The actual difference is
attained through subtraction of the DSCC without RFID from the DSCC with RFID, excluding
other influencing factors:
DIFFERENCE = (DSCCRFID – other factors) – DSCCNO
Even if it is low, a positive difference implies that information exchange between Varena and its
supply chain partners is higher with RFID in use than without RFID implementation. A negative
difference indicates that RFID decreases the information exchange in the supply chain,
compared to its non-use. The size of the difference describes to which extent RFID affects the
information exchange. A high difference means a big impact on the information exchange, a low
difference shows a small impact.
Because involved companies have neither changed the information system nor other business
processes due to the implementation of RFID, no factors of influence are derivable. This is
solidified, as none of the interviewees at MGL was in the know about further changes besides
RFID. The information system has not changed for Cash & Carry, because not all of the
wholesalers use RFID today. The actual difference of both DSCC measures, 21.6 per cent
minus 23.37 per cent, amounts to minus 1.77 per cent.
5.2 Measured impacts of RFID on the information exchange
The negative difference (–1.77 per cent) indicates that RFID implementation decreases the
information exchange in Varena’s supply chain. In order to be able to explain why this difference
is negative, an analysis of the measurement variables weights of importance, Information Extent
and Information Intensity has to be undertaken. All weights of importance remain unchanged in
both measurements. The empiric verification has shown that these weights, concerning
strategic decisions, are not affected by new technologies in general. This result confirms on the

Chapter 5 – Analysis 58
one hand the assumptions of the DSCC model and on the other hand the previous-originated
hypothesis of the authors.131
5.2.1 Information Extent
By looking on the measurement results, the depth of information used in the regarded supply
chain network has not changed after RFID implementation, as the number of levels of customer
information a company uses (cj) as well as the number of levels of supplier information a
company uses (sj) have not changed.
The hypothesis of the authors in section 3.4.1, that the Information Extent towards customers
(cj) as well as towards suppliers (sj) will be extended through RFID integration to the maximum
level possible (ci or si), cannot be confirmed. The extent to which information is shared in
practice is very low. RFID is at an early stage of implementation along Varena’s supply chain
and only used between Varena and its direct supply chain partners P&G and Cash & Carry. For
the levels of supplier information Varena uses, it is important to mention that the profit of RFID
lies on Varena’s side, which pressurizes and financially burdens sub-suppliers of P&G with the
implementation of RFID.132 Especially for small sub-suppliers, there is a lack of inducement to
use RFID, entailing only costs and almost no benefits for them. The number of levels of
customer information Varena uses is influenced by the reason that the consumer as the end of
the supply chain does not see a value added in the use of RFID. Attempts of Metro Group to
involve consumers in RFID-related buying processes at Metro Future Store in Neuss, Germany,
which is fully RFID-equipped, exemplifies innovative achievements in RFID technology, were
less successful. Many consumers refuse RFID due to socio-cultural factors, getting constantly
tracked after buying RFID-marked product cases. Most likely, many consumers avoid to be
directly included in information sharing, because they do not want to share personal
information.133
5.2.2 Information Intensity
By looking on the measurement results, the richness of information used in Varena’s supply
chain network got in sum lower with RFID in use. This stands against the hypothesis of the
authors that Information Intensity increases by using RFID. To analyze this decrease, the 131 Barut et al., pp. 163-165. 132 http://hbswk.hbs.edu/archive/3651.html. 133 Beckwith / Mainwaring, pp. 2-3.

Chapter 5 – Analysis 59
relation between Varena and Cash & Carry (customer coupling) as well as between Varena and
P&G (supplier coupling) have to be regarded.
5.2.2.1 Customer coupling
In sum, the degree of customer coupling is lower with RFID in use than before RFID
implementation. This decrease, in contrary to the authors’ opinion that customer coupling would
be increased, is counterintuitive and possible reasons for this have to be explained further. The
Information Intensity in the relation between Varena and Cash & Carry consists of receiving
information about Cash & Carry’s demand, as well as giving information about Varena’s
inventory, capacity, and production schedule towards Cash & Carry.
Information about demand from customers:
The measure for demand information from Cash & Carry is surprisingly lower with RFID in use.
This lower demand information measure can be explained briefly with the unchanged utilization
of the now more often available information. This conclusion can be logically derived with the
following analysis of the indices for time properties and aggregation of demand information
used. To get these indices, first of all the impacts of RFID must be analyzed on the variables
planning horizon (H), number of periods in the planning horizon (n), and the length of the re-
planning period (P).
The planning horizon (H) is a foreseeable time span, in which all planning decisions about
forecasted demand information from Cash & Carry outlets are considered. In other words, H is
the estimation of “how far into the future a plan is made”134 and depends on decisions of
Varena’s planning department, which is responsible for demand forecasting by using previous
available information about future demand from Cash & Carry. If this estimation is valid, H will
be predetermined as constant. RFID technology allows gathering forecasted demand data fast
and reliable by using RFID gates between the backroom storage and the store floor at Cash &
Carry, which automatically identify Smart Labels of incoming and outgoing cases of the
backroom storage. The information system forwards this data at the end of every day to MGL,
so that information about future orders is available daily (H/n) through an increasing number of
periods in the time horizon (n). The re-planning should be done more frequently, so that the
length of the re-planning period (P) should decrease in the same ratio as frequency of available
demand information (H/n) recedes. But actually, the length of the re-planning period (P) does
not decrease, because demand planning is done for all Cash & Carry outlets and is not
134 Correspondence with John J. Kanet, Ph.D., Niehaus Chair in Operations Management at University of Dayton.
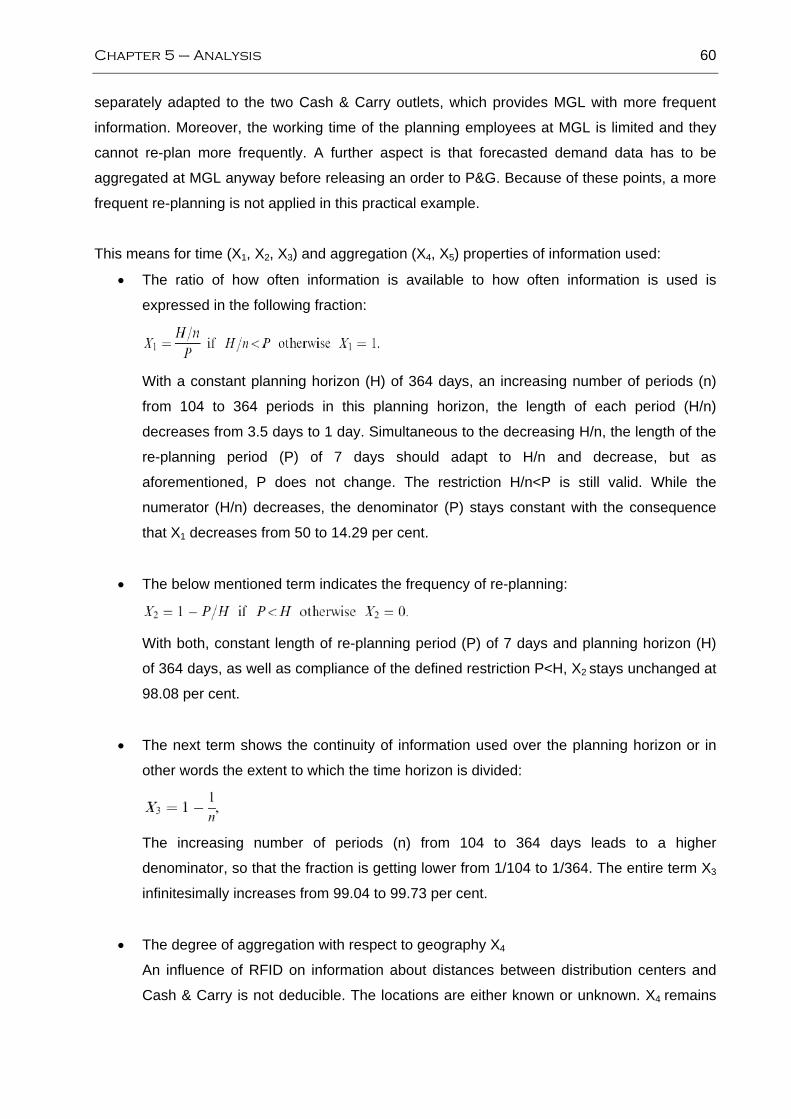
Chapter 5 – Analysis 60
separately adapted to the two Cash & Carry outlets, which provides MGL with more frequent
information. Moreover, the working time of the planning employees at MGL is limited and they
cannot re-plan more frequently. A further aspect is that forecasted demand data has to be
aggregated at MGL anyway before releasing an order to P&G. Because of these points, a more
frequent re-planning is not applied in this practical example.
This means for time (X1, X2, X3) and aggregation (X4, X5) properties of information used:
• The ratio of how often information is available to how often information is used is
expressed in the following fraction:
With a constant planning horizon (H) of 364 days, an increasing number of periods (n)
from 104 to 364 periods in this planning horizon, the length of each period (H/n)
decreases from 3.5 days to 1 day. Simultaneous to the decreasing H/n, the length of the
re-planning period (P) of 7 days should adapt to H/n and decrease, but as
aforementioned, P does not change. The restriction H/n<P is still valid. While the
numerator (H/n) decreases, the denominator (P) stays constant with the consequence
that X1 decreases from 50 to 14.29 per cent.
• The below mentioned term indicates the frequency of re-planning:
With both, constant length of re-planning period (P) of 7 days and planning horizon (H)
of 364 days, as well as compliance of the defined restriction P<H, X2 stays unchanged at
98.08 per cent.
• The next term shows the continuity of information used over the planning horizon or in
other words the extent to which the time horizon is divided:
The increasing number of periods (n) from 104 to 364 days leads to a higher
denominator, so that the fraction is getting lower from 1/104 to 1/364. The entire term X3
infinitesimally increases from 99.04 to 99.73 per cent.
• The degree of aggregation with respect to geography X4
An influence of RFID on information about distances between distribution centers and
Cash & Carry is not deducible. The locations are either known or unknown. X4 remains
Chapter 5 – Analysis 61
with RFID in use compared to its non-use at a value of 100 per cent geography
knowledge.
• The degree of aggregation with respect to product description X5
Because RFID in this example is only used on case level, the information about product
structure is not used, so that no impact on X5 can be measured. X5 remains therefore at
0 per cent.
Conclusively, it is obvious that the decrease of X1 is much higher than the infinitesimal increase
of X3. Due to all other unchanged indices, the measure for demand information decreases in
sum. Quod erat demonstrandum.
Information about inventory, capacity, and production schedule towards customers:
The measure for inventory information towards Cash & Carry remains equal. This can be
explained, because MGL/Varena only shares its inventory information with Cash & Carry
outlets, when an employee of Cash & Carry is placing an order in the order system. The
employee gets Varena’s inventory level and the availability of diapers displayed to determine
lead times of Pampers. RFID neither changes information availability nor information utilization,
because data was also available before RFID implementation and the purchaser of Cash &
Carry does not check the inventory status in the ERP system more often.
Information about capacity towards Cash & Carry is not shared by MGL/Varena and
consequently, it cannot be directly derived that RFID has an impact on capacity information
towards customers or not.
The measure for information about production schedule towards Cash & Carry is still zero after
RFID implementation. As Varena is no manufacturer, there exists no information about capacity
and production schedule and therefore also no exchange of this information. Hereby, it cannot
be directly derived that RFID has an impact on production schedule information towards
customers or not.
5.2.2.2 Supplier coupling
In general, the degree of supplier coupling remains unchanged with RFID compared to without
RFID in use. This finding is not congruent to the assumption of the authors that supplier
coupling would be increased. The Information Intensity in the relation between Varena and P&G

Chapter 5 – Analysis 62
consists of receiving information about P&G’s inventory, capacity, and production schedule, as
well as giving Varena’s demand information towards P&G.
Information about demand towards suppliers:
The measurement shows that the measure for demand information towards P&G remains also
equal. This can be explained, as MGL/Varena only shares its demand information with P&G,
when arranging a frame contract for the future demand of disposable diapers. It would be in fact
possible for MGL/Varena to share demand data more frequently, for example with RFID gates
at the exit of the goods issue in the same manner as done with the RFID gates, installed at
Cash & Carry’s backroom storage. But this is not done yet. The authors gave comments about
this matter for achieving a better utilization of information available from RFID gates at Varena’s
goods issue with P&G.
Information about inventory, capacity, and production schedule from suppliers:
The measures for information about inventory, capacity, and production schedule from P&G is
still zero after RFID implementation. P&G refuses to share its information about capacity,
production schedule, and inventory with MGL/Varena. P&G does not want to give internal
information to MGL/Varena in order to stay independent. Hereby, it cannot be directly derived
that RFID has an impact on these information types or not.
5.3 Results of the analysis
As a result of the analysis, solely the intensity of information about demand from Cash & Carry
is getting lower, because demand information is given more often towards Varena and is
theoretically always available through RFID. The problem is that this more often available
demand information is not used more frequently by MGL/Varena for planning issues. The
information exchange as defined in the theory chapter consists on the one hand of the
information transfer itself by its sender, and on the other hand of the information utilization by its
receiver. In the regarded case, demand information is indeed provided by Cash & Carry more
often (H/n recedes), but is not used from MGL/Varena (P remains constant), so that information
exchange in sum decreases.
Furthermore, the DSCC and therewith the information exchange would be increased, if one of
the indicators, Information Extent or Information Intensity, rises with the use of RFID. The
Information Extent could be increased through RFID, if Varena extends the exchange of

Chapter 5 – Analysis 63
information towards its ultimate supplier or customer. The Information Intensity could be
increased through RFID, if all members of Varena’s supply chain share more types of
information such as about capacity, inventory, or production schedule and simultaneously utilize
this information more often when it is available. In logical words, the length of the re-planning
period (P) would adapt to the frequency of information available (H/n), and consequently the
information exchange would also be risen.

Chapter 6 – Conclusion 64
6 Conclusion
The conclusion chapter of this Bachelor Thesis highlights the research results and gives a course of action for the
regarded supply chain.
6.1 Results in detail
This thesis expounds the impacts of RFID on the information exchange in a retail supply chain
through the model ‘Degree of Supply Chain Coupling’ with an ascertainment without RFID
implementation and an ascertainment with RFID in use. The in return posed research questions
lead to the beneath summarized results:
1. What was the DSCC before and what is the DSCC after RFID implementation
between Varena distribution center and its supply chain partners?
The measurement of Varena’s supply chain with its supplier P&G and its two customers Cash &
Carry leads to an Information Extent of 45 per cent and an Information Intensity of 51.92 per
cent. The multiplication of these values results in a DSCC before RFID implementation with the
value of 23.37 per cent. This means, Varena is coupled with P&G and Cash & Carry as supply
chain partners at a degree of 23.37 per cent.
With RFID in use, the Information Extent remains at 45 per cent, whereas the Information
Intensity of the RFID-enabled supply chain decreases to 48 per cent. In sum, the DSCC
decreases to 21.6 per cent. In other words, Varena and its supply chain partners P&G and Cash
& Carry are coupled to a degree of 21.6 per cent.
Due to the fact that both DSCC measures are absolute values, they have to be either compared
within similar supply chains or set into interrelation in order to be able to interpret the individual
measures. Since, DSCC results in comparable supply chains are not represented in practice,
the second research question give information about this aspect.
2. How has RFID changed the information exchange in Varena’s supply chain?

Chapter 6 – Conclusion 65
By means of both results, a difference of 1.77 per cent is recognized that can be seen as the
change of the DSCC through RFID integration. Counterintuitively, this difference is against the
authors’ expectation negative. The DSCC measure with RFID is therefore smaller than without
RFID. In the regarded supply chain solely an effect on the exchange of demand information
from Cash & Carry was realized. Demand information is available more often (H/n gets higher)
for MG/Varena, but contemporaneously is not used more often (P remains constant) by
MGL/Varena. Thus, it appears that actual information exchange only occurs when information is
transferred by a sender and also utilized by its receiver.
6.2 Course of action
Every model is necessarily limited in its capability to represent reality. However, the authors
believe that the DSCC model provides guidance to retail companies, thinking about the
implementation of RFID solutions or already having RFID integrated in processes. The results
of the thesis’ research questions gives a course of action, which describes possibilities of
handling information for participating supply chain members and similar constellations in the
retail sector in order to improve cooperation ability. Accordingly, a recommended maxim can be
derived – the more frequently information is available, the more often it has to be used to
heighten the Degree of Supply Chain Coupling and therewith the information exchange between
supply chain members.
As stated in the methodology of this Bachelor Thesis, it is scarcely possible to generalize the
gained data, because the case study only took place in one supply chain and for one product
type. Despite of that, it was the ambition of the authors to make the researched data useful for
other retail companies. This intension is fulfilled for the population, Metro Group was chosen
from, under the premise of similar processes, congruent RFID implementation, and comparable
products. This becomes clear when realizing that Metro Group, Tesco PLC, and Wal-Mart
Stores Inc. work together in developing and standardizing RFID in their processes.135 For
instance, the used Smart Labels along the regarded supply chain fulfill the standards of Metro
and Wal-Mart Stores Inc.136
135 http://www.future-store.org/servlet/PB/show/1004155/RFIDnet-Newsletter-01-2005-dt_05-01-10.pdf. 136 http://www.rfidatlas.de/images/stories/RFID_Fallstudien/Metro_Apr06_Konzeption.pdf.

Chapter 7 – Additional Comments 66
7 Additional Comments
This chapter is not a part of the elaboration of this research, but it is essential to reflect the DSCC model and also the
authors’ work. Moreover, the additional comments give a perspective of RFID in collaborative supply chain networks
and for future investigations in this field.
7.1 Reflection
7.1.1 Model criticism and improvement suggestions
The DSCC model only considers general weights and sharing of information types with direct
suppliers and direct customers. General weights concerning Information Extent (l1 and l2) and
Information Intensity (k1 and k2) should be separately assigned to each customer and supplier.
Moreover, the information types of Information Intensity should be also separately allocated to
each customer and supplier. This allocation could make the DSCC measurement more exact.
Moreover, the values for information about inventory (Nu), capacity (Cu and Cd), and production
schedule (Su and Sd) from suppliers and towards customers, respectively, are zero when
information is not shared. Sadly, the empirical data collection in the regarded supply chain does
not provide the requested values in order to gain more exact DSCC measures. In addition, the
determination of the time (X1, X2, X3) and aggregation (X4, X5) properties for planning issues is
unnecessary, as they would be multiplied with the zero-valued information types also zero.
7.1.2 General aspects
Retrospectively, it was most demanding to find a fitting company for the empiric. The reasons
can be seen in the great hype around RFID.137 There are numerous researches and case
studies about this topic. But only few actually conduct an execution with empirical data. As
already mentioned, RFID implementation along a supply chain is only being provided in the
retail sector at the moment. Due to the lack of RFID implementations and the constraint to
Varena’s supply chain, the exchange of information about capacity and production schedule
137 Gaughan, p. 14.

Chapter 7 – Additional Comments 67
was not possible to measure, but as it has turned out, there most probable is no influence on
those with the implementation of RFID. It has to be mentioned that RFID “can no doubt help
make this information more accessible, however it is important to note that as long as the
supply chain partners are unwilling to share this information, no technology will be of help.”138
Another problem was the often misleading information policy of companies, which are
implementing RFID. Even in official statements of Metro, it is implicated to the reader that parts
of their roll-out phases are already finished, whilst in reality it is only a plan. Overall the authors
are satisfied with their process choice within Metro. The research in line with the measurement
profits a lot from the inner-company relation from Varena to its customer Cash & Carry, giving
an outlook how RFID could affect the exchange of information between supply chain partners
without any relation.
In addition, the personal interview involved higher preparation effort than a telephone interview
with the questionnaire, but thereby a better conversation was possible and posed questions
were answered in greater context. As RFID is not totally implemented at Cash & Carry outlets,
the interviewees had no problem in answering questions about the time before RFID. Unluckily,
there was no possibility to visit Varena due to the low workforce over the turn of the year.
7.2 Perspective
Companies are still cautious with the implementation of RFID due to high initial investment
costs of new information technologies. But the past has shown that the Return on Investment
(ROI) was surprisingly prompt achieved. Researches have shown “that the overall, cross-
industry average time it takes a best-in-class organization to recover an RFID investment is
about 30 months and falling, with the low being 18 months and high estimated at about 4
years”.139 Following as a result, it is apparent that RFID usage will increase, but at least in the
beginning, the collaboration will either be forced or benefits have to be divided within a supply
chain. Studying this topic and also being in its beginning, the research center Ko-RFID –
‘efficient collaboration in RFID supported supply chains’ with projects starting in 2007 in the
manufacturing industry has to be mentioned.140 Closing with these future expectations, the great
scientific potential for the chosen topic ‘Impacts of RFID on the information exchange in a retail
supply chain’ is shown, so that further researches can be of interest. 138 Lee, H. L. et al., p. 15. 139 http://www.aberdeen.com/c/report/benchmark/sponsored/RFID_ROI_BenchmarkReport_RK_3504.pdf. 140 According to Dr. Gerrit Tamm, Managing Director Ko-RFID, Humboldt-University, Berlin and KO-RFID.de.

References 68
References
Text books:
Baskerville, R. / Mathiassen, L. / Proes-Heje, J. / DeGross, J. I.: (2005) Business Agility and Information Technology Diffusion, 1st edition, New York: Springer.
Baskerville, R. / Stage, J. / DeGross, J. I.: (2000) Organizational and social perspectives on information technology, 1st edition, Boston / Dordrecht / London: Kluwer.
Bhatt, H. / Glover, B.: (2006) RFID Essentials, 1st edition, Sebastopol: O'Reilly Media. Chase, R. B. / Jacobs, F. R. / Aquilano, N. J.: (2005) Operations Management for Competitive Advantage with Global Cases, 11th edition, New York: McGraw Hill. Cohen, S. / Roussel, J.: (2005)
Strategic Supply Chain Management: The Five Disciplines for Top Performance, New York: McGraw-Hill.
Duyshart, B.: (1998)
The Digital Document: A Reference for Architects, Engineers and Design Professionals, 1st edition, New York: Architectural Press.
Finkenzeller, K.: (2003) RFID handbook: fundamentals and applications in contactless smart cards and identification, translated by Rachel Waddington, 2nd edition, Chichester: Wiley & Sons. Gummesson, E.: (2000)
Qualitative methods in management research, revised edition, Thousand Oaks: Sage Publications.
Handfield, R. B. / Nichols, E. L.: (2002)
Supply Chain Redesign: Transforming Supply Chains into Integrated Supply Systems, 1st edition, Sattle River: Prentice Hall International.
Hurd, M. / Nyberg, L.: (2004) The Value Factor: How global leaders use information for Growth and Competitive Advantage, 1st edition, New York: Bloomberg Press. Jilovec, N.: (2004)
Edi, Uccnet & Rfid: Synchronizing the Supply Chain, 1st edition, Loveland: 29th Street Press.

References 69
Kropp, W.: (2001) Systemische Personalwirtschaft, 2nd edition, Munich / Vienna: Oldenburg. Lahiri, S.: (2005) RFID Sourcebook, 1st edition, Sattle River: Prentice Hall International. McNair, C. J. / Vangermeersch, R. G. J.: (1998) Total Capacity Management: Optimizing at the Operational, Tactical, and Strategic Levels, Montvale: CRC Press. Neuman, L. C.: (1997)
Social research methods: Qualitative and Quantitative approaches, 3rd edition, Needham Heights: Allyn and Bacon.
Porter, M. E.: (1998) On competition, 1st edition, Boston: Harvard Business School Press. Shorey, R. / Ananda, A. / Chan, M. C. / Ooi, W. T.: (2006) Mobile, Wireless, and Sensor Networks: Technology, Applications, and Future Directions, Chichester: Wiley & Sons. Stadler, H. / Kilger, C.: (2004)
Supply Chain Management and Advanced Planning: Concepts, Models, Software and Case Studies, 3rd edition, Berlin: Springer.
Tashakkori, A. / Teddlie, C.: (2003)
Handbook of Mixed Methods in Social & Behavioral Research, 2nd edition, Thousand Oaks: Sage Publications.
Thornton, F. / Lindstrom, P. / Anand, D. / Haines, B. / Hersh, B.: (2006)
RFID Security, 1st edition, Rockland: Syngress.
Walliman, N.: (2003) Your Research Project: A Step-by-step guide for the first-time researcher, 1st edition, London: Sage Publications.
Wang, J.: (2003) Data Mining: Opportunities and Challenges, Hershey: IRM Press. Wincel, J. P.: (2004)
Lean Supply Chain Management: A Handbook for Strategic Procurement, New York: Productivity Press.
Wireman, T.: (2004) Total Productive Maintenance, 2nd edition, New York: Industrial Press Inc.

References 70
Womack, J. P. / Jones, D. T.: (1996) Lean thinking: Banish waste and create wealth in your cooperation, New York: Simon & Schuster.
Wærn, Y.: (1998)
Co-Operative Process Management: cognition and information technology, London: Taylor & Francis.
Yin, R. K.: (2003)
Case Study Research – Design and Methods, 3rd edition, Thousand Oaks: Sage Publications.
Zentes, J. / Schramm-Klein, H. / Hertel, J.: (2005) Supply-Chain-Management und Warenwirtschaftssysteme im Handel, 1st edition, Berlin: Springer.
Articles: Barut, M. / Faisst, W. / Kanet, J. J.: (2002)
Measuring supply chain coupling: an information system perspective, in: European Journal of Purchasing & Supply Management, Volume 8, pp. 161-171, Pergamon (http://databas.bib.vxu.se:2054/cgi-bin/linker/link/vxu/elsevier/09697012_2002_8_3_161-171/S0969-7012(02)00006-0).
Beckwith, R. / Mainwaring, S.: (2005) Privacy: Personal Information, Threats, and Technologies, in: Technology and Society, Weapons and Wires: Prevention and Safety in a Time of Fear, pp. 9-16, Intel Research (http://databas.bib.vxu.se:2101/iel5/9860/31201/01452707.pdf). Gaughan, D.: (2005) RFID Hype Collides with Reality, in: Supply Chain Management Review, Vol. 9, No. 2, pp. 14-19, Reed Business Information, (http://databas.bib.vxu.se:2081/ehost/pdf?vid=2&hid=14&sid=61efce49-f28f-4a4f-9481- b249b07ce649%40sessionmgr9). Lee, H. L. / Peleg-Gillai, B. / Raiwat, P. / Sarma, S. / Subira, B.: (2005) Assessing the Value of RFID Technology and EPCglobal Standards for Consumer Goods Manufacturers, (http://www.cetemmsa.es/CETEMMSA/docs/07072006_114225/es/White%20paper-
v8%202-JAN2005.pdf). Lee, Y. M. / Feng, C. / Leung, Y. T.: (2004) Exploring the Impact of RFID on Supply Chain Dynamics, in: Proceedings of the 2004
Winter Simulation Conference, Volume 2, pp. 90-97, Simulation Conference 2004, (http://databas.bib.vxu.se:2101/iel5/9441/29990/01371441.pdf).
References 71
Li, J. / Shaw M. J. / Sikora R. T.: (2001) The Effects of Information Sharing Strategies on Supply Chain Performance, University
of Illinois at Urban-Champaign, (http://citebm.business.uiuc.edu/B2Bresearch/ieee_em.pdf).
Stock, J. R. / Lambert, D. M.: (1992)
Becoming a ‘World Class’ company with logistics service quality, in: The International Journal of Logistics Management, Volume 3, pp. 73-82, International Logistics Research Institute.
Internet: All internet sources have been checked for validity on 2nd January. They are following listed as they come up within this thesis.
http://www.managementsoftware.hp.com/solutions/mfg/sg/mfg_sg_rfid_bb.pdf.
http://apps.qinetiq.com/perspectives/pdf/rfids.pdf.
http://www.foodproductiondaily.com/news-by-product/news.asp?id=72609&idCat=147&k=metro-tests-rfid.
http://hbswk.hbs.edu/archive/3651.html.
http://csdl2.computer.org/comp/proceedings/hicss/2006/2507/06/250760104a.pdf.
http://www.rfidupdate.com/contributors.
http://www.iml.fraunhofer.de/1720.html.
http://www.alexandria.unisg.ch/EXPORT/DL/21492.pdf.
http://www.blackwell-synergy.com/links/doi/10.1111/j.1469-8137.2004.00964.x/full.
http://nost.gsfc.nasa.gov/isoas/presentations/USDA_19990219/sld013.htm.
http://www.cscmp.org/Downloads/Resources/glossary03.pdf.
http://www.smallbiz.nsw.gov.au/smallbusiness/Resources/Business+Tools/Glossary+of+Business+Terms.
http://www.productionscheduling.com/production-scheduling.html.
http://www.rfidjournal.com/faq/16/48.
http://en.wikipedia.org/wiki/Barcode.
http://www.Barcode-1.com/pub/russadam/stack.html.
http://www.rfidjournal.com/faq/16/49.
http://www.autoid.org/2002_Documents/sc31_wg4/docs_501-520/520_18000-7_WhitePaper.pdf.
http://www.rfidjournal.com/faq/17/61.
http://www.rfidjournal.com/faq/16/50.

References 72
http://retailindustry.about.com/cs/it_rfid/a/bl_atk111003.htm.
http://www.k2b.net/pdfs/k2b_resourcelibrary_forrester.pdf.
http://www-03.ibm.com/industries/retail/doc/content/news/pressrelease/1244842101.html.
http://www.rfidatlas.de/images/stories/RFID_Fallstudien/Metro_Apr06_Konzeption.pdf.
http://www.metrogroup.de/servlet/PB/menu/1000080_l2_ePRJ-MetroDE-MAINPAGE/index.html
http://www.metro-link.com/metro-link/html/en/10731/index.html.
http://www.rfidinaction.net/?section=articles&page=114&refid=100&PHPSESSID=27c3df830e363ed799b313058685c711.
http://www.metrogroup.de/servlet/PB/menu/1000099_l2/index.html.
http://h20219.www2.hp.com/services/cache/83969-0-0-225-121.aspx.
http://www.researchandmarkets.com/reports/225503.
http://www.rfidatlas.de/images/stories/RFID_Fallstudien/Procter%20&%20Gamble_Apr06.pdf.
http://www.warehouse-logistics.com/download/DE_Vortrag_WMS2005_5.pdf.
http://www.metrogroup.de/servlet/PB/menu/1011429_l1/index.htm.
http://www.rfidatlas.de/images/stories/RFID_Fallstudien/Metro_Apr06_Konzeption.pdf.
http://www.ikr.uni-stuttgart.de/Content/itg/fg524/Meetings/2006-01-27-Bremen/1-1-IBM-workshop-uni-bremen.pdf.
http://www.etrics.org/workshops/etrics2006_metro_robeck.pdf.
http://www.future-store.org/servlet/PB/show/1004155/RFIDnet-Newsletter-01-2005-dt_05-01-10.pdf.
http://www.aberdeen.com/c/report/benchmark/sponsored/RFID_ROI_BenchmarkReport_RK_3504.pdf.
http://hbswk.hbs.edu/archive/3651.html.
http://ko-rfid.hu-berlin.de.
http://www.isima.fr/mosim06/actes/articles/33-systemes_d_information/304.pdf.

Appendix 73
Appendix
APPENDIX 1: CHECKLIST FOR MEASURING THE DEGREE OF SUPPLY CHAIN COUPLING A) GENERAL QUESTIONS ABOUT THE WEIGHTS
1. What is the relative importance of Information Extent towards customers and respectively suppliers (between 0 and 1 with a sum equaling 1)?
2. What is the relative importance of Information Intensity towards customers and respectively suppliers (between 0 and 1
with a sum equaling 1.)?
3. What is the relative importance of having and using demand information from customers and respectively having and sharing information about inventory, capacity, schedules with customers (between 0 and 1 with a sum equaling 1)?
4. What is the relative importance of having and sharing own demand information with suppliers and respectively having and
sharing information about inventory, capacity, schedules from suppliers (between 0 and 1 with a sum equaling 1)?
5. What is the relative importance of giving each type of supply information, so inventory, capacity and production schedules towards customers (between 0 and 1 with a sum equaling 1)?
6. What is the relative importance of receiving each type of supply information, so inventory, capacity and production
schedules from suppliers (between 0 and 1 with a sum equaling 1)? B) INFORMATION EXTENT
1. How many levels toward the ultimate customer do you have in your supply chain?
2. In establishing your production/logistics plans, how many levels of customer information do you use?
3. How many levels toward the ultimate supplier do you have in your supply chain?
4. In establishing your production/logistics plans, how many levels of supplier information do you use? C) INFORMATION INTENSITY I. Customer Coupling Information from Metro Cash & Carry: Intensity of Metro Cash & Carry’s demand information that Varena uses:
1. Do Metro Cash & Carry outlets share with Varena information about their possible future orders (yes=1, no=0)? a) No, then skip questions 2-6. b) Yes.
2. In establishing Varena’s logistics plans, what is the time horizon, in which Varena uses forecasted demand information
from Metro Cash & Carry outlets (in days)?
3. Is forecasted demand data aggregated by Metro Cash & Carry outlets into time periods? a) No, demand from Metro Cash & Carry outlets is provided on a continuous time scale. b) Yes.
If yes, then into how many periods is the horizon divided?
4. How frequently does Varena use forecasted Metro Cash & Carry’s demand information to re-plan (in days)?
5. Is forecasted demand information from Metro Cash & Carry outlets aggregated by product type (groups) (no=1, yes=0)? a) No, demand from Metro Cash & Carry outlets is provided in detail throughout the horizon. b) Yes.
If yes, then what fraction of forecasted demand information is aggregated into product types?

Appendix 74
6. How many logistics facilities fall within the scope of Varena’s logistics planning?
If more than one, then how much demand information about Metro Cash & Carry destinations use Varena to allocate distribution among Varena’s logistics facilities (scale: no information=0 to all information=1)?
Information to Metro Cash & Carry outlets: Intensity of Varena’s inventory information used by Metro Cash & Carry outlets:
1. Do Metro Cash & Carry outlets use Varena’s inventory information to plan their production (yes=1, no=0)? a) No, then skip questions 2-5. b) Yes.
2. In establishing Metro Cash & Carry’s logistics plans, what is the time horizon, in which Metro Cash & Carry use Varena’s
inventory information (in days)?
3. Is Varena’s inventory data aggregated into time periods? a) No, inventory data is provided on a continuous time scale. b) Yes.
If yes, then into how many periods is the horizon divided?
4. How frequently do Metro Cash & Carry outlets use Varena’s inventory data to re-plan (in days)?
5. Does Varena have more than one inventory location for Metro Cash & Carry product (yes=1, no=0)? If yes, then how much information about Varena’s different inventory locations is used by Metro Cash & Carry outlets to plan their production (scale: no information=0 to all information=1)?
Intensity of Varena’s capacity information used by Metro Cash & Carry outlets:
1. Do Metro Cash & Carry outlets use Varena’s capacity information to plan their production (yes=1, no=0)? a) No, then skip questions 2-5. b) Yes.
2. In establishing Metro Cash & Carry’s logistics plans, what is the time horizon, in which Metro Cash & Carry use Varena’s
capacity information (in days)?
3. Is Varena’s capacity data aggregated into time periods? a) No, capacity data is provided on a continuous time scale. b) Yes.
If yes, then into how many periods is the horizon divided?
4. How frequently do Metro Cash & Carry outlets use Varena’s capacity data to re-plan (in days)?
5. How many different production facilities does Varena have? How much information about Varena’s capacity at different production facilities is used by Metro Cash & Carry outlets to plan their production (scale: no information=0 to all information=1)?
Intensity of Varena’s production schedule information used by Metro Cash & Carry outlets:
1. Do Metro Cash & Carry outlets use Varena’s schedule information to plan their production? a) No, then skip questions 2-5. b) Yes.
2. In establishing Metro Cash & Carry’s logistics plans, what is the time horizon, in which Metro Cash & Carry use Varena’s
schedule information (in days)?
3. Is Varena’s schedule data aggregated into time periods? a) No, schedule data is provided on a continuous time scale. b) Yes.
If yes, then into how many periods is the horizon divided?
4. How frequently do Metro Cash & Carry outlets use Varena’s schedule data to re-plan (in days)?
5. Does Varena have more than one logistics facility for the Metro Cash & Carry product (yes=1, no=0)? If yes, then how much information about Varena’s schedules at different production locations is used by Metro Cash & Carry outlets to plan their production (scale: no information=0 to all information=1)?

Appendix 75
II. Supplier Coupling Information to Proctor & Gamble: Intensity of demand information to Proctor & Gamble:
1. Does Varena share information about Varena’s possible future demands with Proctor & Gamble (yes=1, no=0)? a) No, then skip questions 2-6. b) Yes.
2. When Proctor & Gamble establishes production plans, what is the time horizon, in which Proctor & Gamble uses Varena’s forecasted demand information to Proctor & Gamble (in days)?
3. Is Varena’s forecasted demand data to Proctor & Gamble aggregated into time periods?
a) No, demand is provided on a continuous time scale. b) Yes.
If yes, then into how many periods is the horizon divided? 4. How frequently does Proctor & Gamble use Varena’s forecasted demand information to re-plan (in days)?
5. Is Varena’s forecasted demand information to Proctor & Gamble aggregated by product type (groups) (no=1, yes=0)?
a) No, demand is provided in detail throughout the horizon. b) Yes.
If yes, then what fraction of demand information is aggregated into product types?
6. How many Proctor & Gamble facilities fall within the scope of Varena’s logistics planning? If more than one, then does Varena provide demand information to every one of them (scale: no one=0 to everyone=1)?
Information from Proctor & Gamble: Intensity of inventory information from Proctor & Gamble used by Varena:
1. Does Varena use inventory information from Proctor & Gamble to plan Varena’s production (yes=1, no=0)? a) No, then skip questions 2-5. b) Yes.
2. In establishing Varena’s logistics plans, what is the time horizon, in which Varena use inventory information from Proctor
& Gamble (in days)?
3. Is inventory data from Proctor & Gamble aggregated into time periods? a) No, inventory data is received on a continuous time scale. b) Yes.
If yes, then into how many periods is the horizon divided?
4. How frequently does Varena use inventory data from Proctor & Gamble to re-plan (in days)?
5. Does Proctor & Gamble have more than one inventory location for Varena’s products (yes=1, no=0)? If yes, then how much information about Proctor & Gamble’s different inventory locations use Varena to plan Varena’s logistics (scale: no information=0 to all information=1)?
Intensity of schedule information from Proctor & Gamble used by Varena:
1. Does Varena use schedule information from Proctor & Gamble to plan Varena’s production? a) No, then skip questions 2-5. b) Yes.
2. In establishing Varena’s logistics plans, what is the time horizon, in which Varena use schedule information from Proctor
& Gamble (in days)?
3. Is schedule data form Proctor & Gamble aggregated into time periods? a) No, schedule data is received on a continuous time scale. b) Yes.
If yes, then into how many periods is the horizon divided?
4. How frequently does Varena use schedule data from Proctor & Gamble to re-plan (in days)?
5. Does Proctor & Gamble have more than one production facilities for Varena’s products (yes=1, no=0)? If yes, then how much information about schedules from Proctor & Gamble at their different production locations use Varena to plan Varena’s logistics (scale: no information=0 to all information=1)?
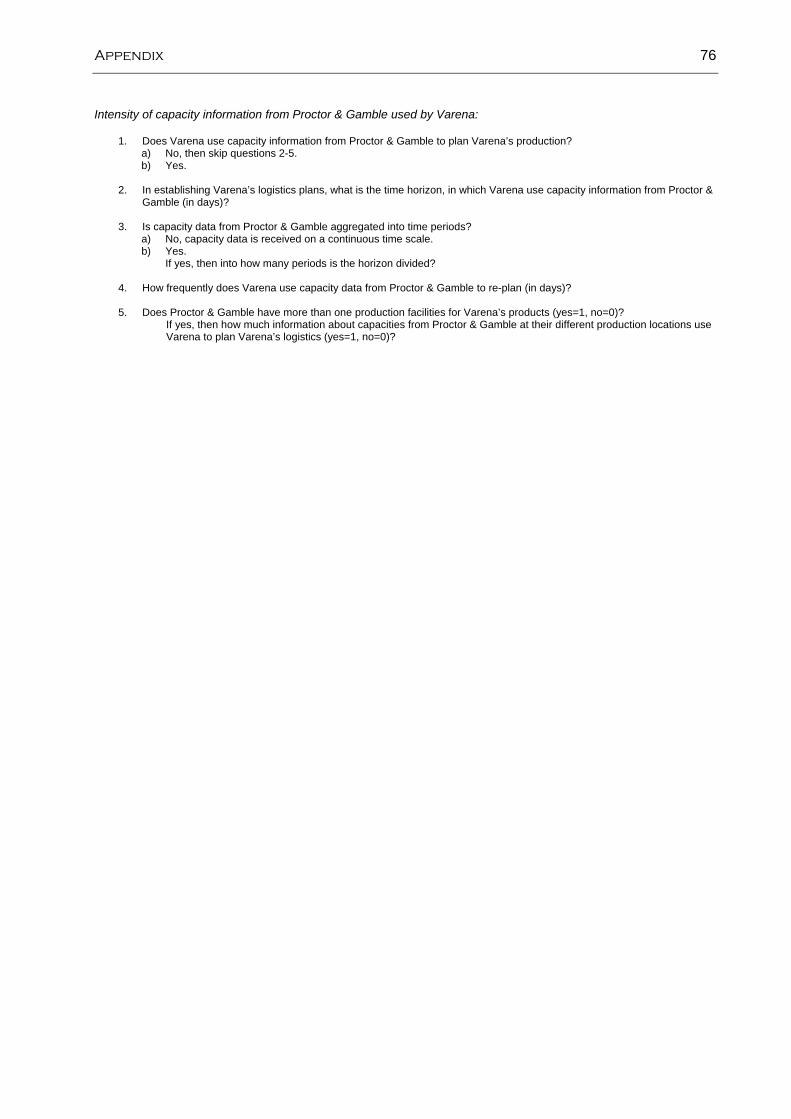
Appendix 76
Intensity of capacity information from Proctor & Gamble used by Varena:
1. Does Varena use capacity information from Proctor & Gamble to plan Varena’s production? a) No, then skip questions 2-5. b) Yes.
2. In establishing Varena’s logistics plans, what is the time horizon, in which Varena use capacity information from Proctor &
Gamble (in days)?
3. Is capacity data from Proctor & Gamble aggregated into time periods? a) No, capacity data is received on a continuous time scale. b) Yes.
If yes, then into how many periods is the horizon divided?
4. How frequently does Varena use capacity data from Proctor & Gamble to re-plan (in days)?
5. Does Proctor & Gamble have more than one production facilities for Varena’s products (yes=1, no=0)? If yes, then how much information about capacities from Proctor & Gamble at their different production locations use Varena to plan Varena’s logistics (yes=1, no=0)?
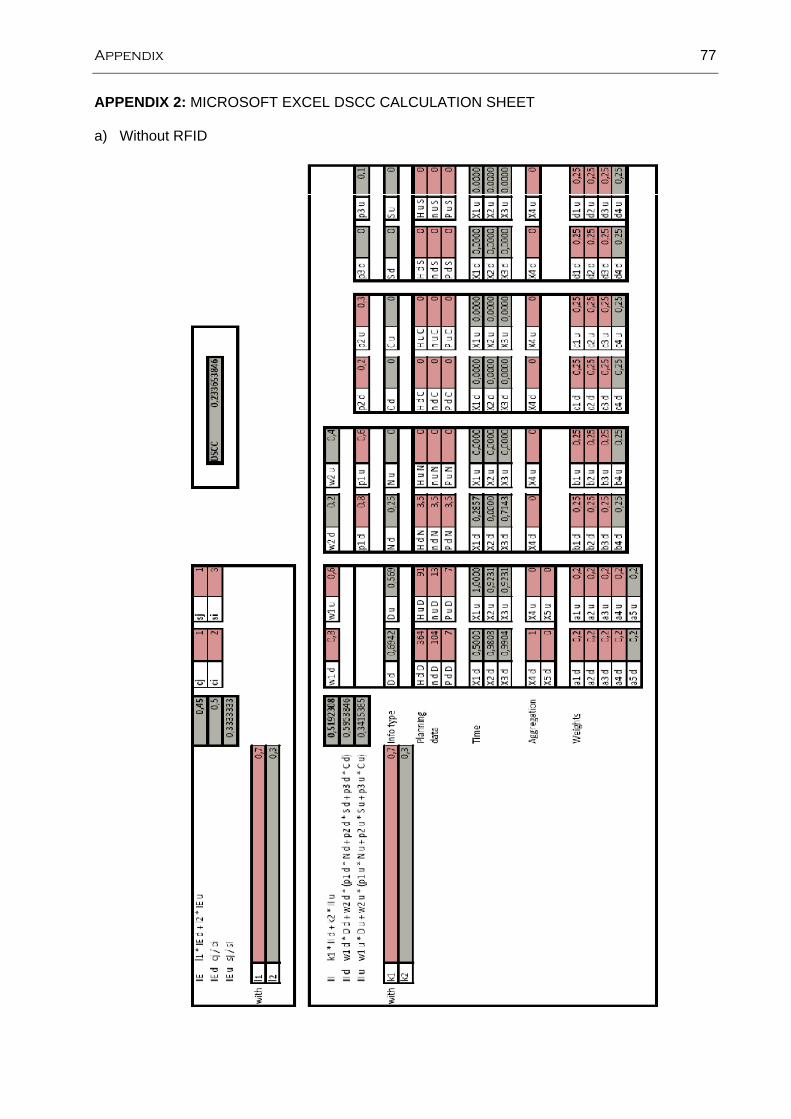
Appendix 77
APPENDIX 2: MICROSOFT EXCEL DSCC CALCULATION SHEET a) Without RFID

Appendix 78
b) With RFID