Embed Size (px)
Citation preview

Stewart Farrell, Ph.D.Brad Smith, PSM
Jane Uptegrove, M.S.Scott Stanford, Ph.D.

• Sandy made landfall near Atlantic City, NJ. on October 29th at 8pm with sustained winds at 80mph (Category 1). High tide was at 8:20pm.
• Occurred on a full moon high tide which made tides 20% higher than normal and amplified the storm surge.
• Sandy was the second-largest Atlantic tropical cyclone on record with hurricane-force winds extending 175 miles from its center and tropical storm force winds extending out to 485 miles.
• First Hurricane to make landfall in NJ Since 1903 “Vagabond Hurricane”.

• Sandy Hook• 13.3 feet above mean low
water
• The Battery (Lower Manhattan)• 13.9 feet above mean low
water
• Kill van Kull (Staten Island)• 14.6 feet above mean low
water
• Atlantic City & Cape May• 8.9 feet above mean low
water
Minor Tidal Flooding – 6.7 feetModerate Tidal Flooding – 7.7 feetMajor Tidal Flooding – 8.7 feet
•Mean Lower Low Water•Sandy Hook Reference Tide Gauge
(Photo courtesy of Joseph OchanasNJDEP BCE, 2012)

The surge eroded dunes, flooded beach communities, destroyed structures, and washed sand inlandalong the entire New Jersey shore. The most prominent erosional features were on the narrowest partsof the barriers north of Little Egg Inlet.
(Photo courtesy of Joseph OchanasNJDEP BCE, 2012)

• Established in 1986 as a result of Hurricane Gloria
• Created out of a need to quantify the amount of damage and severity of the storm losses
• Lack of data prevented the State from determining any damage for imbursement from the Federal Emergency Management Agency (FEMA)
-(Photo courtesy of Dan Kelly, USACE Philadelphia District, 2012)

• Shoreline and volume changes along New Jersey’s coast
• NJBPN consists of 105 beach profile sites along the entire shoreline, including the Raritan and Delaware Bays

• The dune, beach, and nearshore are surveyed at each profile site twice a year (fall and spring), and analyzed for seasonal and multiyear changes in shoreline position and sand volume.
• Survey grade total station transit technology
• X, Y, and Z data is collected to create a topographic profile of the dune, beach, and nearshore to a minimum depth of 12 feet
• Photographic record is kept of the beach/dune system at each site

• Monmouth County headlands consist of beaches backed by a bluff of older sediments and two major sand spits• One to the north from Long
Branch (Sandy Hook)• One to the south from Bay Head
(Mantoloking to Island Beach State Park)
• The barrier island segmented shoreline covers the remainder of the NJ coastline where individual islands are separated from the mainland by a series of bays and tidal lagoons

• A GIS-based beach-dune system susceptibility assessment began in 2007 to evaluate the performance potential of the oceanfront beach-dune system, identifying weaknesses in the system and highlighting areas that may be vulnerable to storm damage.
• The assessment was carried out by segmenting the beach-dune system, long-shore into uniform zonal analysis areas, called "bins“.
• For each bin, several variables relating to dune, beach, and nearshore geomorphology, and to the presence of vegetation and structures (such as groins), were collected, compiled, and evaluated in order to determine the susceptibility of the dune system to potential damage from storm activity.
• The assessments have been performed for all of Ocean and Atlantic County prior to Hurricane Sandy.• Cape May County currently being assessed

• Utilizes the knowledge and expertise of CRC staff experience• Storm Survey experience (39 years)
• NJBPN (26 years)
• Post storm surveys and analysis• RTK-GPS and Total Station Survey of storm damage and calculation of sand losses create a real-
life testing of the assessments validity and facilitates improvements in methodology and technique.
• Incorporates advanced spatial analytical
techniques• GIS (Geographic Information Systems)• LiDAR (LIght Detection And Ranging) data
• Photogrammetry (Use of vertical
• aerial photography to perform analysis)
• RTK-GPS surveying (verification)
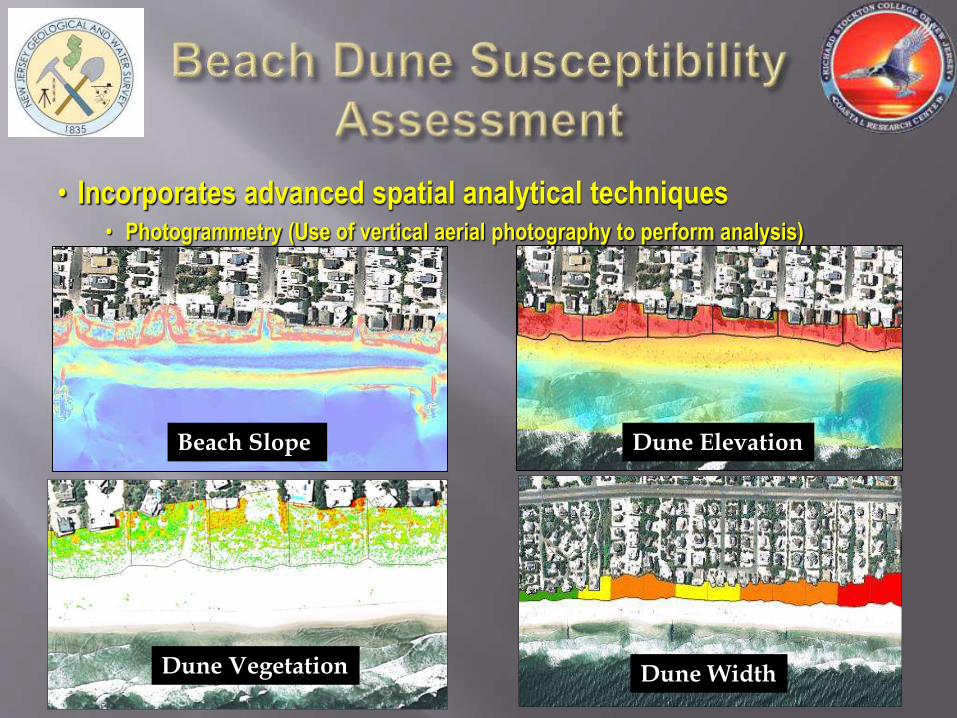
• Incorporates advanced spatial analytical techniques• Photogrammetry (Use of vertical aerial photography to perform analysis)
Beach Slope Dune Elevation
Dune Vegetation Dune Width

• 14 pre-existing New Jersey Beach Profile Network (NJBPN) monitoring sites were used to provide an accurate comparison and assessment of storm related shoreline and beach volume changes.

Before
After

Before
After

Before
After

Before AfterBefore After

• Cape May County -2,241,874
• Atlantic County -845,132
• Ocean County -7,590,414.86
• Monmouth County - -3,339,074
• Total for NJ -14,016,494.86 cu yd**Preliminary numbers, does not count losses to natural areas or sand volume offshore.

CAP 6

Sand
Resource
DelineationShoal offshore Barnegat Inlet
• USACE’s D1, D2, and D3
• In state and federal waters
• Combined analysis by two agencies
D1
D2D3
Barnegat Inlet

Shoals in Seismic Profile

Integrated seismic/sediment analysis

Calculating shoal extent and thickness

Competing uses and potential hazards
• Jeff Waldner, Bureau of Ocean Energy Management (BOEM), U.S. DOI
• Laurie Whitesell, NJGWS
• Amanda Fabian, NJGWS
• Zehdreh Allen-Lafayette, Cartographer, NJGWS
• Dan Barone, CRC• Steven Hafner, CRC• Dr. Mark Mihalasky,
USGS• B. Steven Howard,
CRC• Michael Flynn, CRC• Crist Robine, CRC• Kimberly McKenna,
CRC• Christie Tracey, CRC


![HURRICANE SANDY RECOVERY WORKSHOP SUMMARY …...Hurricane Sandy Recovery Workshop Summary Report [2] Introduction On October 29, 2012, Hurricane Sandy made landfall north of Brigantine,](https://img.dokumen.tips/doc/110x75/5f0d17507e708231d438a277/hurricane-sandy-recovery-workshop-summary-hurricane-sandy-recovery-workshop.jpg)