Embed Size (px)
Citation preview

CLIMATE RESEARCHClim Res
Vol. 19: 161–172, 2001 Published December 4
1. INTRODUCTION
East Africa, which includes much of Sudan, Ethiopia,Somalia, Kenya, Tanzania and Uganda, is home forhundreds of thousands of pastoralists. Pastoralists, withtheir herds of cattle, sheep, goats and in some regionscamels, live in the dryer areas of the region. Rainfallseasonality affects livestock production and the liveli-hoods of these people. East African rainfall is bimodalwith short rains occurring in October and Novemberand long rains beginning in February or March andending in May (Nicholson 1993, 1994, Ellis & Galvin1994). This pattern varies across the region, with un-certainty of the rains increasing in dryer zones. Despitethis uncertainty pastoralists have diverse strategies tomaintain livestock production. This is important aspastoralists are responsible for providing a major por-tion of the livestock to the markets in the region (Ens-minger 1992, Kerven 1992).
Much of East Africa experienced severe drought in1997. This was followed by the El Niño rains beginningin October 1997. The short rains were replaced byheavy storms and floods (Government of Kenya Mete-orological Services 1998). The rains continued throughMarch 1998, when the long rainy season normallybegins, and then continued through May. The longduration and high levels of rainfall damaged theregion’s infrastructure, agriculture, and caused healthproblems for both people and livestock. Livestock dis-eases such as blue tongue increased in the area. Morethan 4000 people died due to flooding. Incidence ofdiseases such as malaria and cholera increased. Cerealcrops (maize, wheat) rotted in the fields and pricesincreased (Horn of Africa Review 1997, World Meteo-rological Organization 1998). Production of coffee andtea, very important export crops in the region, wasseverely reduced.
Tourism was severely curtailed due to infrastruc-ture problems. Roads developed huge potholes, wereflooded and sometimes were washed away. Damagedroads curtailed transportation, and costs of moving
© Inter-Research 2001 · www.int-res.com
*E-mail: [email protected]
Impacts of climate variability on East Africanpastoralists: linking social science and remote
sensing
Kathleen A. Galvin1, 2,*, Randall B. Boone1, Nicole M. Smith2, Stacy J. Lynn3
1Natural Resource Ecology Laboratory, 2Department of Anthropology, 3Department of Rangeland Ecosystem Science, Colorado State University, Fort Collins, Colorado 80523, USA
ABSTRACT: In this paper we review the effects of the 1997 drought and the 1998 El Niño rains onMaasai herders in northern Tanzania and explore with satellite data the degree to which we canexpand the spatial scale of the analysis. Hierarchical cluster analyses of regional vegetation biomasstrends are used and are associated with the results of surveys conducted among the Maasai. Themethods attempt to extend local-level survey data to landscape and regional scales. We were able tolink the household production information to clusters of vegetation biomass, thus expanding the scaleof the analysis. The analysis demonstrates the potential for spatial generalizations from an under-standing of social processes at the local level for policy for mitigation and adaptation for dealing withclimate variability.
KEY WORDS: Social science · Remote sensing · Climate variability · East Africa · Pastoralists
Resale or republication not permitted without written consent of the publisher

Clim Res 19: 161–172, 2001
materials and food rose steeply (Government of KenyaMeteorological Service 1998, Washington Post 1998).Pastoralist informants in northern Tanzania stated thattheir normal routes to Kenyan livestock markets wereflooded, which led them to resort to shipping theircattle by trucks using alternate routes. This was ex-pensive and reduced their profit margin.
However, several sources reporting on the effects ofthe El Niño suggested that herders had ‘lots of grass’for their cows, and that hunger among this segment ofthe population would be low (Government of KenyaMeteorological Service 1998, Washington Post 1998).In contrast, others reported that thousands of livestockdied in Somalia alone as a result of flooding (AfricaNews 1997, ICRC 1997). Regional food security, forboth pastoralists and others in the region was said to beprecarious (Nabakwe 1999, Ngugi 1999).
In this paper we review the effects of the 1997drought and the El Niño rains on Maasai herders innorthern Tanzania and use satellite data to generalizeour results over the region. Specifically the goals hereare to scale up from the household to the region usinganalyses of household responses to climate and to dis-cuss the relationships between household variables(livestock sales) to climate that the scaling-up sug-gests. A new method was required to enable us to scaleup effects from households to the region.
Weather patterns during 1997 and 1998 were nottypical; 1997 was a dry year and 1998 an exceedinglywet El Niño year (Fig. 1). We analyzed regional vege-tation patterns in 1997 and 1998 and related these toMaasai responses to climate variability. Hierarchicalcluster analyses of regional vegetation biomass trendswere used, and were associated with the results ofhousehold surveys conducted among the Maasai. Themethods attempt to extend local-level survey data tolandscape and regional scales. Whereas social sciencehas made great progress in understanding how house-holds and communities make decisions, we rarelyknow to what extent the results may be generalized,and to what region. That is the value of linking house-hold data with remotely sensed information.
1.1. East African pastoralists
Arid and semi-arid lands cover nearly two-thirds ofthe African continent. The majority of African livestockand more than 50 million people who are dependenton livestock and dryland agriculture reside in thesedry zones. Climate variability is characteristic of alldrylands, but in Africa it is particularly potent. Thisprecipitation variability influences ecosystem dynam-ics and thus exerts a major influence on human life-styles and land use patterns.
162
Fig. 1. Vegetation biomass in East Africa, showing (a) a long-term pattern (1987–1996) for January, (b) January 1997, and(c) January 1998. NDVI values can range from –1 to 1. Thescale here extends from low biomass, brown (–0.66), to high
biomass, very green (1.0)

Galvin et al.: Climate impacts on East African pastoralists
Climate variability, by affecting ecosystem structureand function, has always influenced African livestockproduction and rainfed agriculture production. Pasto-ralists and agro-pastoralists depend directly and indi-rectly on the products of their livestock, so they havedeveloped multiple coping mechanisms to deal withdrought. These include keeping diverse species oflivestock, movements of species-specific and produc-tion-specific livestock herds over large areas, emigra-tion out of the pastoral system until the perturbationpasses, economic diversity, and even allocating sea-sonal and drought-induced nutritional stress amongthose community members better able to cope with it(Galvin 1988, 1992, Galvin et al. 1994). Rain-fed agri-culturalists diversify with livestock and have close eco-nomic ties to pastoralists and markets. These strategiesare opportunistic and flexible, contingent upon exist-ing conditions.
This combination of stabilizing strategies—large spa-tial scale of exploitation, demand reduction throughemigration, economic diversity and specific food andnutritional stress allocation—has become constrainedin this century due to 2 major factors: an increasinghuman population along with a stable or declininglivestock population and a decreasing land use area(Little & Brokensha 1987, Grandin 1988, Galvin 1992,Fratkin 1997). Pastoral and agricultural populationshave grown, but livestock populations have fluctuatedrather than expanded. East African pastoralists, forexample, have been unable to expand livestock hold-ings due to such factors as disease epidemics, recur-ring droughts, and intertribal raiding. In addition,access to large amounts of land has been lost. Betterwatered dry season ranges have been lost to bothcolonial and African agriculturalists, to game parks,and to conservation areas. Pastoralists have taken upagriculture in an effort to meet their increasing fooddemands at the same time as agropastoralists haveexpanded cropping into more marginal areas (Sperling& Galaty 1990). Fallow periods have shortened andfallowed areas have decreased.
Massive food shortages are projected for sub-Saha-ran Africa in the next quarter century based on currentrates of population expansion and food production; theresult has been further increases in livestock and agri-cultural intensification in arid and semiarid lands.Thus, with increasing population pressure on a declin-ing and highly variable resource base, human vulnera-bility to drought and floods has increased.
Pastoralists and agropastoralists have, in the past,adapted very well to climate variability. Howeverthese populations have become vulnerable to climatevariability in large part because their strategies forcoping with climate variability have become con-strained. An extensive spatial scale is a prerequisite
for a successful pastoral system where droughts arefrequent. Agriculture must be conducted with a diver-sity of other economic options. Opportunistic manage-ment practices are the rule (Sandford 1983, Behnke etal. 1993). Furthermore, developing strong interactionswith the national economy through viable marketingsystems is necessary.
1.2. Maasai pastoralists
Since the early 1990s conservation and human eco-logy has been the focus of interdisciplinary research inthe Ngorongoro Conservation Area, Tanzania, whereMaasai pastoralists live with a diverse and concen-trated wildlife population. This joint-use area has comeunder increased scrutiny due to the perception that thequality of life is deteriorating for the Maasai whilehabitat degradation is increasing. We studied ecosys-tem structure, human land use and human welfare inNgorongoro and have completed a comparative studyof Maasai living outside Ngorongoro (Fig. 2). The Maa-sai of the adjacent Loliondo Game Controlled Area are
163
Fig. 2. The study region, with the area used in cluster analysismarked with a dashed box. The Loliondo Game ControlledArea (a) and the Ngorongoro Conservation Area (b) were the
regions in this study
a - Loliondo GameControlled Area
b - NgorongoroConservation Area
c - Serengeti National Park
d - Maswa Game Reserve
e - Masai Mara Game Reserve

Clim Res 19: 161–172, 2001
not restricted by conservation policy, and all humanactivities, with the exception of unlicenced hunting ofgame animals, are allowed (Mwalyosi 1992). In con-trast, the Maasai of Ngorongoro have been constrainedby conservation policy for over 50 yr. Conservation pol-icy has imposed a number of restrictions on Maasailand use, including restricting grazing areas and limi-tations on cultivation.
As in the case with other East African pastoralists,the Maasai have experienced increasing pressures ontheir lifestyle. In response to these changes, the pas-toral economy has undergone and is undergoing inten-sification and diversification (Sperling & Galaty 1990,Smith 1999). The Maasai have responded in one wayto these pressures by taking up agriculture. Tradition-ally, Maasai did not practice agriculture on a regularbasis, and relatively low levels of exchange for agricul-tural products characterized their economic system.These patterns are changing as livestock holdingshave decreased (Grandin 1988).
The Maasai traditional diet consisted of milk, meatand blood from their livestock herds (Nestel 1986,Homewood 1992). Now there is an increase in the con-sumption of non-pastoral foods such as maize meal, teaand sugar (Arhem 1985, Homewood et al. 1987, Talle1987). Cash is required to buy these goods and to pur-chase inputs for livestock and agricultural production(Grandin 1988, 1991). Other cash expenditures includehousehold utensils, school fees, hospitalization, veteri-nary drugs and breeding stock (Talle 1987, Smith1999). The increased dependence of pastoralists oncash income has resulted in the incorporation of culti-vation into their economic strategies wherever rainfalland ecological factors permit (Rigby 1985).
2. METHODS
2.1. Household interviews
Forty-nine in-depth household interviews were con-ducted—23 in Loliondo and 26 in Ngorongoro—fromMay through December 1998 (Fig. 3). Research datawere collected from June through September 1998using ethnographic research techniques comprised offormal and informal interviews (McCracken 1988, Jor-gensen 1989). The questionnaire and interview pro-cess provided a comprehensive overview of the eco-nomic operation of the household. Data were collectedon household composition, income and expenditures,livestock numbers, agricultural production, and mar-keting, for 1997 and 1998 (Smith 1999).
There are several strengths to the ethnographic fieldmethodologies used in this research. The hallmarkof ethnography is that the ‘research attempts to un-
derstand a culture from the insider’s point of view’(MacLeod 1987, p. 8). This research benefited fromethnographic procedures because: (1) direct personalinvolvement with informants fostered a rapport thatencouraged informants to more fully explore theirthoughts and feelings about the questions posed;(2) the verbal behavior of informants could be ob-served and used to elicit further discussion; and (3) byliving in the community, even for a short period of time,a greater sense of Maasai culture could be ascertained(Agar 1996).
As actual recall data on income and expenditures isoften unreliable (Fowler 1993), economic data were
164
Fig. 3. Locations of household interviews (n = 46), overlaid upon a1993 Landsat Thematic Mapper satellite image to provide context

Galvin et al.: Climate impacts on East African pastoralists
gathered by rank ordering income and expenditureitems. Income and expenditure data were assigned anarbitrary ranking of importance to create an index ofimportance of each income and expenditure source tothe household. The scores were converted to a per-centage to provide an index of importance. Livestockrelated questions included information on herd compo-sition and number, slaughter and consumption dataand sales. Percent of herd sold was estimated based onnumbers sold relative to total herd size.
The spatial locations of interview households weredetermined with a global position system (GPS) unit(Fig. 3). These locations were projected to a commoncoordinate system, and joined with the data represent-ing interview results. The locations of 4 of the 49 house-holds were not identified with a GPS, but were near(~800 m) other households interviewed.
From the household data collected, variables for thisstudy were selected that: (1) appeared to demonstratespatial trends in response to 1998 rainfall, and (2) wehypothesized would be associated with broad-scalevegetation biomass patterns. These included: area cul-tivated; cattle numbers sold; numbers of sheep andgoats sold; cattle slaughtered; sheep and goats slaugh-tered; and the differences between the livestock vari-ables, subtracting the 1998 value from the 1997 value(Table 1). Whereas we related all these data to themaps derived from the cluster analyses only 2 weresignificant to vegetation patterns: the number of sheepand goats sold in 1998 and the difference in sheep andgoats sold between 1997 and 1998.
2.2. Satellite data
A general goal for us was to create a method thatwould allow the effects of changes in rainfall patternson pastoralist households to be generalized to regions.We sought a method that would be inexpensive, couldbe used anywhere, would allow frequent updates, wasspatially reasonably detailed, and would not require
extensive field surveys. We hypothesized that El Niñoeffects on Maasai were related to the patterns ofresponse in vegetation dynamics. The increase in pre-cipitation associated with El Niño increases vegetationbiomass and vigor (Anyamba & Eastman 1996, Kogan1998), and so we assessed the relationship betweenchanges in Maasai livestock and crop production andvegetation biomass trends.
To generalize interview results, normalized differ-ence vegetation indices (NDVI), derived from AVHRR(Advanced Very High-Resolution Radiometer) weathersatellite images, representing regional vegetation bio-mass dynamics, were used. These images representvegetation biomass and vigor at the surface of theplant canopy (Avery & Berlin 1992) and are usedwidely. NDVI images from satellites are availableworld-wide, free, updated every 10 d, spatially de-tailed relative to a regional scale, and extremely sensi-tive to rainfall patterns; they provide an index to greenvegetation biomass, which is of profound importanceto pastoralists.
NDVI data from 2 programs were used in the analy-ses, representing up-to-date coarse (7.6 km) resolutiondata and fine (1 km) resolution data from a limited timeperiod, 1992–1996. We hypothesized that the vegeta-tion patterns for a dry year (1997) and a wet year (1998)would be correlated to long-term vegetation patterns,linking the 2 data sources. That is, if the 1997 and 1998coarse-scale data were correlated with long-termcoarse-scale data, we could be more confident in ouruse of the available 1992–1996 1 km2 data to relate to1998 vegetation biomass patterns. Long-term coarse-scale data consisting of 36 images yr–1, spanning from1986/1987 (i.e., November 1986 to October 1987 re-presenting the start of the wet season to the end of thedry season) to 1997/1998, were downloaded from theUSGS African Data Dissemination Service (USGS1999) and incorporated into the Geographical Informa-tion System (GIS). To represent long-term biomass pat-terns, the data from 1986/1987–1995/1996 were usedto calculate thirty-six 10 d mean responses. Analogous
sets of images were created for 1996/1997 (a dryyear) and 1997/1998 (a wet El Niño year).
We also created a suite of 1 km resolutionNDVI images for the same thirty-six 10 d peri-ods used in the previous program, from imagesacquired from the Global Land 1 km AVHRRprogram (USGS 1998). These data have a reso-lution higher than the 7.6 km data and are morecomplicated to produce, distribute, and store.They were therefore only available for theperiod noted, from April 1992 to May 1996, withsome periods missing (all of 1994 was missing,for example). The entire collection for EastAfrica was downloaded and thirty-six 1 km res-
165
Table 1. Household data used in analysis
Cultivation (acres) in 1997 and 1998Cattle sold in 1997 and 1998Sheep and goats sold in 1997 and 1998Cattle slaughtered in 1997 and 1998Sheep and goats slaughtered in 1997 and 1998Difference between cattle sold in 1997 vs 1998a
Difference between sheep and goats sold in 1997 vs 1998a
Difference between cattle slaughtered in 1997 vs 1998a
Difference between sheep and goats slaughtered in 1997 vs 1998a
aValues in 1997 minus those from 1998; positive values representmore sheep and goats sold or slaughtered in 1997 than in 1998

Clim Res 19: 161–172, 2001
olution mean biomass patterns were calculated andincorporated into the GIS. A subset of these data rep-resenting the Greater Serengeti Ecosystem (1° 7’ S,33° 48’ E to 3° 42’ S, 36° 10’ E) was used in cluster analy-ses, including 1 km2 cells totalling 75 790 (see Fig. 2).From the clustered data, a further subset of 34 456 km2,including Ngorongoro and Loliondo (1° 34’ S, 34° 47’ Eto 3° 42’ S, 36° 6’ E) was used in generalizing householdinterviews.
2.3. Cluster analyses and generalizing the interviews
The general methods are outlined in a series ofschematics. NDVI images are represented in Fig. 4 astwo 9-cell images representing 2 time periods. Theseimages cover the same area spatially, so each pixel hasmultiple values associated with it, one for each timeslice, representing a biomass profile. The biomass pro-files are used in a cluster analysis, represented in themiddle graphs by 2 dimensions corresponding to the 2images or time periods. Here, a dry barren cell wouldbe near the origin of the graph, with low biomass in
both periods. An evergreen forest cell would be nearthe upper left of the graph, with high biomass in bothperiods. Lastly, a deciduous forest cell might be nearthe right side of the graph and high in biomass atTime 1, but near the bottom of the graph and low inbiomass at Time 2, after leaf-fall.
Hierarchical cluster analysis entails taking the num-ber of cells, n (here considered clusters with 1 celleach), and calculating the distance between everypossible pair of clusters. In essence, the 2 clusters thatare closest to each other are merged, yielding 1 fewercluster. This is represented near the bottom of Fig. 4(right) for some distance (D) equal to 3, with the 9cells classified into 4 clusters, based upon the averagedistances between the clusters. The distance at whichthey merged is recorded as well, allowing a hier-archical tree to be created, showing the relationshipsbetween clusters. From both the graph and tree, wesee that the cells that make up each cluster share abiomass profile more alike to that of other cells withinthat cluster than to those of cells in other clusters. The
166
Fig. 4. A schematic demonstrating how hierarchical treeswere formed. NDVI indices were used as dimensions of acluster analysis (2 dimensions in this figure, 36 dimensions
in practice)
Fig. 5. Clusters may be mapped at different distances withinthe hierarchical tree. As distance decreases, more smaller
clusters are mapped

Galvin et al.: Climate impacts on East African pastoralists
process repeats, measuring distances between clus-ters and merging those that are closest, with the num-ber of clusters reduced by 1 during each cycle (e.g.,Fig. 4, D = 5 and D = 7). The process stops when theentire data set has been assigned to a single cluster(Anderberg 1973).
A hierarchical tree relating biomass profiles for cellsmay seem of limited use, but the geographic position ofeach cell is retained. We can therefore represent spa-tially how biomass patterns are arranged. In Fig. 5, forexample, with D = 7, 5 cells in the northern part of themap form a cluster—judging from the top graph inFig. 4 (D = 7), these cells are generally high in biomass.Four cells at the southern part of the 9-cell map clustertogether—these cells are generally low in biomass.Because the tree is hierarchical, we can inspect thepattern of clusters at D = 5 as well (Fig. 5, middle), andsee that cells in the southeast cluster together. Inspect-ing the graph in Fig. 4, we find these cells have moder-ate biomass at Time 1, and very low biomass at Time 2.Analogous logic may be used at D = 3, identifying 2cells that form a cluster with very high biomass in bothtime periods (Figs 4 & 5). In general then, these meth-ods yield non-overlapping clusters over an entireregion for a given distance and, across decreasing dis-tances, clusters divide hierarchically (Omi et al. 1979,Hargrove & Luxmoore 1997, Krohn et al. 1999), depict-ing more subtle differences in biomass profiles witheach division of clusters.
In this study, for the 1 km NDVI data, each of the75 790 cells was assigned a unique identifier. Theseidentifiers were combined with the value of the cell foreach of the thirty-six 10 d periods, creating a meangreen biomass profile through the year for each of thecells, and yielding a cluster analysis with 36 dimen-sions. Often in cluster analyses the variables used aretransformed to approach normality and the same vari-ance. We did not transform the NDVI data; they arenormalized and so are on the same scale and havesimilar variances. These data can vary from normality,but not to a great extent (Eklundh 1998). Cluster ana-lysis was conducted using ClustanGraphics (ClustanLimited, Edinburgh, Scotland; Wishart 1999). Averagelinkage distance measures in clustering was used,which was also most effective when several clusteringmethods were contrasted in related analyses (Krohnet al. 1999). In average linkage, the average distancebetween all the points within the clusters compared isused to represent distance (Anderberg 1973, Wishart1999).
From the cluster analysis, the tree showing the hier-archical relationships of clusters was processed in acustom Visual Basic program (Microsoft Corp., Red-mond, WA). The program created a series of 209 mapsof clusters at various levels of the hierarchy, and saved
the maps as image files. Map files were then incor-porated into ARC/INFO (Environmental Systems Re-search Institute, Redlands, CA) as grids.
These maps spanned a gradient, from the entireregion being comprised of 2 clusters, to the region con-taining 75 790 clusters (i.e., one 1 km square cell percluster). To determine the appropriate cluster map touse within this gradient, a series of 1-way analyses ofvariance (ANOVA) between cluster identifiers andinterview data were conducted (Wilkinson 1990). Theschematic in Fig. 6 provides an example. With too fewclusters (D = 7), different El Niño effects occur withinthe same cluster, and the model is under-fitted. Withtoo many clusters (D = 3), a given El Niño effect occursin more than 1 cluster, that is, a given effect is beingrelated unnecessarily to more than 1 biomass profile,and the model is over-fitted. Ideally (D = 5 in Fig. 6),
167
Fig. 6. The discrimination of interview data determines which distance in the cluster hierarchy is used
Perfectdiscrimination
Loss ofdiscrimination:
Over-fitted
Somediscrimination:
Under-fitted
Large
Moderate
Small

Clim Res 19: 161–172, 2001
each given El Niño effect would fall within a singlecluster, yielding perfect discrimination. In practice, theoptimum fit was identified by plotting the degree ofdiscrimination in the data (represented by p values inthe ANOVA) against the distance at which clusterswere mapped. Most such graphs had poor discrimina-tion with few clusters or with many clusters, asexpected, but had an optimum point or points wherethe data were described the best (though not necessar-ily to a significant degree).
For variables with significant discrimination, weclassified the mean response variable from the socio-economic interviews within each cluster to 4 levels formapping purposes. The clusters with interview datawere then shaded based upon the response variable.Any clusters without interview data were shown in aneutral color; we cannot infer the effects of El Niño onareas within those clusters because interviews werenot conducted with people living there. Generally, theregions without interviews contained few Maasai withpermanent residences, or the interviewers were un-able to reach the areas due to lack of roads or tracks.
3. RESULTS
3.1. Maasai economy 1997–1998
The Maasai economy is based on livestock produc-tion, and where possible and permitted, agriculture isincreasing as a component of household income. Live-stock sales in these sites was however, the overwhelm-ing source of income, providing 88% of total income tothe Loliondo Maasai and 83% to Maasai in Ngoro-ngoro, followed far behind by crop sales (5% forLoliondo and 14% for Ngorongoro) (Smith 1999,Galvin et al. in press). The long rains of 1998 were hardon livestock herds. Cattle deaths from disease as a per-centage of total herd size was about 11% in Loliondoand 29% in Ngorongoro. Disease also accounted formore small stock (sheep and goats) deaths in Ngoro-ngoro (15%) than in Loliondo (11%). High diseaseincidence may account for more livestock sales inNgorongoro than in Loliondo (Table 2). However, in theprevious drought year of 1996/1997, an even higherpercentage of the livestock herd was sold, the pro-
ceeds from which were used primarily to purchasefood.
Agricultural plot size did not change within eacharea between years but the Ngorongoro harvest wasvery low in 1997, making it virtually impossible forpeople to live from their harvests (Table 3). It is nowonder that under these circumstances people sold ahigher percentage of their livestock herds in 1997 tofeed themselves.
3.2. Generalizing results to the region
Although interviews were conducted at 49 house-holds during 1997 and 1998, only 46 had adequate datafor our use. These households were well distributed be-tween Loliondo (n = 22 households) and Ngorongoro (n= 24). Because these data were collected without plansfor regional analyses, some households were close toeach other. The 46 households were located withinthirty-four 1 km cells. Given this, the maximum numberof clusters that contained interview data was 34.
The hypothesis that the extreme vegetation patternsof 1997 and 1998 were correlated with long-termvegetation patterns was upheld. When 1997 NDVIdata were compared to long-term data (1987–1996),the agreement was high, with a correlation coefficientof r > 0.86 for comparisons between monthly means. Acomparison between 1998 NDVI data from the El Niñoyear and long-term patterns yielded similar correla-tions (e.g., r > 0.80). The pattern of vegetation changeacross space was correlated through time, which lendssupport to the use of long-term (1992–1996) 1 km reso-lution NDVI data in cluster analyses and relating it tothe 1998 El Niño weather event.
In the search for optimum agreements between the 9household variables analyzed and the cluster maps,most graphs showed the predicted behavior. A maxi-mum discrimination was demonstrated at intermediatedistances down the tree of cluster hierarchies. Clusterswere related significantly (p < 0.05) to only 2 of thevariables, however. The numbers of sheep and goatssold in 1998 were significantly related to differences in
168
Table 2. Livestock sold in 1997 and 1998 as a percentage of the total herd
Ngorongoro Loliondo1997 1998 1997 1998
Cattle 11 3 4 2Small stock 14 5 3 1
Table 3. Agricultural plot size and yields in 1997 and 1998
Ngorongoro Loliondo1997 1998 1997 1998
Acres cultivated per 2.1 2.6 3.7 3.6household
Yield (kg) per 47 1444 1351 1469household
Yield (kg) per acre 25 476 344 485
Yield (kg) per person 5 86 107 191
Galvin et al.: Climate impacts on East African pastoralists
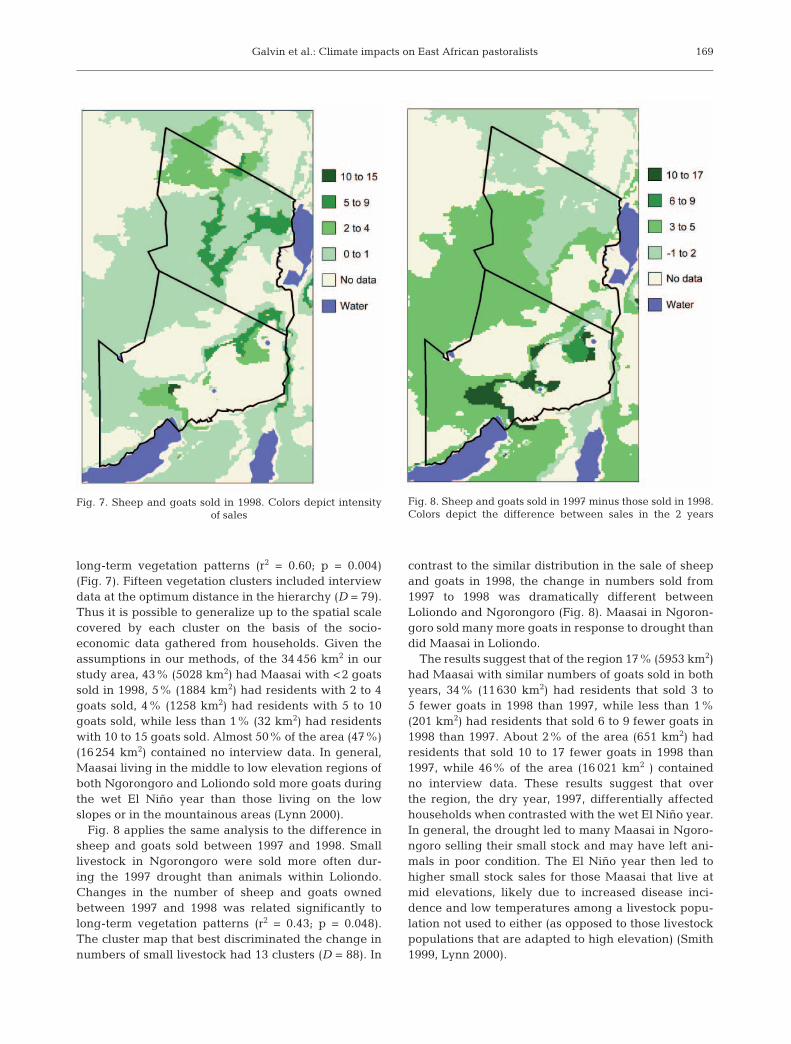
long-term vegetation patterns (r2 = 0.60; p = 0.004)(Fig. 7). Fifteen vegetation clusters included interviewdata at the optimum distance in the hierarchy (D = 79).Thus it is possible to generalize up to the spatial scalecovered by each cluster on the basis of the socio-economic data gathered from households. Given theassumptions in our methods, of the 34 456 km2 in ourstudy area, 43% (5028 km2) had Maasai with <2 goatssold in 1998, 5% (1884 km2) had residents with 2 to 4goats sold, 4% (1258 km2) had residents with 5 to 10goats sold, while less than 1% (32 km2) had residentswith 10 to 15 goats sold. Almost 50% of the area (47%)(16 254 km2) contained no interview data. In general,Maasai living in the middle to low elevation regions ofboth Ngorongoro and Loliondo sold more goats duringthe wet El Niño year than those living on the lowslopes or in the mountainous areas (Lynn 2000).
Fig. 8 applies the same analysis to the difference insheep and goats sold between 1997 and 1998. Smalllivestock in Ngorongoro were sold more often dur-ing the 1997 drought than animals within Loliondo.Changes in the number of sheep and goats ownedbetween 1997 and 1998 was related significantly tolong-term vegetation patterns (r2 = 0.43; p = 0.048).The cluster map that best discriminated the change innumbers of small livestock had 13 clusters (D = 88). In
contrast to the similar distribution in the sale of sheepand goats in 1998, the change in numbers sold from1997 to 1998 was dramatically different betweenLoliondo and Ngorongoro (Fig. 8). Maasai in Ngoron-goro sold many more goats in response to drought thandid Maasai in Loliondo.
The results suggest that of the region 17% (5953 km2)had Maasai with similar numbers of goats sold in bothyears, 34% (11630 km2) had residents that sold 3 to5 fewer goats in 1998 than 1997, while less than 1%(201 km2) had residents that sold 6 to 9 fewer goats in1998 than 1997. About 2% of the area (651 km2) hadresidents that sold 10 to 17 fewer goats in 1998 than1997, while 46% of the area (16 021 km2 ) containedno interview data. These results suggest that overthe region, the dry year, 1997, differentially affectedhouseholds when contrasted with the wet El Niño year.In general, the drought led to many Maasai in Ngoro-ngoro selling their small stock and may have left ani-mals in poor condition. The El Niño year then led tohigher small stock sales for those Maasai that live atmid elevations, likely due to increased disease inci-dence and low temperatures among a livestock popu-lation not used to either (as opposed to those livestockpopulations that are adapted to high elevation) (Smith1999, Lynn 2000).
169
Fig. 7. Sheep and goats sold in 1998. Colors depict intensity of sales
Fig. 8. Sheep and goats sold in 1997 minus those sold in 1998.Colors depict the difference between sales in the 2 years

Clim Res 19: 161–172, 2001
4. CONCLUSIONS
We were able to link household production informa-tion to clusters of vegetation biomass, thus expandingthe scale of our household analysis using quantitativemethods. We could ask the following question: Howdoes this improve our interpretation of land use? If wehad conducted a household study on the impacts of ElNiño, without the use of the satellite data, we wouldalso have attempted to make generalizations up tolarger spatial scales. However, the NDVI analysisbrings more rigor to the process of generalization. Bylinking the satellite data with the household levelinformation, we have gained the ability to map at aregional scale the distribution of the economic conse-quences of climate events that are meaningful to localcommunities over a much larger landscape than isotherwise possible. Use of either the social sciencedata or the remotely sensed data alone would not pro-vide as complete a picture as the combined data sets.
Much of the work linking social data and remotesensing data addresses land use change analyses. Forexample, Moran’s (e.g., Moran & Brondizio 1998) well-documented studies of land-use/land-cover changedynamics following deforestation is an excellent exam-ple of this type of work. Moran and his colleaguesexplored the human forces driving land-use change.This and similar studies (cf. Rindfuss & Stern 1998)have improved our understanding of the determinantsof land-use change. Here we have explored the inter-action between changes in vegetation, caused by cli-matic events, and human behavior. This is an impor-tant difference. As climate variability, such as El Niñoevents, increases in various regions of the world, it isimportant to understand how people are affected bysuch events and how they could better adapt to suchevents. Local-level process data are costly and timeconsuming to acquire, yet necessary. If we can gener-alize spatially from an understanding of social pro-cesses at the local level, then policy for mitigation andadaptation may be more appropriate.
Livestock keepers have options for dealing with cli-mate variability, which work if it is possible for them toactually exercise them. The data here suggest manydiseased animals were sold; herders could theoreti-cally change key management practices by sellinglivestock earlier or stocking up on veterinary suppliesbefore disease outbreaks. This could occur with ad-vance warning of such events by governments and thelivestock sector. Although theoretical benefits of fore-casts are real, there are several social, economic, andpolitical constraints that can prevent actions frombeing taken (Betsell et al. 1997, Stern & Easterling1999). Ability to respond to information depends onwhether herders actually receive the information,
believe it to be reliable and have the ability to changeherding practices or add to management. Appropriateinitiatives to reduce human vulnerability or to increaseeconomic well-being must account for climate variabil-ity. New developments in climate forecasting canprovide a basis for an ‘early warning’ for vulnerablepopulations in these regions whose agricultural andlivestock production is dependent on the vagaries ofrainfall.
Had this study been designed to specifically under-stand the relationship between social processes andregional vegetation patterns, we would have askedadditional questions about climate impacts. We wouldalso have sampled over a much broader spatial scale.Because we did not consider this when conductingfieldwork, our results are preliminary. Nevertheless,the methodology, though in an early stage, does showpromise for linking the behavior of households toregional-scale patterns of remotely sensed vegetationdata.
Human-environment interactions are iterative pro-cesses. Most people in the world structure their lives inconcert with their environmental contexts. Many socialscience theories link behavior to the local context inwhich the household is located, and there are environ-mental consequences of social, economic and demo-graphic processes. Remote sensing data combinedwith social science data on human behavioral pro-cesses have the potential to improve the understand-ing of these iterative processes.
Acknowledgements. This research was supported by theUS National Science Foundation (BNS-9100132 and SBR-9709762). This publication was also made possible throughsupport provided by the Office of Agriculture and Food Secu-rity, Global Bureau, United States Agency for InternationalDevelopment, under Grant No. PCE-G-98-00036-00. The op-inions expressed herein are those of the authors and do notnecessarily reflect the views of the US Agency for Interna-tional Development.
LITERATURE CITED
Africa News (1997) Heavy floods continue to wreak havoc inHorn, Kenya. AllAfrica Global Media, Washington, DC;available at www.africanews.org
Agar MH (1996) The professional stranger. Academic Press,New York
Anderberg MR (1973) Cluster analysis for applications. Acad-emic Press, New York
Anyamba A, Eastman JR (1996) Interannual variability ofNDVI over Africa and its relation to El Niño/SouthernOscillation. Int J Remote Sensing 13:2533–2548
Arhem K (1985) Pastoral man in the Garden of Eden. TheMaasai of Ngorongoro Conservation Area, Uppsala Re-search Report in Cultural Anthropology, Uppsala
Avery TE, Berlin GL (1992) Fundamentals of remote sensingand airphoto interpretation. Macmillian Publishing, NewYork
170

Galvin et al.: Climate impacts on East African pastoralists
Behnke R, Scoones I, Kerven C (1993) Range ecology at dis-equilibrium. Overseas Development Institute, London
Betsell MM, Glantz MH, Crandall K (1997) Preparing for ElNiño: What role for forecasts? Environment 39(10):6–13
Eklundh L (1998) Estimating relations between AVHRR NDVIand rainfall in East Africa at 10-day and monthly timescales. Int J Remote Sensing 19:563–568
Ellis J, Galvin KA (1994) Climate patterns and land-use prac-tices in the dry zones of Africa. Bioscience 44(5):340–349
Ensminger J (1992) Making a market: the institutional trans-formation of an African society. Cambridge UniversityPress, New York
Fowler FJ Jr (1993) Survey research methods, 2nd edn.Applied Social Research Methods Series, Vol 1. Sage Pub-lications, London
Fratkin E (1997) Pastoralism: governance and developmentissues. Annu Rev Anthropol 26:235–261
Galvin KA (1988) Nutritional status as an indicator of impend-ing food crisis. Disasters 12(2):147–156
Galvin KA (1992) Nutritional ecology of pastoralists in drytropical Africa. Am J Human Biol 4:209–221
Galvin KA, Coppock DL, Leslie PW (1994) Diet, nutrition andthe pastoral strategy. In: Fratkin E, Galvin KA, Roth EA(eds) African pastoralist systems: an integrated approach.Lynne Rienner, Boulder, p 113–132
Galvin KA, Ellis J, Boone RB, Magennis AL, Smith NM, LynnSJ, Thornton P (in press) Compatibility of pastoralism andconservation? A test case using integrated assessment inthe Ngorongoro Conservation Area, Tanzania. In: ChattyD, Colester M (eds) Displacement, forced settlement andconservation. Berghahn, Oxford
Government of Kenya Meteorological Service (1998) The El-Niño Rains of October 1997 to January 1998 in Kenya.Kenya Meteorological department, Nairobi; available atwww.meteo.go.ke/pws/elnino.html
Grandin BE (1988) Wealth and pastoral dairy production: Acase study from Maasailand. Human Ecol 16(1):1–21
Grandin BE (1991) The Maasai: socio-historical context andgroup ranchers. In: Bekure S, deLeeuw PN, Grandin BE,Neate PJH (eds) Maasai herding: an analysis of the live-stock production system of Maasai pastoralists in EasternKajiado District, Kenya. ILCA Systems Study 4. ICLA(International Livestock Centre for Africa), Addis Ababa,p 21–39
Hargrove WW, Luxmoore RJ (1997) A spatial clustering tech-nique for the identification of customizable ecoregions.Environmental Systems Research Institute InternationalUser Conference, July 8–11, Redlands, CA. EnvironmentalSystems Research Institute, Inc, Redlands, CA; available atwww.esri.com/library/userconf/proc97/HOME.HTM
Homewood K (1992) Development and the ecology of Maasaipastoralist food and nutrition. Ecol Food Nutrition 29:61–80
Homewood K, Rodger WA, Arhem K (1987) Ecology of pas-toralism in Ngorongoro Conservation Area, Tanzania.J Agric Sci Camb 108:47–72
Horn of Africa Review (1997) Horn of Africa Review compiledby the UNDP-EUE, 6/1-7/31 1997. University of Penn-sylvania, Philadelphia; available at www.sas.upenn.edu/Africa_Studies/Newsletters/har_797.html
ICRC (International Committee of the Red Cross) (1997)Lethal floods create emergency in Somalia. Nando Media,Raleigh, NC; available at www.nando.net
Jorgensen DL (1989) Participant observation: a methodologyfor human studies, Vol 15. Sage, London
Kerven C (1992) Customary commerce: a historical reassess-ment of pastoral livestock marketing in Africa. ODI Agr
Occas Pap 15. Overseas Development Institute, LondonKogan FN (1998) A typical pattern of vegetation conditions
in southern Africa during El Niño years detected fromAVHRR data using three-channel numerical index. Int JRemote Sensing 19:3689–3695
Krohn WB, Boone RB, Painton SL (1999) Quantitative delin-eation and characterization of hierarchical biophysicalregions of Maine. Northeast Naturalist 6:125–150
Little PD, Brokensha DW (1987) Local institutions, tenure andresource management in East Africa. In: Anderson P,Grove R (eds) Conservation in Africa: people, policiesand practice. Cambridge University Press, Cambridge,p 193–209
Lynn S (2000) Conservation policy and local ecology: Effectson Maasai land use patterns and human welfare in North-ern Tanzania. MS thesis, Department of Range and Eco-system Science, Colorado State University, Fort Collins
MacLeod J (1987) Ain’t no making it. Westview Press,Boulder, CO
McCracken G (1998) The long interview. Qualitative Re-search Methods Series 13. Sage Publications, London
Moran E, Brondizio E (1998) Land-use change after deforesta-tion in Amazonia. In: Liverman D, Moran EF, Rindfuss RR,Stern PC (eds) People and pixels. Linking remote sensingand social science. National Academy Press, Washington,DC, p 94–120
Mwalyosi RBB (1992) Land-use changes and resource degra-dation in south-west Maasailand, Tanzania. Environ Con-serv 19(2):145–152
Nabakwe R (1999) Tanzania may import food due to drought.Panafrican News Agency. Africa News Online, AllAfricaGlobal Media, Washington, DC; available at www.africanews.org/east/tanzania/stories/19990316_feat1.html
Nestel P (1986) A society in transition: developmental andseasonal influences on the nutrition of Maasai women andchildren. Food Nutrition Bull 18(1):2–18
Ngugi RK (1999) Use of indigenous and contemporary knowl-edge on climate and drought forecasting information inMwingi District, Kenya. Report to UNDP, Nairobi
Nicholson SE (1993) An overview of African rainfall fluctua-tions of the last decade. J Clim 6:1463–1466
Nicholson SE (1994) Recent rainfall fluctuations in Africa andtheir relationship to past conditions over the continent.The Holocene 4(2):121–131
Omi PN, Wensel LC, Murphy JL (1979) An application of mul-tivariate statistics to land-use planning: classifying landunits into homogeneous zones. Forest Sci 25:399–414
Rigby P (1985) Persistent pastoralists. Zed Books, LondonRindfuss RR, Stern PC (1998) Linking remote sensing and
social science: The need and the challenges. In: LivermanD, Moran EF, Rindfuss RR, Stern PC (eds) People and pix-els. Linking remote sensing and social science. NationalAcademy Press, Washington, DC, p 1–27
Sandford S (1983) Management of pastoral development inthe Third World. Wiley, New York
Smith NM (1999) Maasai household economy: a comparisonbetween the Loloiondo game controlled area and theNgorongoro Conservation Area, Northern Tanzania. MAthesis, Department of Anthropology, Colorado State Uni-versity, Fort Collins
Sperling L, Galaty JG (1990) Cattle, culture and economy:Dynamics in East African pastoralism In: Galaty JG, John-son DL (eds) The world of pastoralism: herding systemsin comparative perspective. Guilford Press, New York,p 69–98
Stern PC, Easterling WE (1999) Making climate forecastsmatter. National Academy Press, Washington, DC
171

Clim Res 19: 161–172, 2001
Talle A (1987) Women as heads of houses: the organization ofproduction and the role of women among pastoral Maasaiof Kenya. Ethnos 52(I-ii):50–80
USGS (US Geological Survey) (1998) Global land 1-kmAVHRR project. EROS Data Center, Sioux Falls, SD; avail-able at edcwww.cr.usgs.gov/landdaac/1KM/1kmhome-page.html
USGS (1999) Dekad normalized difference vegetation index(NDVI) for Africa. EROS Data Center, International Pro-gram, Sioux Falls, SD; available at edcintl.cr.usgs.gov/
adds.adds.htmlWashington Post (1998) El Niño’s cruelty rains on Central,
East Africa. March 2, 1998Wilkinson L (1990) SYSTAT: the system for statistics. SYSTAT,
Inc, Evanston, ILWishart D (1999) ClustanGraphics primer: a guide to cluster
analysis. Clustan Limited, EdinburghWorld Meteorological Organization (1998) El Niño update
2/98. WMO, Geneva; available at www.wmo.ch/nino/updat.html
172
Submitted: February 15, 2000; Accepted: February 13, 2001 Proofs received from author(s): October 30, 2001