Embed Size (px)
Citation preview

RESEARCH ARTICLE
Impacts of climate change on high priority
fruit fly species in Australia
Sabira SultanaID1,2*, John B. Baumgartner1,3, Bernard C. Dominiak4, Jane E. Royer5,
Linda J. Beaumont1
1 Department of Biological Sciences, Macquarie University, North Ryde, New South Wales, Australia,
2 Department of Zoology, Jahangirnagar University, Savar, Dhaka, Bangladesh, 3 Centre of Excellence for
Risk Analysis (CEBRA), School of BioSciences, University of Melbourne, Parkville, VIC, Australia, 4 New
South Wales Department of Primary Industries, Orange, New South Wales, Australia, 5 Queensland
Department of Agriculture and Fisheries, Biosecurity Queensland, Brisbane, Queensland, Australia
Abstract
Tephritid fruit flies are among the most destructive horticultural pests posing risks to Austra-
lia’s multi-billion-dollar horticulture industry. Currently, there are 11 pest fruit fly species of
economic concern in Australia. Of these, nine are native to this continent (Bactrocera aquilo-
nis, B. bryoniae, B. halfordiae, B. jarvisi, B. kraussi, B. musae, B. neohumeralis, B. tryoni
and Zeugodacus cucumis), while B. frauenfeldi and Ceratitis capitata are introduced. To
varying degrees these species are costly to Australia’s horticulture through in-farm manage-
ment, monitoring to demonstrate pest freedom, quarantine and trade restrictions, and crop
losses. Here, we used a common species distribution model, Maxent, to assess climate suit-
ability for these 11 species under baseline (1960–1990) and future climate scenarios for
Australia. Projections indicate that the Wet Tropics is likely to be vulnerable to all 11 species
until at least 2070, with the east coast of Australia also likely to remain vulnerable to multiple
species. While the Cape York Peninsula and Northern Territory are projected to have suit-
able climate for numerous species, extrapolation to novel climates in these areas decreases
confidence in model projections. The climate suitability of major horticulture areas currently
in eastern Queensland, southern-central New South Wales and southern Victoria to these
pests may increase as climate changes. By highlighting areas at risk of pest range expan-
sion in the future our study may guide Australia’s horticulture industry in developing effective
monitoring and management strategies.
Introduction
Tephritid fruit flies are one of the most destructive and economically significant pest insect
families, attacking a wide range of fruit and vegetables. While the family contains more than
4000 species, around 350 are recognized as economically important horticultural pests [1] that
have significant impacts on global horticultural production and market access. In Australia,
the average annual value of crops susceptible to fruit flies is ~$4.8 billion [1], and the National
Fruit Fly Strategy has identified 46 species as ‘high priority pests’ [2] of concern. The majority
of these species are exotic to Australia, primarily found in South-East Asia and the South
PLOS ONE | https://doi.org/10.1371/journal.pone.0213820 February 13, 2020 1 / 19
a1111111111
a1111111111
a1111111111
a1111111111
a1111111111
OPEN ACCESS
Citation: Sultana S, Baumgartner JB, Dominiak BC,
Royer JE, Beaumont LJ (2020) Impacts of climate
change on high priority fruit fly species in Australia.
PLoS ONE 15(2): e0213820. https://doi.org/
10.1371/journal.pone.0213820
Editor: Nikos T. Papadopoulos, University of
Thessaly School of Agricultural Sciences, GREECE
Received: March 1, 2019
Accepted: January 22, 2020
Published: February 13, 2020
Copyright: © 2020 Sultana et al. This is an open
access article distributed under the terms of the
Creative Commons Attribution License, which
permits unrestricted use, distribution, and
reproduction in any medium, provided the original
author and source are credited.
Data Availability Statement: Data availability The
findings of our study were supported by publicly
available data sourced from the Atlas of Living
Australia (ALA; http://www.ala.org.au, 22nd
December, 2016) and the Global Biodiversity
Information Facility (GBIF, https://www.gbif.org,
28th June, 2017). Additionally, we sourced data
from the Australian Plant Pest Database (APPD;
http://www.planthealthaustralia.com.au/resources/
australian-plant-pest-database, accessed 15th
March 2017) and from Australian State
Government department collections (Biosecurity
and Food Safety, Department of Primary

Pacific [1, 2], and are yet to establish populations in Australia. Of the 11 species that are cur-
rently present in Australia [1–3] (Table 1), seven are reported to cause significant economic
losses (Bactrocera aquilonis, B. jarvisi, B. neohumeralis, B. musae, B. tryoni, Ceratitis capitata,
and Zeugodacus cucumis) [1, 4]. Combined, these species infest a wide variety of hosts, with
some (e.g. B. frauenfeldi, B. jarvisi, B. neohumeralis, B. tryoni and Ceratitis capitata) being
highly polyphagous [3].
The distributions of Australia’s pest fruit fly species are influenced by their climatic toler-
ances and the distributions of their hosts. Bactrocera originated in tropical regions, and have
their highest richness in rainforests [5]. However, over the last 100 years, as horticulture has
proliferated across Australia, some species have expanded their geographic range and host
breadth [6]. Of the 11 high priority fruit fly species presently on the continent, three are cur-
rently restricted to north-east Queensland (B. frauenfeldi, B. kraussi and B. musae) [7]. In con-
trast, the geographic range of B. neohumeralis (Lesser Queensland fruit fly) extends along
eastern Australia, from Queensland to central New South Wales (NSW) [3, 4, 7]. Previous cli-
matic analysis indicates that this species also has the potential to establish elsewhere in north-
ern Australia [4]. The remaining species have substantially wider climate tolerances, and are
found across broad regions of the continent. For instance, B. tryoni (Qfly) ranges across much
of eastern Australia, eastern Queensland and northern regions of the Northern Territory [8].
Bactrocera jarvisi (Jarvis’ fruit fly) extends from northwest Western Australia, across the
Northern Territory to northern Queensland and the Torres Strait Islands [4, 9], and in favour-
able years may spread down the east coast of Australia into northern coastal NSW [4, 9].
Hence, B. jarvisi and B. tryoni have overlapping geographic ranges and infest many of the
same hosts [4]. Ceratitis capitata (Medfly) originated in the Afrotropical region [10], and was
introduced into the Perth area (Western Australia) in the late 1800s [4]. Before quarantine
controls were developed, this species spread to NSW, Victoria, and other parts of Australia
[11]. However, for reasons that remain unclear, Qfly is believed to have displaced Medfly
throughout most of its former Australian range [12], and now Medfly is confined to Western
Australia, with occasional detections in South Australia [13].
Given the threat that these 11 fruit fly species pose threats to Australia’s horticulture indus-
tries, and to backyard growers, controlling them is imperative for the viability of Australian
horticulture, necessitating in-farm management and pest treatment, monitoring to demon-
strate pest freedom, and quarantine and trade restrictions [1, 2]. These controls, along with
loss of market access, are estimated to cost Australian growers $100 million per annum [4], in
addition to losses of up to $159 million per annum due to infestation of fruit and vegetable
crops [14]. The annual cost, as reported in 2012, of bait and cover spray, and post-harvest
treatments, amounts to $269 ha-1 and $62.36 tonne-1, respectively [15], while maintaining fruit
fly free areas is estimated to exceed $28 million per annum based on data from 2009–2011
[16]. However, restrictions were recently placed on the use of insecticides to control fruit flies
due to concerns about toxicity [17], with dimethoate and fenthion suspended or highly
restricted for many horticultural crops [17–20]. Other approaches, including Sterile Insect
Techniques, are now being explored. Regardless, it has been estimated that the annual likeli-
hood of an incursion by an exotic fruit fly species is 21% [15], and the annual cost of eradicat-
ing these incursions is ~$13 million [16], with rapid responses to outbreaks being crucial for
eradication success [21]. Even brief incursions can result in significant economic damage due
to market access restrictions that may be imposed. However, climate change is likely to alter
the distribution of suitable habitat for fruit fly species and the areas vulnerable to outbreaks,
and this could have serious repercussions for Australian horticulture [22].
Previous studies [22–24] have used the semi-mechanistic species distribution model
(SDM), CLIMEX, to estimate the potential geographic distributions of several high priority
Impacts of climate change on high priority fruit fly species in Australia
PLOS ONE | https://doi.org/10.1371/journal.pone.0213820 February 13, 2020 2 / 19
Industries, NSW; Biosecurity Queensland and the
Queensland Department of Agriculture and
Fisheries; Department of Economic Development,
Jobs, Transport and Resources, Victoria; and
Department of Primary Industries and Regions
South Australia (PIRSA)). Restrictions apply to the
availability of these data, which were used under
license for the current study. Climate data were
sourced from WorldClim (http://www.worldclim.
org), and are publicly available. Code availability All
modelling and post-modelling analyses and
calculation of statistics were performed in R
version 3.1.2. We used the sp and raster packages
for preparation and manipulation of spatial data,
the dismo package to fit Maxent models, and
custom R code for rapid projection of fitted
models.
Funding: "Project Raising Q-fly Sterile Insect
Technique to World Standard (HG14033) is funded
by the Hort Frontiers Fruit Fly Fund, part of the Hort
Frontiers strategic partnership initiative developed
by Hort Innovation, with co-investment from
Macquarie University and contributions from the
Australian Government."
Competing interests: The authors have declared
that no competing interests exist

fruit fly species, based on their performance along climatic gradients. While highly useful in
furthering our understanding of climate impacts on fruit flies, these studies have either focused
on other countries or have explored global patterns of the distribution of suitable climate [22–
26]. Here we assess how climate change may result in shifts to the distribution of climatically
suitable habitat for the 11 high priority fruit fly species present in Australia, using the correla-
tive SDM, Maxent [27]. This SDM has been used extensively to assess the distribution of suit-
able habitat for a broad range of pests and invasive species [26, 28–31]. We also highlight areas
at risk of pest range shifts, to guide Australia’s horticulture industries in developing effective
monitoring and management strategies.
Methodology
Species occurrence data
We collected occurrence data for the 11 species from five sources: the Australian Plant Pest Data-
base (APPD; http://www.planthealthaustralia.com.au/resources/australian-plant-pest-database,
accessed 15th March 2017), the Atlas of Living Australia (ALA; http://www.ala.org.au, 22nd
December, 2016), the Global Biodiversity Information Facility (GBIF, https://www.gbif.org, 28th
June, 2017, see S1 File for DOIs), trap data, and existing literature. APPD is a national digital
Table 1. Eleven economically-significant tephritid pest species present in Australia.
Species Common name Geographical Range Major Commercial Hosts [32] References
Bactrocera aquilonis (May) Northern Territory
fruit fly
Top End of the Northern Territory (NT), northern
areas of Western Australia
Bell pepper, tomato, lemon, mandarin,
grapefruit, apple, mango, peach
[1]
Bactrocera bryoniae(Tryon)
N/A Torres Strait Islands, mainland Queensland,
northern Western Australia, NT, NSW as far south
as Sydney
Chilli, tomato [3]
Bactrocera halfordiae(Tryon)
Halfordia fruit fly North Queensland to the Sydney region in NSW Citrus [3]
Bactrocera jarvisi (Tryon) Jarvis’ fruit fly Northwest Western Australia, NT, northwest
Queensland, eastern Australia from Cape York to
Sydney, NSW
Mango, peach, banana, pear, apple, pawpaw,
persimmon
[3]
Bactrocera kraussi (Hardy) Krauss’ fruit fly Torres Strait Islands, northeast Queensland as far
south as Townsville
Grapefruit, mandarin, orange, mango, peach and
banana
[3, 7]
Bactrocera musae (Tryon) Banana fruit fly Torres Strait Islands, northeast Queensland as far
south as Townsville
Banana [3, 7]
Bactrocera neohumeralis(Tryon)
Lesser Queensland
fruit fly
Torres Strait Islands, eastern Queensland,
northern NSW
Mango, pawpaw, persimmon, avocado, banana,
passionfruit, apple, apricot, plum, peach, citrus,
capsicum, chilli, tomato
[3]
Bactrocera tryoni(Froggatt)
Queensland fruit fly
(Qfly)
Central and Top End of NT, eastern Australia,
Victoria
Mango, pawpaw, avocado, grapefruit,
passionfruit, strawberry, peach, pear, apple,
banana, persimmon, chilli, capsicum, tomato,
eggplant
[3,31]
Zeugodacus cucumis(French) (formerly
Bactrocera cucumis)
Cucumber fruit fly Eastern Queensland, northeast NSW, NT Cucumber, pumpkin, zucchini, squash,
passionfruit, tomato, pawpaw
[3]
Bactrocera frauenfeldi(Schiner)
Mango fruit fly Native to Papua New Guinea and surrounding
islands, spread to Torres Strait Islands and
northern Queensland as far south as Townsville
Mango, banana, passionfruit, citrus, chilli [7]
Ceratitis capitata(Wiedemann)
Mediterranean fruit
fly (Medfly)
Native to Africa, spread to the Mediterranean
regions, Western Australia, occasional detections
in South Australia and NT are eradicated.
Mango, pawpaw, apple, peach, pear, citrus [3, 28, 31]
Eleven tephritid pest species present in Australia, including nine natives (B. aquilonis, B. bryoniae, B. halfordiae, B. jarvisi, B. kraussi, B. musae, B. neohumeralis, B.
tryoni and Z. cucumis) and two introduced species (B. frauenfeldi and C. capitata), and their major commercial hosts.
https://doi.org/10.1371/journal.pone.0213820.t001
Impacts of climate change on high priority fruit fly species in Australia
PLOS ONE | https://doi.org/10.1371/journal.pone.0213820 February 13, 2020 3 / 19

database of plant pest and pathogen specimens held within herbaria and insect collections across
Australia. It is a powerful tool for market access and emergency responses to pest incursion, and
supports associated research activities. ALA is Australia’s largest digital database of species occur-
rence records, containing information from a wide array of data providers including Australia’s
major museums and government departments. GBIF provides similar data at a global scale. Before
downloading data from APPD, ALA and GBIF, we applied filters to restrict records to those that
were resolved to species-level, were dated no earlier than 1 January 1950, contained valid geo-
graphic coordinates, and were not flagged as ‘environmental outliers’.
We also collected trap data from various state government departments (Biosecurity and
Food Safety, Department of Primary Industries, NSW; Biosecurity Queensland and the
Queensland Department of Agriculture and Fisheries; Department of Economic Development,
Jobs, Transport and Resources, Victoria; and Department of Primary Industries and Regions
South Australia (PIRSA)). Trap data from these sources were collected at different periods
from 1996 to 2017. Finally, we also obtained occurrence data from the literature [1–4, 6, 7, 11,
33–37].
Major commercial fruit and vegetable hosts
For each of the 11 fruit fly species, we compiled information on the major commercial hosts
on which infestation has been recorded. For this purpose, we defined major fruit and vegetable
host species according to the Australian Horticulture Statistics Handbook (HSHB; www.
horticulture.com.au) for the year 2016/2017 [32]. This document consolidates horticulture sta-
tistics of interest to industry members and other stakeholders. The data contained in HSHB
were derived from the Australian Bureau of Statistics, projects funded by Hort Innovation,
international trade sources and horticulture industry representative bodies where available.
Climate data
For baseline and future climate conditions we used the bioclimatic variables available within
the WorldClim database (v1.4), at a spatial resolution of 30 arc-seconds [38] (approximately 1
km; http://www.worldclim.org). These data, based on meteorological records for the period
1960–1990, comprise 19 climatic variables, 11 of which are temperature-based while eight
relate to precipitation. Combined, the data represent annual trends, seasonality, and limiting
or extreme environmental conditions. Assuming that host plants are available, temperature
and moisture are the key factors influencing fruit fly reproduction and survival [18, 39]. Thus,
these variables were chosen as predictor candidates based on the fruit flies’ biology and eco-
logical requirements, and similar habitat suitability studies undertaken on other insects [40].
For each species, we identified a set of ecologically-relevant variables, with minimal collinear-
ity, that resulted in high predictive power for the model [41] (described below).
When projecting future suitability, we considered a range of climate scenarios to acknowl-
edge this important aspect of uncertainty. CSIRO recommends eight global climate models
(GCMs) as being useful for Australian climate impact assessments [42]. Data from six of these
models were available from the CCAFS GCM Data Portal (http://www.ccafs-climate.org/data_
spatial_downscaling/), at a spatial resolution of 30 arc seconds. These data were developed
from anomalies of the original GCM data that were statistically downscaled using a thin plate
spline spatial interpolation, and then applied to the WorldClim v1.4 baseline. The GCMs
included: CanESM2 (The Second Generation of Canadian Earth System Model); ACCESS1.0
(The Australian Community Climate and Earth System Simulator); MIROC5 (Model for
Interdisciplinary Research on Climate); HadGEM2-CC (Hadley Centre Global Environmental
Model Version 2 Carbon Cycle); NorESM1-M (The Norwegian Earth System Model-Part-1);
Impacts of climate change on high priority fruit fly species in Australia
PLOS ONE | https://doi.org/10.1371/journal.pone.0213820 February 13, 2020 4 / 19

and GFDL-ESM2M (Global Coupled Climate Carbon Earth System Model Part-1). CanESM2
projects a hot future with drying across central regions of Australia and higher precipitation in
the north-east. ACCESS1.0 projects a hot and dry future across most areas of Australia, while
MIROC5 projects moderate warming, with drying in the north-east and south-west but higher
precipitation in central Australia. NorESM1-M projects moderate warming. HadGEM2-CC
and GFDL-ESM2M project a hot future with greater warming typically in central regions.
We downloaded the 19 bioclimatic variables from these six models from CCAF, for 20-year
periods centred on 2030, 2050 and 2070, for the Representative Concentration Pathway 8.5
(RCP8.5) [43]. With a radiative forcing exceeding 8.5 Wm-2 by 2100, this is the highest of the
four RCPs presented in the Intergovernmental Panel on Climate Change’s Fifth Assessment
Report [43]. It is also the RCP that emissions are currently tracking most closely [44]. After
downloading, we reprojected data to a spatial resolution of 1 × 1 km (Australian Albers Equal
Area, EPSG: 3577) via bilinear interpolation, using the gdalwarp function provided by the R
package gdalUtils [45] in R version 3.1.2 [46].
Species distribution models
We used the machine learning approach, Maxent (v3.3.3k [27]), to assess climate suitability for
species under baseline and future climate scenarios. Maxent accommodates presence-only
data and has performed well in multimodel assessments [47]. It produces a continuous proba-
bility surface, which can be interpreted as an index of climatic suitability given the predictor
variables included in model calibration. Detailed descriptions of Maxent are given elsewhere
[48, 49]. We optimized models by assessing the effects of different combinations of feature
types, of competing predictor sets deemed ecologically sensible a priori, and of the extent of
regularization on model performance. We found that Maxent performed best when product
(first-order interactions), linear and quadratic features were used, with a regularization multi-
plier of 1 (the default), and used this configuration to calibrate our final models.
Maxent requires background data, to which it compares the environmental characteristics
of presence locations. There is flexibility for users to specify which points to use as background,
as well as the number of records and the spatial extent from which they are chosen [48]. Fol-
lowing Ihlow et al [50], we generated background points by randomly selecting up to 100,000
cells from terrestrial areas within 200 km of occurrence records of the target species. Our
choice of background achieves a balance between fine-scale discrimination of suitable and
unsuitable sites along environmental gradients, and generalization of model predictions.
To assess model performance, we used five-fold cross-validation to reduce model errors
that may occur from the random splitting of data into test and training subsets. The perfor-
mance of each model was evaluated using the area under the receiver operating characteristic
curve (AUC), which describes the consistency with which a model ranks randomly chosen
presence sites as more suitable than randomly chosen background sites. AUC ranges from 0 to
1, with a value of 0.50 indicating discrimination ability no better than random, while values
greater than 0.75 indicates that the model has a discriminative ability that is better than “fair”
[51]. Cross-validated AUC scores were presumed to reflect the performance of a single final
model for each species, which used all available data.
Following previous studies of pest species [26], continuous suitability scores projected by
Maxent models were converted to binary layers (0 = unsuitable, 1 = suitable) using the 10th
percentile training presence threshold (i.e. the value that corresponds to 10% training omis-
sion). We note that the selection of a threshold value may vary depending upon the goals of
the study [52], thus we also provide continuous output for baseline climate as supplemental
data (S1 File). For each species, the six binary suitability grids (i.e., one for each GCM, with
Impacts of climate change on high priority fruit fly species in Australia
PLOS ONE | https://doi.org/10.1371/journal.pone.0213820 February 13, 2020 5 / 19

cells assigned 0 when unsuitable and 1 when suitable) for each time period were summed to
produce a consensus map, identifying agreement about the suitability of grid cells across the
six climate scenarios. Each species’ consensus map was then converting to a binary map indi-
cating whether cells were projected to be suitable under the majority of GCMs (i.e., suitable
in< 4 GCMs = 0, suitable in 4 or more = 1). The resulting binary maps were summed across
species to identify hotspots—grid cells suitable for multiple pest species. Finally, we compared
the distribution of hotspots to that of major horticultural crops.
When projecting models, extrapolation to conditions beyond the range of the training data
may be unreliable. Following Elith et al. [53] we developed MESS (multivariate environmental
similarity surface) maps to identify regions of extrapolation [53]. By revealing areas with novel
environmental conditions, MESS maps can be used as a projection mask, highlighting regions
for which less confidence can be placed in projections, or as a quantitative measure of predic-
tion uncertainty [53]. We then recalculated the size of projected suitable climate with novel
environments excluded.
All modelling and post-modelling analyses and calculation of statistics were performed in R
version 3.1.2 [46]. We used the sp [54] and raster [55] packages for preparation and manipula-
tion of spatial data, the dismo [56] package to fit Maxent models, and custom R code for rapid
projection of fitted models.
Results
Model performance
Model performance for all species was better than random, with average cross-validated AUC
ranging from 0.815 (SD = 0.05; B. frauenfeldi) to 0.907 (SD = 0.02; B. neohumeralis) (S1 File).
Bactrocera aquilonis. Our model suggested that, during the baseline period, climatically
suitable habitat for B. aquilonis existed in the northern regions of the Northern Territory and
Western Australia, as well as northern Queensland where this fly has not been reported (S1
File). The variables with the highest permutation importance were precipitation of the wettest
quarter (68.9%) and annual mean temperature (28.9%) (S1 File).
As the century progresses, the geographic extent of climatically suitable habitat for this spe-
cies is projected to increase and expand southwards under all six scenarios, with many areas
suitable in the baseline period projected to remain so until at least 2070 (S1 File). This includes
northern Western Australia, much of the Northern Territory, and north-western Queensland
(S1 File). We note, however, that climate scenarios beyond 2030 frequently contain novel con-
ditions across the northern regions of Australian, highlighting uncertainty in Maxent projec-
tions within these areas (S1 File).
Key horticultural crops for B. aquilonis are Mangifera indica (mango), Citrus × paradisi(grapefruit), Malus domestica (apple), Prunus persica (peach) and Citrus sp. (citrus) (S1 File).
The major regions where these crops are currently grown include the Northern Territory and
north-east Western Australia. These regions may remain suitable for B. aquilonis until at least
2070. Similarly, fruit growing regions in the Wet Tropics (north-east Queensland) are likely to
increase in suitability in the future. Other major host-plant growing regions in the south and
east of the continent will likely remain unsuitable (S1 File).
Bactrocera bryoniae. Suitable habitat for B. bryoniae during the baseline period is pro-
jected to have occurred along the northern and eastern coastlines (S1 File). Temperature
annual range and precipitation of the driest month contributed the most to the model for this
species (42.2% and 27.4%, respectively) (S1 File).
By 2070, suitable habitat is projected to increase under all scenarios except GFDL-ESM2M
(which projects a hot, very dry future) (S1 File), expanding to the southern coastlines of
Impacts of climate change on high priority fruit fly species in Australia
PLOS ONE | https://doi.org/10.1371/journal.pone.0213820 February 13, 2020 6 / 19

Victoria and Western Australia. Under 1–3 scenarios, suitable habitat is projected to shift
inland in Queensland and NSW. However, the amount of habitat projected to be suitable
under all six scenarios remains relatively stable from 2030–2070 (S1 File). Beyond 2030, novel
conditions are primarily restricted to the north-western regions (S1 File).
The major horticultural host for B. bryoniae is Capsicum annuum (chilli) (S1 File). Our
model indicates that key growing regions for this crop in Queensland contained suitable habi-
tat for B. bryoniae during the baseline period, and this will continue to be the case until at least
2070 (S1 File).
Bactrocera frauenfeldi. Climatically suitable habitat for the baseline period is projected
to have been mostly confined to Cape York Peninsula and the Wet Tropics, although small
areas in northern Western Australia and the Northern Territory from which the species has
not been recorded were also classified as suitable (S1 File). The most important variable in the
model for B. frauenfeldi was precipitation of the wettest quarter (75.4%) (S1 File).
As the century progresses, suitable habitat is projected to expand under all scenarios except
CanESM2 (S1 File). This scenario projects a hot, very dry future, leading to loss of suitable
habitat in northern Queensland by 2050. However, the extent of suitable habitat for this species
is likely to remain small, relative to other species. In addition, the far north-east of Queensland
contains novel conditions, decreasing confidence that this area will be suitable as the century
progresses. As with other species, the Wet Tropics is projected to remain suitable and is not a
region in which the model is extrapolating.
The major crops for B. frauenfeldi are Mangifera indica (mango) and Carcica papaya (paw-
paw) (S1 File). Major production regions in north-western Northern Territory may remain
suitable for this species until at least 2070, although there is substantial uncertainty across the
climate scenarios. In contrast, it is very likely that the Wet Tropics will remain suitable until at
least 2070, irrespective of the climate scenario (S1 File).
Bactrocera halfordiae. Baseline climatically suitable habitat for B. halfordiae occurred in
the Wet Tropics and subtropics, from north Queensland to eastern New South Wales (S1
File). Precipitation of the driest month (66.8%) and annual mean temperature (32.3%) con-
tributed most to this model (S1 File).
The geographic extent of suitable habitat is projected to vary considerably across the six cli-
mate scenarios. As the century progresses, gains in new habitat may exceed losses under some
scenarios (e.g. see ACCESS and MIROC5 in S1 File) while losses are projected under the
CanESM2 scenario (which projects a hot future, drying across central regions and higher pre-
cipitation in the north-east), mostly due to contractions in the south and east. Across the sce-
narios there is consensus that lower elevation regions in the south-east will be suitable.
Furthermore, MESS maps indicate little model extrapolation for this species (S1 File).
Crops in the Wet Tropics may continue to be at risk from this species, until at least 2070.
However, only 1–2 scenarios project horticultural regions in southern Queensland to retain
suitable climate (S1 File). Although horticultural regions along the NSW-Victorian border are
projected to have been unsuitable for B. halfordiae in the baseline period, these areas may
become suitable between 2050–2070 under some scenarios (S1 File).
Bactrocera jarvisi. Suitable habitat for this species is projected to have been mostly con-
fined to northern Western Australia, the Top End of the Northern Territory, and eastern Aus-
tralia from Cape York to NSW during the baseline period (S1 File). Annual mean temperature
(38.0%) and precipitation of driest month (37.2%) had the highest contributions to the model
for this species (S1 File).
There is substantial consensus across the six scenarios that regions currently suitable for B.
jarvisi will remain so until at least 2070 (S1 File). In addition, across some models gains are
Impacts of climate change on high priority fruit fly species in Australia
PLOS ONE | https://doi.org/10.1371/journal.pone.0213820 February 13, 2020 7 / 19

projected to occur in central Queensland, Western Australia, and the Northern Territory,
although model extrapolation occurs under several climate scenarios (S1 File).
Comparing the distribution of suitable habitat for this fly with that of its major host crops
indicates that crops grown in the Top End of the Northern Territory, and in eastern Australia
from Cape York to New South Wales, may continue to be at risk until at least 2070. Other
major host-plant growing regions in the south and west of the continent will also remain suit-
able for this species until 2070 (S1 File).
Bactrocera kraussi. For the baseline period, suitable habitat for B. kraussi is projected to
have occurred across the northern tip of Australia and northeast Queensland, as far south as
Townsville (S1 File). Precipitation of the wettest quarter (75.19%) had the highest contribution
to the model of B. kraussi (S1 File).
There is consensus across the six scenarios that the geographic extent of climatically suitable
habitat may increase slightly (S1 File), although this is still confined to the Wet Tropics and far
north of the continent. In addition, little extrapolation to novel conditions occurs (S1 File).
Horticultural production regions in northeast Queensland may remain suitable for this species
by 2070, although production regions in the south are likely to remain unsuitable (S1 File).
Bactrocera musae. For the baseline period, suitable habitat for B. musae extended from
the Torres Strait Islands through to the Wet Tropics (S1 File). The most important variable in
the model for B. musae was precipitation of the wettest quarter (78.7%) (S1 File).
Suitable habitat for this species is projected to remain restricted to the Wet Tropics and
northern–most regions of the country under the climate scenarios. While there is consensus
across the six climate scenarios, less confidence can be placed in projections to the north-west
(S1 File).
B. musae mainly attacks Musa × paradisiaca (banana), the production areas for which are
located primarily in tropical and subtropical regions of the continent (S1 File). The major
commercial growing region in the Wet Tropics is projected to remain climatically suitable for
this species until at least 2070 (S1 File).
Bactrocera neohumeralis. Suitable habitat for this species during the baseline is projected
to have been mostly confined to the Torres Strait Islands, eastern Queensland, and north east-
ern NSW south to Wollongong (S1 File). Precipitation of the wettest month (47.4%) contrib-
uted most to the model for B. neohumeralis (S1 File).
As the century progresses, considerable differences in suitable habitat are projected across
the six scenarios. For example, under the CanESM2 scenario, ~ one quarter of current suitable
habitat is projected to be lost by 2030, although by 2070, range expansions are projected to
exceed losses (S1 File). Similarly, under the hot, very dry scenario simulated by
GFDL-ESM2M, total range size may decline by 2030, mostly due to contractions in the south
and east, although limited gains in habitat may occur in northern Australia (S1 File). There is
consensus in projections of suitability across the north tips of the continent, however MESS
maps indicate that Maxent has extrapolated suitability in these regions. In contrast, greater
confidence can be placed in projections of consensus along the east coast (S1 File).
Production regions in eastern Queensland and north-eastern NSW will likely remain suit-
able for this species until at least 2070, although there is substantial uncertainty across the cli-
mate scenarios. In contrast, regions along the NSW-Victorian border and further south are
projected to remain unsuitable for B. neohumeralis (S1 File).
Bactrocera tryoni. Highly suitable habitat for B. tryoni is projected to have occurred in
south-western Western Australia, south-eastern South Australia, Victoria, and eastern Austra-
lia from Cape York to NSW in the baseline period (S1 File). Coastal zones in northern West-
ern Australia, the Northern Territory and the eastern half of Tasmania have moderate
Impacts of climate change on high priority fruit fly species in Australia
PLOS ONE | https://doi.org/10.1371/journal.pone.0213820 February 13, 2020 8 / 19
suitability (S1 File). Annual mean temperature (33.06%) and mean temperature of the coldest
month (32.42%) had the highest contributions to the model for this species (S1 File).
The geographic extent of suitable habitat varies across the six climate scenarios. As the cen-
tury progresses, gains in new habitat may exceed losses under some scenarios (e.g. see
ACCESS1.0, MIROC5 and NorESM1-M; S1 File), while substantial declines occur under oth-
ers (e.g. GFDL-ESM2M S1 File), mostly due to contractions in the south and east. Areas of
consensus occur along the coastline, although less confidence can be placed in these projec-
tions for the Northern Territory and northern Western Australia due to model extrapolation
(S1 File).
Key regions for host crops in the Top End of Northern Territory, eastern Australia from
Cape York to NSW, Victoria, and some parts of Tasmania, may remain suitable for B. tryoniuntil at least 2070. Major host-plant growing regions in South Australia may also remain suit-
able for this species until 2070 (S1 File).
Ceratitis capitata. Our model suggests that suitable habitat for C. capitata for the baseline
occurred throughout Western Australia, the Northern Territory, the east coast of Queensland
to NSW and South Australia (S1 File). We note that scattered records within inland regions of
Western Australia are projected as having had low suitability. Annual mean temperature
(47.2%) and mean temperature of the coldest month (46.2%) contributed most to the model
for this species (S1 File).
Under the future climate scenarios, the geographic extent of suitable habitat is projected to
increase and expand inland (S1 File) with much of Victoria and Tasmania likely to be suitable.
There is considerable consensus in the distribution of suitable habitat, although consensus
declines in New South Wales as the time horizon increases (S1 File). As with other species,
MESS maps indicate extrapolation across the northern regions under scenarios from 2050
onwards (S1 File). However, there is high consensus in suitability across the major host plant
regions in Queensland, Victoria, and Western Australia.
Zeugodacus cucumis. For the baseline period, suitable habitat for Z. cucumis is projected
along the northern region of Western Australia and the Northern Territory, north-east
Queensland, and south along the east coast to NSW (S1 File). Precipitation of the driest quar-
ter (54.3%) and mean temperature of the coldest quarter (36.2%) had the highest permutation
importance in the model for this species (S1 File).
Under future climate scenarios, the geographic extent of suitable habitat may increase,
expanding southward and inland, with most areas that are currently suitable projected to
remain so until at least 2070 (S1 File). There is considerable variation among projections for
inland regions, likely due to differences in precipitation patterns, indicating higher uncertainty
about the future suitability of these regions. There is high consensus in suitability along the
east coast, and while consensus is also high in the north MESS maps identify this as a region of
extrapolation. There is little agreement on the suitability of inland regions of New South Wales
and Queensland (S1 File).
Major commercial growing regions for host crops in Queensland and the Northern Terri-
tory are projected to remain climatically suitable for this species until at least 2070 (S1 File).
Other major host-plant growing regions in the south and west of the continent will likely
remain unsuitable under the time periods considered in this study (S1 File).
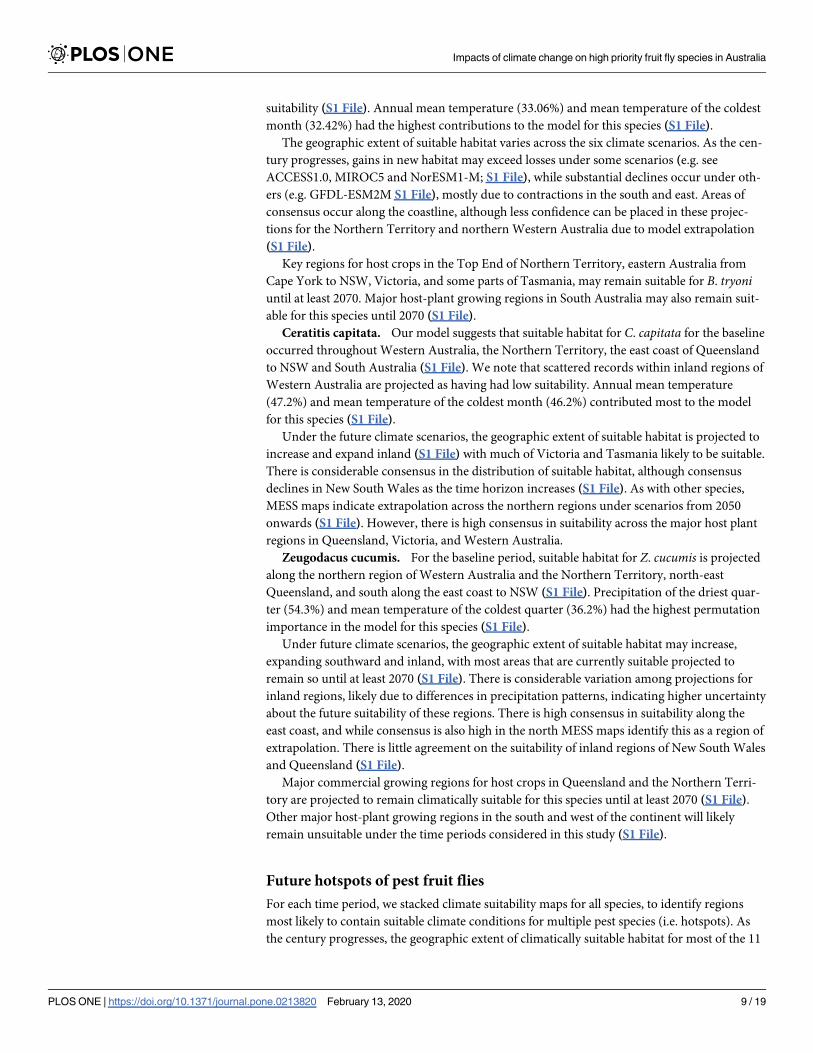
Future hotspots of pest fruit flies
For each time period, we stacked climate suitability maps for all species, to identify regions
most likely to contain suitable climate conditions for multiple pest species (i.e. hotspots). As
the century progresses, the geographic extent of climatically suitable habitat for most of the 11
Impacts of climate change on high priority fruit fly species in Australia
PLOS ONE | https://doi.org/10.1371/journal.pone.0213820 February 13, 2020 9 / 19
species is projected to expand and shift south regardless of whether novel environments are
included or excluded (Figs 1 and 2 and Table 2). When regions containing novel climate are
included, 31.6% of Australia (i.e. ~2,400,800 km2) is projected to have been suitable in the
baseline period for at least one of the 11 species, increasing to more than half of the continent
by 2070 (Table 2). However, only Queensland’s Wet Tropics is likely to be suitable for all 11
species into the future.
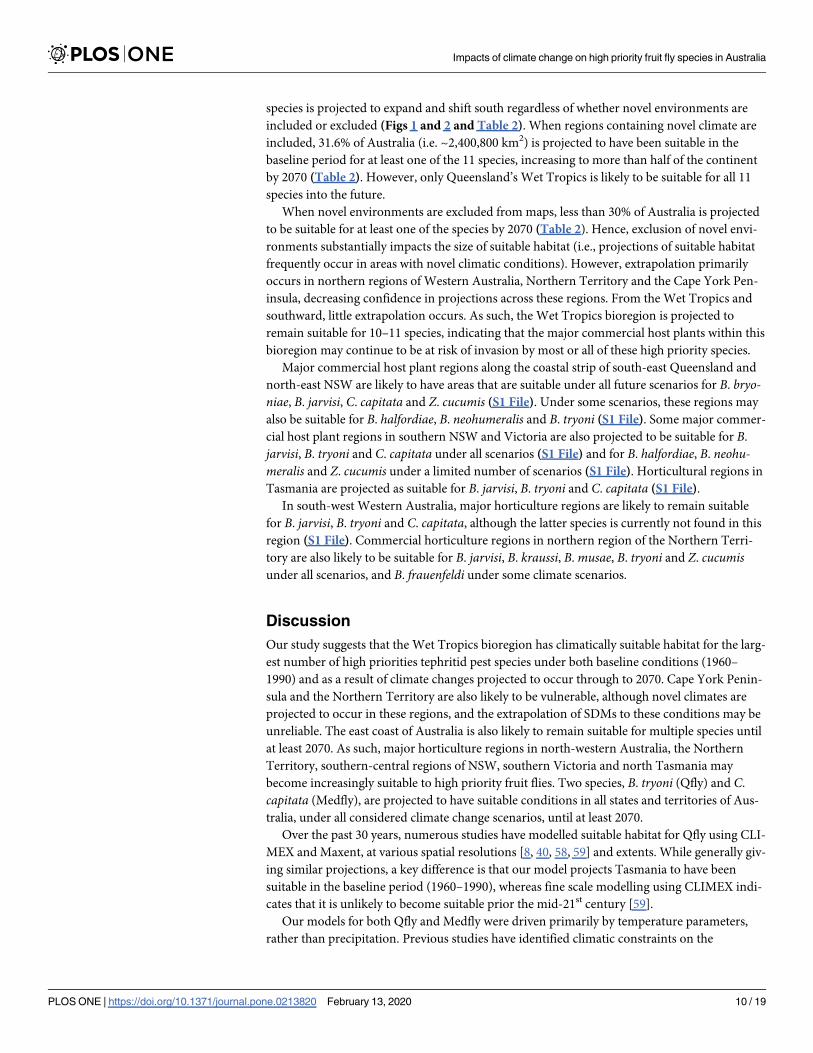
When novel environments are excluded from maps, less than 30% of Australia is projected
to be suitable for at least one of the species by 2070 (Table 2). Hence, exclusion of novel envi-
ronments substantially impacts the size of suitable habitat (i.e., projections of suitable habitat
frequently occur in areas with novel climatic conditions). However, extrapolation primarily
occurs in northern regions of Western Australia, Northern Territory and the Cape York Pen-
insula, decreasing confidence in projections across these regions. From the Wet Tropics and
southward, little extrapolation occurs. As such, the Wet Tropics bioregion is projected to
remain suitable for 10–11 species, indicating that the major commercial host plants within this
bioregion may continue to be at risk of invasion by most or all of these high priority species.
Major commercial host plant regions along the coastal strip of south-east Queensland and
north-east NSW are likely to have areas that are suitable under all future scenarios for B. bryo-niae, B. jarvisi, C. capitata and Z. cucumis (S1 File). Under some scenarios, these regions may
also be suitable for B. halfordiae, B. neohumeralis and B. tryoni (S1 File). Some major commer-
cial host plant regions in southern NSW and Victoria are also projected to be suitable for B.
jarvisi, B. tryoni and C. capitata under all scenarios (S1 File) and for B. halfordiae, B. neohu-meralis and Z. cucumis under a limited number of scenarios (S1 File). Horticultural regions in
Tasmania are projected as suitable for B. jarvisi, B. tryoni and C. capitata (S1 File).
In south-west Western Australia, major horticulture regions are likely to remain suitable
for B. jarvisi, B. tryoni and C. capitata, although the latter species is currently not found in this
region (S1 File). Commercial horticulture regions in northern region of the Northern Terri-
tory are also likely to be suitable for B. jarvisi, B. kraussi, B. musae, B. tryoni and Z. cucumisunder all scenarios, and B. frauenfeldi under some climate scenarios.
Discussion
Our study suggests that the Wet Tropics bioregion has climatically suitable habitat for the larg-
est number of high priorities tephritid pest species under both baseline conditions (1960–
1990) and as a result of climate changes projected to occur through to 2070. Cape York Penin-
sula and the Northern Territory are also likely to be vulnerable, although novel climates are
projected to occur in these regions, and the extrapolation of SDMs to these conditions may be
unreliable. The east coast of Australia is also likely to remain suitable for multiple species until
at least 2070. As such, major horticulture regions in north-western Australia, the Northern
Territory, southern-central regions of NSW, southern Victoria and north Tasmania may
become increasingly suitable to high priority fruit flies. Two species, B. tryoni (Qfly) and C.
capitata (Medfly), are projected to have suitable conditions in all states and territories of Aus-
tralia, under all considered climate change scenarios, until at least 2070.
Over the past 30 years, numerous studies have modelled suitable habitat for Qfly using CLI-
MEX and Maxent, at various spatial resolutions [8, 40, 58, 59] and extents. While generally giv-
ing similar projections, a key difference is that our model projects Tasmania to have been
suitable in the baseline period (1960–1990), whereas fine scale modelling using CLIMEX indi-
cates that it is unlikely to become suitable prior the mid-21st century [59].
Our models for both Qfly and Medfly were driven primarily by temperature parameters,
rather than precipitation. Previous studies have identified climatic constraints on the
Impacts of climate change on high priority fruit fly species in Australia
PLOS ONE | https://doi.org/10.1371/journal.pone.0213820 February 13, 2020 10 / 19

distribution of Qfly. For example, it has been reported that Qfly pupae do not survive in the
winter months in Melbourne and near Sydney [60], and adults fail to emerge later than mid-
April [61]. Further, many subtropical sites in Queensland are marginal in winter for Qfly
breeding and general activity [8, 61]. As such, slight temperature increases associated with cli-
mate change are projected to substantially elevate the threat that this species poses to horticul-
tural industries [62]. For instance, using data from the late 1990s, it was estimated that annual
control costs for apple growers around Adelaide may increase by between $346,000 and $1.3
million with a 0.5–2˚C increase in temperature [62].
With the exception of Western Australia, all Australian states and territories are currently
free from Medfly, with market access protocols inhibiting movement into other states [21],
and incursions met with immediate eradication programs [13]. Our model of baseline habitat
indicates suitable conditions for Medfly around most of Australia’s coastal regions. In addition
to identifying suitability in the subtropical coastal fringe of Queensland, our model suggested
that much of the low-altitude regions in the south-east, including parts of Tasmania, are also
Fig 1. Hotspot maps of habitat suitability for the 11 fruit fly species under climate change, when novel environments are included.
Hotspot maps of baseline (1960–1990) and future habitat suitability for 11 fruit flies. Suitability was modelled with Maxent, and
thresholded using the 10th percentile of suitability at training presence localities. These maps include projections under novel
environments (see S1 File for individual species maps with novel environments included). Colours indicate the number of species for
which habitat is projected to be suitable under the majority (� 4) future climate scenarios. Figure was created in R version 3.3.3 [57]
(https://www.R-project.org/).
https://doi.org/10.1371/journal.pone.0213820.g001
Impacts of climate change on high priority fruit fly species in Australia
PLOS ONE | https://doi.org/10.1371/journal.pone.0213820 February 13, 2020 11 / 19

suitable. While our result for Medfly is similar to that obtained from CLIMEX and Principle
Components Analysis [25, 58], the model GARP projected a far broader potential distribution
in Australia for this species [58], while Szyniszewska and Tatem’s [63] Maxent model sug-
gested more of Queensland may be suitable, compared to our analysis. Competition with Qfly
may be responsible for exclusion of Medfly from much of Queensland [25], and similar biotic
interactions may suppress the species elsewhere [13]. However, Medfly may be more tolerant
to low temperatures and dry summers than Qfly [4], rendering Medfly the stronger competitor
in areas with these conditions. Medfly was recorded in Tasmania in the 1920s but reportedly
failed to survive an unseasonably hot and dry summer [4]. Due to their age, these records were
not used to calibrate our model, yet our projections indicate that Tasmania continues to have
conditions suitable for this species.
Allwood and Angeles [64] reported that B. jarvisi is recognized as a pest in north-western
Australia, infesting mango, guava and pomegranates (as reported in [65]). Dominiak and
Fig 2. Hotspot maps of habitat suitability for the 11 fruit fly species under climate change, when novel environments are excluded.
Hotspot maps of baseline (1960–1990) and future habitat suitability for 11 fruit flies. Suitability was modelled with Maxent, and
thresholded using the 10th percentile at training presence localities. These maps exclude regions containing novel environments (see S1
File for individual species maps with novel environments excluded). Colours indicate the number of species for which habitat is
projected to be suitable under the majority (� 4) future climate scenarios. Figure was created in R version 3.3.3 [57] (https://www.R-
project.org/).
https://doi.org/10.1371/journal.pone.0213820.g002
Impacts of climate change on high priority fruit fly species in Australia
PLOS ONE | https://doi.org/10.1371/journal.pone.0213820 February 13, 2020 12 / 19

Worsley [9] concluded that the current south-eastern range limit lies north of the Queensland-
NSW border (~25.5˚ south), while the south-western limit lies at approximately 18˚ south.
However, previous analysis suggested that this species’ current climatic range could extend
into the cooler temperate areas of southern NSW, and eastern and northern Victoria [4]. Our
models partly agree, indicating that suitable conditions along the east coast of Victoria in the
baseline period. This species can also withstand very warm conditions, with eggs known to be
more heat tolerant than those of the sympatric Qfly, surviving temperatures of 48.2˚C [65].
Given that these species infest many of the same hosts, competition is likely, hence eradication
of Qfly may result in the competitive release of B. jarvisi, increasing the threat it poses to horti-
culture [4, 65]. Further, as the cultivation of B. jarvisi host plants expands geographically, this
species may increase in abundance and extend its range, potentially becoming a major pest in
north-western Australia [6, 36]. However, across north-western Australia, and to a lesser
extent the far north-east, models for most species were projected onto novel conditions,
decreasing confidence in suitability estimates for these regions. In contrast, MESS maps dem-
onstrated that extrapolation rarely occurred across eastern and southern regions, although
novel interactions between climate variables cannot be ruled out.
While widespread throughout Queensland, Z. cucumis currently has a restricted distribu-
tion in the Northern Territory, although there is a disputed single record from northern West-
ern Australia [66]. Both Fitt [67] and the Horticultural Policy Council [4] reported that if the
cucurbit industry expands in the Northern Territory, the pest status of Z. cucumis may
increase. However, while the species has been trapped frequently in the Northern Territory, it
has not been found on cucurbits growing in this region [6]. In NSW, Z. cucumis appears to be
currently limited to regions close to the Queensland border, with rare detection as far south as
Sydney [66]. It has not been detected in the (former) Fruit Fly Exclusion Zone in southern
NSW [37]. Our model also estimates the southern limit of suitable climate for this species to be
around Sydney. However, with climate change this may extend further southward, with parts
Table 2. Percentage (%) of Australia projected to be suitable for the 11 fruit fly species considered in this study, under baseline (1960–1990) and future climates.
Suitable area (% of Australia)
Count Baseline (Novel masked) 2030 2050 2070
0 68.4% (68.5%) 67.5% (70.2%) 59.5% (73.6%) 47.0% (72.0%)
1 11.0% (11.1%) 9.6% (9.4%) 11.6% (9.6%) 14.6% (10.0%)
2 11.1% (11.0%) 10.5% (9.7%) 14.8% (8.8%) 17.5% (10.3%)
3 2.3% (2.3%) 3.4% (4.1%) 3.0% (3.0%) 6.5% (3.4%)
4 1.2% (1.2%) 1.9% (2.2%) 3.2% (1.6%) 4.8% (1.2%)
5 1.6% (1.8%) 2.6% (2.8%) 2.9% (1.9%) 3.9% (1.6%)
6 1.2% (1.5%) 1.9% (0.8%) 1.8% (0.6%) 2.3% (0.7%)
7 1.3% (1.3%) 0.6% (0.4%) 1.0% (0.5%) 1.2% (0.5%)
8 0.4% (0.7%) 0.4% (0.2%) 0.5% (0.2%) 0.6% (0.1%)
9 0.8% (0.3%) 1.3% (0.2%) 1.4% (0.1%) 1.4% (0.1%)
10 0.6% (0.4%) 0.3% (0.1%) 0.1% (0.1%) 0.1% (0.1%)
11 0.0% (1.3E-05%) 0.1% (0.0%) 0.1% (0.0%) 0.1% (0.0%)
This is a summary of the ‘consensus’ maps for each species. Values in brackets represent results when novel environments have been excluded. Each row of the table
indicates the percentage of Australia projected to be suitable in the baseline period (1960–1990), in 2030, 2050, and 2070, for n species, where n is given in the “Count”
column. Thus, the first row (with Count = 0) gives the area projected to be unsuitable for all 11 species under four or more of the climate scenarios, the row with
Count = 1 gives the area projected to be suitable for any one of the 11 species in at least four of the climate scenarios, and the row with Count = 11 gives the area
projected to be suitable for all 11 species in at least four of the climate scenarios. Note that the number of 1 km2 grid cells spanning Australia is 7,667,790.
https://doi.org/10.1371/journal.pone.0213820.t002
Impacts of climate change on high priority fruit fly species in Australia
PLOS ONE | https://doi.org/10.1371/journal.pone.0213820 February 13, 2020 13 / 19

of Victoria projected to become increasingly suitable over time, depending on the climate
change scenario.
Bactrocera neohumeralis presently occurs from the western Cape York Peninsula, Queens-
land, south to Sydney, NSW [3, 7, 37]. Our model suggests that as climate changes, the range
of this species may extend southward and, under some scenarios, into parts of Victoria. Previ-
ous climatic analysis also suggested that this species is well adapted to conditions on the east
coast of Queensland, with large populations occurring in areas north of Townsville [4]. Similar
ecological characteristics are shared by B. neohumeralis and Qfly [68], yet while Qfly is preva-
lent in sub-tropical and temperate areas of Queensland and NSW, B. neohumeralis is more
prevalent in northern wet tropical areas [4, 5, 69]. The reason for this difference between the
geographical ranges of these species is unclear, as both are polyphagous and use similar host
fruits for their larval development [68, 69].
Our model for B. aquilonis indicates suitable conditions for this species in northern
Queensland under baseline conditions, although it is presently only known from north-west-
ern Australia [5]. The hosts of this species now include 40 commercial crops [6]. Expansion of
the range of this species, or the growth of host plant industries in north-western Australia may
necessitate the development of new monitoring, control and disinfestation procedures [65]. In
addition, it has been argued that if B. aquilonis hybridises with Qfly, the resulting strain may
have greater potential for spread than B. aquilonis [4]. This, in turn, would require that disin-
festation procedures be developed for the hybrids [65].
The distribution of B. bryoniae ranges from the Torres Strait Islands, across northern Aus-
tralia, and along the east coast to north of Sydney, NSW. Our results indicate that suitable cli-
mate may exist in Victoria, south of the species’ known range. However, previous studies have
demonstrated that populations in northern NSW experience a marked decline in abundance
through November–January [37]. This may be explained by a decline in the fruiting and flow-
ering of native host trees, or seasonal climatic constraints that are not reflected in our model
[37], which may also explain their absence in Victoria.
Northern Queensland has the highest diversity of fruit flies in Australia, and some species
with significant economic impacts are found only in this region [7]. The distribution of B.
kraussi, B. musae and B. frauenfeldi is limited to north Queensland [3, 70], with recent trap
data suggesting that these species do not occur south of Townsville [7]. Royer et al. [35] pre-
dicted that B. frauenfeldi has suitable habitat in the Northern Territory and northern Western
Australia, which is also suggested by our model. This species has expanded its range in north-
ern Queensland due to continued planting of hosts, such as mango and guava [35]. Further
increases within these horticulture industries in northern Queensland may increase the pest
status of this fly [70].
Model errors and uncertainties
SDMs are useful for developing a broad understanding of how the distribution of suitable hab-
itat may be influenced by climate change. However, the output of SDMs is known to be influ-
enced by characteristics of the occurrence sample, including its size [71], sampling bias [72],
and spatial autocorrelation [73], as well as the extent of the study area, selection of predictor
variables [74], and selection of background points [75]. We addressed these issues by: (1)
exploring alternate settings in Maxent to optimise models and reduce overfitting that may gen-
erate unreliable estimates [48]; (2) reducing the number of predictor variables by assessing col-
linearity; and (3) critically examining response curves.
In addition, we acknowledge that the selection of a threshold for converting Maxent’s con-
tinuous output into binary data (typically defined as distinguishing between “suitable” and
Impacts of climate change on high priority fruit fly species in Australia
PLOS ONE | https://doi.org/10.1371/journal.pone.0213820 February 13, 2020 14 / 19

“unsuitable” conditions) can be subjective. A region classified as unsuitable may not be free of
the pest; rather, these areas are considered less likely to support a population compared with
regions above the threshold. In reality, the choice of threshold is based upon a comparison of
the importance of false positives and false negatives [76]. For invasive species, the latter may be
more serious because it can result in an underestimate of the geographic extent of suitable con-
ditions, and hence, invasion risk [77]. This, in turn, can lead to poor decision-making and fail-
ure to establish appropriate surveillance or containment measures. As such, in this context a
precautionary approach to defining a threshold, as undertaken in the present study, is war-
ranted. However, since overprediction of suitable habitat can also prove problematic (poten-
tially leading to ineffective allocation of monitoring resources), we provide maps of
continuous (unthresholded) suitability (S1 File), permitting stakeholders to modify this
threshold according to their objectives.
Sampling bias is another challenge faced when fitting correlative SDMs, particularly when
incorporating data from sources of incidental observations such as museums and natural his-
tory collections [78]. As such, it is difficult to determine whether a species is observed in a par-
ticular environment because of habitat preferences or because that region has received the
largest search effort [75, 78]. For presence-background approaches to habitat modelling, a tar-
get-group background sampling strategy goes some way to handling biased occurrence sam-
ples [79]. However, while imposing environmental bias on the background counteracts similar
bias in the occurrence sample, this strategy may increase the extent of novel environments to
which the model must be extrapolated.
While SDMs consider sensitivity to climate change, species responses may also include
microevolution [80] or plasticity [81]. As accessibility to genomic data increases, and experi-
ments on plasticity are conducted, SDM output can be refined [82]. In addition, as mean con-
ditions change, so too will the distribution and magnitude of extremes. Presently, there has
been little work undertaken to assess how different fruit fly pest species tolerate extreme
weather events such as heatwaves and moisture stress, or their potential for adaptation to cli-
mate change. These remain key areas for future research.
We also note that our analysis does not take into consideration the potential necessity for
horticultural industries to shift geographically to adapt to climate change. Analysing shifts in
climatic suitability for horticultural crops is complicated by our capacity to modify the envi-
ronment (e.g. through irrigation), and thus was beyond the scope of this study.
To conclude, surveillance activities, pre- and post-harvest treatment, and control activities
for fruit flies present a substantial cost to Australia’s horticultural industries [2, 4, 14]. Our
analysis highlights that the major horticultural production regions are likely to remain suitable
for multiple economically important fruit fly species as climate changes. Furthermore, given
that knowledge of species current distributions remains the basis for market access decisions,
the potential for range shifts to occur is of critical interest to horticultural industries. Outputs
from this study provide guidance to pest managers, such that they can assess pest risks and
design appropriate ongoing surveillance strategies. Our results emphasize the importance of
vigilance and preparedness across Australia to prevent further range expansion of these 11 spe-
cies, and underscore the need for ongoing research and development into monitoring, control,
and eradication tools.
Supporting information
S1 File.
(DOCX)
Impacts of climate change on high priority fruit fly species in Australia
PLOS ONE | https://doi.org/10.1371/journal.pone.0213820 February 13, 2020 15 / 19

Acknowledgments
We gratefully acknowledge our data providers Nick Secomb (Plant Health Operations Biose-
curity, PIRSA, South Australia) and Lauren Donaldson (Department of Economic Develop-
ment, Jobs, Transport and Resources, Victoria). Special thanks to Phil Taylor, Dan Ryan, and
Penny Measham for their feedback and advice. SS was supported by an International Mac-
quarie University Research Excellence Scholarship (iMQRES). This research was conducted as
part of the SITplus collaborative fruit fly program.
Author Contributions
Conceptualization: Sabira Sultana, John B. Baumgartner, Linda J. Beaumont.
Data curation: Sabira Sultana, John B. Baumgartner, Bernard C. Dominiak, Jane E. Royer,
Linda J. Beaumont.
Formal analysis: Sabira Sultana, John B. Baumgartner, Linda J. Beaumont.
Funding acquisition: Linda J. Beaumont.
Methodology: Sabira Sultana, John B. Baumgartner, Bernard C. Dominiak, Jane E. Royer,
Linda J. Beaumont.
Software: John B. Baumgartner.
Supervision: John B. Baumgartner, Linda J. Beaumont.
Validation: Bernard C. Dominiak, Jane E. Royer.
Visualization: Sabira Sultana, John B. Baumgartner.
Writing – original draft: Sabira Sultana.
Writing – review & editing: John B. Baumgartner, Bernard C. Dominiak, Jane E. Royer,
Linda J. Beaumont.
References1. Plant Health Australia. The Australian Handbook for the Identification of Fruit Flies. Version 3.1.: Plant
Health Australia. Canberra, ACT.; 2018.
2. Plant Health Australia. Draft National Fruit Fly Strategy. Plant Health Australia. DEAKIN, ACT, 2600;
2008.
3. Hancock DL, Hamacek EL, Lloyd AC, Elson-Harris MM. The distribution and host plants of fruit flies
(Diptera: Tephritidae) in Australia: Department of Primary Industries, Queensland; 2000.
4. Horticultural Policy Council. The impact of fruit flies on Australian horticulture: Report to the Minister for
Primary Industries and Energy, Canberra; 1991.
5. Drew RAI. The tropical fruit flies (Diptera: Tephritidae: Dacinae) of the Australasian and Oceanian
regions. 1989. Report No.: 0079–8835, 521pp.
6. Smith ESC, Chin D, Allwood AJ, Collins SG. A revised host list of fruit flies (Diptera: Tephritidae) from
the Northern Territory of Australia. Queensland Journal of Agricultural and Animal Sciences. 1988; 45
(1):19–28.
7. Royer JE, Hancock DL. New distribution and lure records of Dacinae (Diptera: Tephritidae) from
Queensland, Australia, and description of a new species of Dacus Fabricius. Australian Journal of Ento-
mology. 2012; 51(4):239–247.
8. Sultana S, Baumgartner JB, Dominiak BC, Royer JE, Beaumont LJ. Potential impacts of climate change
on habitat suitability for the Queensland fruit fly. Scientific Reports. 2017; 7(1):13025. https://doi.org/10.
1038/s41598-017-13307-1 PMID: 29026169
9. Dominiak BC, Worsley P. Review of the southern boundary of Jarvis fruit fly ’Bactrocera jarvisi’ (Tyron)
(Diptera: Tephritidae: Dacinae) and its likley southern distribution in Australia. General and Applied
Entomology: The Journal of the Entomological Society of New South Wales. 2017; 45:1–7.
Impacts of climate change on high priority fruit fly species in Australia
PLOS ONE | https://doi.org/10.1371/journal.pone.0213820 February 13, 2020 16 / 19

10. De Meyer M, Copeland R, Wharton R, McPheron B. On the geographic origin of the Medfly Ceratitis
capitata (Weidemann)(Diptera: Tephritidae). Proceedings of the 6th International Fruit Fly Symposium,
Stellenbosch, South Africa. 2002:45–53.
11. White IM, Elson-Harris MM. Fruit flies of economic significance: their identification and bionomics: CAB
International; 1992.
12. Permkam S, Hancock D. Australian Ceratitinae (Diptera: Tephritidae). Invertebrate Systematics. 1994;
8(6):1325–1341.
13. Dominiak BC, Mapson R. Revised distribution of Bactrocera tryoni in eastern Australia and effect on
possible incursions of Mediterranean fruit fly: development of Australia’s eastern trading block. Journal
of Economic Entomology. 2017; 110(6): 2459–2465. https://doi.org/10.1093/jee/tox237 PMID:
29040591
14. Plant Health Australia. Prevent fruit fly. Fruit Fly Research. 2016.
15. Abdalla A, Millist N, Buetre B, Bowen B. Benefit-cost analysis of the national fruit fly strategy action
plan. Australian Bureau of Agricultural and Resource Economics and Sciences, Canberra; 2012.
16. PHA. Economic assessment of the implementation of the proposed National Fruit Fly Strategy: Part 1
(Plant Health Australia, August, Canberra., 2009).
17. Australian Pesticides and Veterinary Medicines Authority. Dimethoate Residues and Dietary Risk
Assessment Report. August 2011.
18. Clarke AR, Powell KS, Weldon CW, Taylor PW. The ecology of Bactrocera tryoni (Diptera: Tephritidae):
what do we know to assist pest management? Annals of Applied Biology. 2011; 158(1):26–54.
19. Australian Pesticides and Veterinary Medicines Authority. Fenthion Residues and Dietary Risk Assess-
ment Report. September 2012.
20. Dominiak BC, Ekman JH. The rise and demise of control options for fruit fly in Australia. Crop Protec-
tion. 2013; 51:57–67.
21. Jessup A, Dalton S, Slogget R. Determination of host status of table grapes to Queensland fruit fly,
’Bactrocera tryoni’ (Froggatt) (Diptera: Tephritidae), for export to New Zealand. General and Applied
Entomology: The Journal of the Entomological Society of New South Wales. 1998; 28:73–75.
22. Stephens AEA, Stringer LD, Suckling DM. Advance, retreat, resettle? Climate change could produce a
zero-sum game for invasive species. Austral Entomology. 2016; 55:177–184.
23. Hill MP, Bertelsmeier C, Clusella-Trullas S, Garnas J, Robertson MP, Terblanche JS. Predicted
decrease in global climate suitability masks regional complexity of invasive fruit fly species response to
climate change. Biological Invasions. 2016; 18(4):1105–1119.
24. Kriticos D. Risks of establishment of fruit flies in New Zealand under climate change. New Zealand For-
est Research Institute, Rotorua; 2007.
25. Vera MT, Rodriguez R, Segura DF, Cladera JL, Sutherst RW. Potential geographical distribution of the
Mediterranean fruit fly, Ceratitis capitata (Diptera: Tephritidae),m with emphasis on Argentina and Aus-
tralia. Environmental entomology. 2002; 31(6):1009–1122.
26. Aguilar G, Blanchon D, Foote H, Pollonais C, Mosee A. Queensland fruit fly invasion of New Zealand:
predicting area suitability under future climate change scenarios. Perspectives in Biosecurity Research
Series 2015; 2:1–13.
27. Phillips SJ, Anderson RP, Schapire RE. Maximum entropy modeling of species geographic distribu-
tions. Ecological Modelling. 2006; 190(3):231–259.
28. Kumar S, Neven LG, Yee WL. Evaluating correlative and mechanistic niche models for assessing the
risk of pest establishment. Ecosphere. 2014; 5(7):1–23.
29. Kumar S, Neven LG, Yee WL. Assessing the potential for establishment of Western Cherry Fruit Fly
using ecological niche modeling. Journal of Economic Entomology. 2014; 107(3):1032–1044. https://
doi.org/10.1603/ec14052 PMID: 25026662
30. Kumar S, Neven LG, Zhu H, Zhang R. Assessing the global risk of establishment of Cydia pomonella
(Lepidoptera: Tortricidae) using CLIMEX and MaxEnt niche models. Journal of Economic Entomology.
2015; 108(4):1708–1719. https://doi.org/10.1093/jee/tov166 PMID: 26470312
31. Kumar S, Yee WL, Neven LG. Mapping global potential risk of establishment of Rhagoletis pomonella
(Diptera: Tephritidae) using MaxEnt and CLIMEX niche models. Journal of Economic Entomology.
2016; 109(5):2043–2053. https://doi.org/10.1093/jee/tow166 PMID: 27452001
32. Australian horticulture statistics handbook. Horticulture Innovation Australian Limited 2016/17 (www.
horticulture.com.au).
33. Dominiak BC, Daniels D. Review of the past and present distribution of Mediterranean fruit fly (Ceratitis
capitata Wiedemann) and Queensland fruit fly (Bactrocera tryoni Froggatt) in Australia. Australian Jour-
nal of Entomology. 2012; 51(2):104–115.
Impacts of climate change on high priority fruit fly species in Australia
PLOS ONE | https://doi.org/10.1371/journal.pone.0213820 February 13, 2020 17 / 19

34. Dominiak BC. Review of grapes Vitis sp. as an occasional host for Queensland fruit fly Bactrocera tryoni
(Froggatt)(Diptera: Tephritidae). Crop Protection. 2011; 30(8):958–961.
35. Royer JE, Wright CL, Hancock DL. Bactrocera frauenfeldi (Diptera: Tephritidae), an invasive fruit fly in
Australia that may have reached the extent of its spread due to environmental variables. Austral Ento-
mology. 2016; 55(1):100–111.
36. May AWS. An investigation of fruit flies (Trypertidae: Diptera) in Queensland 1. Introduction, species,
pest status and distribution. Queensland Journal of Agricultural Science. 1963; 20:1–82.
37. Gillespie P. Observations on fruit flies (Diptera: Tephritidae) in New South Wales. Gen Appl Ent Vol.
2003; 32:41–48.
38. Hijmans RJ, Cameron SE, Parra JL, Jones PG, Jarvis A. Very high resolution interpolated climate sur-
faces for global land areas. International Journal of Climatology. 2005; 25(15):1965–1978.
39. Bateman MA. The ecology of fruit flies. Annual Review of Entomology. 1972; 17(1):493–518.
40. De Meyer M, Robertson MP, Mansell MW, Ekesi S, Tsuruta K, Mwaiko W, et al. Ecological niche and
potential geographic distribution of the invasive fruit fly Bactrocera invadens (Diptera, Tephritidae). Bul-
letin of Entomological Research. 2010; 100(01):35–48.
41. Beaumont LJ, Graham E, Duursma DE, Wilson PD, Cabrelli A, Baumgartner JB, et al. Which species
distribution models are more (or less) likely to project broad-scale, climate-induced shifts in species
ranges? Ecological Modelling. 2016; 342:135–146.
42. CSIRO & BoM. Climate change in Australia information for Australia’s natural resource management
regions. Technical Report, CSIRO and Bureau of Meteorology, Australia.; 2015.
43. Moss RH, Edmonds JA, Hibbard KA, Manning MR, Rose SK, Van Vuuren DP, et al. The next genera-
tion of scenarios for climate change research and assessment. Nature. 2010; 463(7282):747–756.
https://doi.org/10.1038/nature08823 PMID: 20148028
44. Peters GP, Andrew RM, Boden T, Canadell JG, Ciais P, Le Quere C, et al. The challenge to keep global
warming below 2 C. Nature Climate Change. 2012; 3(1):1–3.
45. Greenberg J, Mattiuzzi M. gdalUtils: Wrappers for the Geospatial Data Abstraction Library (GDAL) Utili-
ties. R Package Version 2.0.1.7. 2015.
46. Team RC. R: A language and Environment for statistical computing. R Foundation for Statistical Com-
puting, Vienna, Austria 2014.
47. Elith J, Graham CH, Anderson RP, Dudık M, Ferrier S, Guisan A, et al. Novel methods improve predic-
tion of species’ distributions from occurrence data. Ecography. 2006; 29:129–151.
48. Merow C, Smith MJ, Silander JA. A practical guide to MaxEnt for modeling species’ distributions: what it
does, and why inputs and settings matter. Ecography. 2013; 36(10):1058–1069.
49. Elith J, Phillips SJ, Hastie T, Dudık M, Chee YE, Yates CJ. A statistical explanation of MaxEnt for ecolo-
gists. Diversity and Distributions. 2011; 17(1):43–57.
50. Ihlow F, Dambach J, Engler JO, Flecks M, Hartmann T, Nekum S, et al. On the brink of extinction? How
climate change may affect global chelonian species richness and distribution. Global Change Biology.
2012; 18(5):1520–1530.
51. Swets JA. Measuring the accuracy of diagnostic systems. Science. 1988; 240(4857):1285–1293.
https://doi.org/10.1126/science.3287615 PMID: 3287615
52. Wilson KA, Westphal MI, Possingham HP, Elith J. Sensitivity of conservation planning to different
approaches to using predicted species distribution data. Biological Conservation. 2005; 122(1):99–112.
53. Elith J, Kearney M, Phillips S. The art of modelling range-shifting species. Methods in Ecology and Evo-
lution. 2010; 1(4):330–342.
54. Pebesma E, Roger SB. Classes and methods for spatial data in R. 2005. R News 5 (2):9–13.
55. Hijmans RJ. Raster: Geographic Data Analysis and Modeling. R Package Version 2.4–15. http://CRAN.
R-project.org/package=raster 2015.
56. Hijmans RJ, Phillips S, Leathwick J, Elith J. Dismo: Species distribution modeling.R package version
0.8–17. 2013.
57. R Core Team. R: A language and environment for statistical computing: R Foundation for Statistical
Computing. Vienna, Austria; 2017.
58. De Meyer M, Robertson M, Peterson A, Mansell M. Ecological niches and potential geographical distri-
butions of Mediterranean fruit fly (Ceratitis capitata) and Natal fruit fly (Ceratitis rosa). Journal of Bioge-
ography. 2008; 35(2):270–281.
59. Holz G, Grose M, Bennett J, Corney S, White C, Phelan D, et al. Climate Futures for Tasmania: impacts
on agriculture technical report. Antarctic Climate and Ecosystems Cooperative Research Centre,
Hobart, Tasmania, 2010.
Impacts of climate change on high priority fruit fly species in Australia
PLOS ONE | https://doi.org/10.1371/journal.pone.0213820 February 13, 2020 18 / 19
60. O’Loughlin GT, East RA, Meats A. Survival, development rates and generation times of the Queensland
fruit fly, Dacus tryoni, in a marginally favourable climate: experiments in Victoria. Australian Journal of
Zoology. 1984; 32(3):353–361.
61. Muthuthantri S, Maelzer D, Zalucki MP, Clarke AR. The seasonal phenology of Bactrocera tryoni (Frog-
gatt)(Diptera: Tephritidae) in Queensland. Austral Entomology. 2010; 49(3):221–233.
62. Sutherst RW, Collyer BS, Yonow T. The vulnerability of Australian horticulture to the Queensland fruit
fly, Bactrocera (Dacus) tryoni, under climate change. Australian Journal of Agricultural Research. 2000;
51(4):467–480.
63. Szyniszewska AM, Tatem AJ. Global assessment of seasonal potential distribution of Mediterranean
fruit fly, Ceratitis capitata (Diptera: Tephritidae). PLoS One. 2014; 9(11):e111582. https://doi.org/10.
1371/journal.pone.0111582 PMID: 25375649
64. Allwood A, Angeles T. Host records of fruit flies (family Tephritidae) in the Northern Territory. Queens-
land Journal of Agricultural and Animal Sciences. 1979, 1:105–113.
65. Cameron EC. Fruit Fly Pests of Northwestern Australia [Thesis]: University of Sydney.; 2006.
66. Dominiak BC, Worsley P. Review of cucumber fruit fly, Bactrocera cucumis (French)(Diptera: Tephriti-
dae: Dacinae) in Australia: Part 1, host range, surveillance and distribution. Crop Protection. 2018;
106:79–85.
67. Fitt GP. New records of Dacus (Austrodacus) cucumis French from the Northern Territory, Australia
(Diptera: Tephritidae). Australian Journal of Entomology. 1980; 19(3):240–240.
68. Gibbs G. The comparative ecology of two closely related, sympatric species of Dacus (Diptera) in
Queensland. Australian Journal of Zoology. 1967; 15(6):1123–1139.
69. Wang Y, Yu H, Raphael K, Gilchrist A. Genetic delineation of sibling species of the pest fruit fly Bacto-
cera (Diptera: Tephritidae) using microsatellites. Bulletin of Entomological Research. 2003; 93(4):351–
360. https://doi.org/10.1079/ber2003249 PMID: 12908921
70. Drew R, Hooper G, Bateman M. Economic fruit flies of the South Pacific Region. Queensland Depart-
ment of Primary Industries.1982.
71. Wisz MS, Hijmans R, Li J, Peterson AT, Graham C, Guisan A, et al. Effects of sample size on the perfor-
mance of species distribution models. Diversity and distributions. 2008; 14(5):763–773.
72. Syfert MM, Smith MJ, Coomes DA. The effects of sampling bias and model complexity on the predictive
performance of MaxEnt species distribution models. PLoS ONE. 2013; 8(2):e55158. https://doi.org/10.
1371/journal.pone.0055158 PMID: 23457462
73. Veloz SD. Spatially autocorrelated sampling falsely inflates measures of accuracy for presence-only
niche models. Journal of Biogeography. 2009; 36(12):2290–2299.
74. Guillen D, Sanchez R. Expansion of the national fruit fly control programme in Argentina. Area-wide
Control of Insect Pests. 2007:653–660.
75. Phillips SJ. Transferability, sample selection bias and background data in presence-only modelling: a
response to Peterson et al.(2007). Ecography. 2008; 31(2):272–278.
76. Franklin J. Mapping species distributions: spatial inference and prediction: Cambridge University
Press; 2010.
77. Pheloung P, Williams P, Halloy S. A weed risk assessment model for use as a biosecurity tool evaluat-
ing plant introductions. Journal of Environmental Management. 1999; 57(4):239–251.
78. Newbold T, Reader T, El-Gabbas A, Berg W, Shohdi WM, Zalat S, et al. Testing the accuracy of species
distribution models using species records from a new field survey. Oikos. 2010; 119(8):1326–1334.
79. Elith J. Predicting distributions of invasive species. 2013. arXiv:1312.0851.
80. Salamin N, Wuest RO, Lavergne S, Thuiller W, Pearman PB. Assessing rapid evolution in a changing
environment. Trends in Ecology & Evolution. 2010; 25(12):692–698.
81. Charmantier A, McCleery RH, Cole LR, Perrins C, Kruuk LE, Sheldon BC. Adaptive phenotypic plastic-
ity in response to climate change in a wild bird population. Science. 2008; 320(5877):800–803. https://
doi.org/10.1126/science.1157174 PMID: 18467590
82. Bush A, Mokany K, Catullo R, Hoffmann A, Kellermann V, SgròC, et al. Incorporating evolutionary
adaptation in species distribution modelling reduces projected vulnerability to climate change. Ecology
Letters. 2016; 19(12):1468–1478. https://doi.org/10.1111/ele.12696 PMID: 27873482
Impacts of climate change on high priority fruit fly species in Australia
PLOS ONE | https://doi.org/10.1371/journal.pone.0213820 February 13, 2020 19 / 19