Embed Size (px)
Citation preview

Impacts of a recurrent resuspension event and variable phytoplankton
community composition on remote sensing reflectance
Trisha Bergmann,1 Gary Fahnenstiel,2 Steven Lohrenz,3 David Millie,4
and Oscar Schofield5
Received 30 July 2002; revised 1 July 2003; accepted 9 October 2003; published 21 May 2004.
[1] In order to characterize the impact of turbidity plumes on optical and biologicaldynamics, a suite of environmental parameters were measured in southern Lake Michiganduring the springtime recurrent sediment plume. In-water measurements of inherent opticalproperties (IOPs) were entered into the Hydrolight 4.2 radiative transfer model and theoutput was compared with measured apparent optical properties (AOPs) across a widerange of optical conditions. Hydrolight output and measured underwater light fields werethen used to clarify the effects of the sediment plume on primary production, phytoplanktoncommunity composition, and nearshore remote sensing ocean color algorithms. Our resultsshow that the sediment plume had a negligible effect on the spectral light environmentand phytoplankton physiology. The plume did not significantly alter the spectral quality ofavailable light and did not lead to light limited phytoplankton populations compared tonon-plume conditions. Further, the suspended sediment in the plume did not seriouslyimpact the performance of ocean color algorithms. We evaluated several currentlyemployed chlorophyll algorithms and demonstrated that the main factor compromising theefficacy of these algorithms was the composition of phytoplankton populations. Asphycobilin-containing algae became the dominant species, chlorophyll algorithms that usetraditional blue/green reflectance ratios were compromised due to the high absorption ofgreen light by phycobilin pigments. This is a notable difficulty in coastal areas, which havehighly variable phytoplankton composition and are often dominated by sharp fronts ofphycobilin and non-phycobilin containing algae. INDEX TERMS: 4847 Oceanography:
Biological and Chemical: Optics; 4275 Oceanography: General: Remote sensing and electromagnetic processes
(0689); 4855 Oceanography: Biological and Chemical: Plankton; 4239 Oceanography: General: Limnology;
KEYWORDS: remote sensing, phytoplankton, coastal optics
Citation: Bergmann, T., G. Fahnenstiel, S. Lohrenz, D. Millie, and O. Schofield (2004), Impacts of a recurrent resuspension event
and variable phytoplankton community composition on remote sensing reflectance, J. Geophys. Res., 109, C10S15,doi:10.1029/2002JC001575.
1. Introduction
[2] The main circulation patterns in Lake Michigan areprimarily wind driven. This is an energetic and dynamicenvironment, and it is often seriously affected by short-term episodic events. In the Great Lakes, episodic eventsare most frequent in the late winter/early spring when highwinds and storms are prevalent and thermal stratification islow [Lee and Hawley, 1998; Lou et al., 2000; Beletsky andSchwab, 2001]. These events have been hypothesized to
play a disproportionately large role in structuring physicaland biological systems, but investigating their importanceis difficult given the limitations of traditional samplingtechniques.[3] One annual event that occurs in southern Lake Mich-
igan each spring is a recurrent turbidity plume that extendsup to 200 km alongshore [Mortimer, 1988]. Spring in LakeMichigan is marked by frequent, highly energetic storms,turbulent shoreline erosion, and high river runoff. Theseforces lead to significant resuspension of particles, whichare then transported to the southern basin of the lake. Theerosive forces in Lake Michigan are episodic in nature, andfor many biogeochemically important materials this resus-pension and transport of sediments in the Southern Basin isgreater than external inputs from rivers [Eadie et al., 1984;Hawley, 1991; Eadie et al., 1996]. Particles resuspendedduring the plume event may comprise up to 25% of the totaltransport of sediment to the southern part of the Lake [Eadieet al., 1996; Lou et al., 2000]. This resuspension andtransport of concentrated sediment loads is coincident withthe spring phytoplankton bloom [Mortimer, 1988]. The
JOURNAL OF GEOPHYSICAL RESEARCH, VOL. 109, C10S15, doi:10.1029/2002JC001575, 2004
1School of Marine Sciences, University of Maine, Orono, Maine, USA.2Great Lakes Environmental Research Laboratory, NOAA, Muskegon,
Michigan, USA.3Department of Marine Science, University of Southern Mississippi,
Stennis Space Center, Mississippi, USA.4Florida Marine Research Institute, FWCC and Florida Institute of
Oceanography, Saint Petersburg, Florida, USA.5Coastal Ocean Observation Lab, Institute of Marine and Coastal
Sciences, Rutgers University, New Brunswick, New Jersey, USA.
Copyright 2004 by the American Geophysical Union.0148-0227/04/2002JC001575$09.00
C10S15 1 of 12
spring bloom is a crucial time for the ecology of LakeMichigan as it may contribute up to 50% of the total annualprimary production in the Lake and is a major source ofcarbon to higher trophic levels [Fahnenstiel and Scavia,1987]. The physical processes associated with these coastalplumes were believed to be critical in controlling biogeo-chemical cycling, shaping the light environment, alteringavailable nutrient concentrations, establishing conditions forthe spring bloom, and structuring biological communities[Mortimer, 1988].[4] The recurrent turbidity event was first observed in
remote sensing data as a highly reflective band near shore[Mortimer, 1988]. At that time, Mortimer noted the diffi-culty in using optical and remote sensing techniques in areasof strong optical gradients and highly variable concentra-tions of suspended particulate material (SPM), coloreddissolved organic matter (CDOM), and chlorophyll suchas that observed in coastal areas. Since that time, there hasbeen much debate over the utility of such techniques indynamic coastal environments. Recent efforts have focusedon remote sensing techniques in order to increase samplingresolution to ecologically relevant scales for investigationinto the effects of short-term episodic events. As part of theEpisodic Events-Great Lakes Experiment (EEGLE), wewanted to quantify the effects of the episodic recurrentturbidity plume on optical parameters, phytoplankton dy-namics, remote sensing techniques, and the performance ofcurrently employed coastal algorithms.
2. Methods
2.1. Sampling
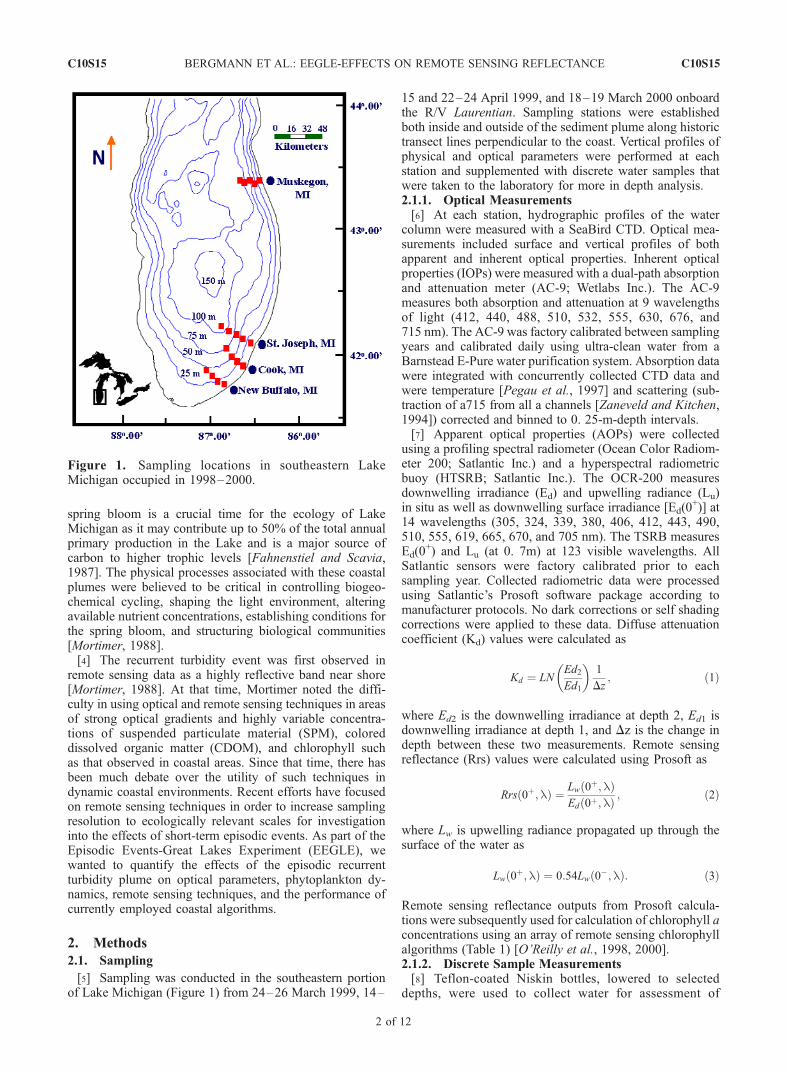
[5] Sampling was conducted in the southeastern portionof Lake Michigan (Figure 1) from 24–26 March 1999, 14–
15 and 22–24 April 1999, and 18–19 March 2000 onboardthe R/V Laurentian. Sampling stations were establishedboth inside and outside of the sediment plume along historictransect lines perpendicular to the coast. Vertical profiles ofphysical and optical parameters were performed at eachstation and supplemented with discrete water samples thatwere taken to the laboratory for more in depth analysis.2.1.1. Optical Measurements[6] At each station, hydrographic profiles of the water
column were measured with a SeaBird CTD. Optical mea-surements included surface and vertical profiles of bothapparent and inherent optical properties. Inherent opticalproperties (IOPs) were measured with a dual-path absorptionand attenuation meter (AC-9; Wetlabs Inc.). The AC-9measures both absorption and attenuation at 9 wavelengthsof light (412, 440, 488, 510, 532, 555, 630, 676, and715 nm). The AC-9 was factory calibrated between samplingyears and calibrated daily using ultra-clean water from aBarnstead E-Pure water purification system. Absorption datawere integrated with concurrently collected CTD data andwere temperature [Pegau et al., 1997] and scattering (sub-traction of a715 from all a channels [Zaneveld and Kitchen,1994]) corrected and binned to 0. 25-m-depth intervals.[7] Apparent optical properties (AOPs) were collected
using a profiling spectral radiometer (Ocean Color Radiom-eter 200; Satlantic Inc.) and a hyperspectral radiometricbuoy (HTSRB; Satlantic Inc.). The OCR-200 measuresdownwelling irradiance (Ed) and upwelling radiance (Lu)in situ as well as downwelling surface irradiance [Ed(0
+)] at14 wavelengths (305, 324, 339, 380, 406, 412, 443, 490,510, 555, 619, 665, 670, and 705 nm). The TSRB measuresEd(0
+) and Lu (at 0. 7m) at 123 visible wavelengths. AllSatlantic sensors were factory calibrated prior to eachsampling year. Collected radiometric data were processedusing Satlantic’s Prosoft software package according tomanufacturer protocols. No dark corrections or self shadingcorrections were applied to these data. Diffuse attenuationcoefficient (Kd) values were calculated as
Kd ¼ LNEd2
Ed1
� �1
Dz; ð1Þ
where Ed2 is the downwelling irradiance at depth 2, Ed1 isdownwelling irradiance at depth 1, and Dz is the change indepth between these two measurements. Remote sensingreflectance (Rrs) values were calculated using Prosoft as
Rrs 0þ;lð Þ ¼ Lw 0þ;lð ÞEd 0þ;lð Þ ; ð2Þ
where Lw is upwelling radiance propagated up through thesurface of the water as
Lw 0þ;lð Þ ¼ 0:54Lw 0�;lð Þ: ð3Þ
Remote sensing reflectance outputs from Prosoft calcula-tions were subsequently used for calculation of chlorophyll aconcentrations using an array of remote sensing chlorophyllalgorithms (Table 1) [O’Reilly et al., 1998, 2000].2.1.2. Discrete Sample Measurements[8] Teflon-coated Niskin bottles, lowered to selected
depths, were used to collect water for assessment of
Figure 1. Sampling locations in southeastern LakeMichigan occupied in 1998–2000.
C10S15 BERGMANN ET AL.: EEGLE-EFFECTS ON REMOTE SENSING REFLECTANCE
2 of 12
C10S15

phytoplankton photopigments, photosynthesis-irradianceparameters, SPM concentrations, and microphotometryassays. Phytoplankton biomass, as chlorophyll a, and phy-logenetic group dynamics were characterized using chemo-taxonomic pigments derived using High PerformanceLiquid Chromotography and CHEMTAX as outlined byMillie et al. [2002]. Photosynthesis-irradiance parameterswere measured as by Fahnenstiel et al. [2000]. SPMconcentrations were determined gravimetrically after draw-ing 0.2- to 0.3-L aliquots under low vacuum ontopre-rinsed, tared 47-mm-diameter Poretics 0.4-mm poly-carbonate filters. The filters were dried in a dessicator toconstant weight. When necessary, SPM concentrationswere estimated from AC-9 collected data based upon therelationship established between suspended material con-centration and attenuation at 630 nm (Figure 2).[9] For microphotometry analysis, raw water samples
were filtered under low vacuum (<50 mm Hg) onto1.0-mm Nucleopore filters with GF/A backing filters. Whenthe last 1–2 mL of water was still in the filtering funnel,vacuum pressure was released, and the filter, along with afew drops of water, was transferred to a gelatin slide. It iscritical not to filter all of the water, as delicate cells arelikely to rupture if some water is not retained on the filter.The back of the filter was gently swiped with a damp cottonswab and then removed from the gelatin slide. One to twodrops of a 30% glycerol solution was placed on thetransferred samples along with a coverslip. The slide wasthen immediately frozen by placing it on an aluminumblock that had been previously immersed in liquid nitrogen.The frozen slides were placed in a slide box and kept frozen(�20�C) until analysis.[10] The absorption efficiency factor, Qa, can be mea-
sured on individual cells using a microphotometric tech-nique [Itturriaga and Siegel, 1989; Stephens, 1995]. Thisabsorption efficiency factor is defined as the ratio of lightabsorbed by a cell to the light impinging on the cell’sgeometrical cross section. Microphotometric measurementof Qa requires direct measurement of spectral transmittanceof a cell or particle relative to a blank
Qa lð Þ ¼ Ib lð Þ � Is lð ÞIb lð Þ ; ð4Þ
where Is(l) is the radiant flux or transmittance for thesample, and Ib(l) is the radiant flux or transmittance for theblank. The raw data were smoothed by averaging over fivewavelength bins. To correct for any light that might havebeen lost by scattering, which in our system was likely
minimal [Itturriaga and Siegel, 1989], the mean Qa value at750–760 nm was subtracted from all other measurements.[11] A Leica DMR HC microscope system equipped with
an optic coupler was used for microphotometric measure-ments. An Ocean Optics, Inc. collimating lens (74-VIS) wasused to coupled light from the microscope head to a 400-mmpatch silica optical fiber which was interfaced with anOcean Optics, Inc., miniature spectrometer (S2000) inter-faced with a 500-KHz ADC board. The optical configura-tion provided an effective resolution of approximately 2 nmat full width half maximum (FWHM). The CCD array of thespectrometer consisted of a 2048-element linear detectorextending over a wavelength range of 350–1000 nm. Tenscans were averaged for each measurement, and the sam-pling rate was such that the total scan time was approxi-mately 10 s.
2.2. Solving the Radiative Transfer Equation
[12] In order to evaluate the dynamic response ofprimary producers to the highly variable in situ lightenvironment, we needed to spectrally characterize theunderwater light field under a wide range of conditions.Establishing a solid relationship between the IOPs andAOPs provides confidence that a full set of radiometricparameters can be calculated given in situ measurementsof the IOPs. A subsection of our data set (n = 41 profiles)was input into Hydrolight 4.2 (Sequoia Scientific Inc.) tonumerically solve the radiative transfer equation for arealistic radiance distribution. Hydrolight requires fourbasic input parameters: the IOPs of the water body, wind
Table 1. Algorithms Used to Calculate Chlorophyll a From Remote Sensing Reflectancea
Sensor Equation R
SeaWiFS/OC2 C = 10:0 0:341�3:001Rþ2:811R2�2:041R3ð Þ � 0.04 490/555OCTS/OC4O C = 10:0 0:405�2:900Rþ1:690R2�0:530R3�1:144R4ð Þ 443 > 490 > 520/565MODIS/OC3M C = 10:0 0:2830�2:753Rþ1:457R2�0:659R3�1:403R4ð Þ 443 > 490/550CZCS/OC3C C = 10:0 0:362�4:066Rþ5:125R2�2:645R3�0:597R4ð Þ 443 > 520/550MERIS/OC4E C = 10:0 0:368�2:814Rþ1:456R2þ0:768R3�1:292R4ð Þ 443 > 490 > 510/560SeaWiFS/OC4v4 C = 10:0 0:366�3:067Rþ1:930R2þ0:649R3�1:532R4ð Þ 443 > 490 > 510/555SeaWiFS/OC2v4 C = 10:0 0:319�2:336Rþ0:879R2�0:135R3ð Þ � 0.071 490/555
aR is determined as the maximum of the values shown. Sensor algorithms shown are for SeaWiFS (Sea-viewing Wide Fieldof view Sensor), OCTS (Ocean Color and Temperature Scanner), MODIS (Moderate Resolution Imaging Spectroradiometer),CZCS (Coastal Zone Color Scanner), and MERIS (Medium Resolution Imaging Spectrometer).
Figure 2. Relationship between attenuation at 630 nm asmeasured by an AC-9 and suspended particulate material(SPM).
C10S15 BERGMANN ET AL.: EEGLE-EFFECTS ON REMOTE SENSING REFLECTANCE
3 of 12
C10S15

speed, sky spectral radiance distribution, and water columnbottom boundary conditions. In this study we suppliedHydrolight with measured IOPs (a and c) from an AC-9and measured wind speeds from an anemometer aboardthe research vessel. The sky spectral radiance distributionis calculated within Hydrolight via RADTRAN basedupon user-supplied date, time of day, location on theglobe, and cloud cover at each station. Reflectance ofthe bottom boundary was set at 20% without spectraldependence for all calculations. In this study, Hydrolightoutput was obtained solely to determine scalar irradiancevalues; therefore we wanted to ensure that Hydrolightoutput closely reflected in situ conditions at the time ofsampling. To this end, the backscatter fraction (bb/b) wasoptimized at each individual station to minimize thedifference between the output and measured values andwas input as a Fournier-Fourand (FF) phase function. Inthe absence of a measured particle phase function, the FFis an acceptable replacement as the exact shape of thephase function is not as critical as the magnitude of thebackscatter ratio for calculations of the AOPs [Mobley etal., 2002].[13] To validate our results from Hydrolight, modeled
values were compared to concurrently measured AOPs at41 stations in our sampling area over the course of 2 yearsin the spring and summer. These stations encompassed awide variety of optical and physical environments. Kd andRrs values were used for the comparisons as they are notextremely sensitive to the geometric distribution of the lightfield. To correlate Kd, we incorporated 435 data points overspatial and temporal gradients and directly compared theHydrolight output with measured values (Figure 3a). Thecorrelation was strong with a slope of 0.88 indicating thatmodeled values were slightly underestimating measured Kd
values. Rrs correlations were also strong (average R2 =0.94) although spectrally dependent (Figure 3b). The slopewas very close to 1.0 at lower wavelengths and dropped offtoward the red wavelengths (slope range is 0.68–1.2). Thisis not surprising, as the magnitude of the Rrs signal is much
lower in the red wavelengths of light; therefore part of theerror in this portion of the spectrum is a signal to noiseproblem.[14] Hydrolight output was used to quantify the amount
of light available to phytoplankton. Phytoplankton pop-ulations are able to use light from all directions forphotosynthesis. This light field is represented by thescalar irradiance (Eo). Eo is the integral of the radianceover all angles around a point; this differs from thedownwelling irradiance (Ed), which is the traditionallymeasured irradiance term. Ed accounts only for lightpropagating in the downward direction and proportionallyweights the contribution of radiation at different incidenceangles. The Eo output from Hydrolight calculationsallowed us to use this Eo term, which we were unableto measure, to examine light utilization by phytoplankton.Eo values were used to calculate the scalar diffuseattenuation coefficient (Ko),
Ko ¼ LNEo2
Eo1
� �1
Dz; ð5Þ
the scalar optical depth (zo),
zo ¼ Koz; ð6Þ
and the average cosine,
m ¼ Ed � Eu
Eo
; ð7Þ
where Eu is the upwelling irradiance.
3. Results
3.1. Optical Dynamics
[15] The springtime recurrent turbidity plume in LakeMichigan strongly impacted the optical environment in thesouthern portion of the lake. The plume can easily be
Figure 3. Relationship between measured and modeled apparent optical properties. Measured valuesare from a Satlantic profiling radiometer and modeled values are from Hydrolight output. (a) Diffuseattenuation coefficient (Kd) for PAR. The solid line is the best fit line with an intercept at the origin.(b) Remote sensing reflectance (Rrs) - R2 are represented by closed symbols, and the slopes arerepresented by open symbols.
C10S15 BERGMANN ET AL.: EEGLE-EFFECTS ON REMOTE SENSING REFLECTANCE
4 of 12
C10S15

observed in remote sensing reflectance imagery during thespring months (Figure 4a). The spatial extent of the plumecan be seen in March 1999, followed by confinement to thecoastline in April, and then dissipation in the summermonths with thermal stratification (Figure 4). The threemajor optical zones along a transect line in April 1999extending 32 km offshore St. Joseph, Michigan, through thesediment plume area, can readily be observed in collecteddata. The optical gradients in this area were large over shortdistances, reflecting the interaction of the turbidity plumeand outflow from the St. Joseph River. The three distinctwater types along this transect line included an onshoreriver/plume region that extended to roughly 10 km offshore,plume-dominated water that extended approximately 10 to20 km offshore, and offshore stations farther than 20 km.Data collected along this transect line in April of 1999 wererepresentative of conditions during the spring of all sam-pling years for the duration of the sediment plume and wereused as a case example during this study.[16] Nearshore stations were strongly influenced by both
the sediment plume and the outflow from the St. JosephRiver. Although absorption and scattering were bothincreased at nearshore stations, spectral changes in theoptical signal were controlled by absorption. Concentra-
tions of highly absorbing CDOM and chlorophyll a wereincreased in onshore stations relative to offshore areas.CDOM absorbs light mostly in the blue wavelengths,which was apparent as an increase in the absorptionspectra in the blue wavelengths (Figure 5a). These highnearshore CDOM concentrations were probably due toboth river outflow and in situ production. Chlorophyll aconcentrations at onshore stations were relatively high, anddiatoms dominated the phytoplankton community, addingto the high blue light absorption values (Figures 6d–6f).The effects of in-water constituents were also apparent inthe Rrs spectra. Onshore stations had a proportionaldecrease in Rrs in the 400- to 500-nm region relative tostations farther offshore due to absorption of light by bothCDOM and chlorophyll a at these wavelengths. A peak inRrs due to chlorophyll fluorescence at 676 nm is alsoevident (Figure 6b, red line). The available light field atthe 1% light level was predominately green and red as allof the shorter wavelengths of light were absorbed in thewater column (Figure 6c).[17] Moving offshore into waters impacted less by the
river, the effects of the sediment plume became moreapparent. Absorption values decreased relative to onshorestations while scattering stayed high, resulting in a signif-
Figure 4. Temporal evolution of the southern Lake Michigan recurrent turbidity plume. (a) AVHRRremote sensing reflectance and (b) absorption, (c) scattering, and (d) temperature along the transect lineshown extending 30 km offshore St. Joseph, Michigan. Red circles in Figure 4b represent stationlocations of the six sampling stations (stations were located approximately 2, 5, 10, 16, 26, and 30 kmfrom shore). Note the change in scale for the temperature plot associated with June 1999.
C10S15 BERGMANN ET AL.: EEGLE-EFFECTS ON REMOTE SENSING REFLECTANCE
5 of 12
C10S15

icant increase in measured b/a ratios (Figure 6a). This highscattering-to-absorption ratio was used as the primaryoptical signature of the sediment plume. The proportionaldecrease in absorption and increase in scattering wasreflected in higher Rrs signals as more light was scatteredup through the water column (Figure 6b, green line).Chlorophyll values decreased in plume-dominated stations,and the composition of the phytoplankton community beganto change (Figures 6d–6f). Farther offshore, the opticalsignature was dominated by phytoplankton absorption. Bothabsorption and scattering were low relative to onshorewaters, and Rrs spectra were comparatively low and spec-trally flat (Figure 6b, blue line). Available light at the 1%light level was mostly blue-green, and the phytoplanktoncommunity became dominated by cryptophyte algae inthese offshore waters (Figures 6c and 6e).[18] The changes in the concentrations of optically active
constituents altered the light climate of the different watertypes. The high blue absorption at onshore stations resultedin the selective removal of blue wavelengths and a red shiftof the available light field, while offshore stations hadproportionally more blue and green light (Figure 6c). Inaddition to these spectral changes in light quality, thequantity of available light at depth was decreased in onshorestations. The relationship between scalar optical depth andphysical depth was steeper at onshore stations than inplume-dominated and offshore waters (Figure 7a). A deeperoptical depth corresponding to the same physical depthindicates that onshore waters were more attenuating than
offshore waters. Additionally, the scattering/absorption ratiowas higher in plume-dominated stations as compared toboth onshore and offshore waters, resulting in a change inthe diffusivity of the underwater light. The average cosineprovides a simple description of the angular radiancedistribution of the underwater light field. Average cosinevalues range from 0 for isotropic light fields to 1 in acollimated beam of light; a lower average cosine valueindicates a more diffuse light field. In regions affected bythe turbidity plume, the increased scattering resulted in alower average cosine (Figure 7b). The average cosine waslowest in areas most optically impacted by the plume andhighest in clearer, offshore waters.
3.2. Biological Dynamics
[19] Phytoplankton physiology and community composi-tion were notably impacted by both seasonal changes in thelight environment and the optical gradients observed in thespring. The phytoplankton photosynthetic physiologyreflected the seasonal variations in the light climate. Theirradiance levels corresponding to the photoacclimationparameter (Ek) and the light-saturated photosynthetic rate(Pmax
b ) were relatively constant at 77 (±16) mmol photonsm�2 s�1 and 0. 61 (±0.28) mg C mg chl�1 h�1, respectively,both in the spring months and during the summer in deeperwaters (Figure 8). Ek values were not dependent on in situEo at the time of sample collection in these data. However,summer surface samples, which were collected at a shal-lower scalar optical depth (samples collected above thethermocline), were dependent on in situ Eo values. Asrelative Eo at the time of sample collection increased dueto the change in season and the shallowing of the mixedlayer depth with the onset of stratification, the associated Ek
and Pmaxb values increased. These populations were consis-
tently exposed to higher light levels in surface waters andacclimated to their growth conditions. There was no corre-lation between SPM concentrations and Ek for any of thesamples collected; thus changes in the photoacclimationparameter were not associated with the sediment plume(Figure 8).[20] The distribution of total chlorophyll and the compo-
sition of phytoplankton communities also varied as theoptical environment changed during the spring samplingperiod. Diatoms consistently comprised a higher proportionof chlorophyll a onshore and in surface waters, whilecryptophytes comprised a higher proportion offshore andin deeper waters (Figures 6d–6e). This resulted in a stronginverse relationship between diatom and cryptophyte abun-dances (Figure 9).
4. Discussion
[21] The springtime recurrent turbidity plume observed insouthern Lake Michigan established a strong gradient idealfor assessing the utility of optical techniques in coastalwaters. The location and extent of the plume could bedetermined through both remote sensing and in situ sam-pling techniques (Figures 4 and 6). The plume region,delineated by high reflectance values, extended approxi-mately 20 km offshore for much of the EEGLE study. Asseen in previous years, the sediment plume began in theearly spring and lasted until early summer.
Figure 5. Spectral (a) absorption and (b) scatteringcoefficients at three stations along an April 1999 cross-shelf transect offshore St. Joseph, Michigan, measured withand calculated from an AC-9. Stations are located onshore(circles, 2 km offshore), in plume-dominated waters(triangles, 10 km offshore), and offshore (stars, 30 kmoffshore).
C10S15 BERGMANN ET AL.: EEGLE-EFFECTS ON REMOTE SENSING REFLECTANCE
6 of 12
C10S15

[22] The sharp optical gradients encountered in the sam-pling area allowed the impact of variable in-water constit-uents on remote sensing reflectance to be characterized.Remote sensing reflectance offshore of the St. Joseph Rivershowed the characteristic low blue reflectance due to highconcentrations of CDOM and chlorophyll a that is commonin areas offshore of large rivers (Figure 6b). The St Joseph
River drains a watershed area of 694,000 acres mainlythrough agricultural areas of Indiana and is considered asignificant source of dissolved organic carbon [Mortimer,1988]. Conversely, in offshore waters, reflectance wasgreatest in the blue wavelengths as absorption by phyto-plankton and water dominated light attenuation. The sedi-ment plume was characterized by high blue and green Rrs
Figure 6. Optical and biological properties associated with an April 1999 cross-shelf transect offshoreSt. Joseph, Michigan. (a) Scattering/absorption ratio at 488 nm, (b) remote sensing reflectance at anonshore station (red line, 2 km offshore), a plume-dominated station (green line, 10 km offshore), and anoffshore station (blue line, 30 km offshore), (c) fraction of available light at the 1% light level, as Eo atdepth normalized to Ed at the surface (station colors as in Figure 6b), (d) HPLC measured chlorophyll aconcentrations, (e) percent of total chlorophyll a associated with cryptophytes, and (f) percent of totalchlorophyll a associated with diatoms. Sampling locations are as in Figure 4.
Figure 7. Vertical light properties at April 1999 sampling stations onshore (circles, 2 km offshore), inplume-dominated waters (triangles, 10 km offshore), and offshore (stars, 30 km offshore). (a) Scalaroptical depth (zo) for PAR and (b) average cosine (m) at depth for PAR. A steeper scalar optical depthrepresents clearer waters (slope values: onshore = 2.12, plume dominated = 3.84, and offshore = 5.33). Alower average cosine indicates a more diffuse light field.
C10S15 BERGMANN ET AL.: EEGLE-EFFECTS ON REMOTE SENSING REFLECTANCE
7 of 12
C10S15

values due to the reflective materials in Lake Michiganwhich are eroded from either alongshore bluffs or shallowwater glacial deposits; the sediment composition in thesoutheastern part of the lake is dominated by these siltsand fine sands [Fahnenstiel and Scavia, 1987; Eadie et al.,1996; Barbiero and Tuchman, 2000]. This reflective mate-rial effectively scatters all of the available light and absorbsvery little, resulting in high Rrs values.[23] It was initially believed that the high sediment
concentrations associated with the turbidity plume wouldsignificantly affect the magnitude of the underwater lightfield resulting in light-limited phytoplankton populationsleading to a decrease in primary productivity [Millie et al.,2002]. However, in plume-dominated stations, the incidentintegrated flux of light was not significantly different thanclearer, non-plume offshore waters which had deep mixedlayer depths (Figure 6c). The increased concentration ofparticles in the sediment plume resulted in increased scat-tering (Figure 5), which led to a more diffuse light field(Figure 7b). This scattered light is simply redirected andmay still be available for absorption by photosyntheticorganisms.[24] Measured photosynthesis irradiance parameters sug-
gested that phytoplankton populations in plume waters werenot significantly more low-light acclimated than phyto-plankton in offshore stations (Figure 8). Ek values werefairly uniform throughout the spring bloom and plumeevents; furthermore, the Ek values were not significantly
correlated with either suspended particulate material con-centrations or light attenuation measurements. Thus therewas no observed gradient in phytoplankton photoacclima-tion between plume and non-plume stations in the spring.
Figure 8. Seasonal variability in physiological parameters. (a) Variability in Ek with scalar opticaldepth, (b) relationship between Ek and suspended particulate material, (c) relationship between Pmax
b andin situ Eo at the time of sample collection, and (d) relationship between Ek and in situ Eo at the time ofsample collection. During the spring mixed months Ek and Pmax
b values were relatively constant at77 (±16) mmol photons m�2 s�1 and 0.61 (±0.27) mg C mg chl�1 h�1, respectively, and did not depend onavailable irradiance (Eo) at the sampling depth (plus symbols). During the summer, stratified months, Ek
and Pmaxb remained low in bottom waters below the thermocline (solid circles), but were much higher in
surface waters (open circles). SPM values were much higher during the spring turbidity event (2.01 ±1.33 mg L�1) compared to summer time values (0.79 ± 0.12 mg L�1), but there was no significantrelationship between measured SPM values and Ek.
Figure 9. Percentage of total chlorophyll a associated withcryptophytes versus percentage of total chlorophyll aassociated with diatoms from CHEMTAX output for allavailable data from 1998 and 1999.
C10S15 BERGMANN ET AL.: EEGLE-EFFECTS ON REMOTE SENSING REFLECTANCE
8 of 12
C10S15

However, the significant increase in Ek and Pmaxb with
summer stratification indicated that these populations werecapable of photoacclimation; springtime populations werelow-light acclimated compared to summer populations. Thislow-light acclimation reflected the deep mixing of spring-time populations.[25] The actual light field available to phytoplankton cells
is the depth-integrated light field as they vertically cyclethrough the water column [Cullen and Lewis, 1988]. Underthese conditions, cells may photoacclimate to the averagelight intensity encountered over time. The increase in lightattenuation in the plume was balanced offshore where themixed layer depth was deeper so that phytoplankton pop-ulations in these two areas had similar total amounts of lightavailable to them over time. However, the photoacclimationobserved in spring populations changed as stratificationdeveloped in the summer, which is consistent withthe historical model for Lake Michigan phytoplankton[Fahnenstiel et al., 1989]. Summer samples showed adistinct difference in photoacclimation between deep waterand surface stations (Figure 8). Surface samples were moreacclimated to the incident light field at the time of samplecollection, whereas photoacclimation parameters for deepwater samples collected below the thermocline were inde-pendent of the incident light field (Figures 8c and 8d). Deepwater samples collected below the thermocline (thermoclineat approximately 20 m; Figure 4d) and spring samples werebeing mixed over a wide vertical range of varying lightintensity. The rate of mixing was most likely faster than therate of photoacclimation, and these samples were unable toacclimate to the ever-changing light intensity.[26] Although the intensity of light in both plume-
dominated and offshore stations in spring was similar whenaveraged over the depth of the water column, the averagelight field for a deep water station was spectrally differentthan a shallower station. Deep-water stations had a distinctspectral shift in available light, with green light dominatingat depth. This greening of the water altered the competitiveability of the two main phytoplankton classes encounteredin Lake Michigan. The observed shift in the phytoplanktoncommunity from diatoms onshore to cryptophytes offshore
was controlled in part by the spectral shift in the availablelight field. Although the absorption efficiencies for a rep-resentative diatom (Melosira islandica) and cryptophyte(Rhodomonas lens) were equal when integrated underPAR, they were distinctly spectrally different (Figure 10).M. islandica and R. lens are prevalent species in LakeMichigan that significantly contribute to total phytoplank-ton biomass [Holland, 1969; Danforth and Ginsburg, 1980;Makarewicz et al., 1994]. The primary photosynthetic pig-ments for diatoms are chlorophyll and fucoxanthin, whichabsorb maximally in the blue and red wavelengths of light,while the cryptophytes primarily utilize phycobilin pig-ments, which have an absorption maximum in the greenwavelengths. The potential for growth for photosyntheticorganisms is dependent upon their ability to absorb thespectra of light that is available.[27] The incoming irradiance at the sea surface is spec-
trally flat (Figure 11a, shaded area). In this white lightenvironment the total absorption by phytoplankton is inde-pendent of the spectral nature of the light field. Potentialabsorption forM. islandica and R. lens was calculated basedupon their measured absorption efficiencies and the avail-able irradiance at both the surface and for the average lightfield throughout the mixed layer depth at an offshore station(Figure 11). In surface waters with a spectrally unrestrictedlight field, potential absorption efficiencies for M. islandicaand R. lens were approximately equal when integrated under
Figure 10. Microphotometry absorption efficiency (Qa)for a representative diatom (Melosira islandica, shaded line)and cryptophyte (Rhodomonas minuta, black line) collectedoffshore St. Joseph, Michigan.
Figure 11. Product of the absorption efficiency (Qa) for arepresentative diatom (shaded line) and cryptophyte (blackline) and the scalar irradiance (Eo), normalized to thedownwelling irradiance at the surface. (a) Scalar irradianceat the surface Eo(0
�–) and (b) scalar irradiance for theaverage light field experienced by a phytoplankton cell overthe mixed layer depth assuming total mixing of the watercolumn. Superimposed is the available light field in lightshading.
C10S15 BERGMANN ET AL.: EEGLE-EFFECTS ON REMOTE SENSING REFLECTANCE
9 of 12
C10S15
the visible light curve (Figure 11a). Under these conditions,all phytoplankton groups are at their maximum potential forlight absorption. Assuming that the isothermal water col-umns were completely vertically mixed during the springmonths (Figure 4d), an average light field was computedbased upon the spectral light availability in the mixed layerdepth. This average light field is spectrally skewed as theblue and red wavelengths of light are selectively removedleaving mostly green light (Figure 11b). Although thepotential absorption for both species was equal at thesurface, the cryptophytes had a higher potential for absorp-tion in the average mixed layer depth light field. Thechlorophyll and fucoxanthin pigments of the diatom wereless effective than the cryptophyte’s phycobilin pigments asthe light field became more restricted to the green wave-
lengths of light. Given the spectral quality of light at depth inthe lake, the cryptophytes were better suited to utilize theavailable irradiance. This spectral selection for cryptophytesmay explain the offshore distribution observed in phyto-plankton populations. This is consistent with the idea thatabsorption of green light by phycobilins in cyanobacteriamay allow them to be superior competitors at depth inspectrally skewed light fields [Huisman et al., 1999].[28] Additionally, cryptophytes may be able to supple-
ment their nutritional needs heterotrophically at low lightlevels [Faust and Gantt, 1973; Lewitus et al., 1991] andare efficient swimmers capable of crossing ecologicallyrelevant physical boundaries [Jones, 1988]. In nature, theability to supplement photosynthetic growth with theuptake of organic nutrients and the vertical migrations
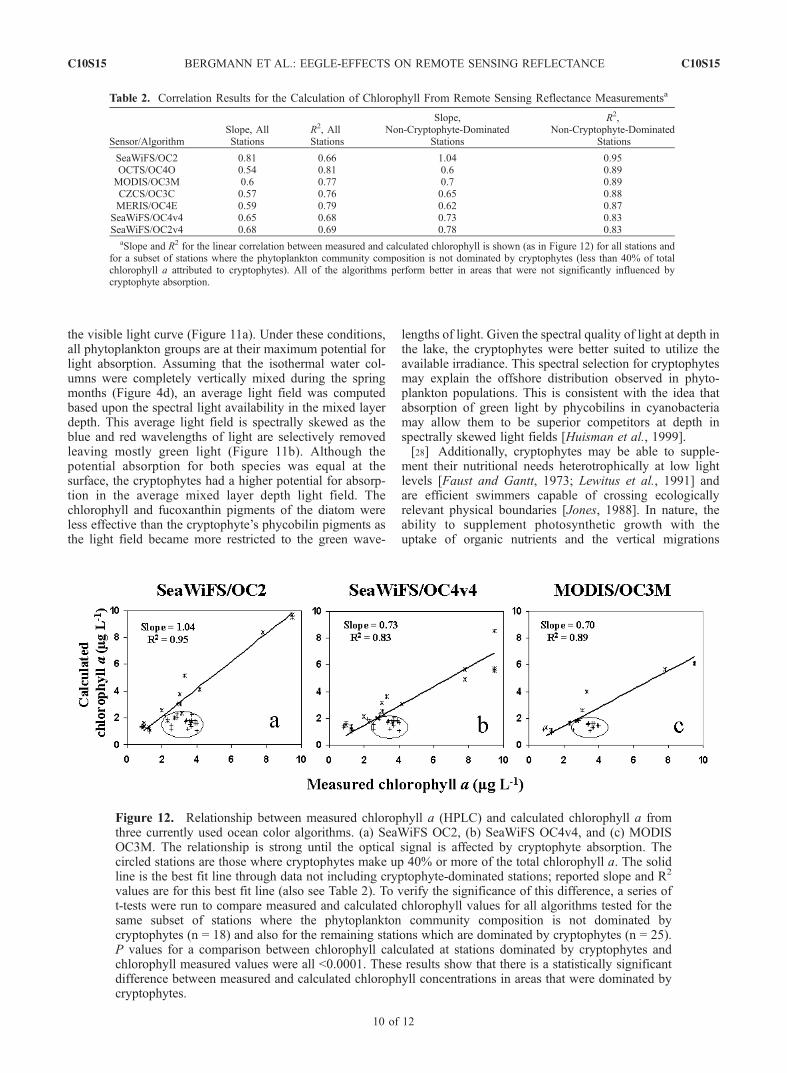
Table 2. Correlation Results for the Calculation of Chlorophyll From Remote Sensing Reflectance Measurementsa
Sensor/AlgorithmSlope, AllStations
R2, AllStations
Slope,Non-Cryptophyte-Dominated
Stations
R2,Non-Cryptophyte-Dominated
Stations
SeaWiFS/OC2 0.81 0.66 1.04 0.95OCTS/OC4O 0.54 0.81 0.6 0.89MODIS/OC3M 0.6 0.77 0.7 0.89CZCS/OC3C 0.57 0.76 0.65 0.88MERIS/OC4E 0.59 0.79 0.62 0.87
SeaWiFS/OC4v4 0.65 0.68 0.73 0.83SeaWiFS/OC2v4 0.68 0.69 0.78 0.83
aSlope and R2 for the linear correlation between measured and calculated chlorophyll is shown (as in Figure 12) for all stations andfor a subset of stations where the phytoplankton community composition is not dominated by cryptophytes (less than 40% of totalchlorophyll a attributed to cryptophytes). All of the algorithms perform better in areas that were not significantly influenced bycryptophyte absorption.
Figure 12. Relationship between measured chlorophyll a (HPLC) and calculated chlorophyll a fromthree currently used ocean color algorithms. (a) SeaWiFS OC2, (b) SeaWiFS OC4v4, and (c) MODISOC3M. The relationship is strong until the optical signal is affected by cryptophyte absorption. Thecircled stations are those where cryptophytes make up 40% or more of the total chlorophyll a. The solidline is the best fit line through data not including cryptophyte-dominated stations; reported slope and R2
values are for this best fit line (also see Table 2). To verify the significance of this difference, a series oft-tests were run to compare measured and calculated chlorophyll values for all algorithms tested for thesame subset of stations where the phytoplankton community composition is not dominated bycryptophytes (n = 18) and also for the remaining stations which are dominated by cryptophytes (n = 25).P values for a comparison between chlorophyll calculated at stations dominated by cryptophytes andchlorophyll measured values were all <0.0001. These results show that there is a statistically significantdifference between measured and calculated chlorophyll concentrations in areas that were dominated bycryptophytes.
C10S15 BERGMANN ET AL.: EEGLE-EFFECTS ON REMOTE SENSING REFLECTANCE
10 of 12
C10S15
observed in cryptophytes leads to increases in their growthrates [Ojala et al., 1996]. These strategies may also play arole in the cryptophyte’s enhanced growth at depth relativeto diatoms.[29] The observed shifts in phytoplankton community
composition impacted remote sensing reflectance and thusocean color algorithms. There was a strong correlationbetween measured and calculated chlorophyll concentrationat most stations (Table 2). However, the absorption of greenlight by cryptophytes selectively removes these wave-lengths from the light field. Chlorophyll algorithms utilizeRrs band ratios, which include 550-, 555-, 560-, and565-nm green light reflectance. These ratios assume case 1waters where the in situ absorption and water leavingradiance (Lw) signal in the blue wavelengths is dominatedby chlorophyll absorption while Lw in the green wave-lengths is insensitive to chlorophyll concentrations [Gordonand Morel, 1983]. However, in Lake Michigan, cryptophyteabsorption selectively removed the green light from thereflectance signal. Areas that were not dominated by cryp-tophytes (those with less than 40% of total chlorophyllcontributed by cryptophytes) showed good agreement be-tween measured and satellite estimated chlorophyll concen-trations (Figure 12; Table 2). In regions with highconcentrations of phycobilin containing algae, remotelyestimated chlorophyll concentrations were underestimatedby an average of 45% for all algorithms tested. Thus,contrary to previous beliefs, the sediment plume had littleaffect on the utility of ocean color remote sensing efforts.The critical parameter impacting the performance of oceancolor algorithms in this area was the community composi-tion of phytoplankton.
5. Summary and Conclusions
[30] Our results illustrate the minimal effect of thesediment plume on the quantity of available light forphytoplankton populations. There was no significantchange in the photosynthetic characteristics between plumeand non-plume populations. The phytoplankton plumepopulations were not significantly low-light acclimatedcompared to populations in clearer waters offshore. Thecomposition of phytoplankton communities may have beenimpacted by the spectral quality of light, which was afunction of the mixed layer depth and the in-water con-stituents. In the deep, well-mixed water columns, theaverage spectral light field was increasingly spectrallyskewed which is common in freshwater systems [Kirk,1994]. As the average light distribution becomes spectrallyrestricted, the ability of phytoplankton to absorb light isdirectly related to the spectral nature of their light-harvest-ing capabilities. In Lake Michigan this may account for thedistribution of diatoms nearshore and cryptophytes off-shore where phycobilin pigments efficiently absorb theavailable green light. Surprisingly, variability in SPMconcentrations caused by the spring resuspension eventhad no effect on estimating chlorophyll using currentsatellite algorithms. However, changes in the phytoplank-ton community structure did impact chlorophyll remotesensing algorithms such that these algorithms did notperform well in offshore areas dominated by phycobilincontaining cryptophyte algae. This suggests that currently
employed reflectance algorithms may be compromisedin regions of highly variable phytoplankton communitycomposition.
[31] Acknowledgments. Many thanks to Larry Boihem, KimberlyKelly, Augie Kutlewski, Merritt Tuel, Rich Stone, and the captain and crewof the R/V Laurentian. Additionally, we would like to thank EmmanuelBoss, John Klinck, and three anonymous reviewers for their helpfulcomments. Funding was provided by NSF (OCE-9727341 and OCE-9727342) and NOAA through the CoOP Great Lakes Initiative and byONR’s Hyperspectral Coastal Ocean Dynamics Experiment (HyCODE,N0014-99-0196).
ReferencesBarbiero, R., and M. Tuchman (2000), Results from the Great Lakes Na-tional Program Office’s Biological Open Water Surveillance Program ofthe Laurentian Great Lakes for 1998, report, U.S. EPA Great LakesProgram, Chicago, Ill.
Beletsky, D., and D. Schwab (2001), Modeling circulation and thermalstructure in Lake Michigan: Annual cycle and interannual variability,J. Geophys. Res., 106(C9), 19,745–19,771.
Cullen, J., and M. Lewis (1988), The kinetics of algal photoadaptation inthe context of vertical mixing, J. Plankton Res., 10, 1039–1063.
Danforth, W., and W. Ginsburg (1980), Recent changes in the phytoplank-ton of Lake Michigan near Chicago, J. Great Lakes Res., 6(4), 307–314.
Eadie, B., R. L. Chambers, W. S. Gardner, and G. I. Bell (1984), Sedimenttrap studies in Lake Michigan: Resuspension and chemical fluxes in thesouthern basin, J. Great Lakes Res., 10(3), 307–321.
Eadie, B., et al. (1996), Development of recurrent coastal plume in LakeMichigan observed for first time, EOS, 77(35), 337–338.
Fahnenstiel, G. L., and D. Scavia (1987), Dynamics of Lake Michiganphytoplankton: The deep chlorophyll layer, J. Great Lakes Res., 13(3),285–295.
Fahnenstiel, G. L., J. F. Chandler, H. J. Carrick, and D. Scavia (1989),Photosynthetic characteristics of phytoplankton communities in LakesHuron and Michigan: P-I parameters and end-products, J. Great LakesRes., 15(3), 394–407.
Fahnenstiel, G. L., R. A. Stone, M. J. McCormick, C. L. Schelske, and S. E.Lohrenz (2000), Spring isothermal mixing in the Great Lakes: Evidenceof nutrient limitation and nutrient-light interactions in a suboptimal lightenvironment, Can. J. Fish. Aquat. Sci., 57, 1901–1910.
Faust, M., and E. Gantt (1973), Effect of light intensity and glycerol on thegrowth, pigment composition, and ultrastructure of Chroomonas sp.,J. Phycol., 9, 489–495.
Gordon, H., and A. Morel (1983), Remote Assessment of Ocean Color forInterpretation of Satellite Visible Imagery, Springer-Verlag, New York.
Hawley, N. (1991), Preliminary observations of sediment erosion from abottom resting flume, J. Great Lakes Res., 17(3), 361–367.
Holland, R. (1969), Seasonal fluctuations of Lake Michigan diatoms, Lim-nol. Oceanogr., 14, 423–436.
Huisman, J., P. van Oostveen, and F. J. Weissing (1999), Species dynamicsin phytoplankton blooms: Incomplete mixing and competition for light,Am. Nat., 154(1), 46–68.
Itturriaga, R., and D. Siegel (1989), Microphotometric characterization ofphytoplankton and detrital absorption properties in the Sargasso Sea,Limnol. Oceanogr., 34(8), 1706–1726.
Jones, R. (1988), Vertical distribution and diel migration of flagellatedphytoplankton in a small humic lake, Hydrobiologia, 161, 75–87.
Kirk, J. (1994), Light and Photosynthesis in Aquatic Ecosystems, Cam-bridge Univ. Press, New York.
Lee, C., and N. Hawley (1998), The response of suspended particulatematerial to upwelling and downwelling events in southern Lake Michi-gan, J. Sediment. Res., 68(5), 819–831.
Lewitus, A. J., D. A. Caron, and K. R. Miller (1991), Effects of light andglycerol on the organization of the organization of the photosyntheticapparatus in the facultative heterotroph Pyrenomonas salina (Cryptophy-ceae), J. Phycol., 27, 578–587.
Lou, J., D. Schwab, D. Beletsky, and N. Hawley (2000), A model ofsediment resuspension and transport dynamics in southern Lake Michi-gan, J. Geophys. Res., 105, 6591–6610.
Makarewicz, J., T. Lewis, and P. Bertram (1994), Epilimnetic phytoplank-ton and zooplankton biomass and species composition in Lake Michigan,1983 to 1992, U.S. Environ. Prot. Agency, Chicago, Ill.
Millie, D., G. Fahnenstiel, H. J. Carrick, S. E. Lohrenz, and O. M. E.Schofield (2002), Phytoplankton pigments in coastal Lake Michigan:Distributions during the spring isothermal period and relation with epi-sodic sediment resuspension, J. Phycol., 38, 639–648.
C10S15 BERGMANN ET AL.: EEGLE-EFFECTS ON REMOTE SENSING REFLECTANCE
11 of 12
C10S15

Mobley, C. D., L. K. Sundman, and E. Boss (2002), Phase function effectson oceanic light fields, Appl. Opt., 41(6), 1035–1050.
Mortimer, C. (1988), Discoveries and testable hypotheses arising fromCoastal Zone Color Scanner imagery of southern Lake Michigan, Limnol.Oceanogr., 33(2), 203–226.
Ojala, A., S. Heaney, L. Arvola, and F. Barbosa (1996), Growth of migrat-ing and non-migrating cryptophytes in thermally and chemically stratifiedexperimental columns, Freshwater Biol., 35, 599–608.
O’Reilly, J., S. Maritorena, B. G. Mitchell, D. A. Siegel, K. L. Carder, S. A.Garver, M. Kahru, and C. McClain (1998), Ocean color algorithms forSeaWiFS, J. Geophys. Res., 103, 24,937–24,953.
O’Reilly, J. E., et al. (2000), SeaWiFS postlaunch technical report series, inSeaWiFS Postlaunch Calibration and Validation Analyses, NASA Tech.Memo., 11(3).
Pegau, W., D. Gray, and J. R. V. Zaneveld (1997), Absorption and attenua-tion of visible and near-infrared light in water: Dependence on tempera-ture and salinity, Appl. Opt., 36(24), 6035–6046.
Stephens, F. (1995), Variability of spectral absorption efficiency withinliving cells of Pyrocystis lunula (Dynophyta), Mar. Biol., 122, 325–331.
Zaneveld, J., and J. Kitchen (1994), The scattering error correction ofreflecting tube absorption meters, Proc. SPIE Intl. Soc. Opt. Eng.,2258, 44–55.
�����������������������T. Bergmann, School of Marine Sciences, University of Maine, Orono,
ME 04473, USA. ([email protected])G. Fahnenstiel, Great Lakes Environmental Research Laboratory, NOAA,
1431 Beach Street, Muskegon, MI 49441, USA. ([email protected])S. Lohrenz, Department of Marine Science, University of Southern
Mississippi, Stennis Space Center, MS 39529, USA. ([email protected])D. Millie, Florida Marine Research Institute, FWCC & Florida Institute
of Oceanography, 100 Eighth Avenue, S.E., Saint Petersburg, FL 33701,USA. ([email protected])O. Schofield, Coastal Ocean Observation Lab, Institute of Marine and
Coastal Sciences, Rutgers University, New Brunswick, NJ 08901, USA.([email protected])
C10S15 BERGMANN ET AL.: EEGLE-EFFECTS ON REMOTE SENSING REFLECTANCE
12 of 12
C10S15