Embed Size (px)
Citation preview

ECONorthwest 1
Impacts of a Cascadia Subduction Zone
Earthquake on the CEI Hub
EMBARGOED DRAFT REPORT
June 2021
Prepared for:
Multnomah County Office of Sustainability
and City of Portland Bureau of Emergency Management
Prepared by:
KOIN Center 222 SW Columbia Street
Suite 1600 Portland, OR 97201
503-222-6060

ECONorthwest 2
Table of Contents
1 INTRODUCTION ........................................................................................................................................ 3
1.1 BACKGROUND ON CEI HUB ............................................................................................................................. 3 1.2 STUDY PURPOSE ........................................................................................................................................... 4
2 PRIOR STUDIES RELATED TO THE CEI HUB.................................................................................................. 6
3 CEI HUB FUEL RELEASES ............................................................................................................................ 9
3.1 METHODOLOGY ............................................................................................................................................ 9 3.2 FUEL AND HAZARDOUS MATERIAL TYPES ......................................................................................................... 10 3.3 QUANTITIES OF MATERIALS AT CEI HUB .......................................................................................................... 12 3.4 TANK AGE .................................................................................................................................................. 14 3.5 PIPELINES .................................................................................................................................................. 15 3.6 GROUND RELEASES...................................................................................................................................... 16 3.7 WATER RELEASES ........................................................................................................................................ 16 3.8 TOTAL POTENTIAL RELEASES.......................................................................................................................... 17 3.9 BURNING MATERIALS AND FIRE POTENTIAL...................................................................................................... 17
4 SUBSTANCE INFORMATION .................................................................................................................... 19 4.1 SUBSTANCE TOXICITIES ................................................................................................................................. 19 4.2 FATE AND TRANSPORT OF CONTAMINANTS ...................................................................................................... 21 4.3 OIL SPILL CLEAN-UP .................................................................................................................................... 25
5 CASE STUDIES OF OTHER FOSSIL FUEL INFRASTRUCTURE FAILURES .......................................................... 26
5.1 CASE STUDY DETAILS ................................................................................................................................... 26 5.2 CASE STUDIES SUMMARY.............................................................................................................................. 34 5.3 OTHER EVALUATIONS OF FOSSIL FUEL IMPACTS NEAR CEI HUB ........................................................................... 36
6 DIRECT IMPACTS OF A CSZ EARTHQUAKE ON THE CEI HUB ....................................................................... 37
6.1 EARTHQUAKE CONSIDERATIONS ..................................................................................................................... 37 6.2 DIRECT IMPACTS TO PEOPLE AND PROPERTY .................................................................................................... 39 6.3 NAVIGATION AND COMMERCIAL ACTIVITY IMPACTS ........................................................................................... 40 6.4 RECREATION IMPACTS .................................................................................................................................. 43 6.5 AIR QUALITY AND HEALTH IMPACTS ............................................................................................................... 46 6.6 HABITAT IMPACTS ....................................................................................................................................... 48 6.7 IMPACTS TO CULTURAL RESOURCES ................................................................................................................ 55

ECONorthwest 3
1 Introduction
Embargoed Report Note: This report and the accompanying Appendix A and Appendix B represent the
work products from two of the four tasks involved in the project that ECONorthwest and Salus
Resilience are completing for Multnomah County and the City of Portland. The subsequent tasks will
involve estimating monetary damages resulting from failures at the CEI Hub following a Cascadia
Subduction Zone earthquake event, including clean-up costs as well as damage and liability
assessments under the Oil Pollution Act based upon Natural Resource Damage Assessment
processes. The assumptions about the extent and magnitude of the failure and potential impacted
resources in this report will be used to estimate the monetary impacts and damages in the later
stages of this project.
1.1 Background on CEI Hub
The Critical Energy Infrastructure Hub (CEI Hub) is a six-mile area in Northwest Portland
along the Willamette River (Figure 1). The CEI Hub facilities are critical to Oregon’s fossil fuel
infrastructure - over 90 percent of the state’s liquid fuel supply is transported through CEI Hub
facilities, including gasoline and diesel. Roughly 70 percent of the fuel arrives by pipe and
another 30 percent arrives by tanker barge. 1 The CEI Hub supplies all of the jet fuel to Portland
International Airport. In addition to the fuel storage facilities, the CEI Hub also contains liquid
fuel and natural gas pipelines and transfer stations, a liquefied natural gas storage tank, storage
of other non-fuel materials, a high-voltage electrical substation, and transmission lines.
1 Oregon Seismic Safety Policy Advisory Committee. (2013). The Oregon Resilience Plan: Reducing Risk and Improving
Recover for the Next Cascadia Earthquake and Tsunami, Chapter 6: Energy.

ECONorthwest 4
Figure 1. CEI Hub Location
Source: Created by ECONorthwest
A magnitude 8 or 9 Cascadia Subduction Zone (CSZ) earthquake would impact the CEI Hub
with ground shaking, liquefaction (soil softening and movement), lateral spread (horizontal soil
movement), and landslides.2 The significant ground disturbance and resulting impacts to the
tanks could result in releases of the materials stored at the CEI Hub into land, water, and air. A
fire is also possible at the site due to the combination of flammable fuels and earthquake
disturbances. Releases from fuel tanks at the CEI Hub would pose a major hazard to people,
marine life, and property, as well as contaminate the environment and require significant clean-
up. The purpose of this analysis is to model the likely scenarios of releases and describe the
potential resulting physical impacts.
1.2 Study Purpose
The purpose of this study is to identify the magnitude and extent of potential fossil fuel releases
at the CEI Hub from a CSZ earthquake and to evaluate the resulting damages. Specifically, this
research performs the following:
• Summarizes available information about conditions at the CEI Hub.
• Describes the likely effects of a major earthquake on CEI Hub facilities.
2 Yumei Wang, Steven F. Bartlett, and Scott B. Miles. (2012). Earthquake Risk Study for Oregon’s Critical Energy
Infrastructure Hub: Final Report to Oregon Department of Energy and Oregon Public Utility Commission. Oregon
Department of Geology and Mineral Industries. August.

ECONorthwest 5
• Develops qualitative descriptions and quantitative estimates of the earthquake’s effects
at the CEI Hub, including potential releases of fossil fuels.
• Estimates the economic impacts of fossil fuel releases and infrastructure failures.
• Identifies and describes what costs might be covered by existing insurance or federal
programs and what costs are not clearly the responsibility of either owner-operators or
another party.
This evaluation is limited to only the effects of a CSZ earthquake at the CEI Hub. A CSZ
earthquake would also affect other nearby infrastructure for fuels and materials. The industrial
areas of Portland, Oregon and Vancouver, Washington along the Willamette River and
Columbia River store, use, and transport other fossil fuels and chemicals, including toxic
inhalation hazard materials that also have the potential to be released due to earthquake
damages and would complicate response efforts and strain response resources.3
3 As defined in the Federal Register (69 FR 50987): “Toxic inhalation hazard materials (TIH materials) are gases or
liquids that are known or presumed on the basis of tests to be so toxic to humans as to pose a hazard to health in the
event of a release during transportation”.

ECONorthwest 6
2 Prior Studies Related to the CEI Hub
Several prior studies have evaluated the impacts of a CSZ earthquake on the CEI Hub,
documented hazardous materials releases, and described impacts to the surrounding
environment and economy. However, these studies have not performed the analysis needed to
identify the magnitude, location, and extent of releases and the specific costs on the
surrounding environment. This report builds upon these prior studies to supply that needed
information. As background information on the history of research of the risks at the CEI Hub, a
summary of relevant prior literature is detailed below.
2.1.1 Dusicka and Norton – Liquid Storage Tanks at the Critical Energy Infrastructure (CEI) Hub Seismic Assessment of Tank Inventory (2019)
The Dusicka and Norton study from 2019 is directly related to the work being performed for
this report.4 In this publication, the authors evaluate the seismic integrity of the tanks at the CEI
Hub and provide a conceptual estimate of $300 million as the cost for seismic mitigation for the
large capacity tanks. As part of this work the researchers also estimated the quantity and
characteristics of the tanks and the supporting soil.
Through a public records request and information from the City of Portland, the authors
identified nine companies with a total of total of 514 known tanks, of which 146 were identified
as out of service. The majority of the tanks were built before 1960. Based on secondary
information, this report concludes that there is a risk of both liquefaction and landslides at the
CEI Hub from a CSZ earthquake. Structural mitigation (i.e., retrofitting the tanks so that they
are more seismically resilient) could occur through tank anchoring or soil mitigation.
2.1.2 DOGAMI – Earthquake Risk Study for Oregon’s CEI Hub (2012)
Prepared for the Oregon Department of Geology and Mineral Industries (DOGAMI), this 2012
study evaluated the geomorphic earthquake risks at the CEI Hub.5 The seismic hazards of a CSZ
earthquake on the CEI Hub include ground shaking, liquefaction, lateral spread, landslides, co-
seismic settlement, and bearing capacity failures. Secondary hazards resulting from the initial
seismic impacts include fire and hazardous materials releases. In addition to the tanks at the
CEI Hub, this study also evaluated the pipeline that runs under the Willamette River. The
pipeline was built in the 1960s and could be damaged or broken by the seismic hazards from
the earthquake, particularly liquefaction and lateral spread.
4 Dusicka, P. and Norton, G. (2019). Liquid Storage Tanks at the Critical Energy Infrastructure (CEI) Hub Seismic
Assessment of Tank Inventory. Mapleaf LLC and Portland State University. Prepared for Portland’s Bureau of
Emergency Management. May.
5 Wang, Y., Bartlett, S.F., Miles, S.B. (2012). Earthquake Risk Study for Oregon’s CEI Hub. Prepared for Oregon Department
of Geology and Mineral Industries (DOGAMI).

ECONorthwest 7
The findings from this report indicate that western Oregon will likely face an electrical blackout,
extended natural gas service outages, liquid fuel shortages, and damage and losses in the tens
of billions of dollars in a future major Cascadia earthquake. The report recommends immediate
proactive seismic mitigation actions.
2.1.3 Other Relevant Studies
OSSPAC - CEI Hub Mitigation Strategies: Increasing Fuel Resilience to Survive Cascadia (2019)
A study completed by the Oregon Seismic Policy Advisory Safety Commission (OSSPAC) at the
request of the Oregon Governor and the State Resilience Officer focused on fuel resilience
following the CSZ event.6 Through meetings and testimony with experts, agencies, and
interested stakeholders, OSSPAC presented findings and recommendations on the regulatory
authority for: seismic upgrades, statutory authority to develop long-term mitigation efforts,
public-private partnerships and incentives to harden current infrastructure, and encouraging
seismic awareness in the private sector. The major finding from this work is as follows:
“The Critical Energy Infrastructure Hub is a major threat to safety, environment, and
recovery after a Cascadia Subduction Zone earthquake on par with the 2011 Fukushima
nuclear meltdown in Japan. Owners of privately-owned liquid fuel tanks at the Hub
need to be compelled to seismically strengthen their infrastructure. No state agency is a
perfect fit to be designated as the regulatory authority over these facilities.”
Oregon Solutions – Critical Energy Infrastructure Hub Assessment Findings (2019)
A 2019 study by Oregon Solutions identified potential avenues for collaborative action that
might increase resiliency of the CEI Hub.7 Oregon Solutions was established at the state level
through the passage of the 2001 Sustainability Act and provides collaborative governance
assistance through partnerships. The report is the product of interviews conducted by Oregon
Solutions with parties and stakeholders representing key interests related to the CEI Hub
between July 2018 and January 2019.
6 Oregon Seismic Safety Policy Advisory Commission of the State of Oregon (OSSPAC). (2019). CEI Hub Mitigation
Strategies: Increasing Fuel Resilience to Survive Cascadia. December 31. OSSPAC Publication 19-01.
7 Oregon Solutions. (2019). Critical Energy Infrastructure Hub Assessment Findings. Prepared for the Portland City
Club’s Earthquake Resiliency Advocacy Committee (CCERAC) and the city of Portland’s Bureau of Emergency
Management (PBEM).

ECONorthwest 8
Other Reports
In addition to these reports that are specific to the CEI Hub, other relevant information sources
include the Oregon Resilience Plan, particularly Chapter 5: Transportation, as well as the studies
associated with the Portland Harbor Superfund site. 8, 9
8 More information and a copy of the Oregon Resilience Plan is available at:
https://www.oregon.gov/gov/policy/orr/pages/index.aspx
9 More information about the Portland Harbor Superfund is available at:
https://cumulis.epa.gov/supercpad/SiteProfiles/index.cfm?fuseaction=second.Cleanup&id=1002155#bkground

ECONorthwest 9
3 CEI Hub Fuel Releases
3.1 Methodology
Estimating the potential failures and releases associated at the CEI Hub due to a CSZ
earthquake requires combining data about the location, contents, and integrity of critical
infrastructure with information about the stability and risks of the soils that they are located on.
Tank data is based upon information from the Office of Oregon State Fire Marshal (OSFM) and
the City of Portland (COP), the latter of which was developed from the Portland State
University (2019) study of the CEI Hub.10, 11 The geological risks and susceptibility of the
location to earthquake impacts is based upon a geologic analysis, detailed in Appendix A.
As tanks deform and fail during an earthquake, a portion of the materials contained inside them
will be released. The specific volume that is released will depend on the ground displacement,
nature of the failure, capacity of the tank, and the amount of material in the tank at that time.
Most tanks in the CEI Hub have floating lids, meaning that in the event of an earthquake
materials could slosh outside of the tank’s containment. Connection failures and other
incidental damages could also result in releases even if the tank itself does not fail. Throughout
the CEI Hub there is a high likelihood of liquefaction and lateral spread from a CSZ earthquake
that would disturb tanks and their contents.
Because soils are unstable throughout the CEI Hub, the likelihood of tank failure varies based
upon the age of the tank to reflect engineering design considerations for if and how much of the
contents could be released. Engineering design standards have changed over time. American
Society of Civil Engineers design standards and state and city building codes prior to 1993 do
not meet current seismic design standards. Liquefaction of soft soils was incorporated into City
of Portland requirements for seismic design after 2004. Accordingly, these dates are used as
thresholds for estimating the likelihood of tank failure and percent of contents that could be
released, as follows:
• Prior to 1993: Tanks will likely fail during the CSZ event and release 50 to 100 percent of
contained materials.
• Between 1993 and 2004: Tanks are assumed to be designed for shaking but are
susceptible to failure due to liquefaction settlement and lateral spread.12 Up to 10 percent
10 A full description of the methodologies used for the information in this section are detailed in Appendix A, which
contains an evaluation of the geotechnical risks at the CEI Hub, and Appendix B, which contains an evaluation of
tank contents, likelihood of failure, and location of releases. 11 Dusicka, P. and Norton, G. (2019). Liquid Storage Tanks at the Critical Energy Infrastructure (CEI) Hub Seismic
Assessment of Tank Inventory. Mapleaf LLC and Portland State University. Prepared for Portland’s Bureau of
Emergency Management. May.
12 Liquefaction is the phenomenon after an earthquake when soils lose holding strength, causing them to behave like
a liquid rather than a solid and contents above or below the soil to be displaced. Lateral spread refers to the lateral
movement of soils which can result in ground tears, open surface cracks, and fissures.

ECONorthwest 10
of contained materials could be released due to connection failures and other incidental
damages.
• After 2004: Tanks have been designed to withstand appropriate shaking and
deformation and thus are not likely to fail during the CSZ event. However, up to 10
percent of contained materials could be released.
Released materials will flow out onto the ground and properties of the various operators. While
on-site containment structures are designed to capture a potential release, it is possible that the
CSZ earthquake could damage these masonry containment walls. In many cases, these
containment structures are insufficient to contain the potential cumulative volume of releases
from multiple tank failures. As a result, depending on tank location, damage zone, distance
from the water, and topography, substantial portions may flow into the Willamette River.
Damage zones vary throughout the CEI Hub properties, with different volumes staying on land
or entering the water, as described in Table 1. Appendix B provides additional information
about releases by area type.
Table 1. Damage Zones by Area
Damage Zone (distance from water in feet)
Location In Water Potentially in Water On Land
Area 1 - Kinder Morgan N 0-500 500-750 750+
Area 2 - Linnton N 0-500 500-750 750+
Area 2 - Linnton S 0-500 500-750 750+
Area 3 - NW Natural 0-250 250-500 500+
Area 4 - Willbridge 0-250 250-500 500+
Area 5 - Equilon N/A N/A All
Source: Created by Salus Resilience, see Appendix B.
3.2 Fuel and Hazardous Material Types
There are over 150 different types of materials stored at the CEI Hub, each with a unique
chemical composition. Most of the fuels stored at the CEI Hub are petroleum-based but react in
the environment in different ways. The American Petroleum Institute (API) gravity is a measure
of how heavy or light a petroleum liquid is compared to water. If a product has an API gravity
of less than 10, it sinks in water. If the product has an API gravity greater than 10, it floats in
water. Based on API ranking, the materials at CEI Hub can be assigned to the following
categories.
• Heavy Oil (API: Between 10 and 22.3): Heavy oils are dense and have a high resistance
to flow. They generally float in water and do not disperse readily.
o Asphalt (API: 11): Also known at bitumen, asphalt is a highly viscous petroleum
product primarily used in road construction.
o Bunker (API: 12 to 14): Bunker crude oil is heavy oil typically used as a vessel
fuel.
• Medium Oil (API: Between 22.3 and 31.1): Medium oils include motor oils, which are
derived from both petroleum and non-petroleum chemicals. Most motor oils are derived

ECONorthwest 11
from crude oil, with additives to improve certain properties. Motor oils are generally
used for lubricating internal combustion engines.
• Biodiesel (API: 25.7 to 33.0): Biodiesel is a fuel made from natural, renewable sources,
such as new and used vegetable oils and animal fats, for use in a diesel engine.
• Light Oils (API: Greater than 31.1)
o Diesel (API: 35): Diesel oil is produced from crude oil. It is used as a fuel for
diesel vehicles and burning.
o Jet fuel (API: 45): Jet fuel is an aviation fuel. The most commonly used fuels for
commercial aviation are Jet A and Jet A-1. Jet fuel is a mixture of a large number
of different hydrocarbons.
o Ethanol (API: 48): Ethanol is an alcohol product produced from corn, wheat,
sugar cane, and biomass and is primarily used as an additive in gasoline to
increase its octane level or as a stand-alone fuel.
o Gasoline (API: 60): Gasoline or petrol is a petroleum-derived liquid flammable
mixture consisting mostly of hydrocarbons and enhanced with isooctane or
aromatics hydrocarbons toluene and benzene to increase octane ratings.13 It is
used as fuel for gasoline vehicles and burning.
• Liquified Natural Gas (API: N/A): Natural gas is lighter than air and will dissipate into
the air if released.
• Additives (API: N/A): Nearly all commercial motor oils contain additives. Additives are
used for viscosity and lubricity, contaminant control, for the control of chemical
breakdown, and for seal conditioning of oil.
• Slop Oil (API: Varies): Slop Oil is defined as oil that is emulsified with water and solids.
It is not usable as a fuel and contains similar contamination properties as the original oil
source it contains.
• Other: Other products that do not fall into one of the prior categories includes
unknown/unavailable contents, cutter, hydraulic fluids, storm water, and water.
• Empty: Tanks without any materials are categorized as “Empty”.
• Out of Service: Tanks listed as out of service, rather than empty or with materials.
• Extra Heavy Oil (API: Less than 10): There is no evidence of extra heavy oils at the CEI
Hub.
Flammability
Different fuel types have different risks of ignition. Whether materials burn following a release
determines the range of air-quality and in-water environmental impacts. The assigned
flammability of the materials is based upon Occupational Safety and Health Administration
(OSHA) categories, as follows:14
13 ALS Life Sciences. (No Date). Library of Petroleum Products and Other Organic Compounds. Retrieved from
https://www.alsglobal.es/media-general/pdf/library-of-petroleum-products-and-other-organic-compounds.pdf
14 OSHA’s Directorate of Training and Education. (No Date). Flammable Liquids: 29 CFR 1910.106. Retrieved from
https://www.osha.gov/sites/default/files/training-library_TrngandMatlsLib_FlammableLiquids.pdf

ECONorthwest 12
• Category 1: Liquids with flashpoints below 73.4°F (23°C) and boiling point at or below
95°F (35°C). Examples: gasoline, some medium oils, and natural gas.
• Category 2: Liquids with flashpoints below 73.4°F (23°C) and boiling points at or above
95°F (35°C). Examples: Unleaded gasoline, ethanol, and bunker.
• Category 3: Liquids with flashpoints at or above 73.4°F (23°C) and at or below 140°F
(60°C). Examples: Diesel, biodiesel, and jet fuel.
• Category 4: Includes liquids having flashpoints above 140°F (60°C) and at or below
199.4°F (93°C). When a Category 4 flammable liquid is heated for use to within 30°F
(16.7°C) of its flashpoint, it must be handled as a Category 3 liquid with a flashpoint at
or above 100°F (37.8°C). Examples: Marine diesel.
Hazardous Materials
Materials are deemed hazardous based on a combination of flammability, environmental harm,
and risk from direct exposure to humans. Materials have their own Material Safety Data Sheets
(MSDSs) that define the risk of harm. The categories used for this analysis are based on the
MSDSs, as follows:
• Category H – Hazardous
• All flammable materials are considered hazardous except for biodiesel.
• Examples include gasoline, diesel, ethanol, jet fuel, and others.
• Category NH – Non-Hazardous
• Examples include contact water and stormwater.
• Not Available
• Information was not available for these materials.
• Examples include motor oil, transmission fluid, additives, and others.
3.3 Quantities of Materials at CEI Hub
There are 630 tanks of varying sizes throughout the CEI Hub holding a combined active storage
tank capacity of at least 350.6 million gallons.15, 16 There is varying information available about
the 630 tanks, as follows:
• 558 tanks have available location data from either OSFM data, COP data, or City of
Portland permitting information.17 Of these tanks:
o 143 are listed as “Out of Service” and thus not evaluated in the analysis.
o 18 are listed as “Empty”.
15 For comparison to prior research estimates, Dusicka and Norton (2019) estimated that there are at least 362 tanks
with a total capacity of 362.9 million gallons (8.64 million barrels) across all tanks (including out of service tanks).
16 The 350.6 million gallons value does not account for out of service tanks or the 102 tanks that have unknown
capacity. Accordingly, the true value of total capacity is likely higher than this value. However, tanks are rarely filled
to full capacity, so this total capacity value does not reflect the amount of total materials on site.
17 City of Portland, Portland Maps, available at: portlandmaps.com

ECONorthwest 13
o 4 tanks have unknown contents. These tanks are located at Chevron (1 tank), and
Shore Terminals (3 tanks). These tanks are evaluated in the analysis as
“Unknown” material types.
o 393 tanks are in service and have known contents information. Of these tanks:
365 tanks have tank capacity information, measured in gallons.
28 tanks are missing capacity information. These tanks are located at BP
(2 tanks), Shore Terminals (1 tank) and Zenith Energy (25 tanks).
• 72 tanks were identified via aerial photographs but are not identified in the OSFM or
COP datasets; these tanks are all in Area 4 (Zenith Energy) and are all relatively small
tanks. These tanks are missing specific location details, tank age, tank contents, and tank
capacity information. Because of the missing information these tanks were excluded
from the analysis. Due to the location of the property, it is likely that any releases from
these tanks would be onto the ground.
The are 415 active tanks, defined as tanks that are not out of service and excluding the 72 tanks
in Area 4 of unknown status that were identified in aerial photos alone. Empty tanks are
included in the active tank definition, as they could be filled. The majority of the active tank
total capacity at the CEI Hub, approximately 65 percent or 215 million gallons, are light oils
(e.g., gasoline and diesel) (Table 2).
Table 2. Total Maximum Capacity of Materials at CEI Hub in Active Tanks
Material Type
Maximum Tank
Capacity (gallons)
Percent of Total
Maximum Capacity Number of Tanks Percent of Tanks
Light Oil 215,337,397 65% 130 31%
Medium Oil 43,829,634 13% 144 35%
Heavy Oil 34,928,796 10% 29 7%
Other 24,587,064 7% 50 12%
Natural Gas 7,100,000 2% 1 0%
Biodiesel 4,082,877 1% 10 2%
Slop Oil 1,826,017 1% 16 4%
Additive 702,924 0% 13 3%
Empty 344,469 0% 18 4%
Unknown 0 0% 4 1%
Total 332,739,178 100% 415 100% Source: Salus Resilience, Appendix B
Note: Out of service tanks and the tanks of unknown status in Area 4 are not included in the total.
Although total maximum tank capacity represents the maximum amount of materials that
could be located at the CEI Hub, tanks are not usually filled to full capacity. Average fill levels
are available for 314 tanks from the COP data. On average for the tanks with information, tanks
are filled to 67 percent capacity. Tank capacity is variable, since active tanks have their contents
filled and distributed regularly. The utilization of the tanks varies by day, tank, owner, material,
shipments, and other factors. An assumption in this analysis is that all active tanks are filled to

ECONorthwest 14
67 percent capacity. Using the 67 percent fill assumption, the total contents in active tanks at is
233.5 million gallons, on average (Table 3).
Table 3. Estimated Filled Capacity of Materials at CEI Hub in Active Tanks
Material Type Average Expected Fill (gallons)
Light Oil 144,738,841
Medium Oil 39,585,777
Heavy Oil 23,402,293
Other 16,473,333
Natural Gas 4,757,000
Biodiesel 2,808,788
Slop Oil 1,223,431
Additive 470,959
Empty 0
Unknown 0
Total 233,460,422
Source: Salus Resilience, Appendix B
Note: Out of service tanks and the tanks of unknown status in Area 4 are not included in the total.
3.4 Tank Age
Of the 415 active tanks, 91 percent were built prior to 1993 or are missing information on year
built, in which case they are assumed to have been built prior to 1993 (Table 4).18 Tank age
drives the assumptions for which tanks will fail, as described in Section 3.1.
Table 4. Number of Active Tanks and Year Built by Material Type Material Type or Status Built before 1993
or Unknown
Built between
1993-2004
Built after
2004
Total
Medium Oil 142 2 144
Light Oil 110 14 6 130
Other 47 3 50
Heavy Oil 25 4 29
Empty 16 2 18
Slop Oil 15 1 16
Additive 11 2 13
Biodiesel 10 10
Unknown 4 4
Natural Gas 1 1
Total 380 23 12 415
Source: Salus Resilience, Appendix B
18 There were 72 tanks without a known year built and assumed to have been built prior to 1993.

ECONorthwest 15
3.5 Pipelines
The CEI Hub is supplied by the Olympic Pipeline which connects as far north as Bellingham,
Washington and transports gasoline, diesel, and jet fuel in pipes between 12 to 20 inches in
diameter (Figure 2).19 There are also other pipelines connecting to the CEI Hub for fuels,
including the Kinder Morgan pipeline that links petroleum terminals in the Portland region,
including to the Portland International Airport. Like tanks, pipelines are also subject to
potential failure due to seismic risks. For the Olympic Pipeline, breaks could occur north of the
CEI Hub. Pipeline contents and the resulting risk of release vary by day. Since the material is
ultimately stored in tanks at the CEI Hub, the effect of pipeline releases is partially accounted
for in the tank capacity. Underground pipelines may be more protected than the above-ground
tanks. Given these uncertainties, this analysis does consider the effects of a pipeline rupture at
the CEI Hub, but focuses solely on tank capacity.
Figure 2. Olympic Pipeline Map
Source: BP, Olympic Overview website, available at: https://www.bp.com/content/dam/bp/country-sites/en_us/united-
states/home/documents/products-and-services/pipelines/olympic-overview.pdf
19 For more information see BP Olympia Pipeline website: https://www.bp.com/en_us/united-states/home/products-
and-services/pipelines/our-pipelines.html#accordion_olympic

ECONorthwest 16
3.6 Ground Releases
Of the 415 total active tanks, 308 are in active use and have the potential to release contents onto
to the ground.20 Based on location and tank age, 285 tanks have the potential to release 50 to 100
percent of their tank contents onto the ground and 23 tanks have the potential to release up to
10 percent of their contents onto the ground. In total, a range of 53.9 million gallons to 111.2
million gallons would be released to ground surfaces (Table 5).
Table 5. Materials with Potential to Release to the Ground Surface Substance Type Number of Tanks Volume Released Min (gal) Volume Released Max (gal)
Medium Oil 144 19,506,218 39,069,770
Light Oil 73 30,811,094 63,657,094
Other 36 2,195,027 5,241,511
Empty 18 0 0
Heavy Oil 17 323,948 647,895
Slop Oil 8 462,794 925,588
Additive 7 146,803 293,605
Biodiesel 3 436,369 872,738
Natural Gas 1 0 475,700
Unknown 1 0 0
Total 308 53,882,252 111,183,900
Source: Created by Salus Resilience, Appendix B
3.7 Water Releases
Based on location and tank age, 107 active tanks have the potential to release materials that
could flow into the Willamette River.21 Of those, 96 of these tanks have the potential to release
between 50 to 100 percent of their contents to the Willamette River and 11 tanks have the
potential to release up to 10 percent of their contents into the water. In total, a range of 40.8
million to 82.5 million gallons could potentially reach the water (Table 6).
20 A detailed table is provided in Appendix B.
21 A detailed table is provided in Appendix B.
ECONorthwest 17
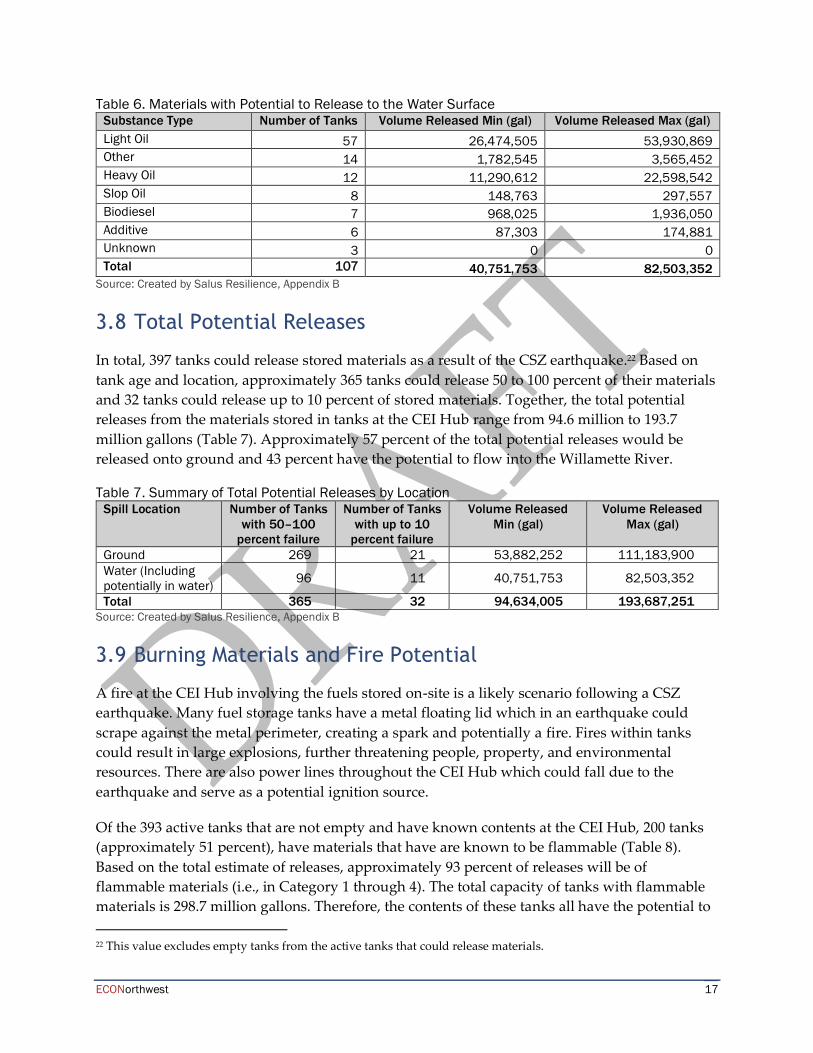
Table 6. Materials with Potential to Release to the Water Surface Substance Type Number of Tanks Volume Released Min (gal) Volume Released Max (gal)
Light Oil 57 26,474,505 53,930,869
Other 14 1,782,545 3,565,452
Heavy Oil 12 11,290,612 22,598,542
Slop Oil 8 148,763 297,557
Biodiesel 7 968,025 1,936,050
Additive 6 87,303 174,881
Unknown 3 0 0
Total 107 40,751,753 82,503,352 Source: Created by Salus Resilience, Appendix B
3.8 Total Potential Releases
In total, 397 tanks could release stored materials as a result of the CSZ earthquake.22 Based on
tank age and location, approximately 365 tanks could release 50 to 100 percent of their materials
and 32 tanks could release up to 10 percent of stored materials. Together, the total potential
releases from the materials stored in tanks at the CEI Hub range from 94.6 million to 193.7
million gallons (Table 7). Approximately 57 percent of the total potential releases would be
released onto ground and 43 percent have the potential to flow into the Willamette River.
Table 7. Summary of Total Potential Releases by Location Spill Location Number of Tanks
with 50–100
percent failure
Number of Tanks
with up to 10
percent failure
Volume Released
Min (gal)
Volume Released
Max (gal)
Ground 269 21 53,882,252 111,183,900
Water (Including
potentially in water) 96 11 40,751,753 82,503,352
Total 365 32 94,634,005 193,687,251
Source: Created by Salus Resilience, Appendix B
3.9 Burning Materials and Fire Potential
A fire at the CEI Hub involving the fuels stored on-site is a likely scenario following a CSZ
earthquake. Many fuel storage tanks have a metal floating lid which in an earthquake could
scrape against the metal perimeter, creating a spark and potentially a fire. Fires within tanks
could result in large explosions, further threatening people, property, and environmental
resources. There are also power lines throughout the CEI Hub which could fall due to the
earthquake and serve as a potential ignition source.
Of the 393 active tanks that are not empty and have known contents at the CEI Hub, 200 tanks
(approximately 51 percent), have materials that have are known to be flammable (Table 8).
Based on the total estimate of releases, approximately 93 percent of releases will be of
flammable materials (i.e., in Category 1 through 4). The total capacity of tanks with flammable
materials is 298.7 million gallons. Therefore, the contents of these tanks all have the potential to
22 This value excludes empty tanks from the active tanks that could release materials.

ECONorthwest 18
burn, either on land or in the water. Because burning requires both a fuel and an ignition
source, the specific amount of materials that would burn are a function of location and event-
specific factors.
Table 8. Tanks and Capacity by Flammability Category
Flammability Category Number of
Tanks
Volume Released Min
(gal)
Volume Released Max
(gal)
Category 1 (Most Flammable) 106 37,987,895 78,549,612
Category 2 28 22,455,581 45,248,842
Category 3 66 27,474,245 55,541,111
Category 4 0 0 0
Not Flammable 14 864,764 1,729,889
Unknown 183 5,851,521 12,617,797
Empty 18 0 0
Total 415 94,634,005 193,687,251
Source: Created by Salus Resilience, Appendix B

ECONorthwest 19
4 Substance Information
4.1 Substance Toxicities
The fuels stored at the CEI Hub are toxic, meaning that they can harm living things.
Accordingly, release of these materials will be harmful to organisms that they come in to contact
with through the ground, water, and/or air. The level of harm depends on the substance, the
level of exposure, and the pathway of exposure. Harm to living organisms can be caused by
direct physical contact – such as oil smothering plant and animals – or biochemical, which refers
to the poisonous nature of the chemicals.23 The chemical characteristics of petroleum substances
also interact with the physical and biochemical features of the habitat where a spill occurs –
meaning that the total effect is a combination of both the substance that is released as well as the
environment that it is released into.
The biochemical response varies based on the specific chemical composition of the compound.
Because fuels, additives, oils, and the other substances stored at the CEI Hub have different
chemical compositions depending on the specific blend, they can vary in toxicity even within
certain categories of substances.24
Two of the primary toxic biochemical substances associated with petroleum products are
volatile organic compounds (VOCs) and polycyclic aromatic hydrocarbons (PAHs). VOCs
disperse into the air and can be toxic when inhaled. Because VOCs evaporate into the air, they
are generally a concern only right after oil is spilled – oil floating on water surfaces quickly
volatize and lose their VOCs. At the site of a fresh oil spill, these VOCs can threaten nearby
residents, responders working on the spill, and air-breathing marine mammals.25 In contrast,
PAHs can persist in the environment for many years, in some cases continuing to harm
organisms long after the oil first spills. Studies in Alaska and Washington suggest that PAHs
are particularly harmful to fish eggs and embryos.26
23 NOAA, Office of Response and Restoration, The Toxicity of Oil: What's the Big Deal?. Available at:
https://response.restoration.noaa.gov/about/media/toxicity-oil-whats-big-deal.html
24 NOAA, Office of Response and Restoration, How Toxic is Oil?. Available at:
https://response.restoration.noaa.gov/oil-and-chemical-spills/significant-incidents/exxon-valdez-oil-spill/how-toxic-
oil.html
25 NOAA, Office of Response and Restoration, The Toxicity of Oil: What's the Big Deal?. Available at:
https://response.restoration.noaa.gov/about/media/toxicity-oil-whats-big-deal.html
26 NOAA, Office of Response and Restoration, How Toxic is Oil?. Available at:
https://response.restoration.noaa.gov/oil-and-chemical-spills/significant-incidents/exxon-valdez-oil-spill/how-toxic-
oil.html

ECONorthwest 20
4.1.1 Toxicity by Substance
Oil is grouped into five basic groups in the Code of Federal Regulations (Table 9).27 The two
most common substances at the CEI Hub, gasoline and diesel, are in Group 1 and Group 2,
respectively. Diesel is one of the most acutely toxic oil types and can cause high mortality rates
in fish and invertebrates when released into water resources.28
Table 9. Five Basic Groups of Oil Group 1: Non-Persistent Light Oils
(Gasoline, Condensate)
Highly volatile (should evaporate within 1-2 days).
Do not leave a residue behind after evaporation.
High concentrations of toxic (soluble) compounds.
Localized, severe impacts to water column and intertidal resources.
Cleanup can be dangerous due to high flammability and toxic air
hazard.
Group 2: Persistent Light Oils
(Diesel, No. 2 Fuel Oil, Light Crudes)
Moderately volatile; will leave residue (up to one-third of spill
amount) after a few days.
Moderate concentrations of toxic (soluble) compounds.
Will "oil" intertidal resources with long-term contamination potential.
Cleanup can be very effective.
Group 3: Medium Oils (Most Crude
Oils, IFO 180)
About one-third will evaporate within 24 hours.
Oil contamination of intertidal areas can be severe and long-term.
Oil impacts to waterfowl and fur-bearing mammals can be severe.
Cleanup most effective if conducted quickly.
Group 4: Heavy Oils (Heavy Crude
Oils, No. 6 Fuel Oil, Bunker C)
Little or no evaporation or dissolution.
Heavy contamination of intertidal areas likely.
Severe impacts to waterfowl and fur-bearing mammals (coating and
ingestion).
Long-term contamination of sediments possible.
Weathers very slowly.
Shoreline cleanup difficult under all conditions.
Group 5: Sinking Oils (Slurry Oils,
Residual Oils)
Will sink in water.
If spilled on shoreline, oil will behave similarly to a Group 4 oil.
If spilled on water, oil usually sinks quickly enough that no shoreline
contamination occurs.
No evaporation or dissolution when submerged.
Severe impacts to animals living in bottom sediments, such as
mussels.
Long-term contamination of sediments possible.
Can be removed from the bottom of a water body by dredging.
Source: NOAA, Office of Response and Restoration, Oil Types, Available at: https://response.restoration.noaa.gov/oil-and-
chemical-spills/oil-spills/oil-types.html
Jet fuel is not included in the five basic groupings, but is also stored at the CEI Hub. Jet fuel is
composed of light hydrocarbons with low viscosities. When spilled on open water, most of the
27 Title 33, Chapter I, Subchapter O, Part 155, Subpart D. §155.1020.
28 NOAA, Office of Response and Restoration, Small Diesel Spills. Available at:
https://response.restoration.noaa.gov/sites/default/files/Small-Diesel-Spills.pdf

ECONorthwest 21
jet fuel will evaporate or naturally disperse within a day or less, leading predominantly to air
quality impacts rather than aquatic impacts.29 However, jet fuel can attach to fine-grained
suspended sediments in the water, which then settle out and get deposited on the bottom of a
waterbody. Although jet fuels are relatively less acutely toxic than diesel, high levels of
mortality in animals and plants are expected where larger amounts of this type of petrochemical
soak into wetland soils.
Biodiesel and non-petroleum oils, which are also stored at the CEI Hub in lower quantities,
generally have low fire risk and a lower risk of biochemical toxicity, but pose a high risk of
smothering to wildlife. The physical effects of coating animals and plants with oil include
hypothermia, dehydration, diarrhea, starvation, or suffocation from the clogging of nostrils,
throat, or gills, as well as from the reduction in water oxygen content.30
Ethanol, another substance present at the CEI Hub, is also toxic to animals through primarily
physical effects. However, instead of smothering, the main risk from ethanol is lower dissolved
oxygen levels which can kill fish and other aquatic species.31
4.2 Fate and Transport of Contaminants
Fate and transport refer to the outcomes of released materials – how far they go and where they
end up. Because of their different chemical compositions, oils vary in terms of how they react
with the environment. Depending on their density, oils that are heavier than water will sink
while oils that are lighter than water will float on the surface (absent heavy disturbances). Light
oils like gasoline have a density of 0.85 gram per cubic centimeter (g/cc) – most types of
oils have densities between about 0.90 and 0.98 g/cc.32 The density of river water is usually
about 1.0 g/cc.
Heavy oils can have a density as high as 1.01 g/cc, meaning they would sink in a river. Clean up
can be very difficult and disruptive to the environment for this type of spill. Methods for
cleaning up heavy oil spills can include vacuuming, dredging, scraping, and other invasive
methods. Because these methods directly affect the environment, they can result in relatively
greater injury to habitats, species, and other natural resources.
Medium and light oils are lighter than water and, due to their volatility, will disperse into the
air through evaporation. Within a few days following a spill, light crude oils can lose up to 75
percent of their initial volume and medium crudes up to 40 percent through evaporation, but
29 NOAA, Office of Response and Restoration, Kerosene and Jet Fuel Spills. Available at:
https://response.restoration.noaa.gov/sites/default/files/Kerosene-Jet-Fuel.pdf
30 NOAA, Office of Response and Restoration, Non-Petroleum Oil Spills. Available at:
https://response.restoration.noaa.gov/sites/default/files/Non-Petroleum-Oil.pdf
31 NOAA, Office of Response and Restoration, Denatured Ethanol Spills. Available at:
https://response.restoration.noaa.gov/sites/default/files/Denatured-Ethanol.pdf
32 NOAA, Office of Response and Restoration, Oil Spills in Rivers. Available at:
https://response.restoration.noaa.gov/oil-and-chemical-spills/oil-spills/resources/oil-spills-rivers.html

ECONorthwest 22
heavy oils will lose only 10 percent of their volume in the first few days following a spill (Figure
3).33
Figure 3. Evaporation Rates of Different Types of Oils
Source: National Research Council. (2003). Oil in the Sea III: Inputs, Fates, and Effects. Washington, DC: The National
Academies Press. https://doi.org/10.17226/10388.
After a spill occurs, how the physical and chemical characteristics of oil interact with the
physical and biochemical features of the habitat is known as “weathering”. Weathering is
influenced by the characteristics of the substance, including:
• How rapidly the substance evaporates;
• How easily the substance is broken down by microbes in the environment; and
• How rapidly sunlight degrades the substance.
Weathering can be modeled using NOAA’s Automated Data Inquiry for Oil Spills (ADOIS) that
uses location- and material-specific parameters to model the results of oil releases into water
environments.34 For a heavy oil, like bunker, a large percentage of the oil will remain even
weeks later (Figure 4). In contrast, a light oil, like gasoline, will fully disperse or evaporate
within 1 or 2 days (Figure 5).
33 National Research Council. (2003). Oil in the Sea III: Inputs, Fates, and Effects. Washington, DC: The National
Academies Press.
34 More information about the ADIOS model can be found at: https://response.restoration.noaa.gov/oil-and-chemical-
spills/oil-spills/response-tools/adios.html
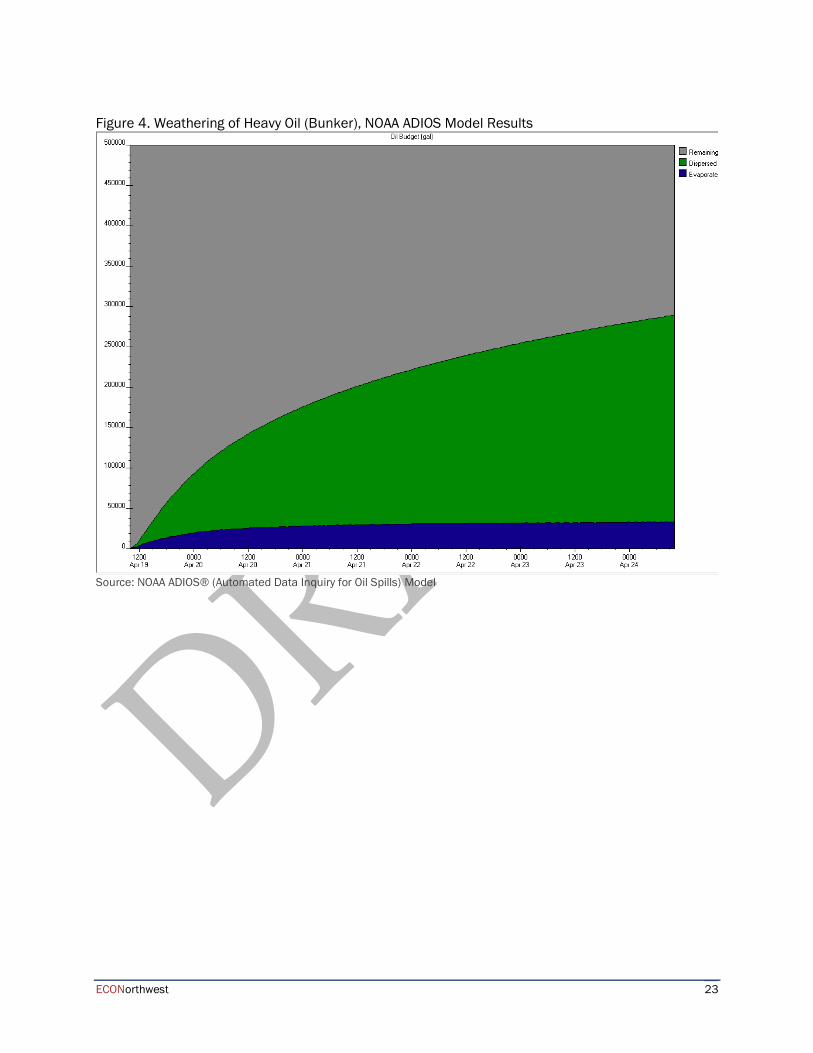
ECONorthwest 23
Figure 4. Weathering of Heavy Oil (Bunker), NOAA ADIOS Model Results
Source: NOAA ADIOS® (Automated Data Inquiry for Oil Spills) Model

ECONorthwest 24
Figure 5. Weathering of Light Oil (Diesel), NOAA ADIOS Model Results
Source: NOAA ADIOS® (Automated Data Inquiry for Oil Spills) Model
Materials that are dispersed through the water column are not easily recoverable via clean-up.
Dispersed and remaining materials will continue to interact with the environment in which they
reside through oxidation, biodegradation, and emulsification, defined as follows:35
• Oxidation is when water and oxygen combine with oil to produce water-soluble
compounds. This process affects oil slicks mostly around their edges. Thick slicks may
only partially oxidize, forming tar balls. These dense, sticky, black spheres may linger in
the environment, and can collect in the sediments of slow-moving streams or lakes or
wash up on shorelines long after a spill.
• Biodegradation occurs when micro-organisms such as bacteria feed on oil. A wide range
of micro-organisms is required for a significant reduction of the oil. As a clean-up
method to support biodegradation, nutrients such as nitrogen and phosphorus are
35 Environmental Protection Agency. (No Date). The Fate of Spilled Oil. Retrieved from
https://archive.epa.gov/emergencies/content/learning/web/html/oilfate.html#:~:text=Evaporation%20occurs%20when
%20the%20lighter,sink%20to%20the%20ocean%20floor.

ECONorthwest 25
sometimes added to the water to encourage the micro-organisms to grow and
reproduce. Biodegradation tends to work best in warm water environments.
• Emulsification is a process that forms emulsions, a mixture of small droplets of oil and
water. Emulsions are formed by wave action, and greatly hamper weathering and
cleanup processes. Two types of emulsions exist: water-in-oil and oil-in-water. Water-in-
oil emulsions formed when strong currents or wave action causes water to become
trapped inside viscous oil. These emulsions may linger in the environment for months
or even years. Emulsions cause oil to sink and disappear from the surface, which give
the false impression that it is gone and the threat to the environment has ended.
4.3 Oil Spill Clean-Up
Clean-up actions following oil spills in water resources fall generally into three categories
depending on the weathering characteristics of the released substance(s):
• Containment without removal: Generally performed for volatile substances like light
fuels that will naturally quickly evaporate or disperse and often is done using booms.
Because the oil remains on the surface, this is an effective method.
• Containment with removal: Generally used with heavier fuels, such as through
accelerated biodegradation, use of skimmers, use of sorbents (materials to soak up
liquids), use of dispersants, and in situ burning.36
• Intensive removal: Intensive removal includes dredging and scraping vegetation and
soils, as well as direct removal of oil residues from animals.
Clean-up on shorelines or other land depends on the habitat characteristics. Clean-up responses
are time-sensitive to prevent the runoff of substance into water resources. Containment
methods can be used to minimize this risk. Natural processes of evaporation, oxidation, and
biodegradation also occur for spills on land. Physical clean-up methods can include wiping
with sorbent materials, pressure washing, raking, and bulldozing, as well as burning – with
proper disposal after materials have been removed from the site.37
36 EPA Office of Emergency and Remedial Response. (1999). Understanding Oil Spills and Oil Spill Responses.
37 EPA Office of Emergency and Remedial Response. (1999). Understanding Oil Spills and Oil Spill Responses.

ECONorthwest 26
5 Case Studies of Other Fossil Fuel Infrastructure Failures
Other fossil fuel releases provide examples of the effects of releases in different environments
and for different substances. This section describes other fossil fuel infrastructure failures, their
effects, and their associated damages. These case studies are not meant to be comprehensive of
all instances of fossil fuel failures and oil spills. Rather, it provides examples that can be used to
understand the potential effects of fuel releases at the CEI Hub. Failures at the CEI Hub due to a
CSZ earthquake have the potential to result in the largest oil spill in U.S. history. Estimates of
releases are the same magnitude as what was released in the Deepwater Horizon spill – the
largest oil spill in U.S. waters to date.
5.1 Case Study Details
The case studies are organized into four categories:
• Case studies of fuel releases in Oregon;
• Case studies of fuel releases in river shipping channels and water resources;
• Case studies of other fuel releases at tank farms, near sensitive habitat, or due to
earthquakes.
5.1.1 Fuel Releases in Oregon
There have been spills of other fossil fuels in Oregon, particularly related to road and rail
incidences. A failure at the CEI Hub would be more than ten times larger than the previous
largest oil spill that occurred in 1984. An oil spill on the scale of the potential releases at the CEI
Hub is unprecedented. In terms of the environmental effects of the spill, the guidance from the
Clean Water Act and the Oregon Department of Environmental Quality highlights how even
minimal oil releases require a response to minimize damages. Any amount of oil spilled into
water and spills over 42 gallons on land must be reported to emergency services in Oregon.38
Lindsey Lake Tanker Spill near Hood River, OR (2019)
On February 11, 2019, a tanker truck carrying winter-grade diesel fuel overturned on Interstate
84 near Hood River, Oregon. An estimated 4,400 gallons of winter blend diesel were spilled
onto the roadway, approximately half of which flowed into the partially frozen Lindsey Lake
38 Oregon Department of Environmental Quality, How To Report A Spill. Available at:
https://www.oregon.gov/deq/Hazards-and-Cleanup/env-cleanup/Pages/How-To-Report-A-
Spill.aspx#:~:text=The%20National%20Response%20Center%3A%201%2D800%2D424%2D8802&text=Where%20is%2
0the%20spill%3F,What%20spilled%3F

ECONorthwest 27
nearby.39 Lindsey Lake is hydraulically connected to the Columbia River as well as a known
salmon spawning lake habitat, making the spill a threat to the greater regional ecosystem. As
part of containment, responders placed a boom on the lake to protect spawning locations and
sensitive vegetation.40 In addition, impacted snow was collected and monitoring wells were
installed to further determine environmental damage. Oregon Department of Environmental
Quality (DEQ) issued the operating party Space Age Fuel a civil penalty of $66,000 for
environmental damages.41 As of October 22, 2019, the cleanup cost to date was $3.4 million.42
Columbia River Oil Train Derailment near Mosier, OR (2016)
On June 3, 2016 an oil train derailed near Mosier, Oregon, resulting in the discharge of 47,000
gallons of Bakken crude oil approximately 600 feet from the Columbia River.43 Four train cars
caught fire and the fire was extinguished the next day. The incident resulted in the closure of I-
84 (10 hours) and the rail line, as well as a nearby park. People were evacuated from their
homes ,and damage to the city’s wastewater system prevented residents from using water for
three days.
The day after the incident, an oil sheen on the Columbia River prompted the use of booms for
containment. Within a few days, the sheen dissipated with no further cleanup beyond the
containment booms. There were no observed effects on wildlife from the incident.44 Air quality
monitoring began the day of the incident. In the immediate area of the derailment, there were
detected levels of Benzene, Hexane, O2, PM2.5, and VOC.45 More broadly, PM10, O2, PM2.5, and
VOCs were detected as far as 3 miles away.46
39 U.S. Environmental Protection Agency. (No Date). Lindsey Lake Tanker Truck Spill. Available at:
https://response.epa.gov/site/site_profile.aspx?site_id=14106 40 Oregon Department of Environmental Quality. (2019). Presentation to the Environmental Quality Commission.
November 15. Available at: https://www.oregon.gov/deq/EQCdocs/11152019_EmergencyResponse_Slides.pdf 41 Oregon Department of Environmental Quality. (2020). Notice of Civil Penalty Assessment and Order Case No. LQ/SP-
ER-2019-296. April 24. Available at: https://www.oregon.gov/deq/nr/0420SpaceAgeFuel.pdf 42 Oregon Department of Environmental Quality. (2019). Presentation to the Environmental Quality Commission.
November 15. Available at: https://www.oregon.gov/deq/EQCdocs/11152019_EmergencyResponse_Slides.pdf
43 U.S. Environmental Protection Agency, Region 10. (2016). Mosier Oil Train Derailment. Available at:
https://response.epa.gov/site/site_profile.aspx?site_id=11637
44 U.S. National Response Team. (2016). Mosier Oil Train Derailment. Available at:
https://nrt.org/site/download.ashx?counter=4472
45 Center for Toxicology and Environmental Health. (2016). Mosier Unit Train Derailment Mosier, OR Preliminary
Summary of Air Monitoring Results June 5, 2016. Available at:
https://www.deq.state.or.us/Webdocs/Forms/Output/FPController.ashx?SourceIdType=11&SourceId=6115&Screen=L
oad
46 Center for Toxicology and Environmental Health. (2016). Mosier Unit Train Derailment Mosier, OR Preliminary
Summary of Air Monitoring Results June 5, 2016.

ECONorthwest 28
Tanker SS MobilOil, Columbia River, OR (1984)
On March 19, 1984, the oil tanker SS MobilOil grounded on the Columbia River near St. Helens.
The National Transportation Safety Board determined the cause to be a steering gear failure
which forced the ship to run aground on a rocky reef.47 The reef ripped open four holding tanks
and released an estimated 170,000 gallons of heavy residual oil, number six fuel oil, and
industrial fuel oil into the river.48 Oil was spread along the Washington and Oregon coastal
shoreline as far south as Cannon Beach and as far north as the entrance to the Strait of Juan de
Fuca.
The containment and cleanup effort involved 60 people who used booms to block moorings and
marinas. The total cleanup cost was estimated at $3 million, and the cost to repair the tanker
was estimated at $5 million.49 After the spill, there were many dead waterbirds in the area.
5.1.2 Fuel Releases into Shipping Channels and Water Resources
The CEI Hub is along the Willamette River, a shipping channel for accessing the Port of
Portland and other port facilities. Previous incidents of oil spills in river shipping channels
demonstrate not only the environmental effects of discharge into water and riparian habitats
but also the economic impact that results from the closure of shipping lanes.
Refugio Incident near Gaviota, CA (2015)
The Refugio Incident near Gaviota, California was a pipeline oil spill located north of Refugio
State Beach in Santa Barbara County, California. On May 19, 2015, Line 901, a 10.6-mile pipeline
owned by Plains All American Pipeline, ruptured and spilled over 123,000 gallons of crude oil.50
Over 53,000 gallons of the spilled oil ended up in the Pacific Ocean, where it caused death and
disruption to wildlife and vegetation, as well as other environmental damages.51 The oil reached
47 Speich, S.M., and Thompson, S.P. (1987). Impacts on Waterbirds from the 1984 Columbia River and Whidbey Island,
Washington, Oil Spills. Available at: https://sora.unm.edu/sites/default/files/journals/wb/v18n02/p0109-p0116.pdf 48 U.S. Department of Energy Office of Scientific and Technical Information (1984). Marine accident report - grounding of
United States Tankship SS MOBILOIL, in the Columbia River near Saint Helens, Oregon, March 19, 1984. Available at:
https://www.osti.gov/biblio/5742109-marine-accident-report-grounding-united-states-tankship-ss-mobiloil-columbia-
river-near-saint-helens-oregon-march
49 U.S. Department of Energy Office of Scientific and Technical Information. (1984). Marine accident report - grounding
of United States Tankship SS MOBILOIL, in the Columbia River near Saint Helens, Oregon, March 19, 1984.
50 Anderson, M. (2020). Refugio Beach Oil Spill Draft Damage Assessment and Restoration Plan/ Environmental Assessment
Presentation. May 13. Available at https://pub-data.diver.orr.noaa.gov/admin-
record/6104/DARPPublicMeetingMAndersonIntroOverviewSlides_5-13-20_forwebposting.pdf
51 NOAA. (2015). Refugio Beach Oil Spill. Available at https://darrp.noaa.gov/oil-spills/refugio-beach-oil-spill; National
Oceanic and Atmospheric Administration (NOAA). (2020). Draft Restoration Plan to Support Recovery of Natural
Resources Following Refugio Beach Oil Spill. April 22. Available at: https://pub-data.diver.orr.noaa.gov/admin-
record/6104/20200422_FINAL%20DARP%20Press%20Release.mediaready.pdf

ECONorthwest 29
other beaches as far south as Los Angeles County.52 In March of 2020, nearly five years after the
incident, a $22.3 million settlement was authorized through the Damage Assessment and
Restoration Plan and Environmental Assessment.
The spill impacted recreation, commercial fisheries, and closed beaches. Recreation closures
occurred at Refugio State Beach (1 month)53 and El Capitán State Beach (2 months).54 The Draft
Restoration Plan estimates over 140,000 lost recreational user-days valued at $3.9 million.
Air quality monitoring began the day after the spill for approximately one month for VOCs,
benzene, hexane, toluene, atmospheric flammability as a percent of the lower explosive limit,
and hydrogen sulfide (H2S).55 The air monitoring did not detect crude oil‐associated
compounds that exceeded U.S. Environmental Protection Agency standards for VOCs. As such,
the assessment determined no human health risks from these airborne compounds. Of note is
that there was no fire or ignition of VOCs from the event.
TX City Y Spill in Houston Channel, TX (2014)
On March 22, 2014, the bulk carrier M/V Summer Wind collided with the oil tank-barge Kirby
27706 in Galveston Bay near Texas City, Texas. As a result, the barge spilled approximately
168,000 gallons of intermediate fuel oil into lower Galveston Bay, the majority of which then
flowed into the Gulf of Mexico.56 Most of the discharged oil was on shorelines between
Galveston and Matagorda Islands.57 Damages and impacts for this incident are still being
evaluated, but the release caused the closure of the heavily trafficked Port of Houston for 3
days.58 As of 2015, PAHs from the oil spill continue to pose environmental risks in the marine
environment.59 In 2016, Kirby Island Marine L.P. agreed to pay $4.9 million in Clean Water Act
civil penalties due to the incident.60
52 NOAA. (2020). Draft Restoration Plan to Support Recovery of Natural Resources Following Refugio Beach Oil Spill. April
22.
53 Rocha, Veronica (2015). "El Capitan beach to reopen a month after Santa Barbara County oil spill". Los Angeles
Times. June 19.
54 Moore, J.C. (2015). "Refugio State Beach to reopen today after oil-spill closure". Ventura County Star. July 17.
55 Center for Toxicology and Environmental Health, LLC. (2015). Community Air Monitoring and Sampling Summary:
Refugio Incident. June 15.
56 NOAA, Office of Response and Restoration. (2014). Texas City Y Oil Spill. Available at: https://darrp.noaa.gov/oil-
spills/texas-city-y
57 Yin, F., Hayworth, J. S., & Clement, T. P. (2015). A tale of two recent spills—comparison of 2014 Galveston Bay and
2010 Deepwater Horizon oil spill residues. PloS one, 10(2), e0118098.
58 NOAA, Office of Response and Restoration. (2014). Update on the Texas City "Y" Response in Galveston Bay. Available
at: https://response.restoration.noaa.gov/about/media/update-texas-city-y-response-galveston-bay.html
59 Yin, F., Hayworth, J. S., & Clement, T. P. (2015). A tale of two recent spills—comparison of 2014 Galveston Bay and
2010 Deepwater Horizon oil spill residues. PloS one, 10(2), e0118098.
60 U.S. Department of Justice. (2016). Kirby Inland Marine to Pay $4.9 Million in Civil Penalties and Provide Fleet-Wide
Improvements to Resolve U.S. Claims for Houston Ship Channel Oil Spill. September 27. Available at:

ECONorthwest 30
Deepwater Horizon in the Gulf of Mexico (2010)
The Deepwater Horizon oil spill is the largest spill in the history of the United States. On April
20, 2010, an explosion occurred on the Deepwater Horizon drilling platform in the Gulf of
Mexico, leading to the largest offshore oil spill in U.S. history. The explosion caused the rig to
sink and leaked 134 million to 206 million gallons of oil into the Gulf over three months.61 The
initial explosion killed eleven men. The Deepwater Horizon oil spill killed thousands of marine
mammals and sea turtles, and also contaminated their habitats.62 Containment measures
included floating booms, skimmer boats, and sorbents. Chemical dispersants were also used to
facilitate oil degradation. During the spill response there was a temporary flight restriction over
the area as well as on-the-ground access restrictions.
A major public health impact was air pollution. A study following the incident found four
primary sources of pollutants: (a) Hydrocarbons (HCs) evaporating from the oil; (b) smoke from
deliberate burning of the oil slick; (c) combustion products from the flaring of recovered natural
gas; and (d) ship emissions from the recovery and cleanup operations.63 Studies have noted that
the air pollution impacts could have been much worse for a spill of similar size closer to
populated areas, closer to the surface, or in a region with larger NOx sources.
The financial claims were largely settled when a Federal District judge approved the largest
environmental damage settlement in United States history – $20.8 billion – on April 4, 2016.64 In
2016, BP calculated their total cost for the oil spill, including both damages, fines, and economic
loss, as $61.6 billion.65
https://www.justice.gov/opa/pr/kirby-inland-marine-pay-49-million-civil-penalties-and-provide-fleet-wide-
improvements
61 United States of America v. BP Exploration & Production, Inc., et al. (2015). Findings of fact and conclusions of law:
Phase Two trial. In re: Oil spill by the oil rig “Deepwater Horizon” in the Gulf of Mexico, on April 20, 2010, No. MDL 2179,
2015 WL 225421. (Doc. 14021). U.S. District Court for the Eastern District of Louisiana. Retrieved from
https://www.gpo.gov/fdsys/pkg/USCOURTS-laed-2_10-md-02179/pdf/USCOURTS-laed-2_10- md-02179-63.pdf 62 NOAA. (2017). Deepwater Horizon Oil Spill Longterm Effects on Marine Mammals, Sea Turtles. Available at:
https://oceanservice.noaa.gov/news/apr17/dwh-protected-
species.html#:~:text=The%20scientists%20concluded%20that%20the,turtles%2C%20and%20contaminated%20their%2
0habitats.
63 Middlebrook, A. M., Murphy, D. M., Ahmadov, R., Atlas, E. L., Bahreini, R., Blake, D. R., & Ravishankara, A. R.
(2012). Air quality implications of the Deepwater Horizon oil spill. Proceedings of the National Academy of
Sciences, 109(50), 20280-20285.
64 NOAA. (2017). Explosion triggered economic, environmental devastation, and a legal battle. April 20. Available at
https://www.noaa.gov/explainers/deepwater-horizon-oil-spill-settlements-where-money-went
65 BP. (2016). 2Q 2016 Results: Conference Call on July 24, 2016. Available at:
https://www.bp.com/content/dam/bp/business-sites/en/global/corporate/pdfs/investors/bp-second-quarter-2016-
results-presentation-slides-and-script.pdf

ECONorthwest 31
Eagle Otome in Port Arthur, TX (2010)
On January 23, 2010, a barge and its towing vessel collided with the tanker Eagle Otome on the
Sabine Neches Canal in Port Arthur, Texas. The Eagle Otome was punctured and an estimated
462,000 gallons of Olmeca crude sour oil was spilled into the canal.66 The spill caused a shipping
lane closure of 16 miles and impacted local residents, 136 of whom were temporarily evacuated
from the site. Clean up responses at the crash site were delayed for approximately 12 hours due
to high levels of hydrogen sulfide. Air monitoring beyond the immediate area did not indicate
the presence of hydrogen sulfide, but there was a strong petroleum odor. The spill resulted in
$1.5 million in damages to the Eagle Otome, $35,000 to the towing vessel, and $381,000 to the
barge vessel.
Enbridge Line 6B in the Kalamazoo River, MI (2010)
On July 25, 2010, a rupture in the Enbridge line 6B pipeline caused oil to leak into the wetlands
adjacent to the Kalamazoo River in Michigan. The leak consisted of two batches of heavy
bituminous crude oil diluted with lighter petroleum products.67 It was several hours before the
leak was discovered in which time several residents had called the local health department
complaining from a heavy oil smell in the air. The spill flowed downstream 38 miles.
Containment and recovery were ongoing for the next four years. Responders installed oil
absorbent and a boom at two parks near battle Creek and used vacuum trucks to recover oil
from the source area. The Kalamazoo River was closed to the public for 1.5 years, then
periodically opened and closed for dredging of submerged oil for the next three years. The
presence of benzene and other constituents in the oil posed a respiratory threat to public health
and safety. The Michigan Department of Community Health issued a Fish Consumption
Advisory and a Swimming Advisory, both of which were in place until June 28, 2012.
DM932 Tanker and Barge Collision near New Orleans, LA (2008)
On July 23, 2008, tanker Tintomara collided with fuel barge DM932 on the Mississippi River
near downtown New Orleans. The Tintomara suffered minor damage, but the DM932 barge
split into two sections, releasing 270,000 gallons of spilled #6 fuel oil into the Mississippi River. 68
Response to the spill required 2,300 personnel, 130,000 feet of containment boom, 200 boats, and
35 skimmers.69
66 National Transportation Safety Board. (2010). Collision of Tankship Eagle Otome with Cargo Vessel Gull Arrow and
Subsequent Collision with the Dixie Vengeance Tow Sabine-Neches Canal, Port Arthur, Texas. January 23. Available at:
https://maritimesafetyinnovationlab.org/wp-content/uploads/2015/02/ntsb-eagle-otome-collision-2010.pdf 67 https://www.fws.gov/midwest/es/ec/nrda/MichiganEnbridge/pdf/FinalDARP_EA_EnbridgeOct2015.pdf
68 NOAA, Damage Assessment, Remediation, and Restoration Program. (2008). Fuel Barge DM 932. Available at:
https://darrp.noaa.gov/oil-spills/fuel-barge-dm932
69 Simmons, R. (2009). Tank Barge DM 932 Spill: Response from the Perspective of the “Environmental Unit”. Available at:
https://archive.epa.gov/emergencies/content/fss/web/pdf/simmons.pdf

ECONorthwest 32
Oil from the barge spread over 100 miles of the lower Mississippi River. More than 130,000
gallons of an oil and water mix were recovered.70 The river was temporarily closed to vessel
traffic for 8 hours to lift the barge out of the water. The incident impacted terrestrial and
riparian habitats in the over 100-mile span. In addition, the sediments at the bottom of the river
were contaminated.
M/V Westchester in Plaquemines Parish, Louisiana (2000)
On November 28, 2000, the M/V Westchester tanker lost steerage and grounded in Plaquemines
Parish, Louisiana. The initial loss of steerage was due to a crankcase explosion onboard.71 The
grounding punched a hole in the cargo tank and an estimated 550,000 gallons of crude oil
spilled into the Mississippi River.
Containment measures included placing booms at key bayous and cuts and deploying
skimmers to collect oil from the water surface. The case is notable for its efficient recovery of
lost oil which was aided by the riprap on the west bank which trapped the oil. Vessel traffic on
the Mississippi River was halted the next day for 21 river miles. The river was reopened to in-
bound traffic one day later on November 30, 2000 and was opened to both up-river and down-
river traffic on December 1, 2000.72 Several thousand acres of terrestrial, riparian, and oceanic
habitat were impacted by the spill. The spill exposed flora and fauna in these areas to black oil,
emulsified oil, and sheen. Approximately 19,000 kilograms of finfish and shellfish biomass were
lost through direct kill and lost production. In addition, recreation fishing and waterfowl
hunting were affected by closures and limited access to boat launch points.
5.1.3 Other Fuel Releases
Failure and fuel releases at the CEI Hub would not only flow into the Willamette River, but also
affect the ground resources. The case studies in this section include others at fuel tank farms as
well as fuel releases caused by earthquakes. In addition to the effect on terrestrial resources,
these incidents also demonstrate the potential for fire and air quality hazards that could result
from fossil fuel tank failures.
Savoonga AVEC Tank Farm in Savoonga, AK (2021)
On February 27, 2021, a bulk oil storage tank located at Savoonga Power Plant, operated by
Alaska Village Electric Coop, spilled while fuel was being transported between tanks. The
power plant is located on St. Lawrence Island, 450 feet from the Bering Sea. The tank leaked an
70 NOAA. (2000). Tanker and Barge Collision in New Orleans, LA Update August 4, 1000 EDT. Available at:
https://incidentnews.noaa.gov/incident/7861/521838/8929
71 Michel, J., Henry Jr, C. B., & Thumm, S. (2002). Shoreline assessment and environmental impacts from the M/T
Westchester oil spill in the Mississippi River. Spill Science & Technology Bulletin, 7(3-4), 155-161.
72 NOAA. (2001). Final Damage Assessment/Restoration Plan and Environmental Assessment: M/V Westchester Crude Oil
Discharge. Available at: https://www.gc.noaa.gov/gc-rp/west-fnl.pdf

ECONorthwest 33
estimated 20,000 gallons of #2 Diesel into secondary containment.73 A valve left open on a bulk
fuel tank caused the leak. The valve was closed and investigators determined there was no
environmental impact – oil did not flow into the Bearing Sea or into the nearby wetland
tundra.74 Containment of the spill involved excavating contaminated snow and pumping diesel
fuel pooled under the snow. In addition, nine cubic feet of impacted frozen soil was chipped out
with a jackhammer. There were no public closures associated with the spill due to its remote
location.
Contra Costa NuStar in Crockett, CA (2019)
On October 15, 2019, an explosion occurred at the NuStar energy fuel storage facility in
Crockett, California. The facility stored ethanol, gasoline, diesel, and aviation fuels. The fire
damaged two tanks containing 250,000 gallons of ethanol.75 The explosion started a seven-hour-
long fire which had serious health and safety effects on the region. All personnel were
evacuated from the site and emergency response services were onsite within minutes. The fire
consumed thousands of gallons of fuel and investigators found high levels of smoke
particulates, but not unusually high amounts of toxic substances.76 A small grass area also
caught on fire. The fires were put out later that same day.
There was a shelter in place ordered approximately one hour after the explosion for nearby
residents of Crockett and Rodeo for approximately 7 hours. Contra Costa County also issued a
public health order for people in the neighboring communities of Crockett, Rodeo, and
Hercules to stay indoors due to poor air quality.77 Residents were advised to leave air
conditioning and fans off and place damp towels in door and window openings. In addition,
the twelve-home community of Tormey (located near the NuStar facility entrance) was
evacuated and four schools in the area were closed for two days. Both directions of Interstate 80
near the facility were shut down for six hours to help manage the fire. The fire was eventually
contained with foam.
Great East Japan (Tohoku) Earthquake and Tsunami (2011)
The devastating Great East Japan Earthquake and Tsunami, also known as the Tohoku Event,
occurred on March 11, 2011 when a magnitude 9.0 earthquake occurred about 80 miles off the
73 Alaska Department of Environmental Conservation. (2021). Savoonga AVEC Tank Farm Diesel Oil Release.
74 McChesney, R. (2018). No environmental impact from 22,000-gallon heating oil spill in Savoonga. Alaska Public Media.
March 18. Available at: https://www.alaskapublic.org/2018/03/15/no-environmental-impact-from-22000-gallon-
heating-oil-spill-in-savoonga/ 75 Associated Press. (2019). Earthquake probed as possible cause of California fuel fire. October 16. Available at:
https://apnews.com/article/4b2b77c5ecec4b01b8ef6c70beeb7ca6
76 Sciacca, A. (2019). “Supes consider tightening rules over fuel storage facilities in wake of NuStar explosion”. East
Bay Times. Available at: https://www.eastbaytimes.com/2019/10/22/concerns-about-nustar-explosion-in-crockett-
prompt-contra-costa-officials-to-review-safety-ordinance/
77 Contra Costa Health. (2019). Data Incident Report: October 15, 2019. Available at: https://cchealth.org/hazmat/data-
incident-report/60548099.pdf

ECONorthwest 34
northeast coast of Japan. Over 20,000 people died and over 500,000 were forced to evacuate. The
Fukushima nuclear plant disaster is the most well-known hazardous materials release resulting
from the event. However, there were also many instances of toxic substance releases,
explosions, and fires resulting from failures at other industrial facilities. At some facilities, the
cause of the damage was the earthquake, while at others it was the tsunami.78 Excluding the
costs of the Fukushima nuclear power plant failures, the total economic damages of the event
exceed $210 billion.
The Great East Japan earthquake also demonstrates the complexities of responding to oil spill
events during an environmental disaster. In Ichihara City, liquefied petroleum gas tanks
exploded due to ground motion and resulted in fires that spread to asphalt tanks and buildings
throughout the facility that took ten days to extinguish.79 In the Sendai area, a fire at a
petrochemical complex, ignited by a spark caused by tank friction, burned a gasoline tank,
asphalt tanks, molten sulfur tanks, and oil handling facilities. Many other oil tanks and
petrochemical facilities were damaged by the tsunami and often were washed out to sea.
5.2 Case Studies Summary
The case studies in this section vary in terms of the amount of the spill, the contents spilled, and
where it was spilled at. Accordingly, the extent and costs of damages and secondary effects like
fires also vary as well. Of the case studies discussed in this section, the potential releases at the
CEI Hub following a CSZ event will be similar to the large events, Deepwater Horizon and the
Great East Japan earthquake, in terms of level of releases and resulting damages to the
environment, health, and safety. Table 10 summarizes common elements for each case study.
78 Krausmann, E., & Cruz, A. M. (2013). Impact of the 11 March 2011, Great East Japan earthquake and tsunami on the
chemical industry. Natural hazards, 67(2), 811-828.
79 Zama, S., Nishi, H., Hatayama, K., Yamada, M., Yoshihara, H., & Ogawa, Y. (2012). On damage of oil storage tanks
due to the 2011 off the Pacific Coast of Tohoku Earthquake (Mw9. 0), Japan. In Proceedings of the 15th world conference
on earthquake engineering (WCEE) (Vol. 2428, pp. 1-10).

ECONorthwest 35
Table 10. Case Study Summary Case Study Year Spill Amount Type of Oil Spill Location Fire Status
Fuel Releases in Oregon
Oregon Lindsey Lake
Tanker Spill
2019 4,400 gallons Diesel fuel (Light Oil) Ground and freshwater None
Columbia River Oil
Train Derailment
2016 47,000 gallons Bakken crude oil (Light Oil) Ground and freshwater Fire on ground
Tanker SS MobilOil Spill 1984 170,000 gallons Number 6 Crude Oil and
Industrial Fuel Oil (Light and
Medium Oils)
Freshwater and saltwater None
Fuel Releases into Shipping Channels and Water Resources
Refugio Incident 2015 123,000 gallons Crude oil Freshwater and saltwater None
TX City Y Spill 2014 168,000 gallons Intermediate fuel oil (Medium
Oil)
Ground, freshwater, and
saltwater
None
Deepwater Horizon 2010 134-206 million
gallons
Macondo crude oil (Light Oil) Saltwater Fire on the drilling platform
Eagle Otome 2010 462,000 gallons Olmeca crude oil (Light Oil) Freshwater and saltwater None
Enbridge Line 6B 2010 Over 1 million
gallons
Diluted bitumen (Heavy Oil) Freshwater None
DM 932 Tanker 2008 270,000 gallons Number 6 fuel oil (Heavy Oil) Freshwater None
M/V Westchester 2000 550,000 Sweet Nigerian crude oil (Light
Oil)
Freshwater None
Other Fuel Releases
Savoonga AVEC Tank
Farm
2021 20,000 gallons #2 Diesel (Light Oil) Ground None
Contra Costa NuStar 2019 250,000 gallons Ethanol (Light Oil) Ground Fire on the ground
Great East Japan
(Tohoku) Earthquake
and Tsunami
2011 Large (exact amount
unknown)
Multiple fuel types (e.g.,
diesel, asphalt, crude) (Light,
Medium, and Heavy Oils)
Ground, freshwater, and
saltwater
Multiple fires at
petrochemical and fuel
storage facilities Source: Created by ECONorthwest

ECONorthwest 36
5.3 Other Evaluations of Fossil Fuel Impacts Near CEI Hub
5.3.1 Tesoro Savage Petroleum Terminal at the Port of Vancouver
The Vancouver Energy Distribution Terminal Facility was proposed to be located on the
Columbia River, approximately 10 miles north of the CEI Hub and would be owned and
operated by the Tesoro Savage Petroleum Terminal LLC. The proposed crude oil terminal
facility would have a capacity of 360,000 barrels of crude oil per day that it would receive by
train, store onsite, and then load onto marine vessels to be transported to west coast refineries.
Given the proximity and the similar resources that would be transported at the Tesoro Savage
Petroleum Terminal compared to what is stored at the CEI Hub, the research conducted as part
of this proposal is also relevant to the potential impacts of releases at the CEI Hub due to a CSZ
earthquake.
A 2016 report80 evaluated impacts to fishing and natural resources from the “worst-case
scenarios” from the Draft Environment Impact Statement for the proposed Vancouver Energy
Distribution Terminal Facility.81 The two scenarios are a tanker grounding near Vancouver that
would spill over 189,845 barrels (bbls) (about 8 million gallons), and for a train derailment near
the Bonneville Dam that would spill 20,000 bbls.
The authors assumed that the spill occurred during spring (between mid-April and mid-May),
corresponding with peak salmon populations in the Lower Columbia River. Based on the
timing assumptions as well as estimates detailed in the report about fate and transport
modelling, the estimated damages to Columbia River habitats from the vessel grounding in
Vancouver is $171.3 million, including $114.4 million for injured habitats in the river channel
and $56.9 million for injuries to floodplain wetlands adjacent to the river. The estimated
damages to Columbia River habitats from the upriver train derailment scenario is $84.9 million,
including $54.5 million for injured habitats in the river channel and $30.4 million for injuries to
floodplain wetlands adjacent to the river.82
80 Abt Associates Inc. and Bear Peak Economics. (2016). Potential Fishing Impacts and Natural Resource Damages
from Worst-Case Discharges of Oil on the Columbia River. Submitted to: Matthew Kernutt, Assistant Attorney
General Washington Attorney General’s Office. May 12.
81 The Draft Environment Impact Statement is available at: https://www.efsec.wa.gov/efsec-
document/Tesoro%20Savage/SEPA/docGroup/Draft%20Environmental%20Impact%20Statement
82 All dollar values from Abt Associates Inc. and Bear Peak Economics are 2016 values.

ECONorthwest 37
6 Direct Impacts of a CSZ Earthquake on the CEI Hub
The direct impacts of a CSZ earthquake on the CEI Hub and the resulting effects on the
surrounding people, property, and environment will likely be exacerbated by the surrounding
destruction of the event. Roads, bridges, and many other infrastructure types will be damaged
in the earthquake, which will likely impair access to the site to take actions like fire suppression,
rescues, containment, monitoring, and other immediately needed steps to minimize the damage
from releases. Absent any failures of the CEI Hub and associated fuel releases, there would still
be threats to people, property, and the environments from the earthquake. For example,
commercial and recreational river activity would likely be impacted from an earthquake due to
accessibility and hazards for a period of time, even without any releases from the CEI Hub. The
intent of this analysis is to include only effects that are attributable to containment failures at the
CEI Hub, and not impacts from the earthquake in general.
The impacts that could be attributable to releases at the CEI Hub that are evaluated in this
analysis include:
• Loss of life and injuries directly related to releases at the CEI Hub site or adjacent
parcels;
• Effects on navigation and river-related commercial activity;
• Short-term and long-term effects on the environment;
• Short-term and long-term effects from air quality impacts;
• Impacts to cultural resources.
6.1 Earthquake Considerations
Impacts from CEI Hub releases will vary both on the magnitude of the earthquake, the extent of
releases, if a fire occurs, and the ability to respond quickly to contain releases. Spill response
will be a primary determining factor in how quickly the releases are contained and how far they
spread, particularly for releases into the water. Spill responses usually occur as soon as a spill is
reported to the spill response team.83 However, response actions to fuel releases resulting from
the CSZ earthquake will likely be substantially delayed due to damaged infrastructure and
resource shortages.
The Cascadia Playbook from Oregon Office of Emergency Management suggests that Regional
Hazardous Materials Emergency Response Teams (RHMERT) will be contacted within 6 hours
83 The Lower Columbia Spill Response Plan, as well as all the response plans associated with Region 10 Regional
Response Team (RRT) and the Northwest Area Committee (NWAC) is available at:
https://www.rrt10nwac.com/GRP/

ECONorthwest 38
after an event where oil and hazardous materials need to be controlled and contained. 84
Initiating containment of oil and hazardous materials spills or releases in impacted areas is
estimated to begin 24 hours after the event. While these timelines represent best practices, there
are potential impediments to a rapid response particularly around access, personnel and
resource availability, and other hazards present at the site, each of which are discussed below.
Prior Characterizations of Responding to CEI Hub Failures After a CSZ Event from OSSPAC (2019)85
“Other large-scale catastrophes would be unfolding throughout the City and region. Emergency
response personnel would struggle to address the disaster occurring at the CEI Hub because roads,
bridges, utilities, and communication systems would be damaged or destroyed. And recovery vehicles
would be unable to access and use the very fuel that spills from the CEI Hub’s tanks.”
6.1.1 Access Considerations
Access to the CEI Hub via road or river may be difficult or dangerous due to damage to roads
and infrastructure. Following the CSZ earthquake, reopening Tier 1 and Tier 2 state highways
in the Willamette Valley will take approximately 1 to 3 days.86 Access via waterway will also be
complicated due to the CSZ earthquake. Structures such as bridges and piers may collapse into
the waterway, posing hazards for both access and containment. Access to boat launches may
similarly be restricted, causing delays.
6.1.2 Personnel and Resource Availability
The CEI Hub will not be the only area with hazardous releases due to a CSZ earthquake.
Release of hazardous materials could also occur from train derailments or damage to vessels.
Within the Lower Columbia River, there are additional fuel storage facilities at the NuStar and
Tesoro terminals in the Port of Vancouver. There are also other fuel storage facilities in
surrounding areas which could have spills due to the CSZ earthquake. Accordingly, resources
may be thinly spread throughout these response sites and spills either at the CEI Hub or other
locations may extend further than they would have if resources were not constrained by the
coinciding incidents.
6.1.3 Release of Toxic Inhalation Hazard Materials
As defined by the Hazardous Materials Regulations, toxic inhalation hazard materials (TIH
materials) are gases or liquids that are known or presumed on the basis of tests to be so toxic to
humans as to pose a hazard to health in the event of a release. 87 Chlorine gas and anhydrous
ammonia are the most common TIH chemicals. Other TIH chemicals include sulfur dioxide,
84 Oregon Office of Emergency Management. (2018). Cascadia Playbook Version 3.0. Retrieved from
https://www.oregon.gov/oem/emresources/Plans_Assessments/Pages/Other-Plans.aspx
85 Oregon Seismic Safety Policy Advisory Commission of the State of Oregon (OSSPAC). (2019). CEI Hub Mitigation
Strategies: Increasing Fuel Resilience to Survive Cascadia. December 31. OSSPAC Publication 19-01.
86 Oregon Seismic Safety Policy Advisory Commission (OSSPAC). (2013). The Oregon Resilience Plan: Chapter 5.
Transportation. February.
87 49 CFR parts 171-180.

ECONorthwest 39
ethylene oxide, hydrogen fluoride, and others. Although not stored at the CEI Hub itself, TIH
materials are present within the area near the CEI Hub. Evaluating the effect of these chemical
releases is beyond the scope of this study, however, the release of those materials due to a CSZ
earthquake could complicate spill response efforts at the CEI Hub. In particular, release of TIH
materials could limit access to respond to the spill if the presence of TIH substances renders the
area too dangerous for emergency personnel.
6.2 Direct Impacts to People and Property
6.2.1 People Near the CEI Hub
There are ten companies on 31 properties located at the CEI Hub that vary in size from 0.1 to
31.27 acres for a total of 219.85 acres.88 On average there, are 0.8 full-year equivalent workers per
acre,89 for a total of approximately 200 people on-site throughout the CEI Hub properties. More
generally, the zip codes where the CEI Hub is located (97231 and 97210) have a total combined
population of 16,508 and total employment of 31,517.90 In addition to the physical presence of
these people, there are also people driving through for personal or business reasons and river-
related transport that could put people at risk from CEI Hub failures from a CSZ earthquake.
Impacts would not only be in these zip codes, but this area represents the immediate nearby
population.
The potential for CEI Hub failures to impact people and cause injury or loss of life will depend
in part on when the event happens – if it happens on a weekday or weekend, during the day or
at night, and what season – since that will influence how many people are working in and
around the site. During weekends and at night, there will be fewer people in the area based on
use patterns. Similarly, during the winter there may be fewer people on the water compared to
a sunny day at the height of the fishing season.
In the event that there are also fires at the CEI Hub or at nearby industrial sites, which are likely
to occur, people and property will be further threatened by direct fire risk as well as air quality
health impacts. Evacuations will be extremely challenging during this time due to ground
damage, potential impacts to the telecommunication network, and strained emergency response
resources. Fire response resources may not be able to immediately address the blazes at these
locations, which could result in the fire spreading throughout the area. Of note, burning is
sometimes a clean-up mechanism used for oil spills, so fuel ignition could decrease the amount
of oil that contaminates the environment via land or water. Air quality impacts are discussed
further in Section 6.5 of this report.
88 See Appendix B for a fill list of properties and their characteristics.
89 Quarterly Census of Economics and Wages (QCEW) contains confidential information and was available for this
study through a data use agreement with the Oregon Employment Department. All results are aggregated and
reported in a way that maintains confidentiality standards.
90 IMPLAN 2019 Study Area Data for Combined Zip Codes 97231 and 97210.

ECONorthwest 40
A March 12, 2019 fire at NW Metals Inc. in Portland demonstrates the emergency response and
potential health effects from fires at industrial sites. During this event the City of Portland and
Multnomah County issued an evacuation order for residents between Northeast 60th and 76th
avenues and Northeast Columbia Boulevard and Alberta Street, using buses to evacuate
residents without personal transportation. Particulate matter was the primary concern from this
event, which poses a health risk, particularly to young children, seniors, and people with
compromised respiratory systems.91 Toxic chemicals in the air were also a concern, including
asbestos, aldehydes, acid gases, sulfur dioxide, nitrogen oxides, polycyclic aromatic
hydrocarbons, benzene, toluene, styrene, metals, and dioxins.
6.2.2 Impacts to Properties
CEI Hub property owners will experience the largest property damage resulting from tank
failures. Some of the tank failures and lateral spread ground movement has the potential to
impact adjacent property owners as private property is displaced throughout the area. Fires can
also spread across properties – the extent of the damage will vary by the spread of the fire. CEI
Hub fuel releases that reach the Willamette River or flow downstream will primarily impact the
state-owned waterways, since the State of Oregon owns the bed and the banks of navigable
rivers up to the high-water mark.92
6.3 Navigation and Commercial Activity Impacts
The navigation channel of the Willamette River is a critical shipping area for marine vessels that
provides access to the CEI Hub as well as other nearby facilities, including Terminal 2, Terminal
4, the Swan Island Industrial Park, and other private businesses. To understand the extent of
navigation and commercial activity, vessel counts were derived from vessel Automatic
Identification System (AIS) data provided by the Bureau of Ocean Energy Management (BOEM)
and NOAA as of 2017.93 This data source contains total counts for large vessels, but excludes
small vessels not required to have automatic identification systems. Daily counts were
calculated for the entire year for the Willamette from the 405 bridge to the confluence of the
Willamette River with the Columbia River. Each vessel was counted once per day for each day
of the year using a unique identifier. Vessel types in the AIS data are standard categories used
by the U.S. Coast Guard, NOAA, and the BOEM.94
91 Multnomah County. (2018). Evacuations expand Monday night in Northeast Portland due to unhealthy smoke from fire.
March 12. Available at: https://multco.us/multnomah-county/news/evacuations-expand-monday-night-northeast-
portland-due-unhealthy-smoke-fire
92 Oregon Department of State Lands. (No Date). Public Use of Oregon’s Rivers and Lakes. Available at:
https://www.oregon.gov/dsl/ww/documents/nav_brochure.pdf
93 Automatic Identification System (AIS) data obtained from: https://marinecadastre.gov/data/
94 More information on the classification of vessel types is available at:
https://coast.noaa.gov/data/marinecadastre/ais/VesselTypeCodes2018.pdf

ECONorthwest 41
Based on the AIS data, there were 7,097 total vessels that passed by the CEI Hub on the
Willamette River in 2017 (annual total). Of the total vessels, approximately 67 percent were
towing vessels and the remainder where other vessel types including public, commercial, and
recreational vessels (Figure 6). Vessel counts vary slightly by day of week, ranging from a low
of 17 average vessels per day on Sunday to a high of 21 vessels per day on Tuesdays and
Fridays. Similarly, there is some variation by month, with a low of 430 vessels in January and a
high of 693 vessels in September – for an average of 591 vessels per month (Figure 7).
Figure 6. Annual Vessel Counts by Type, 2017, I-405 to Confluence of Willamette and Columbia
Rivers
Source: Automatic Identification System (AIS) data provided by the Bureau of Ocean Energy Management (BOEM). (2017).
Retrieved from https://marinecadastre.gov/data/
Freight Ship,
788
Passenger
Inspected, 187
Public Vessel
Unclassified,
464
Recreational,
239
Towing Vessel,
4,718
Type Missing,
498
All Other Categories,
203

ECONorthwest 42
Figure 7. Total Vessel Traffic by Month, 2017, I-405 to Confluence of Willamette and Columbia Rivers
Source: Source: Automatic Identification System (AIS) data provided by the Bureau of Ocean Energy Management (BOEM).
(2017). Retrieved from https://marinecadastre.gov/data/
Figure 8 depicts towing vessel traffic paths (in green) for a combination of high volume, average
volume, and low volume sample days from 2017. As demonstrated in the map, the river area
immediately adjacent to the CEI Hub and downstream between the CEI Hub and the
confluence with the Columbia River are the most heavily used vessel traffic areas of the
Willamette River.
430472
535
633 623
689
623 611
693 688
529571
0
100
200
300
400
500
600
700
800
1 2 3 4 5 6 7 8 9 10 11 12
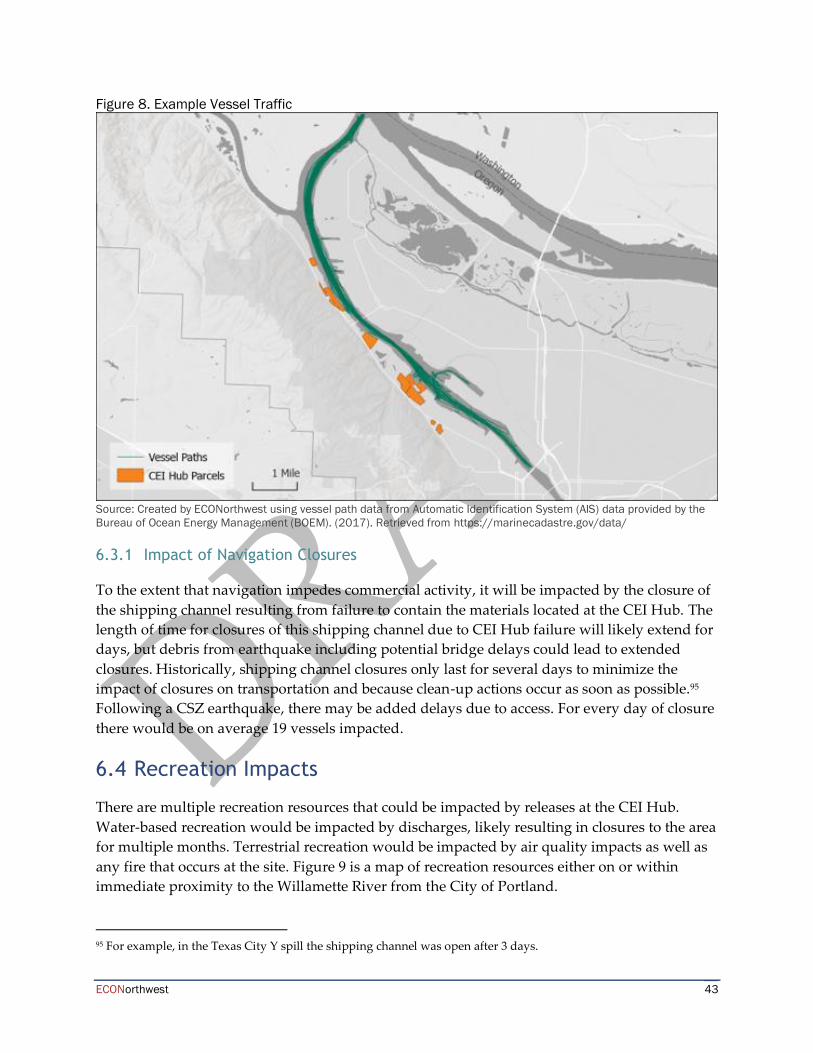
ECONorthwest 43
Figure 8. Example Vessel Traffic
Source: Created by ECONorthwest using vessel path data from Automatic Identification System (AIS) data provided by the
Bureau of Ocean Energy Management (BOEM). (2017). Retrieved from https://marinecadastre.gov/data/
6.3.1 Impact of Navigation Closures
To the extent that navigation impedes commercial activity, it will be impacted by the closure of
the shipping channel resulting from failure to contain the materials located at the CEI Hub. The
length of time for closures of this shipping channel due to CEI Hub failure will likely extend for
days, but debris from earthquake including potential bridge delays could lead to extended
closures. Historically, shipping channel closures only last for several days to minimize the
impact of closures on transportation and because clean-up actions occur as soon as possible.95
Following a CSZ earthquake, there may be added delays due to access. For every day of closure
there would be on average 19 vessels impacted.
6.4 Recreation Impacts
There are multiple recreation resources that could be impacted by releases at the CEI Hub.
Water-based recreation would be impacted by discharges, likely resulting in closures to the area
for multiple months. Terrestrial recreation would be impacted by air quality impacts as well as
any fire that occurs at the site. Figure 9 is a map of recreation resources either on or within
immediate proximity to the Willamette River from the City of Portland.
95 For example, in the Texas City Y spill the shipping channel was open after 3 days.

ECONorthwest 44
Figure 9. Recreation Resources in Proximity to the CEI Hub
Source: City of Portland, Bureau of Planning and Sustainability. (2020). Willamette River Greenway Inventory. December
16.
In addition to the recreation resources in the immediate vicinity of the CEI Hub there are also
popular recreation sites that could be impacted by released materials at the CEI Hub. Forest
Park, a 5,200 urban forest owned by the Portland Parks and Recreation, is located Northwest of
the CEI Hub in the upland area on the opposite side of Highway 30/NW Saint Helen’s Road.
Visitation at Forest Park is most likely to be impacted by air quality hazards, particularly during
any fire that occurs. The Cascadia earthquake will also likely affect visitation at Forest Park due
to the damage to roads and other infrastructure, as well as downed trees and other hazards
within the park itself.
Downstream of the CEI Hub is Sauvie Island, an island located between the Willamette River
and Columbia River that hosts a large wildlife refuge, agricultural farms, and private
residences. During the summer, boat access and beaches are popular recreation sites. During the
fall and early winter, Sauvie Island Wildlife Refuge is used for waterfowl hunting. Impacts from
CEI Hub failure and releases would temporarily impact Sauvie Island recreation sites and
activities from airborne releases caused by burning in the event of a fire. Water contamination
could also impact Sauvie Island boating and swimming. The extent of water contamination
would vary depending on containment actions in the spill response. Fishing and waterfowl
hunting at Sauvie Island are likely to be impaired immediately and in the years following the
spill due to lingering environmental toxins. The Cascadia earthquake will also likely affect
visitation at Sauvie Island due to the damage to roads and other infrastructure, as well as
downed trees and other hazards within the park itself.

ECONorthwest 45
6.4.1 Water-Based Recreation
The water-based recreation resources in and around the CEI Hub are primarily boat ramps with
access to the Willamette River. Within the anticipated closure area from the confluence with the
Columbia River and the I-405 bridge, there are two boat ramps that provide both motorized and
non-motorized boat access, Swan Island boat ramp and Cathedral Park boat ramp, and two boat
ramps that only allow non-motorized access, at McCarthy Park and Kelley Point Park. There is
also the fishing dock at Cathedral Park, which is a short-term tie-up dock. Visitation counts are
not maintained at any of these sites. However, estimates from Portland Parks and Recreation for
Swan Island boat ramp suggest that there are 2,500 launches and retrievals each year from this
site alone.96
River recreation along this stretch of the Willamette River is primarily for motorized fishing
vessels. For this reason, use is especially pronounced in the fishing season for salmon and
steelhead, beginning in May and extending through the summer months. Motorized personal
watercraft also uses this stretch for boat tours along the Willamette River near the City Center.
People also launch kayaks, paddleboards, sailboats, and other dingeys from these locations.
Immediate impacts to river recreation from failure of the CEI Hub would be the closure of these
access points while clean-up occurs. Based on the timeline for the Refugio Incident in California
which was likely smaller than what would occur at the CEI Hub, clean-up will likely last
multiple months. Some of these closures as well as voluntary ends to use may occur regardless
of the CEI Hub spill due to the damage from the CSZ earthquake. Depending on liquefaction at
other sites, roads and access points likely would not be usable anyways for an extended period
of time. Water quality of the Willamette River will likely also be impacted due to the sediment
loading resulting from the earthquake, which would impact fishing conditions in particular.
6.4.2 Fish Consumption
Longer term, the residual contaminants from the CEI Hub failures could result in fishing
advisories to limit consumption of aquatic species in this area. However, there are currently
fishing advisories in place for resident fish in this stretch of the Lower Willamette.97 Resident
fish should not be eaten at all due to their high concentrations of polychlorinated biphenyls
(PCBs) that pose a risk to human health. Resident fish include carp, brown bullhead, bass,
walleye, and other fish that live their whole lives in the Lower Willamette. The advisory does
not apply to migratory fish like salmon, steelhead, and shad.
96 Email communication from Maya Agarwal, Portland Parks & Recreation, on March 16, 2021.
97 The April 11, 2018 Lower Willamette fish advisory is available from the Oregon Health Authority at:
https://www.oregon.gov/oha/PH/HEALTHYENVIRONMENTS/RECREATION/FISHCONSUMPTION/Pages/Lower-
Willamette-Fish-Advisory.aspx

ECONorthwest 46
6.4.3 Terrestrial Recreation
The terrestrial recreation sites located near the CEI Hub, between the confluence with the
Willamette River and I-405 and with views of the river, include the following sites, as well as
informal use along the banks of the river, particularly on the Northern side:
• Cathedral Park
• Forest Park
• Kelley Point Park
• Greenway Trail
• Willamette Cove Natural Area
• Harbor View Property
• McCarthy Park
• Swan Island Park
• St. Johns Bridge Viewpoint
• Railroad Bridge Viewpoint
Many of these are popular sites for people throughout the Portland metro area and beyond.
Like water-based recreation, terrestrial recreation will be impacted by the earthquake due to
access and potential hazards. There will likely be temporary air-quality impacts to these sites
resulting from the smoke from the fire and hazardous aerosol chemical releases that—in
absence of CSZ earthquake closures—could affect recreation at these sites, but there will likely
already be recreation closures at these sites due to other CSZ earthquake impacts.
6.5 Air Quality and Health Impacts
With tank failure, the fuels, additives, gasses, and other materials stored at the CEI Hub could
ignite, releasing a toxic plume into the air. Even if it did not ignite, volatilization of harmful
components of the materials would also travel beyond the site. This air would spread
throughout the area, posing health risks to people, pets, livestock, and wildlife. The health
impacts of these releases would be most immediate and severe for the people working in and
around the CEI Hub. There are populated areas located primarily north, south, and east of the
CEI Hub, and depending on wind conditions there could be extreme risks to human health
from this harmful plume.
Air quality in the Portland metro region is at times already hazardous, primarily the result of
wildfire and wood burning stove smoke with stagnate air (ozone and particulate matter),98 as
well as releases from manufacturing facilities.99 Any air quality impacts from a release at the
CEI Hub would only compound any existing concerns. Burning petrochemicals produce several
98 More information about smoke related DEQ air quality advisories is available at:
https://www.oregon.gov/deq/aq/Pages/Air-Pollution-Advisories.aspx
99 More information about industrial air quality concerns is available from Oregon Department of Environmental
Quality at: https://www.oregon.gov/deq/aq/Pages/Air-Quality-Map.aspx

ECONorthwest 47
types of air pollutants including VOCs, NOx, sulfur dioxide (SO2), and particulate matter
(PM2.5). All of these pollutants can have negative effects on human health and quality of life,
from shortness of breath to respiratory infections and even cancer.100 Local populations will be
vulnerable to the adverse health effects of these pollutants, which may lead to increases in
illnesses, reduced quality of life, and increased costs of treatment. These types of air quality
impacts have been observed in other major oil spills.101
The ultimate direction of any air plume from releases at the CEI Hub are very weather specific
and can vary from day to day. Nevertheless, there are seasonal trends that put certain portions
of the Portland Metro region’s population at higher risk. NOAA’s Air Resources Laboratory’s
Hybrid Single-Particle Lagrangian Integrated Trajectory model (HYSPLIT) is one of the most
widely used models for atmospheric trajectory and dispersion calculations.102 A series of
scenarios modeling 24 hour releases during a systematic sample of 12 days per season in 2020
show that the Portland area experiences high weather variability in fall and spring, but more
consistent trends in the winter and summer. Should the CSZ event occur in the summer,
residents to the south and east of the CEI Hub are likely to experience the greatest air-quality
decreases, while residents in the north are likely to experience greater harms in the winter
(Figure 10).
100 National Institute of Health. (2019). “Chemicals and Contaminants”. Tox Town: U.S National Library of Medicine.
Retrieved from: https://toxtown.nlm.nih.gov/chemicals-and-contaminants. 101 Middlebrook, A. M., Murphy, D. M., Ahmadov, R., Atlas, E. L., Bahreini, R., Blake, D. R., & Ravishankara, A. R.
(2012). Air quality implications of the Deepwater Horizon oil spill. Proceedings of the National Academy of
Sciences, 109(50), 20280-20285. 102 Stein, A. F., Draxler, R. R., Rolph, G. D., Stunder, B. J., Cohen, M. D., & Ngan, F. (2015). NOAA’s HYSPLIT
atmospheric transport and dispersion modeling system. Bulletin of the American Meteorological Society, 96(12), 2059-
2077.

ECONorthwest 48
Figure 10: Air Quality Plume Models, by Season.
Source: NOAA HYSPLIT analysis performed by ECONorthwest
6.6 Habitat Impacts
6.6.1 Effect of Substance Releases on Fish and Wildlife
Oil spills from CEI Hub failures have the potential to cause direct mortality and long-term harm
to fish and wildlife in both the immediate area of the spill as well as in water resources as
materials are transported downstream. Oil releases can affect wildlife not only through the
initial direct exposure, but also through impacts to habitats and clean-up activities. Oil
contamination can also degrade habitats and limit food supplies, which could cause secondary
mortality or other harm to species and indirect mortality.103 These factors of toxicity and habitat
impairment, as well as the physiological stress from oil spills, can also affect the reproductive
103 National Research Council. (2003). Oil in the Sea III: Inputs, Fates, and Effects. Washington, DC: The National
Academies Press. https://doi.org/10.17226/10388.

ECONorthwest 49
success of species. 104 Lastly, clean-up actions can also be disruptive, particularly more invasive
actions like suctioning, dredging, and burning contaminated vegetation. Specific concerns from
oil spills for different types of species include:105
• Birds: Birds are likely to be exposed to oil as they float on the water’s surface. Oiled
birds can lose the ability to fly, dive for food, or float on the water which could lead to
drowning. Oil interferes with the water repellency of feathers and can cause
hypothermia. Oil ingestion has been shown to cause suppression to the immune system,
organ damage, skin irritation and ulceration, and behavioral changes. Damage to the
immune system can lead to secondary infections that cause death, while behavioral
changes may affect an animal’s ability to find food or avoid predators.
• Shellfish: Oil can be toxic to shellfish including bottom dwelling (lobsters, crabs, etc.)
and intertidal (clams, oysters, etc.) species. The bottom dwelling species may be
particularly vulnerable when oil becomes highly concentrated along the shoreline.
• Fish: Fish can be impacted directly through uptake by the gills, ingestion of oil or oiled
prey, effects on eggs and larval survival, or changes in the ecosystem that support the
fish. Adult fish may experience reduced growth, enlarged livers, changes in heart and
respiration rates, fin erosion, and reproductive impairment when exposed to oil. Oil has
the potential to impact spawning success as eggs and larvae of many fish species are
highly sensitive to oil toxins.
Because oil has the potential to persist in the environment long after a spill event, it can have
long-term impacts on fish and wildlife populations. Accordingly, injuries can persist well
beyond the direct clean-up from an incident.
6.6.2 Habitat Types in and Around CEI Hub
NOAA maintains environmental sensitivity maps that identify natural resources that are
potentially at-risk if an oil spill occurs nearby. The NOAA environmental sensitivity maps for
the Columbia River include mapping of the CEI Hub.106 Resources immediately near the CEI
Hub include birds, fish, and reptiles, such as:
• Birds: Bald eagle, osprey, and other waterfowl.
• Fish: Chinook salmon, coho salmon, sockeye salmon, steelhead, white sturgeon, and
others.
• Reptiles: Western pond turtle and western painted turtle.
104 NOAA, Office of Response and Restoration, How Toxic is Oil?. Available at:
https://response.restoration.noaa.gov/oil-and-chemical-spills/significant-incidents/exxon-valdez-oil-spill/how-toxic-
oil.html
105 U.S. Fish and Wildlife Department. (2010). Effects of Oil on Wildlife and Habitat.
106 The CEI Hub is mapped as “ESI20” for the Columbia River, available at:
https://response.restoration.noaa.gov/esi_download#Oregon

ECONorthwest 50
The lower Columbia River supports 74 populations of salmon, steelhead, and bull trout.107
Many of these species are listed threatened or endangered under state and federal law. In 2020
there were 7.0 million adult and jack species counted at Bonneville dam and 70,000 counted at
Willamette Falls.108, 109
Downstream of the CEI Hub, there are additional environmentally sensitive resources. The
downstream area of the Willamette River, Columbia River, and their tributaries includes the
Sauvie Island Wildlife Area, Ridgefield National Wildlife Refuge, Julia Butler Hansen Refuge
for The Columbian White-Tailed Deer, and the Lewis and Clark National Wildlife Refuge.110, 111
These refuge areas support wintering and migrating concentrations of waterfowl and
shorebirds, provide juvenile salmonid rearing habitat, and contribute to the food supply for a
wide swath of environmental resources. There are also multiple areas of Freshwater
Forested/Shrub Wetland habitat located downstream of the CEI Hub that are hydrologically
connected to the Willamette or Columbia Rivers.112 Because they are downstream of the CEI
Hub, all of these resources have the potential to be impacted depending on river conditions and
spill response activities. Figure 11 displays the location of these sensitive habitat and wildlife
areas.
107 State of Salmon in Watersheds. (2020). Lower Columbia River. Available at:
http://teststateofsalmon.wa.gov/regions/lower-columbia-river/salmon/
108 Columbia Basin Fisheries Agencies and Tribes, Fish Passage Center Website. Available at: https://www.fpc.org/
109 Counts include Chinook salmon (Adult and Jack), Coho salmon (Adult and Jack), Steelhead, Sockeye salmon, Pink
salmon, Chum salmon, Lamprey, and Shad.
110 Abt Associates Inc. and Bear Peak Economics. (2016). Potential Fishing Impacts and Natural Resource Damages from
Worst-Case Discharges of Oil on the Columbia River. Submitted to: Matthew Kernutt, Assistant Attorney General
Washington Attorney General’s Office. May 12.
111 Region 10 Regional Response Team (RRT) and the Northwest Area Committee (NWAC). (2015). Lower Columbia
Spill Response Plan. October. Available at: https://www.rrt10nwac.com/GRP/
112 U.S. Fish and Wildlife Service, National Wetland Inventory Mapper. Available at:
https://www.fws.gov/wetlands/data/mapper.html

ECONorthwest 51
Figure 11. Location of Sensitive Wildlife and Habitat Areas
Source: Created by ECONorthwest using information from U.S. Fish and Wildlife Service, National Wetland Inventory
mapper
6.6.3 Extent of Releases from CEI Hub
The impact on habitats and species from tank failures at the CEI Hub is based primarily on the
amount of material that flows into the water. Because the CEI Hub is an industrial area, releases
only onto the ground are not likely to cause extensive habitat impacts. Fires and the chemical
vapors that they produce could impact wildlife in the same way that they can impact humans.
As discussed in Section 3, between 40.8 million to 82.5 million gallons of oil and hazardous
materials could potentially flow into the Willamette River due to a CSZ earthquake and
subsequent tank failures. This level of spill would be between one-quarter to one-half of what
was released over three months in the Deepwater Horizon oil spill. When the oil is released into
the Willamette River, it will flow with the river current until it is contained or until it reaches
the Pacific Ocean. Table 11 details the seasonal average river currents for the Willamette and
Columbia Rivers at the closest upstream gages to the CEI Hub. As demonstrated in these
values, the river current (i.e., velocity) can be more than to six times faster in the winter
compared to the summer and is faster in the Columbia River than the Willamette River.

ECONorthwest 52
Table 11. Seasonal Average Water Velocity (feet per second)
Willamette River at Broadway Bridge,
Portland, OR
Columbia River at Vancouver,
Washington
Winter 1.58 2.45
Spring 0.48 1.20
Summer 0.24 0.47
Fall 0.56 1.09 Source: Calculated by ECONorthwest based on information from USGS, National Water Information System: Web Interface,
available at: https://nwis.waterdata.usgs.gov/nwis
The river currents describe how fast remaining materials will flow downstream. As discussed in
Section 4.2, because materials evaporate and disperse over time, there are fewer remaining
materials each day. Heavier fuels will remain longer in the water without dispersing or
evaporating. Modelling current and weathering information also informs the extent of
contamination based on when containment and clean-up activities commence.
Based on the current in the summer it will take approximately 15.5 days for materials released
from the CEI Hub into the Willamette River to reach the Pacific Ocean (Figure 12). In contrast,
during the winter when currents are faster, it will take approximately 3 days for remaining
materials released from the CEI Hub into the Willamette River to reach the Pacific Ocean. These
timelines are without containment actions. With containment actions the flow of released
materials would be stopped where the containment occurs. Of note, fuels and industrial
containments are likely to also enter the Willamette River and Columbia River from other sites
due to the CSZ earthquake, so containment actions will be needed at other locations as well.
Containment before releases reach the ocean may not be possible due to the damages to
infrastructure following the earthquake and other complications.

ECONorthwest 53
Figure 12. River Transport During Low (Summer) and High (Winter) Flow Conditions
Source: Created by ECONorthwest using data from USGS
As discussed in section 4.2, not all the materials released from the CEI Hub will remain in the
water for the length of time it would take to reach the Pacific Ocean. After 10 hours, almost of
all the gasoline, ethanol, and aviation fuel will have evaporated into the air, particularly during
hotter days when evaporation rates are higher and more sunlight and microbes can break down
the chemicals.113 Diesel and crude oil will evaporate in part, but up to 60 percent could be
remaining when the materials reach the Pacific Ocean.114 Because these light fuels float on top of
the water they will largely flow with the river. Heavier oils like asphalt and bunker crude oil
will sink in the water and largely remain in any environment that they come in contact with on
riverbeds and shorelines. Despite sinking, heavier oils will continue to be transported by the
water velocity, although at a slower rate than non-sinking lighter oils that remain on the water
surface. Figure 13 models sample evaporation rates for gasoline, crude, diesel, and bunker fuels
over time for the first three days.
113 National Research Council. (2003). Oil in the Sea III: Inputs, Fates, and Effects. Washington, DC: The National
Academies Press. https://doi.org/10.17226/10388.
114 National Research Council. (2003). Oil in the Sea III: Inputs, Fates, and Effects. Washington, DC: The National
Academies Press. https://doi.org/10.17226/10388.

ECONorthwest 54
Figure 13. Evaporation Rates
Source: Created by ECONorthwest using information from National Research Council (2003) and NOAA ADIOS model
results.
Applying the evaporation rates described previously to the materials that could be potentially
released at the CEI Hub results in the finding that after three days between 20.9 million and 42.3
million gallons of diesel, medium, and heavy oils could be remain in the water (excluding
additives and unknown materials). Because most evaporation occurs early, in the low flow
scenario in the summer these levels of materials are likely to remain about as high for the
remaining days and be transported to the Pacific Ocean. This level of contamination is likely to
result in significant mortality among aquatic species throughout the lower Willamette and
Columbia Rivers. Mortality and impacts to sensitive species will be particularly pronounced if
the spill occurs during the salmon spawning seasons in the late spring to early fall.
6.6.4 Effect of Ground Spills on Properties
The habitat impacts of spills onto the ground at the CEI Hub will not be as severe as the water
resources because materials will not be transported on the ground and there are not sensitive
habitats in the terrestrial area of the CEI Hub. However, releases on to the ground will
contaminate the soil and require clean-up efforts and site remediation, such as soil removal. Oil
sheens on the ground are possible for years afterwards even with remediation actions.
0
10
20
30
40
50
60
70
80
90
100
0 0.5 1 1.5 2 2.5 3
Pe
rce
nt
of
Ma
teri
al R
em
ain
ing
Days Since Initial Release
Gasoline Crude Diesel Bunker

ECONorthwest 55
6.7 Impacts to Cultural Resources
Historically, the Willamette River has been used by local tribes for subsistence, transportation,
commerce, and ceremonial purposes. The Cultural Resources Analysis Report for the Portland
Harbor Superfund Site (2005) details some of the specific cultural resources near the CEI Hub:115
“Some Tribes retain treaty rights to salmon and other fish including lamprey, not only as
a source of food but also as part of their culture and spirituality. Wetlands in this region
are also culturally important because wetlands support wapato, a harvested item that
was traded between Chinookans in the Portland Basin and other Native peoples at the
coast. The only known location that currently supports wapato is a small riverine
wetland located in the Swan Island Lagoon. Native vegetation was also gathered for
food and tools.”
The Willamette River has been the site of tremendous investment through the Portland Harbor
Superfund Clean Up,116 and those efforts have been working to improve the environmental
conditions to support cultural values related to habitats and the species they support.
Particularly for tribes, restoring this ecosystem is of particular importance to correct historic loss
of cultural value.
115 Ellis, D.V., Allen, J.M., and Hajda, Y. (2005). Cultural Resource Analysis Report for the Portland Harbor Superfund Site,
Portland, Oregon.
116 More information about the Portland Harbor Superfund Site is available at:
https://cumulis.epa.gov/supercpad/SiteProfiles/index.cfm?fuseaction=second.Cleanup&id=1002155#bkground