Embed Size (px)
Citation preview

1
MANUAL FOR FLUID MECHANICS LABORATORY-1
DEPARTMENT OF CIVIL ENGINEERING
NATIONAL INSTITUTE OF TECHNOLOGY, SRINAGAR, J&K, INDIA
Vision of the Institute
To establish a unique identity of a pioneer technical Institute by developing a high-quality
technical manpower and technological resources that aim at economic and social development
of the nation as a whole and the region, in particular, keeping in view the global challenges

2
Mission of the Institute
M1. To create a strong and transformative technical educational environment in which fresh
ideas, moral principles, research and excellence nurture with international standards.
M2. To prepare technically educated and broadly talented engineers, future innovators and
entrepreneurs, graduates with understanding of the needs and problems of the industry, the
society, the state and the nation.
M3. To inculcate the highest degree of confidence, professionalism, academic excellence and
engineering ethics in budding engineers.
Vision of the Department
To create a unique identity of the Department by achieving excellent standards of quality
technical education keeping pace with the rapidly changing technologies and to produce Civil
Engineers of global standards with the capability of accepting new challenges.
Mission of the Department
M1. To promote academic growth in the field of Civil Engineering by offering state-of-the-
art undergraduate and postgraduate programmes.
M2. To provide knowledge base and consultancy services in all areas of Civil Engineering
for industry and societal needs.
M3. To inculcate higher moral and ethical values among the students to become
competent Civil Engineers with overall leadership qualities.
M4. To flourish as the Centre of Excellence in the emerging areas of research related to
Civil Engineering and its allied fields.

3
Course Objectives
1. Students able will be able to develop understanding about hydrostatic law, principle of buoyancy and
stability of a floating body and application of mass, momentum and energy equation in fluid now.
2. Students able will be able to imbibe basic laws and equations used for analysis of static and dynamic fluids.
3. Students able will be able to inculcate the importance of fluid flow measurement and its applications in
Industries.
4. Students will be able to learn fundamental knowledge of fluid, its properties and behavior under various
conditions, work in team, developed ethics and learn to manage a project.
Program Specific Objectives
1. Ability to demonstrate professional engineering approach, including application of principles and utilization
of technical resources such as software’s towards solving technical problems requiring civil engineering
interventions.
2. Ability to furnish and/or analyze designs and construct structural systems, produce related documents,
drawings and reports, and present objective estimates of the related quantities.
3. Ability to conduct field and laboratory investigations pertaining to civil engineering domain and utilize
modern tools and techniques of surveying.
DO’s
1. Follow all safety rules strictly.
2. Before performing experiment read instrument manual carefully.
3. Count all accessories before receiving equipment’s in the lab.

4
4. All personal accidents, injuries and illness, however slight occurring in the laboratory must be immediately
reported to the instructor.
5. Ask lab instructor if you are not sure about what to do.
6. Results of experiments should be countersigned by the concerned faculty.
7. Personal items should be stored in proper areas.
8. Exercise caution when handling liquids in the vicinity of electrical equipments.
9. Notify the faculty in charge in advance for late hour working.
10. Return all equipment’s and glassware to its original location after finishing the lab work.
11. In case of fire alarm sounds, evacuate the building via nearest exit.
12. Maintain discipline while working in the lab.
Don’ts
1. Do not try to spill out the water or any other liquid from instruments.
2. Do not try to touch the mechanical parts of the equipment while in running condition.
3. Do not put your hands into running water during experimentation.
4. Do not remove experiments from cabinets without the permission of the instructor.
5. Do not leave the experiments running unattended.
6. Do not try yourself repair any faulty instrument.
7. Do not operate machine without permission.
8. Do not try to copy observations of experimentation of fellow students.
9. Do not put any hazardous material in to the running liquid of any equipment.
10. Do not take laboratory equipment, glassware outside the lab.
List of Experiments:
1. To determine experimentally the metacentric height of a ship model.
2. To verify the Bernoulli's equation experimentally.

5
3. To determine the coefficient of discharge coefficient of velocity and coefficient of contraction of an orifice or
a mouthpiece of a given shape.
4. To calibrate an orifice meter and to study the variation of coefficient of discharge with Reynold's number.
5. To calibrate a Venturimeter and to study the variation of coefficient of discharge with Reynold's Number.
6. To calibrate sharp crested rectangular and triangular weir.
7. To verify momentum equation experimentally.
List of Equipment
1. Metacentric Height determination apparatus.
2. Bernoulli’s Theorem apparatus.
3. Orifice, Mouthpiece Cd, Cc, Cv.
4. Venturi and Orifice meter apparatus.
5. Venturi and Orifice meter apparatus.
6. Weir/Notch apparatus.
7. Impact of Jet apparatus

6
Experiment 1. To determine experimentally the metacentric height of a ship model.
Aim: To determine metacentric height of floating body
Equipment:
Introduction and Theory:
Whenever a body, floating in a liquid is given a small angular displacement, it starts oscillating about the
same point, this point about which the body starts oscillating is called metacentre. The distance between
the center of gravity of a floating body and the metacentre is called metacentre height. As a matter of fact
the metacentre height of a floating body is a direct measure of its stability or in otherwards more the
metacentric height of a floating body more it will be stable. A body is said to be in equilibrium when it
remains in a steady state, while floating in a liquid.
Figure: Metacenter and Metacentric Height. FA=Buoyancy Force, FG=Dead weight. S = Center of
gravity, A = center of buoyancy, M = metacenter location, zm = distance between center of gravity and
metacenter
7
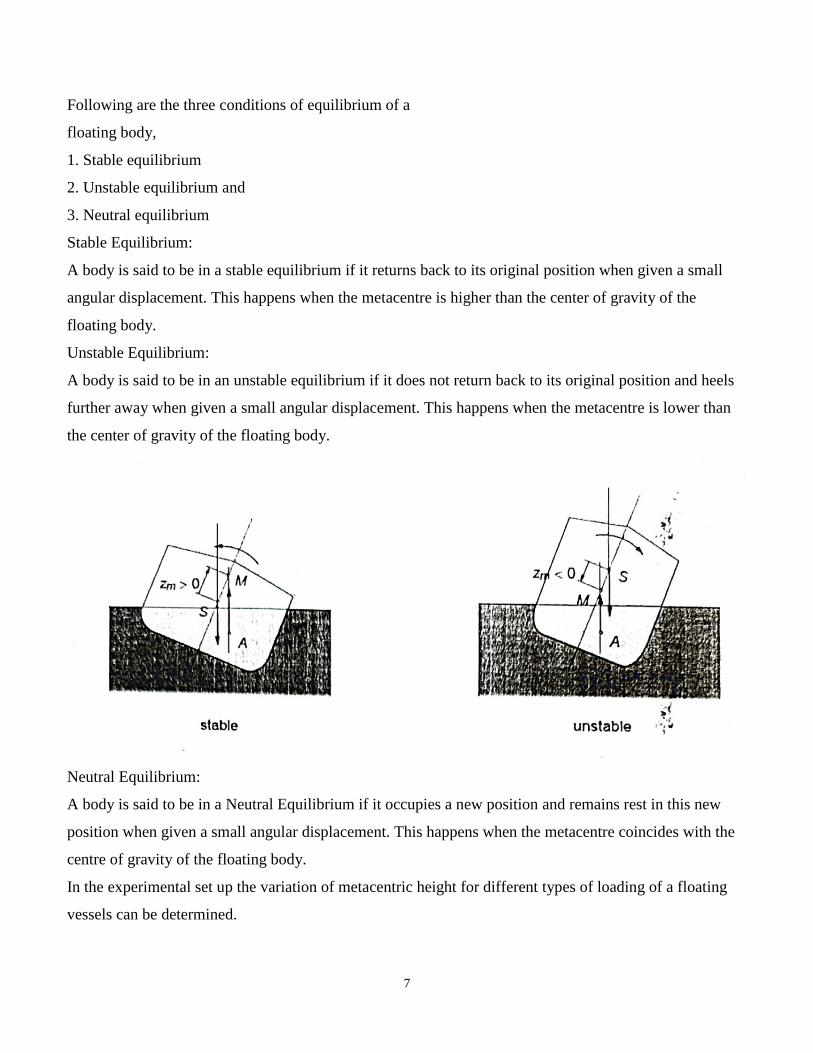
Following are the three conditions of equilibrium of a
floating body,
1. Stable equilibrium
2. Unstable equilibrium and
3. Neutral equilibrium
Stable Equilibrium:
A body is said to be in a stable equilibrium if it returns back to its original position when given a small
angular displacement. This happens when the metacentre is higher than the center of gravity of the
floating body.
Unstable Equilibrium:
A body is said to be in an unstable equilibrium if it does not return back to its original position and heels
further away when given a small angular displacement. This happens when the metacentre is lower than
the center of gravity of the floating body.
Neutral Equilibrium:
A body is said to be in a Neutral Equilibrium if it occupies a new position and remains rest in this new
position when given a small angular displacement. This happens when the metacentre coincides with the
centre of gravity of the floating body.
In the experimental set up the variation of metacentric height for different types of loading of a floating
vessels can be determined.

8
When a floating body is tilted through a small angle its centre of buoyancy will be shifted to a new
position the point of intersection of the vertical line drawn through the new centre of buoyancy and centre
of buoyancy is called metacentric height.
Experimental Setup
The experimental setup essentially consists of a pontoon and a water tank as a floating vessel. The
rectangular pontoon is tilted with a vertical sliding wight to permit adjustment of the height of the center
of gravity and a horizontal sliding weight to generate a defined as heeling moment. The sliding weights
can be fixed in position using knurled screws. The positions of the sliding weights and draught of the
pontoon can be read off scales. A heel indicator with scale in degrees is also provided.
Weight of the model (without horizontal and vertical weights = 1325g
Horizontal weight = 200g
Vertical weight = 500gm
Vertical height = 63mm
Experimental Procedure:
Calculation of center of gravity
The first step is to determine the position of the overall center of gravity xs, zs from the set position of the
sliding weights
The horizontal position is referenced to the center line:
xs = mh.x/(m+mv+mh)
where,
mh =. Vertical sliding mass
m = total mass (not including sliding mass)
x = distance of sliding weight from the center

9
The vertical position is referenced to the underside of the floating body.
Zs = (mvz+m+mhzg)/(m+mv+mh)
Zg = vertical center of gravity without the sliding weight
Zs = vertical center of gravity
Stability gradient
Dxs/dalpha = xs/alpha
Performance of the experiment:
Set horizontal sliding weight to position x = 8cm
Move vertical sliding weight to the bottom position
Fill the tank provided with water and insert the floating body
Gradually raise the vertical sliding weight and read off angle on heel indicator. Read off height of the
sliding weight at the top edge of the weight and enter in table together with angle
Position of sliding weight x = 8c,
Height of the
vertical
weight z
Angle \alpha
Horizontal position of center of gravity xs
Position of sliding weight x = 8c,
Height of the
vertical
weight z
Angle \alpha
Dxs/dalpha

10

11
Experiment 2. To verify the Bernoulli's equation experimentally.
Aim: To verify the Bernoulli’s theorem experimentally
Equipment: Inlet supply tank with overflow arrangement, outlet supply tank with means of varying flow
rate, perspex duct of varying cross section and a series of ;piezometric tubes installed along its length.
Introduction and theory: Considering frictionless flow along a variable area duct, the law of
conservation of energy states that for an inviscid, incompressible, irrational and steady flow along a
stream line the total energy (or head) remains the same. This is called Bernoulli’s equation.
The total head of flowing fluid consists of pressure head velocity head and elevation head, Hence.
2
2
221
12
1
22z
g
vpz
g
vp
Where P, V, and Z refer to the pressure, velocity and position of the liquid relative to some datum at any
section.
Experimental Setup: The experimental set up consist of a horizonal perspex duct of smooth variable
cross section of convergent and divergent tuype. The section is 40m x 40mm at the entrance and exit and

12
40mm x 20mm at middle. The total length of duct is 90cm. The piezometric pressure P at the locations of
pressure tappings is measured by means of 11 piezometer tubes installed at an equal distance of 7.5 cm
along the length of conduit. The duct is connected with supply tanks at its entrance and exit end with
means of varying the flow rate.
Experimental Procedure:
Note down the piezometers distance from inlet section of the perspex duct.
Note down the corss sectonal area of perspex duct at each of the piezometer tapping points.
The apparatus is levelled so that the datum head is treated as constant rthrough out the duct.
By maintaining suitable amount of steady head in the supply tanks, there establishes a steady non uniform
flow in the conduit. Time is allowed to stabilize the level in the tubes.
The discharge flowing in the conduit is recorded together with the water levels in each piezomerter tubes.
This procedure is repeated for other values of total head in the supply tank and for other discharges.
Observations:
If v is the velocity of flow at a particular section of the duct and Q is the discharge, then by continuity
equation.
V = Q/ area of section

13
Observation and Computation sheets:
Area of collecting tank =
Increase in depth of water =
Time =
Discharge =
Area at inlet section = 40x40mm., Exit = 40x 40mm , Mid Sectio= 40x20mm
Tube No. 1 2 3 4 5 6 7 8 9 10 11
Distance
From inlet
Section (cm)
Area of
C/s of
Conduit
A( 2cm )
Velocity
Of flow
(cm/sec)
V=(Q/A)
g
v2
2
(cm)
zp
(cm)

14
g
vz
p
2
2
(cm)
Graph to plot: Plot piezometric head (
p + Z), velocity head ( 2v / 2g), total head (g
vz
p
2
2
)
V/s distance if piezometric tubes from same reference point
Comment: Since the conduit is horizontal, the total energy at any section with reference to the center line
of the conduit is the sum of
p and g
v2
2
(here is the wt. Density of the fluid and g is the
acceleration due to gravity). One can compare the values of the total energy at different sections and
comment about the constancy of energy in converging the diverging conduit.
Precautions:
Apparatus should be in leveled condition.
Reading must be taken in steady or nearby steady conditions. And it should be noted that water level in
the inlet supply tank should reach the overflow condiiton.
There should not be any air bubble in the piezometers and in the perspex duct.
By closing the Regulating valve, open the control valve slightly such that the water level in the inlet
supply tank reaches the overflow conditions. At this stage check, that pressure head in each pie3zometer
tube is equal. If not adjust the piezometers to bring it equal.
15
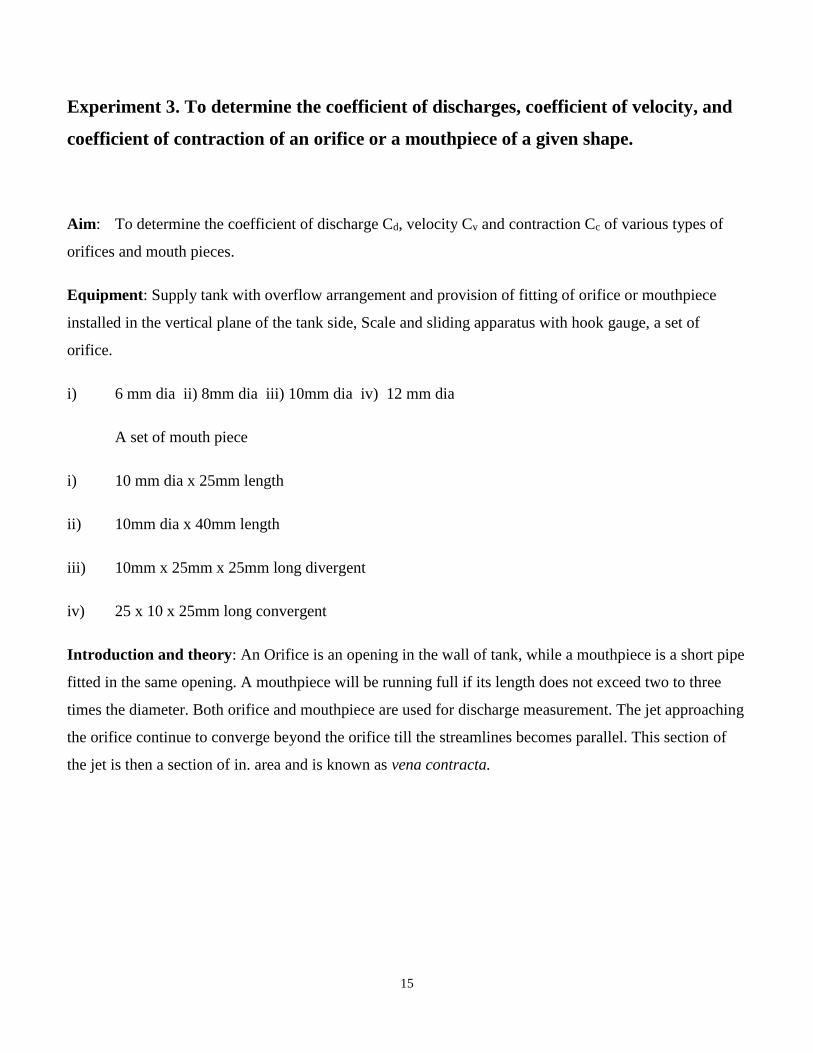
Experiment 3. To determine the coefficient of discharges, coefficient of velocity, and
coefficient of contraction of an orifice or a mouthpiece of a given shape.
Aim: To determine the coefficient of discharge Cd, velocity Cv and contraction Cc of various types of
orifices and mouth pieces.
Equipment: Supply tank with overflow arrangement and provision of fitting of orifice or mouthpiece
installed in the vertical plane of the tank side, Scale and sliding apparatus with hook gauge, a set of
orifice.
i) 6 mm dia ii) 8mm dia iii) 10mm dia iv) 12 mm dia
A set of mouth piece
i) 10 mm dia x 25mm length
ii) 10mm dia x 40mm length
iii) 10mm x 25mm x 25mm long divergent
iv) 25 x 10 x 25mm long convergent
Introduction and theory: An Orifice is an opening in the wall of tank, while a mouthpiece is a short pipe
fitted in the same opening. A mouthpiece will be running full if its length does not exceed two to three
times the diameter. Both orifice and mouthpiece are used for discharge measurement. The jet approaching
the orifice continue to converge beyond the orifice till the streamlines becomes parallel. This section of
the jet is then a section of in. area and is known as vena contracta.

16
If Vc is the true horizontal velocity at the vena contracta, then the properties of jet trajectory gives the
following relationship:
2
2.
2x
v
gy
c
2/12
2
y
gxvc where x and y are the coordinates of the jet trajectory at any point
The theoretical velocity in the plane of the vena contracta V0 is given by
hg
v
2
2
0
i.e., 2/1
0 )2( ghv
Now coefficient of velocity velocitylTheoritica
velocityactualCv

17
yh
xCv
2
In which h is the constant head in the supply tank and x and y are coordinates of jet with respect to
center of opening.
The actual discharge Q when divided by a √ 2gh yield the coefficient of discharge Cd. Here is the
area of cross section of the orifice ( or the mouthpiece) and g is the acceleration due to gravity.
Once Cd and Cv are known the coeficient of contraction Cc can be obtained by dividing Cd with Cv.
Cc = Cd / Cv
The coefficient of discharge can also be computed by falling head method in which the supply is
kept closed after filling the tank to a suitable level and fall in the head from h1 to h2 in time T is noted.
The coefficient of discharge is then obtained from
2/1
2
2/1
12.
2hh
gaT
ACd
Experimental Set Up: The experimental set up consist of a supply tank with over flow arrangement and
glass tube with gauge for water level measurement in the tank. There is also provision for fixing the
various orifices and mouthpieces (interchangeable) installed in the vertical plane of the tank side.
Arrangement is made such that the water passes only through this attached opening. Water comes out of
the opening in the form of jet.
A horizontal scale, on which is mounted a vertical scale with a hook gauge, is attached to the
supply tank. Thus hook gauge can be moved horizontally as well as vertically in x and y direction and its
corresponding movement can be read on horizontal and vertical scales respectively collecting tank used to
find the actual discharge of water through the jet.
Experimental procedure:
Note down the relevant dimensions as area of collecting tank and supply tank.

18
Attach a orifice/mouthpiece and note down its diameter. The apparatus is leveled.
The water supply was admitted to the supply tank and conditions allowed to steady to give a
constant head. The lowest point of the orifice/mouthpiece used as the datum for the measurement
of h and y.
The discharge flowing through the jet is recorded together with the water level in the supply tank.
A the orifice/mouthpiece used as the datum for the measurement of h and y.
The discharge flowing through the jet is recorded together with the water level in the supply tank.
A series of readings of dimensions x and y was taken along the trajectory of the jet.
The procedure is repeated by means of flow control value.
The procedure is repeated for other types of orfice/mouthpiece.
Observation and Computer Sheet:
Area of cross section of collecting tank =
Size and shape of the mouth piece/orifice =
Area of cross section of mouth piece/orifice. a =
Reading on the piezometer at the level on the centre of mouth piece/orifice ho =
Determination of Cd
S.No. Reading on the
Piezometer, h1
(cm)
Value of h
=(h1-h0)
Discharge Measurement
gha
QCd
2
Initial
(cm)
Final
(cm)
Time (s) Discharge, Q ,(
cm3/s)
Average Cd =
i) Determination of Cv
Reading of horizontal scale at exit of orifice mouthpiece , x0 =
Reading of vertical scale at exit of orifice/mouthpice y0 =
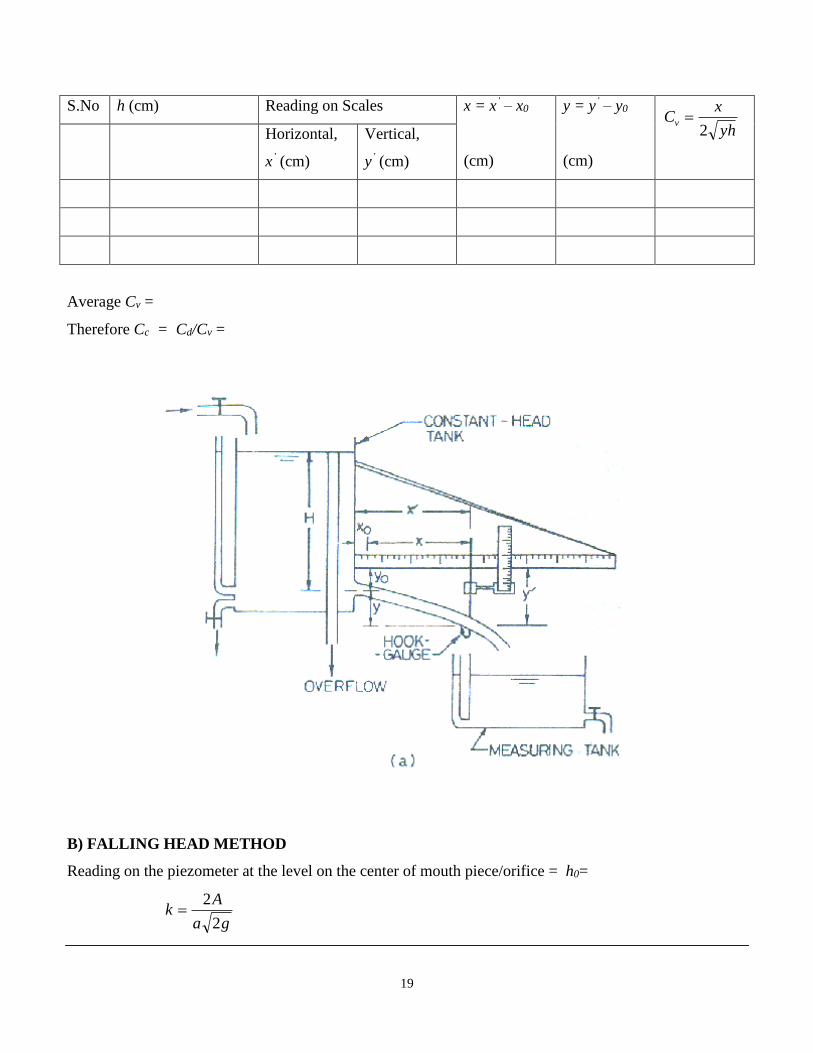
19
S.No h (cm) Reading on Scales x = x’ – x0
(cm)
y = y’ – y0
(cm)
yh
xCv
2
Horizontal,
x’ (cm)
Vertical,
y’ (cm)
Average Cv =
Therefore Cc = Cd/Cv =
B) FALLING HEAD METHOD
Reading on the piezometer at the level on the center of mouth piece/orifice = h0=
ga
Ak
2
2

20
S.No Piezometer Reading h1 = a1 – h0 h2 = a2 – h0 Time in
lowering the
water, T (s)
21 hhT
kCd
Initial a1
(cm)
Final a2
(cm)
Average value of Cd =

21
Experiment 4. To calibrate an orifice meter and to study the variation of coefficient
of discharge with Reynold's number.
Aim: To calibrate orifice meter by establishing the relationship between flowrate and pressure difference
and to find its coefficient of discharge.
Equipment: Venturi meter and orifice meter fitted in a horizontal pipeline with means of varying flow
rate, U tube differential manometer.
Introduction and theory: The venturi meter and orifice meter are devices used for measurement of rate
of flow of fluid through a pipe. The basis principle on which orifice meter work is that by reducing the
cross sectional area of flow passage, a pressure difference is created and the measurement of the pressure
difference enables the determination of the discharge through the pipe.
Orificemeter
An orifice meter is a cheap arrangement for measurement of discharge through pipes and its installation
requires a smaller length as compared with venturi meter.
An orifice meter consists of a flat circular plate with a circular hole called orifice which is concentric with
the pipe axis. The upstream face of the plate is beveled at an angle lying between 30 and 45. The plate is
clamped between the two pipe flanges with beveled surface facing downstream. The pressure taps are

22
provided, one on the upstream side of plate and other on the downstream side of the orifice plate. A
pressure difference exist between two sections which can be measured by connecting a differential
manometer to the two pressure taps. The discharge coefficient can be calculated using formula
2
0
2
1
10 2
aa
hgaCaQ
where C is coefficient of orifice, a is cross section area of orificde, a is cross sectional area of pipe, g is
the acceleration due to the gravity and ∆h is the difference of head in terms of water.
Experimental set up: The experimental set up consist of a circuit, through which the fluid is circulated
continuously having a an orifice meter, of 25mm dia and having d/D = .6. A regulating value is provided
on the downstream side of the circuit to regulate the flow. The orifice meter also have two pressure
tapings at upstream and downstream. A U tube differential manometer with common manifold is provided
to measure the pressure difference between two sections. A collecting tank is used to find the actual
discharge through the circuit.
Experimental procedure:
Note down the relevant dimensions as diameter of pipeline, throat dia of orifice. Area of collecting tank,
room temperature etc.
Pressure tapings of orifice meter are open, while of venturimeter (discussed in the next experiment) are
closed.
The flow rate was adjusted to its maximum value.
By maintaining suitable amount of steady flow in the pipe circuit, there establishes a steady non uniform
flow in the conduit. Time is allowed to stabilize the levels in the manometer tube.
The discharge flowing in the circuit is recorded together with the water level in left and right limbs of
manometer tube. The flow rate is reduced in stages by means of flow control valve and the discharge and
readings of manometer are recorded.
This procedure is repeated by closing the pressure tapings of orifice meter.
Observation and computation sheet.
ORIFICEMETER

23
Diameter of main pipe line D = 25mm
The ratio d/D = 0.6
Area of cross section of throat section, a0 = , d = 15mm
Area of cross section of inlet section , a1 =
Area of collecting tank =
S.N
o.
Discharge Measurement Manometer Reading
ghaa
aaQC
210
2
0
2
1
Reynolds
Number
Re
(DVrho/m
u)
Initi
al
(cm)
Fin
al(c
m)
Tim
e(s)
Discha
rge, Q
(cm3/s)
Velocit
y, Q/A
Left
Limb,
h1 (cm)
Right
Limb,
h2 (cm)
Diff. of
head in
terms of
water,∆h =
12.6(h1-h2)
Average C
Graph to plot :
a. Plot a graph between Q and h on a log log graph paper
b. Plot a graph between Cd v/s Re

24
Experiment 5. To calibrate a Venturimeter and to study the variation of coefficient of
discharge with Reynold's Number.
Aim: To calibrate venturi meter by establishing the relationship between flow rate and pressure difference
and to find its coefficient of discharge.
Equipment: Venturi meter fitted in a horizontal pipe line with means of varying flow rate, U tube
differential manometer.
Introduction and theory: The venturi meter meter are devices used for measurement of rate of flow of
fluid through a pipe. The basis principle on which a venturi meter and orifice meter work is that by
reducing the cross sectional area of flow passage, a pressure difference is created and the measurement of
the pressure difference enables the determination of the discharge through the pipe.
A venturi meter consists of (I) an inlet section followed by convergent cone (2) a cylindrical throat and (3)
a gradually divergent cone. Since the cross sectional are of the throat is smaller than the cross sectional
area of the inlet section, the velocity of flow
at the throat will become greater than that at the inlet section, according to continuity equation. The
increase in the velocity of flow at the throat result in the decrease in the pressure at this section. A
pressure difference is created between the inlet section and throat section which can be determined by

25
connecting a differential U-tube manometer between the pressure taps provided at these sections. The
measurement of pressure difference between these sections enables the rate of flow of fluid (Q) to be
calculated as
2)(1
2
Aa
hgaCQ d
where a is the area of cross section of throat. A is the area of cross section of inlet section, g is the
acceleration due to the gravity. ∆h is the difference of head and Cd is the coefficient of discharge of
venturi meter.
.
Experimental set up: The experimental set up consist of a circuit, through which the fluid is circulated
continuously having a venturi meter, of 25mm dia and having d/D = .6. A regulating value is provided on
the downstream side of the circuit to regulate the flow. The venturi meter is provided with two tapings
one each at upstream and at the throat section.. A U tube differential manometer with common manifold
is provided to measure the pressure difference between two sections. A collecting tank is used to find the
actual discharge through the circuit.
Experimental procedure:
Note down the relevant dimensions as diameter of pipeline, throat dia of venturimeter. Area of collecting
tank, room temperature etc.
Pressure tapings of orifice meter are open while of venturimeter are closed.
The flow rate was adjusted to its maximum value.
By maintaining suitable amount of steady flow in the pipe circuit, there establishes a steady non uniform
flow in the conduit. Time is allowed to stabilize the levels in the manometer tube.
The discharge flowing in the circuit is recorded together with the water level in left and right limbs of
manometer tube. The flow rate is reduced in stages by means of flow control valve and the discharge and
readings of manometer are recorded.
This procedure is repeated by closing the pressure tapings of for opening of venturimeter.

26
Observation and computation sheet
VENTURIMETER:
Diameter of main pipe line D = 25mm
The ratio d/D = 0.6
Area of cross section of throat section, a = d = 15mm
Area of cross section of inlet section , A =
Area of collecting tank =
S.N
o.
Discharge Measurement Manometer Reading
gha
AaQCd
2
)/(1 2
Reynolds
Number
Re
(DVrho/
mu)
Initi
al
(cm)
Fin
al(c
m)
Tim
e(s)
Discha
rge, Q
(cm3/s)
Velocit
y, Q/A
Left
Limb,
h1 (cm)
Right
Limb,
h2 (cm)
Diff. of
head in
terms of
water,∆h
=
12.6(h1-
h2)
Average Cd =
Graph to plot :
a. Plot a graph between Q and h on a log log graph paper
b. Plot a graph between Cd v/s Re

27
Comment:

28
Experiment 6. To calibrate sharp crested rectangular and triangular weirs/notches.
AIM: Determination of discharge coefficients of
i) 30o V – notch
ii) 60o V – notch
iii Rectangular notch
Equipment: A constant steady water supply tank ( notch tank) with baffle walls, pointer gauge,
collecting tank, models
i) 30o v – noth
ii) 60o v –noth
iii) Rectangular notch
Introduction and Theory:
Different type of models are available to find discharge in an open channel as notch, venturiflume,
weir etc. For calibration of either rectangular notch or V notch some flow is allowed in the flume.
Once the flow becomes steady and uniform, discharge coefficients can be determined for any
model.
In general, sharp crested notches are preferred where highly accurate discharge measurements are
required, for example in hydraulic laboratories, industry and irrigation pilot schemes which do no
carry debris and sedimetns.
Notches are those overflow structures whose length of crest in the direction of flow is accurately
shaped. They may be rectangular, trapezoidal, V notch etc. The V- notch is one of the most
precise discharge measuring devices suitable for a wide range of flow. The relationship between
discharge and head over the weir can be developed by making the following assumptions as to the
flow behavior.

29
a) Upstream of the weir, the flow is uniform and the pressure varies with depth according to
the hydrostatic equation P = ρgh
b) The free surface remains horizontal as far as the plane of the weir, and all particles passing
over the weir move horizontally.
c) The pressure through out the sheet of liquid or nappe, which passes over the crest of the
weir, is atmospheric.
d) The effect of viscosity and surface tension are negligible.
e) The velocity in the approach channel is negligible.
A triangular or V notch is having a triangular or V shaped opening provided in its body so
that water is discharged through this opening only. The line which bisects the angle of the
notch should be vertical and at the same distance both sides of the channel. The discharge
coefficient Cd of a V notch may be determined by applying formula
2tan2
15
8 2/5 Hg
QCd
where Q is the discharge over a triangular notch, θ is the apex angle of notch, H is the head over
the crest of the notch.
A rectangular notch, symmetrically located in a vertical thin plate which is placed perpendicular to
the sides and bottom of a straight channel, is defined as a rectangular sharp crested weir. The
discharge coefficient Cd of a rectangular notch may be determined by applying formula
2/32
3
2BHg
QCd
where Q is the discharge over a rectangular notch, B is the width of notch, H is the head over the
crest of the notch, and g is acceleration due to gravity,.
Experimental Set up: The experimental set up consist of tank whose inlet section is provided
with 2 nos. of baffles for stream line flow. While at the downstream portion of the tank one can fix

30
a notch of either rectangular notch or v-notch. A pointer gauge is used to measure the head of
water over the model. A collecting tank is used to find the actual discharge through the notch.
Experimental Procedure:
The notch under test was positioned at the end of the tank, in a vertical plane, and with the sharp
edge on the upstream side. The tank was filled with water up to the crest level and subsequently
note down the crest level of the notch by the help of a pointer gauge.
The flow regulating value was adjusted to give the max. possible discharge without flooding the
notch. Conditions were allowed to steady before the rate of discharge and head H were recorded.
The flow rate is reduced in stages and the readings of discharge and H were taken.
The procedures is repeated for other type of notch.
Details of Experimental set-up for V-Notch

31
Details of Experimental set-up for Rectangular -Notch
Observation and Computation sheet:
a) Triangular or V notch
b) Aapex angle of notch , θ =
c) Crest level of notch H1 =
d) Area of collecting tank, a =
S.No Discharge Measurement Final
reading of
W.L. above
the notch,
H2
Head over
Notch, H
= H1 – H2
2tan2
15
8 2/5 Hg
QCd
Initial ,
h1 (cm)
Final, h2
(cm)
Vol.
Coll.
(cm3)
Discharge
Q = Vol/ t

32
Average Cd =
b) Rectangular notch
Width of notch, B =
Crest levelof notch H1=
Area of collecting tank, a =
S.No Discharge Measurement Final
reading of
W.L. above
the notch,
H2
Head over
Notch, H
= H1 – H2
2/323
2BHg
QCd
Initial ,
h1 (cm)
Final, h2
(cm)
Vol.
Coll.
(cm3)
Discharge
Q = Vol/ t
Experiment 7. To verify momentum equation experimentally.
AIM: 1. To verify the momentum equation experimentally.
2. Comparison of change in force exerted due to shape of the vane for different targets.
Equipment: Collecting tank, transparent cylinder, nozzle of 10 mm dia. Flat vane, curved hemispherical
vane and pressure gauge.

33
Introduction and Theory: Momentum equation is based on Newton’s second law of motion which
states that the algebraic sum of external forces applied to control volume of fluid in any direction is equal
to the rate of change of momentum in that direction. The external forces include the components of the
weight of the fluid and of the forces exerted externally upon the boundary surface of the control volume.
If a vertical water jet moving with velocity v is made to strike a targety, which is free to move in
the vertical direction, then a force will be exerted on the target by the3 impact of jet. According to
momentum equation this force ( which is also equal to the force required to bring back the target in its
original position) must be equal to the rate of change of momentum of the jet flow in that direction.
Applying momentum equation in x direction
]cos1[
]cos.[
][ ..
QvF
vvQ
vvQF
x
inxoutxx

34
For flat plate , 90
QvFx
For hemispherical cup, 180
QvFx 2
Here is the mass density, Q the discharge through the nozzle, v the velocity at the exit of the nozzle
(i.e., Q/a) and a is the area of cross section of the nozzle.
Therefore a
QFX
2
While for curved hemispherical vane the force is
a
QFX
22

35
Experimental set up: The experimental set up primarily consists of a nozzle through which a water jet
imerges vertically in such a way that it may be conveniently observed through the transparent cylinder. It
strikes the target vane positioned above it. The force applied on the vane by jet can be measured by
applying weight to counteract the reaction of the jet. Vanes are interchangeable i.e. flat, inclined or
curved vane.
Arrangement is made for the movement of the plate under the action of the jet and also because of the wt.
Placed on the loading pan. A scale is provided for carrying the vanes to its original position i.e. as before
the jet strikes the vane. A collecting tank is used to find the actual discharge and velocity through the
nozzle.
Experimental procedure:
Note down the relevant dimension as area of collecting tank, mass density of water and dia. Of nozzle.
The flat plate is installed
When jet is not running, note down the position of upper disc.
The water supply is admitted to the nozzle and the flow rate adjusted to its max. value.
As the jet strieks the vane, position of upper disc is changed. Now place the wts. To bring back the upper
disc to its original position.
At this position find out the discharge as well as note down the wts. Placed on the upper disc.
The procedure is repeated for each value of flow rate by reducing the water supply in steps.
The procedure is repeated with the installation of inclined or curved vane in the apparatus.
CURVED HEMISPHERICAL VANE
When jet is not running, position of upper disc =
------------------------------------------------------------------------------------------------------------Run Discharge
measurement Balancing Theoretical Error in %
No Initial Final Time Discharge Mass Force Force F
(cm) (cm) (sec) sec/3cm W F a
Q22
F
FF
(gm) (dyne) (dyne)
Comment: The main source of error in the experiment is in assessing the exit velocity component. Also
hemispherical cup require more force to balance than the flat plate.

36
Precautions:
Apparatus should be in leveled condition.
Reading must be taken in steady or near by steady conditions by watching the pressure gauge.
Discharge must be varied very gradually from a higher to smaller value.
Observation and computation sheet:
Dia of nozzle = 10mm
Mass density of water =
Area of collecting tank =
Area of nozzle a=
Horizontal flat plate
When jet is not running, position of upper disc is at =
Run Discharge measurement Balancing Theoretical Eoor in %
No Initial Final Time Discharge Mass Force Force F
(cm) (cm) (sec) sec/3cm W F a
Q2
F
FF
(gm) (dyne) (dyne)