Embed Size (px)
Citation preview

8/7/2019 impact on rural folks
http://slidepdf.com/reader/full/impact-on-rural-folks 1/30
Amir Ullah Khan and M R Saluja 1
Abstract
This paper looks at theNational Rural Employment Guarantee Programme (NREGP) in India that
was launched in the year 2005 as a social security measure aimed at providing employment security
to the poor in villages. The NREG was also meant to use this labour to construct rural infrastructure
that is clearly wanting in India. The National Rural Employment Guarantee Act guarantees 100 days
of work to all households. This analysis looks at the direct and the indirect effects that the NREGP
has on employment generation and poverty reduction in a local. For this, a detailed survey in a
specific village was undertaken to highlight the impact of the NREGP. This survey covered a poor
agricultural village with 400 households, nearly 2500 people. The survey recorded income and
expenditure levels by type of household (large, small and marginal farmers, agricultural labour,
services etc). The survey also recorded production activities undertaken by the inhabitants.
The data was then used to build a Social Accounting Matrix. A SAM is as an organized matrix
representation of all transactions and transfers between production activities, factors of production
and institutions within the economy with respect to the rest of the world. Each row of the SAM gives
receipts of an account while the column gives the expenditure. The total for each row is equal to the
total of each corresponding column. The wages paid under NREGP in this village amounted to Rs
582000 leading to an iincreased output of Rs 452219. The Value added increases by Rs 226577, the
additional household income generated was Rs 196823. The multipliers that were obtained showed
that Public Distribution Systems (PDS) services have multiplier of 2.08 followed by maize with 1.80
and wheat with 1.79. The sectors where we see maximum impact are wheat, animal husbandry, ……
and education and the maximum impact on the household incomes accrues to the small cultivator
followed by the labour household and then the large farmer households.
1 Amir Ullah Khan and M R Saluja work at the India Development Foundation in Delhi, India. This paper acknowledges the research assistance provided by Bhupesh Yadav and Vikas Singh of IDF.
1

8/7/2019 impact on rural folks
http://slidepdf.com/reader/full/impact-on-rural-folks 2/30

8/7/2019 impact on rural folks
http://slidepdf.com/reader/full/impact-on-rural-folks 3/30
political and economic front, the Indian economy recorded an impressive growth rate of 5.7 per cent
per annum on an average for the more than 2 decades. In the post reform period, the economy
shown a secular growth path of more than 6 per cent on an average, with growth rates in the last few
years being upwards of 7.5 per cent per annum. For the fiscal year 2006-07, GDP growth
country is expected to be more than 8 per cent. As Goldman Sachs puts it, “India has the potential to
deliver the fastest growth over the next 50 years…..”
What characterises rural India
Rural India is at the centre-stage of all growth in the future. However it continues to suff
from lack of basic infrastructure. Caught in the vicious poverty-cycle, rural India, in absence
adequate infrastructure, rural India finds it difficult to undertake activities that can accelerate
economic growth. Home to close to 69 per cent of India’s total population, rural India face
daunting task of providing sustainable income and employment opportunities to a major section of the
population, especially the lower-income households. In absence of infrastructure facilities, there is
lack of market-access to rural population, slow growth in organised retail and thus, limited livelihood
opportunities, stagnation in agriculture and aggravation of rural poverty-levels. Absence of
infrastructure also makes rural markets fragmented, characterised by high costs of transactions a
high information asymmetry. The retail sector offers unprecedented opportunities for rural India, and
the only thing that can hold this sector back is the lack of infrastructure.
Two-thirds of India’s consumers live in rural areas and a little more than half the national
income is generated here. Therefore it is not surprising that that rural markets form an important part
of the Indian market. In more than 630000 villages, there are almost twice as many 'lower middle
income' households in rural areas as in the urban areas. At the highest income level there are 2.3
million urban households as against 1.6 million households in rural areas. Middle and high-income
households in rural India are expected to grow from 80 million to 111 million by 2008. In urban India,
the same is expected to grow from 46 million to 59 million. The size of the rural market therefore2
will soon be more than double the size of the urban market.
In the modern world where technology is tradable and factor markets (labour and capita
have become integrated both locally (farm labour moves from Bihar to Punjab) and globally (through
foreign direct investment), infrastructure plays an enabling role in bringing world markets to lo
areas. Since infrastructure enables growth, any growth strategy must actively plan for producing the
necessary infrastructure to support growth targets. Indeed, instead of trying to engineer growth
Estimates from the National Council of Applied Economic Research2
3

8/7/2019 impact on rural folks
http://slidepdf.com/reader/full/impact-on-rural-folks 4/30
through interventions in the production of goods and services, governments are better off providing
for the infrastructure that supports such growth.
Numerous studies the world over have revealed that investments in rural infrastructure is one
of the most potent tools that governments can use to enhance growth and reduce poverty
areas. Investments in roads, tele-communications, power supply, drinking water facilities, schools and
health care facilities have a positive effect on the quality of life in rural areas. However, there
been stagnation in the level of public investment in rural infrastructure in India, as well as in most
developing countries. Even post-reforms, in the period of 1993-94 to 2002-03, there has been
decline not only in the share of budgetary expenditure on all rural development and poverty
alleviation programmes from 2.08 to 1.87 per cent, but also the share of rural infrastructure
development in all social services and poverty alleviation programmes has declined from 32 per cent
to 25 per cent.3
The decline in public investment in rural infrastructure development has been on account of
the fact that total government expenditure has been curtailed due to the ‘structural adjustment
programmes’, and also due to the low priority attached to rural infrastructure by most governments in
developing countries (Fan et al. 2000). In absence of complementary and supporting infrastruc
from the government, even private investments in infrastructure in rural India have also not
taken-off.4
Source: Das Keshab (2001), ‘Endowments and Rural Infrastructure: Issues Today’, India Infrastructure Report:3
Issues in Regulation and Market Structure, Oxford University Press, New Delhi4 Source: Fan, Shenggen, Peter Hezell and S. K. Thorat (2000), ‘Impact of Public Expenditure on Rural Povertyin India’, Economic and Political Weekly, Volume 35, No. 40.
4

8/7/2019 impact on rural folks
http://slidepdf.com/reader/full/impact-on-rural-folks 5/30
The Agricultural sector in India
India’s reforms concentrated on industry and services, while the sectors that have been left
untouched are agriculture, land, labour and retail. Leading the pack of problems that have been
unsolved is, ironically, the sector where a bulk of population resides. The rural sector in Ind
completely sidelined by the reform process. In India, rural is synonymous with agricultural an
therefore, with the exception of a few issues that are non agricultural, the rural tragedy is indeed the
agricultural tragedy. In the twentieth century, agricultural growth stagnated as a result of a series of
droughts and famine. The Green Revolution in the 1960s raised productivity levels on the one hand,
but was rather harshly criticized for widening income disparities between rich and poor farmers on the
other. The late 1960s and early 1970s witnessed a modernized agriculture with new equipment and
farm technology. New fertilizers led to high yielding varieties, tractors replaced cattle and the
immediate result was that the production of crops such as wheat and rice increased remarkably. But
growth was far from uniform.
In this context, it is important to take a look at some of the critical areas of concern where the
farmer and agriculture growth are concerned. Firstly, it is important to focus on the skewed nature of
agriculture production in India. Despite oft-repeated declarations of intent on the importance of crop
diversification, the agriculture sector is heavily dependent on food grains. The relationship between
foodgrains and food security is so strong that effectively nothing is done towards diversification. As
food crops suffer because of monsoons and prices, the economy suffers. On the other hand stocks pile
up and lead to some embarrassment for the policy maker. Productivity levels continue to st
putting greater pressure on land and other resources. Intensive agriculture gives way to an extensiveroute and yields do not show any growth.
Secondly, there is a need to look at the rural employment scenario, an issue much neglected
so far. The pattern of employment as it has emerged is indeed a cause of concern. In 1951, 70 per cent
of the total work force was engaged in agriculture and has dropped to 54 per cent. The proportion of
laborers increased for 20 to 27 per cent and cultivators declined from 50 to 32 percent. However these
figures pale in comparison to the developed world. In Australia, 6 per cent and in France, only 7 per
cent of the work force is engaged in agriculture. In the US and UK, the percentages are 3 and 2 per
cent respectively. Even in Egypt, the work force in agriculture is less than 35 per cent. Third is the
disturbing trend in exports. Indian Agriculture, according to Tenth Plan estimates, contributes only
14.7% to total export earnings. What is worse is that almost all of this is due to export of
goods and very little produce is processed. Even within this, there is a predominance of just five or six
crops namely, tea, rice, oilseeds, tobacco, spices and sugar. If overall export growth rate should be
5

8/7/2019 impact on rural folks
http://slidepdf.com/reader/full/impact-on-rural-folks 6/30
taken to the target of 25 per cent a year, it is imperative that agriculture exports are increased and that
processed food replaces primary farm commodities in the export basket.
However, these are but three of a large number of issues that confront any student
agriculture sector. The number of problems is large and has been extensively discussed. Ris
mitigation, credit availability, warehousing, infrastructure, marketing support, information issues,
irrigation needs, extension services, quality of seeds, rural industrialization, harsh regulation,
movement controls and many others continue to haunt the farmer. What is important here is to realize
that growth in agriculture and access to markets for the small farmer is critical if the agriculture sector
is to grow. Further, this is crucial if the overall targeted growth rate of 10 per cent is to be sustained.
That is why the importance of looking at growth rates and the small farmer. Given this context, the
importance of freeing up Agriculture and the need for markets, both domestic and foreign, cannot be
neglected any more. The growth rate needs to be sustained and given the pervasive role of agriculture,
it is axiomatic that reforms in the agriculture sector are imperative. Input subsidies leading to misuse
and over use, support prices causing market distortions and the absence of market information
some of the urgent reform issues that need to be tackled. Therefore, if one were to look at what needs
to be done, is simply the enabling and integration of agriculture markets. The farmer deser
same access that industry has been bestowed with. Granting to the farmer small mercies like markets
across state boundaries, export markets, access to information, bank credit, freedom to install
machinery including cold storages, warehouses and processing plans, would go a long way i
modernising the sector and helping it grow.
Does access to infrastructure matter?
There is a wealth of literature in economics that debates the role of infrastructure in economic
growth, and tries to establish the precedence of one over the other. Kessides (1993), the World Bank
(1994, 2001), Canning and Bennathan (1999), and Jalan and Ravollion (2002) have all demonstrated
through rigorous theoretical, statistical and econometric modelling the role played by infrastructure in
poverty reduction. Kessides, in her paper ‘The Contributions of Infrastructure to Economic
Development – A Review of Experience and Policy Implications’ , highlights that infrastructure
contributes to economic growth, both through demand and supply channels. It reduces the co
production, contributes to the diversification of the economy, provides access to application of
modern technology and raises the economic returns to labour and capital. Infrastructure contributes to
raising the quality of life by creating amenities, and provides consumption goods. She, howev
argues that infrastructure does not create economic potential, but only develops it where appropriate
conditions (inputs like labour and capital) exist.
6

8/7/2019 impact on rural folks
http://slidepdf.com/reader/full/impact-on-rural-folks 7/30
Canning and Bennathan (2000)argue that a conducive macro-economic environment is5
essential for efficient resource allocation to reap the positive impacts of infrastructure development.
An orientation to economic demand considerations like services prices and user charges is essential as
the most enduring benefit of infrastructure is the reliability and quality of the services demanded by
the users. User charges should reflect supply and demand conditions, and non-market externalities as
far as possible, to ensure that infrastructure is more economically efficient and environmentally
favourable. Canning and Bennathan, however, posit that physical infrastructure investment is a form
of ‘complementary capital ’ that supports services necessary for the operation of productive private
capital.
Jalan and Ravollion (2002)have attempted to establish a direct link between infrastructure6
and economic growth through extensive studies in rural China. As per their estimates, every 1 per cent
increase in the road density per capita, the private consumption expenditure increases by 0.08 per cent
in rural China. Similarly, poor households living in communes with paved roads have a high
probability of escaping poverty than households living in communes without paved roads. The paper
also highlights the importance of rural infrastructure such as public assets like roads in low
transaction costs and improving incomes to farmers in rural China by providing market access.
The World Development R eport 1994 titled ‘Infrastructure and Development ’ stressed the
importance of efficient utilisation of infrastructure facilities. While in most underdeveloped and
developing regions, it is important to increase the existing stock of infrastructure facilities, the
should also be a focus on improving the effective utilisation of infrastructure facilities. Take
instance, irrigation infrastructure. On the one hand, it is important to invest in expanding the network
of irrigation facilities and bring more area under irrigation cover. On the other hand, it is
important to improve the utilisation rate of the existing irrigation facilities. The effectiveness o
infrastructure is significantly dependent on its quality at the time of inception, as well as how well it is
maintained over time.
Finally, there is the question of measuring infrastructure. While there do exist many
infrastructure indices in India like theAKC Index , theC MIE Index and theIndia Today Index , each7
of these indices have some inherent contradictions. Take for instance, the CMIE Index. It is unable to
capture an essential ingredient of such an index. Consider two districts with similar population size
and the same number of schools, hospitals, road length, etc. In one all the infrastructure facilities are
Source: Canning D. and Bennathan E. (2000), ‘The Social Rate of Return on Infrastructure Investments’,5
Policy Research Working Paper Series, World Bank.
Source: Jalan J. and M. Ravollion (2002), ‘Geographic Poverty Traps? A Micro Model of Consumption6
Growth in Rural China’, Journal of Applied Econometrics.7 Source: Measuring Inter-state Differentials in Infrastructure – T. C. A. Anant (Centre for Development
Economics, Delhi School of Economics), K. L. Krishna (Centre for Development Economics, Delhi School of Economics) and Uma Roy Choudhary (National Institute of Public Finance and Policy)
7

8/7/2019 impact on rural folks
http://slidepdf.com/reader/full/impact-on-rural-folks 8/30
in and around the district headquarters (town) while in the other, they are more dispersed across the
villages. For most of the CMIE variables that make up their index, the two districts will be judged to
be similar. This is because the CMIE index normalizes every infrastructure variable they use by the
size of the population. However, as one has learnt from Kerala, it is more important to un
disperse facilities rather than have them concentrated in one place. Indeed, the former Indian
President’s call for the provision of urban amenities in rural areas is of great significance
regard.
Also, just the presence or absence of an infrastructure measure is not sufficient. Apart from
availability of the resource, the accessibility of the resource is also of paramount importance. None of
the infrastructure indices we currently have takes this into account in a systematic fashion.
instance, for proper development planning at the district level, one needs to know at what distance is
the infrastructure facility available to the people. Are primary schools situated in such a way that they
are accessible to all the children in the district? Is a primary school in the village, or w
reasonably accessible range of the village? Is it at a walk-able distance? If not, are bus
available?
Education
In India, almost 66.5 per cent villages have pre-primary schools within the village (table 1).
72 per cent villages have primary schools within the village. However, 88.5 per cent villages h
primary schools within a radius of 2 kms from the village. 84 per cent villages have middle schools
within a radius of 5 kms from the village. As far as higher education is concerned, most villages do
not have access to college facilities. As per the data, 73 per cent of villages have colleges at a distance
of more than 10 kms. Since the exact distance (how much more from 10 kms) is not known, we take
these villages as having no access to college facilities. Similarly, 91 per cent villages and 79 per cent
villages do not have access to any industrial training institutes and vocational training centres
respectively.
Much of the unemployment problem in India can be understood from the above figure
While there is an access to primary and middle schools in most villages in the country, there is hardly
any access to vocational training and industrial training centres. In absence of such training centres,
most rural people are not able to get training to become ‘skilled’ labour. In absence of proper skilling,
these people find it difficult to seek gainful employment, and end-up working as unskilled labour in
the unorganised, informal sector, or as agriculture labour in the farm-sector of the economy.
Increasing the access to ‘employment-oriented’ skilling institutions is the first step towards increasing
employment opportunities for the rural workforce.
8

8/7/2019 impact on rural folks
http://slidepdf.com/reader/full/impact-on-rural-folks 9/30
Health
As far as access to health infrastructure is concerned, the scenario is not very encouraging.
While basic healthcare facilities like an integrated child development centre (anganwadi or balwadi)
exists within the village in around 55 per cent villages in the country, higher order healthcare facilities
are not accessible to a vast majority of villages. For instance, for more than 55 per cent villages
government hospital is more than 10 kms away from the village. In case of private hospitals, m
than 61 per cent villages do not have any access to such facilities. However, 79 per cent villages in the
country have private doctors/clinics within a distance of 10 kms from the village. Infact, around 56
per cent villages have private clinics within a manageable distance of less than 5 kms from the village.
While only 6.5 per cent villages have a primary health centre within the village, more than 20 per cent
villages have private clinics in the village. Thus, much as we would like to deny, majority
healthcare delivery in rural areas is through private doctors and clinics.
In absence of robust public healthcare system in India, the cost of healthcare facilities is also
higher for the poor (usually in rural areas, or urban slums) as compared to the rich (usually in urban
areas). For instance, a comparison between Dharavi (a slum in Mumbai) and Warden Road (an up-
market suburb of Mumbai) shows a vast disparity in the cost of healthcare services for the poor (slum-
dwellers). While diarrhoea medication in Warden Road costs on an average USD 2, it costs around8
USD 20 in Dharavi. Thus, there is a poverty-premium in Dharavi equivalent to 10-times the cost of
the service in Warden Road. Clearly, the cost of health services is higher for the poor than the rich.
Similarly, there exists a disparity in the cost and quality of health services in rural areas as
compared to urban areas – the rural people have to spend a larger proportion of their i
health services as compared to urban people. As per the estimates of the National Commission
Macro-economics and Health (2005), the proportion of total outpatient expenditure in total household
expenditure is 4.72 per cent in rural areas as compared to 3.62 per cent in urban areas
proportion of total inpatient and outpatient expenditure in total household expenditure is 6.09 per cent
for rural areas as compared to 5.06 per cent in urban areas. Thus, despite the ‘supposed’ government
subsidies on rural healthcare, the rural people spend a larger proportion of their household incomes on
medical expenses as compared to the urban people. The relatively widespread presence of p
clinics and private doctors (at times even quacks) as compared to public healthcare services
primary health centres have led to serious cost (and quality) implications for the rural peop
especially the poor.
8 Source: Prahalad C.K., and Hammond Allen, ‘Serving the world’s poor, profitably’, Harvard Business Review,September 2002.
9
8/7/2019 impact on rural folks
http://slidepdf.com/reader/full/impact-on-rural-folks 10/30
Market access
With respect to infrastructure facilities for market access, around 45 per cent of all villages in
India have metalled roads in the village, and around 80 per cent villages have metalled roads within a
radius of 5 kms. 57 per cent villages are connected through all-weather roads, and around 70 per cent
villages have all-weather roads within a radius of 2 kms. 71 per cent villages have a bus-stop within a
manageable distance of less than 5 kms from the village. Connectivity through railways, however, is
not present for most villages as close to 75 per cent of villages in India do not have
stations within a radius of 10 kms.
The postal service in India has covered the length and breadth of the country, and
section of the rural population has access to communication services through post offices. Almost 80
per cent of villages in the country have postal facilities available within a radius of 5 kms. There has
been a substantial improvement in tele-communications infrastructure in the country as well. In
short-span of a decade and a half, the network of telephone facilities has expanded to rural areas. As
per the data, in 2002 around 60 per cent villages had access to telephone facilities within a distance of
5 kms. This has also opened-up opportunities of providing internet connectivity through telepho
lines to the rural population as the telephone booths can be converted into internet kiosks.
Many corporations in India, both in the public and the private sector, are looking to expand
the reach of mobile and internet services to rural India. However, despite the giant strides
growth of tele-communication infrastructure in rural India, there still needs to be substantial
investment as more and more villages are required to be brought under the ambit of
telecommunication services as even a distance of 5 kms may be quite high for availing such services
as these services are such whose usage-frequency is high. It may not be very cost-effective for
rural household to travel 5 kms to make a phone-call. By making these services accessible right in the
village, there shall be an upward spiral in the consumption of such services by the rural
However, only 20 per cent villages have telecommunication facilities available in the village, and thus
quite a daunting task lies ahead for telecom firms in providing greater access to such services in rural
areas.
Banking facilities are present within the villages in only 6.5 per cent villages in the country.
Another 12 per cent villages have banking services available at a distance of less than 2 kms from the
village. Around 34 per cent villages have banking services available within a radius of more than 2
but less than 5 kms. Thus, despite the rapid developments made in extension of banking
infrastructure, a large proportion of villages in the country do not have access to banking services. It is
in this context that the micro-finance movement through self-help groups gains importance in
bridging the gap between the formal banking systems and the rural demand for credit.
10

8/7/2019 impact on rural folks
http://slidepdf.com/reader/full/impact-on-rural-folks 11/30

8/7/2019 impact on rural folks
http://slidepdf.com/reader/full/impact-on-rural-folks 12/30
1989: Jawahar rozgar yojana: The NREP and RLEGP were merged in April 1989 under the Jawahar
Rozgar Yojana (JRY). The JRY was meant to generate meaningful employment opportunities for the
unemployed and underemployed in rural areas through the creation of economic infrastructure
community and social assets.
1993: Employment assurance scheme: The Employment Assurance Scheme (EAS) was launched on
2 October 1993 covering 1,778 drought-prone, desert and tribal and hill area blocks. It was
extended to all the blocks in 1997-98. The EAS was designed to provide employment in the form of
manual work in the lean agricultural season.
1999: Jawahar gram samridhi yojana: The JRY was revamped from 1 April 1999 as the Jawahar
Gram Samridhi Yojana (JGSY). It now became a programme for the creation of rural econo
infrastructure with employment generation as a secondary objective. The Programme is implemented
by the village panchayats and provides for specific benefits to SC/STs, the disabled and th
maintenance of community assets created in the past.
2001: Sampoorna grameen rozgar yojana: The Sampoorna Grameen Rozgar Yojana (SGRY) was
launched on 25 September, 2001 by merging the on-going schemes of EAS and the JGSY with the
objective of providing additional wage employment and food security, alongside creation of durable
community assets in rural areas. The Programme is self-targeting in nature with provisions for special
emphasis on women, scheduled castes, scheduled tribes and parents of children withdrawn fro
hazardous occupations. The works taken up under the Programme are labour-intensive and the
workers are paid the minimum wages notified by the states. Payment of wages is done partly in cash
and partly in kind – 5 kg of food grains and the balance in cash. The Centre and the states share the
cost of the cash component of the scheme in the ratio of 75:25
2004: National food for work programme: The Food for Work Programme was started in 2000-01
as a component of the EAS in eight notified drought-affected states of Chhattisgarh, Gujarat,
Himachal Pradesh, Madhya Pradesh, Orissa, Rajasthan, Maharashtra and Uttaranchal. The
Programme aims at augmenting food security through wage employment. Food grains are supplied to
states free of cost. This programme is now subsumed under the NREGP.
Implementation of NREGA
NREGA was launched across 200 districts in February 2006. The Act was extended to 130
districts from April 2007. An amount of Rs 11500 crore was allocated by the Union Government for
12

8/7/2019 impact on rural folks
http://slidepdf.com/reader/full/impact-on-rural-folks 13/30
implementation during 2006-2007. The 27 states could spend only about Rs 8800 crore. The
allocation is non-lapsable. Rs 12000 crore was allocated by the Union Government for 2007-2008.
The central Government provides 90 per cent of the fund and the rest is provided by the states. More
than Rs 15000 crore is available for the current fiscal. Centre will have to provide additio
allocation if there is additional demand as NREGA is an Act not a scheme.
Table 1: NREGA in a nutshell – 2006-7*
No of households demanded jobs 2.11 crore
No of households provided jobs 2.10 crore
Total Number of persondays generated 90 crore
Average persondays per family 42.85
Total works taken up 8.3 lakhs
Completed works 3.8 lakhs
Ongoing or Incomplete works 4.5 lakhs
Table 2: NREGA at nutshell: 2007-8 (till December 2007)*
No of households demanded jobs 2.48 crore
No of households provided jobs 2.43 crore
Total Number of persondays generated 78.03 crore
Average persondays per family 28.75
Total works taken up 11.68 lakhs
Completed works 3.36 lakhs
Ongoing or Incomplete works 8.31 lakhs
Table 3: Top five states in terms of spending till April 2007
S No. State Districts under Expenditure (Rs.
NREGA (Nos.) Crore)
1 Andhra Pradesh 19 districts 544
2 Rajasthan 12 districts 770
3 Madhya Pradesh 31districts 361
* Source: www.nrega.nic.in
13

8/7/2019 impact on rural folks
http://slidepdf.com/reader/full/impact-on-rural-folks 14/30
4 Chhattisgarh 15 districts 349
5 Jharkhand 22 districts 270
Source: www.nrega.nic.in
Graph 1: Job Cards Issued as % to Rural Household (2006-07)
250
200
150
100
50
0
STATES
Job cards issued as a percentage of rural household may be reflective of the initial enthusiasm of the
state administration towards the NREGA. Almost one-third of the states have issued job cards to 100
percent or more of the rural households.
14

8/7/2019 impact on rural folks
http://slidepdf.com/reader/full/impact-on-rural-folks 15/30
Graph 2: Demand For Employment as % of Estimated Rural BPL Famili es (2006-
07)
1400
1200
1000
800
600
400
200
0
STATES
Demand for employment, as a percentage of rural families below poverty line is high in the north east
states, Jammu and Kashmir and Rajasthan where as it is low in Bihar, Maharashtra, Orissa
Pradesh and West Bengal.
15
8/7/2019 impact on rural folks
http://slidepdf.com/reader/full/impact-on-rural-folks 16/30
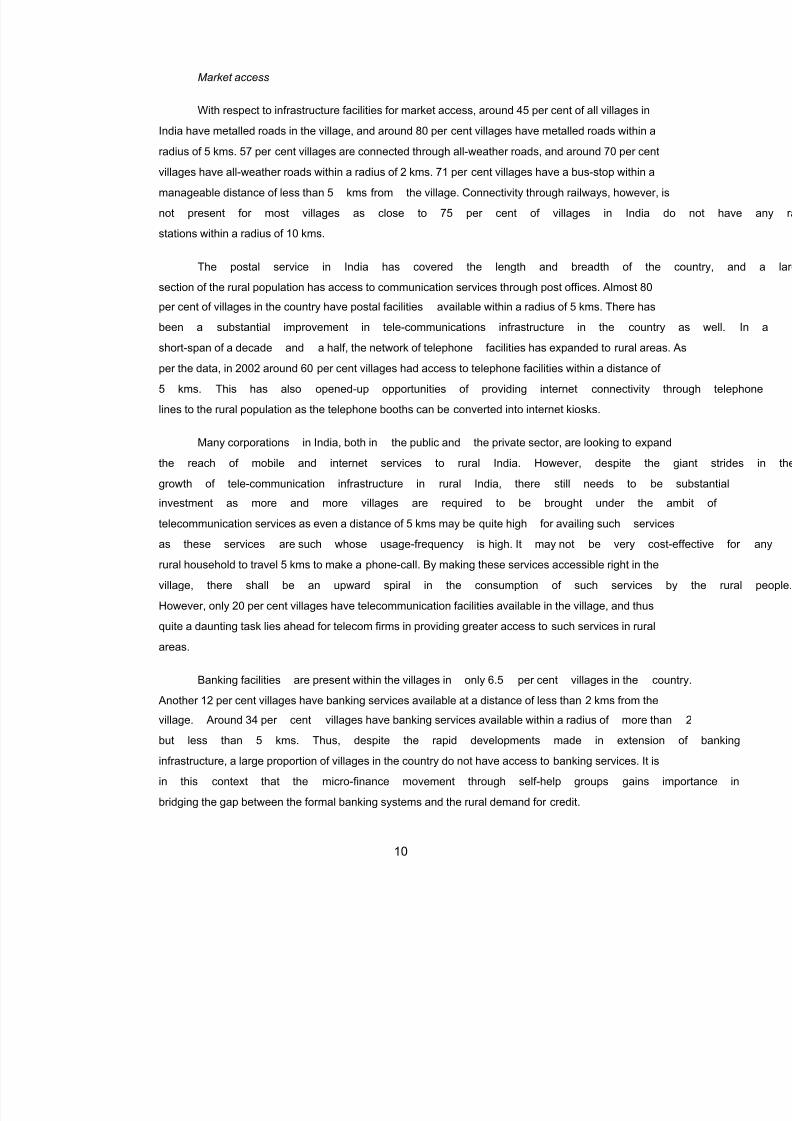
Graph 3: Works/Activ ities 2006-07
2 % 1 0 % 4 %2 2%
1 0 %
52 %
Rur alCo nnecti vi ty Wat er Con servat i o n and W ater Harves ti ng Dr ought P r oofi ng
F l ood Cont rol and P rot ecti on Land Deve l o pme nt A ny oth er act i vi ty A pprov ed by M RD
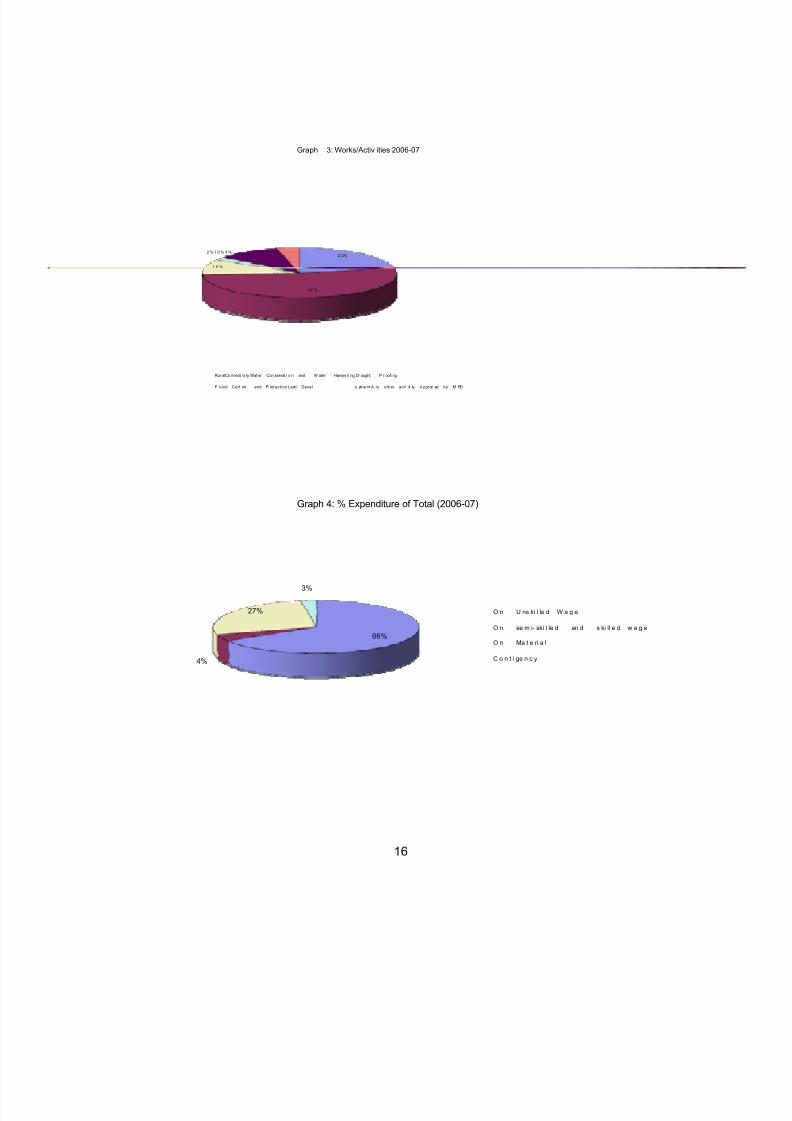
Graph 4: % Expenditure of Total (2006-07)
3%
27% O n U ns ki l le d W a g e
O n se m i- ski l le d an d s ki ll e d w a g e
66%O n Ma t e ri a l
C o n t i ge n c y4%
16

8/7/2019 impact on rural folks
http://slidepdf.com/reader/full/impact-on-rural-folks 17/30
Of the total expenditure maximum amount has been spend on unskilled wage. Second bigge
spending is on material. For the financial year 2007-08 until August 2007, a graphical summary has
been provided. The trends are similar to 2006-07.
Graph 5: Job Cards Issued as % of Rural Household (2007-08)
250
200
150
Job Cards Issued as % of Rural
Household
100
50
0
STATES
17

8/7/2019 impact on rural folks
http://slidepdf.com/reader/full/impact-on-rural-folks 18/30
Graph 6: Demand For Employment as % of Estimated Rural BPL Fami lies (200 7-08)
1600
1400
1200
1000
Demand For Employment as % of 800
Estimated Rural BPL Families
600
400
200
0
STATES
Graph 7: Works/Activities 2007-08
15%12% 5%
2% Rural Connec tivity
Water Conservation and Water Harves ting10%
Drought Proofing
Flood Control and Protection
Land Development
Any other activity Approved by MRD
56%
18

8/7/2019 impact on rural folks
http://slidepdf.com/reader/full/impact-on-rural-folks 19/30
Graph 8: % Expendi ture of Total (2007-08)
19% 1%
1% On Unskilled Wage
On semi-skilled and s killed w age
On Material
Contigenc y
79%
Table 5: Projected Expenditure for all 595 districts classified as rural districts
Districts Projected Expenditure (@minimum wage Rs 58 for 100 days)
For all rural For projected no of households based on
household (Rs. Crore) 2006-07 (Rs. Crore)
595 79750 36540
Conclusion
Trends from the States
The village survey confirms most of the evidence already gathered. Most people do not access
the scheme, as they have not heard of the programme. They would like a more proactive role of the
panchayat in deciding the infrastructure to be constructed. Almost everyone wants more work form
the scheme and better facilities at the work place. There is enough evidence of fudging a
mismanagement of records. Large number of works relating to water conservation has been taken up.
Tamil Nadu and Rajasthan report large women participation in the scheme. Andhra Pradesh, Gujarat
and Tamil Nadu have conducted work, time and motion studies and accordingly wages have
19

8/7/2019 impact on rural folks
http://slidepdf.com/reader/full/impact-on-rural-folks 20/30
fixed. Karnataka has copied Andhra Pradesh model but rest of the states continue to pay wages based
on old irrigation department norms.
Faulty measurement of work results in lower payment of wages. Minimum wages are still not
paid in many states. Distress migration has been partially affected due to NREGA in Andhra Pradesh.
Implementation is yet to pick up in Uttar Pradesh and Bihar. Lots of money is being spent i
construction for rural connectivity in Bihar and UP. The impact of monsoon rains on these
needs to be assessed. Uttar Pradesh (39 districts / Rs 76 crore) and Bihar (37 districts / Rs 32 crore)
are slow in NREGA implementation. Due to inbuilt transparency norms, beneficiaries are receiving
wages but delay in payment remains a key issue. Allegation of tampering of muster roll is rampant.
Maintenance of structures created under NREGA is still not thought about. Gram Panchayats share a
higher work load. (64 per cent of the works are implemented by Panchayat against a norm of 50 per
cent). The Ministry for Rural Development estimate that NREGA would require around Rs 20,000
crore annually, to cover all the 595 districts in the country which are classified as rural. The amount
allocated to NREGA for 2006-07 was Rs 11,300 crore (200 districts) and Rs 12,000 crore for 2007-08
(330 districts). A quick calculation shows that a total amount of Rupees 36,500 crore may be needed
for the implementation of the project over the entire country.
Policy recommendations from the village SAM and the NREGA study
•The study makes the point that a programme like the NREG has far reaching implications and
should be evaluated in its entirety. It has large socio economic implications atht any simple
evaluation would not capture.
•The study recommends that the National Rural Employment Guarantee Act be continued.
•It should also be extended to all parts of the country.
•It is also recommended that the works under NREGA be expanded or better still completely
decentralised so that the panchayats are free to decide on local priorities.
•The wage calculation is indeed problematic as it uses old norms. Work measurement is also
something that must be standardised as this could lead to harassment, underpaid workers and
therefore problems in implementation.
•Delays in wage payments go against the Act but there is evidence of such delay already and
needs to be done away with.
•The 100 hour cap per household is also a policy decision that needs a review.
•The implementation of the Act has now thrown up issues of leakage and corruption and this
needs to be plugged by making the implementation truly decentralised and based on
selection by wage earners.
20

8/7/2019 impact on rural folks
http://slidepdf.com/reader/full/impact-on-rural-folks 21/30
•The original objective of the Act was to arrest rural urban migration. This needs to be studied,
for it should indeed have helped cut down on distress migration.
•The impact of monsoons and rains on infrastructure like roads and check dams needs to be
studied too to enable a more sustainable asset development.
•Maintenance of structures that are built with NREAG money is another aspect that has been
ignored and could fritter away the benefits.
•There is also a hunch that food processing sectors would get benefitted by NREGA activity
and this would result in greater up stream activity. This too needs to be studied a
resultant policy issues looked at as this sector is among the most regulated of industries i
India.
•A large number of people also have not heard of the Act and the programme. Wider
dissemination is required especially among the more vulnerable areas in the north east
Jammu and Kashmir where the demand seems to be high.
•However, an impact assessment of the kind done for one village should be replicated across
states as the indication is that the demand for NREGA work is different for different states. A
repeat survey of the same village after one year would also enable estimation over time.
•The impact of the NREGA on rising input costs by way of higher wages to be paid
agriculture labour also needs to be studied as this becomes a political constituency against the
Act.
•There is also a feeling that as cash transfers increase disposable incomes, village economies
tend to get inflationary and this might provoke resentment. The inflation effect, the need to
integrate markets so inflation does not occur and the time lag for equilibrium effects to show
up need to be studied.
21

8/7/2019 impact on rural folks
http://slidepdf.com/reader/full/impact-on-rural-folks 22/30
References
1. Ahluwalia, I.J.(1991), “Productivity and Growth in Indian Manufacturing”, Oxford University
Press, Oxford.
2. Ahluwalia, Montek (2000), “Economic Performance of States in Post Reforms Period”, Economic
and Political Weekly, May, pp 1637-1648.
3. Bhat, R; 1996; “Regulation of the Private Health Sector in India”, International Journal of Health
Planning and Management, 11:253-74
4. Brahmananda, PR and VR Panchamukhi (ed), The Development Process of the Indian Economy,
Delhi, Himalaya Publishing Company.
5. Canning D. and Bennathan E.(2000), ‘The Social Rate of Return on Infrastructure Investments’,
Policy Research Working Paper Series, World Bank.
6. Das Keshab(2001), ‘Endowments and Rural Infrastructure: Issues Today’, India Infrastructure
Report: Issues in Regulation and Market Structure, Oxford University Press, New Delhi
7. Dollar, David and Aart Kraay, 2001,“Growth is Good for the Poor”, World Bank Policy
Research Working Paper 2587, April.
8. Edwards, S.(1989a), Openness, Trade Liberalization and Economic Performance in Developing
Countries, Working Paper No. 2908, NBER, Cambridge Mass.
9. Fan, Shenggen, Peter Hezell and S. K. Thorat (2000), ‘Impact of Public Expenditure on Rural
Poverty in India’, Economic and Political Weekly, Volume 35, No. 40.
10. Government of India(2000), Report of the Finance Commission, Ministry of Finance,
Government of India.
11. Government of India(2001), Approach to Tenth Five Year Plan, Planning Commission, New
Delhi.
12. Jalan J. and M. Ravollion (2002), ‘Geographic Poverty Traps? A Micro Model of Consumption
Growth in Rural China’, Journal of Applied Econometrics.
13. Joshi, V. and I.M.D. Little(1994), India's Economic Reforms 1991-2001, Oxford
14. Kurian, N. J. (1999), “State Government Finances”, Economic and Political Weekly, May, pp
1115 – 1125.
15. Mills, A; “The Economics of Health in Developing Countries”. Oxford University Press, Oxford,
1983.
16. National Sample Survey (NSS),58 Round, Report 487, Central Statistical Organisation,th
Government of India, New Delhi.
17. Prahalad, C. K. and Stuart L. Hart (2002), “The Fortune at the Bottom of the Pyramid”,
http://www.strategy-business.com/media/pdf/02106.pdf
18. Samuelson, P; Nordhaus,W; “Economics”, Tata-McGraw-Hill Edition, 1998
19. Sen Amartya K.(1999), “Development as Freedom”, Oxford, Oxford University Press.
22

8/7/2019 impact on rural folks
http://slidepdf.com/reader/full/impact-on-rural-folks 23/30

8/7/2019 impact on rural folks
http://slidepdf.com/reader/full/impact-on-rural-folks 24/30
37. Coady, D., and E. Skoufias. 2004.On the targeting and redistributive efficiencies of alternative
transfer instruments. Review of Income and Wealth 50 (1): 11–27.
38. Coady, David, Margaret Grosh, and John Hoddinott, 2004.Targeting outcomes redux. World
Bank Research Observer 19 (1): 61–85.
39. Cowell, F. 1995.Measuring inequality. 2nd ed. Englewood Cliffs, N.J.: Prentice-Hall.
40. Deaton, A. 1997. The analysis of household surveys. Baltimore, Md.: Johns Hopkins University
Press.
41. de Melo, Jaime, and S. Robinson. 1989.Product differentiation and the treatment of foreign trade
in computable general equilibrium models of small economies. Journal of International
Economics 27: 47–67.
42. Diamond, P., and J. Mirrlees. 1971.Optimal taxation and public production, I: Production
efficiency, and II: Tax Rules. American Economic Review 61: 8–27 and 261–278.
43. Diamond, P., and J. Mirrlees. 1975.Private constant returns and public shadow prices. Review of
Economic Studies 43: 41–47.
44. Drèze, J., and N. Stern. 1987.The theory of cost-benefit analysis. In Handbook of public
economics, ed. A. Auerbach and M. Feldstein, Amsterdam: North-Holland.
45. Drèze, J., and N. Stern. 1990.Policy reform, shadow prices and market prices. Journal of Public
Economics 42: 1–45.
46. Feldstein, M. 1974.Distributional equity and the optimal structure of public prices. American
Economic Review 63: 32–36
47. Harris, R. 1999.The distributional impacts of macroeconomic shocks in Mexico: Threshold
effects in a multi-region CGE Model. Trade and Macroeconomics Division Discussion Paper No.
44.Washington, D.C.: International Food Policy Research Institute.
48. Kakwani, N. 1980. Income inequality and poverty: Methods of estimating and policy applications.
Oxford: Oxford University Press.
49. Mellor, J., and R. Ahmed, eds. 1988.Agricultural price policy for developing countries.
Baltimore, Md.: Johns Hopkins University Press.
50. Morley, S. and D. Coady. 2003.From social assistance to social development: A review of
targeted education subsidies in developing countries. Center for Global Development and
International Food Policy Research Institute, Washington, D.C.
51. Myles, G. 1995.Public economics. Cambridge, UK: Cambridge University Press.
52. Newbery, D., and N. Stern, eds. 1987.The theory of taxation for developing countries. Oxford:
Clarendon Press.
53. Pyatt, Graham, and J. Round. 1985.Social accounting matrices: A basis for planning.
Washington, D.C.: World Bank.
54. Ravallion, M. 1993.Poverty comparisons: A guide to concepts and methods. LSMS Working
Paper 88. Washington, D.C.: World Bank.
24

8/7/2019 impact on rural folks
http://slidepdf.com/reader/full/impact-on-rural-folks 25/30
55. Robinson, S., A. Cattaneo, and Moataz El-Said. 1998.Estimating a social accounting matrix using
entropy methods. Trade and Macroeconomics Division, Discussion Paper No. 33. Washington,
D.C.: International Food Policy Research Institute.
56. Skoufias, Emmanuel. 2001.PROGRESA and its impacts on the human capital and welfare of
households in rural Mexico: A synthesis of the results of an evaluation by IFPRI. Washington,
D.C.: International Food Policy Research Institute.
57. World Bank. 1997.World Development Report 1997: The State in a Changing World.
Washington, D.C.: World Bank.
http://indiabudget.nic.in/es2006-07/chapt2007/chap103.pdf 58. (visited on 27th September,
2007)
http://rural.nic.in/rajaswa.pdf 59. (visited on 27th September, 2007)
http://nrega.nic.in/Nrega_guidelinesEng.pdf 60. (visited on 27th September, 2007)
25

8/7/2019 impact on rural folks
http://slidepdf.com/reader/full/impact-on-rural-folks 26/30
61. Appendix
National Rural Employment Guarantee Act 2005 (NREGA)
Objective
NREGA is designed as a safety net to reduce migration by rural poor households in the lean perio
through at least a hundred days of guaranteed unskilled manual labour provided on demand to each
household, at minimum wages prescribed by respective states. It is also expected to enhance people’s
livelihoods on a sustained basis, by developing the economic and social infrastructure in rural areas.
Works focused on water conservation, land development and drought proofing are to be take
under the Act.
Registration for Employment
The adult member of every house hold who resides in rural area and is willing to do unskilled manual
work, may apply for registration of household for issuance of Job Card (Schedule 2(1) of the Act).
Employment in the scheme
Employment must be provided to all applicants within 15 days of receipt of an application and within
a radius of 5 km from their place of residence. In case employment can not be provided withi
days of receipt of the application the applicant shall be entitled to a daily unemployment allowance
(Schedule 7(1) of the Act).
Unemployment allowances Rates
The unemployment allowance rate for the first thirty days shall not be less than one-fourth
wage rate. For the remaining period of the financial year the unemployment allowance rate should not
be less than one-half of the wage rates. In the event of any delay in the payment of unemployment
allowance, the recipients shall be entitled to compensation based on the same principles as
compensation under the Payment of Wages Act, 1936. Compensation costs shall be borne by the State
Government.
Minimum Wage
26

8/7/2019 impact on rural folks
http://slidepdf.com/reader/full/impact-on-rural-folks 27/30
Minimum wages for the state shall be such that a person working for 7 hours would normally earn a
wage equal to the wage rate. Minimum wages are to be fixed by the state Government under section 3
of the minimum wage Act, 1948 until the time, the wage rate is fixed by the Central Government.
However the minimum wages shall not be at a rate less than sixty rupees per day.
Type of works under the scheme
As per Schedule 1 of the Act, the focus of the Rural Employment Guarantee Scheme shall be on the
following works:
•Water conservation and Water harvesting
•Drought proofing (Afforestation and tree plantation)
•Irrigation canals
•Provision of irrigation facility to land owned by SC/ST/beneficiaries under Indira Aawas
Yojana*
•Renovation of traditional water bodies
•Desilting of tanks
•Land development
•Flood control and protection works including drainage in water logged areas
•Rural connectivity to provide all weather access
•Other works notified by the Central/State Government
Application for work
At the Gram Panchayat level application for work is to be submitted to the Sarpanch of the G
Panchayat. The application can also be submitted to the Programme Officer. The Sarpanch of Gram
Panchayat and the Programme Officer shall be bound to accept the valid applications and to issue a
dated receipt to the applicant.
Employment Card
As per Schedule 2(1) of the Act, the Gram Panchayat will issue a job card after registration free
cost to each applicant household. The job card will contain the details of adult members of household
such as names, age, address and photographs. Registration will be made for five years and may be
renewed from time to time.
* The IAY was launched in 1997-98. The basic objective of the scheme is to help construction of new dwelling units as well
as conversion of unserviceable kutcha houses into pacca/semi pacca houses to the marginalised sections of the society who
are living below the poverty line by extending them grants-in-aid.
27

8/7/2019 impact on rural folks
http://slidepdf.com/reader/full/impact-on-rural-folks 28/30
Availability of employment
Under the Act, employment shall be provided within a radius of 5 km from the residence
applicant (Schedule 2(12) of the Act). If employment is provided outside 5 km it must be provided
within the Block with 10 % extra wage to meet additional transportation and living expense
(Schedule 2(14) of the Act). Applicants are to be intimated by written letter and a public notice shall
be displayed at the office of Gram Panchayat and Programme Officer (Schedule 2(11) of the Act)
Priority shall be given to women and in such a way that at least one third of the beneficiaries shall be
women (Schedule 2(6) of the Act).
Facilities at work site
Worksite facilities are to be provided by the implementing agency (Schedule 2(27) of the Act). These
include
•Safe drinking water
•Shade for children and periods of rest for workers
•First-aid Box for emergency treatment and minor injuries
•Safety equipments and measures for health hazards connected with work
To look after the women workers’ children below the age of six years, one woman worker shall be
deputed for every five such children. The deputed woman shall be paid wage rate (Schedule 2(29) of
the Act).
Serious accidents at work site
If any person employed under the scheme or a child accompanying any such person is injured he/she
shall be entitled to free of charge medical treatment which shall include accommodation, treatment
and medicines (Schedule 2(24) of the Act). During the period of hospitalization of injured worker half
of the minimum wage per day is to be paid for his upkeep (Schedule 2(25) of the Act). If a person
employed under a scheme dies or becomes permanently disabled by the accident at site the legal heirsof the deceased or the disabled shall be paid an ex gratia payment at the rate of Rs.
Central government.
Wage payment
28

8/7/2019 impact on rural folks
http://slidepdf.com/reader/full/impact-on-rural-folks 29/30
The wage under the scheme may be paid either wholly in cash or in cash and kind. But at least one
fourth of the wages shall be paid in cash only. All payment of wages in cash and the unemployment
allowance shall be made to recipients in the presence of eminent persons of the community on
announced dates (Schedule 23(4) of the Act). The disbursement of daily wages shall be done
weekly basis or in any case not later than a fort night specified under the scheme (Schedule 3(3) of the
Act). In case of delay of wage payments labourers shall be entitled to receive payment o
compensation as per the provisions of payment of wages Act, 1936.
Implementing Agencies
The Gram Panchayat shall be responsible for identification of projects in the Gram Panchayat area
and prepare a development plan as recommended by Gram Sabha and Ward Sabha (Schedule (16(1)
of the Act). The Gram Panchayat shall maintain a list of possible works to be taken up as and when
demand for work arises. It is also responsible for the execution and supervision of such works. The
other implementing agencies can be Intermediate and District Panchayat, line departments of t
Government, Public Sector Undertakings of the Central and State Governments, Cooperative
Societies with a majority shareholding by the Central and State Governments, and reputed N
having a proven track record of performance. Self-Help Groups may also be considered as possible
implementing agencies.
Sanctions and allotment of works
The Gram Panchayat shall forward its proposals in the order of priority to the Project Offi
approval. The Programme Officer must be someone not below the rank of BDO at block
(Schedule 15(1) of the Act). The Programme Officer shall allot at least 50 percent of works in terms
of cost, to be implemented through Gram Panchayat. The Programme Officer shall supply each Gram
Panchayat with muster rolls for the works and a list of employment opportunities (Schedule16 (4, 5
and 6) of the Act).
Provision of Social Audit
The Gram Panchayat shall make available all relevant documents; muster rolls, bills, vouchers
sanction orders and other books of accounts and papers to the Gram Sabha for the purpose of so
Audit (Schedule 17(3) of the Act).
Ban on Contractors and Machines
29

8/7/2019 impact on rural folks
http://slidepdf.com/reader/full/impact-on-rural-folks 30/30
Machines and Contractors are banned. The Scheme shall not permit engaging any contractor
implementation of the project under this scheme (Schedule 1(11) of the Act). Works under
scheme shall be performed by using manual labour and not by machines (Schedule 1(12) of the Act).
Grievance Redressal Mechanism
The State Government shall make rules and regulations to deal with any complaint at Block and the
District level (Schedule 1(19) of the Act). If any dispute or complaint arises under the scheme against
the Gram Panchayat the matter shall be referred to Programme Officer (Schedule 23(5) of the Act).
The PO shall enter every complaint in a complaint register and shall dispose the disputes and
complaints within 7 days of its receipt (Schedule 23(6) of the Act). Appeal against the Programme
Officer will be to the District Programme Coordinator. Appeal against the District Programme
Coordinator may be with an appropriate authority designated by the State Government.
30