Embed Size (px)
Citation preview

IMPACT OF WTO ON INDIAN AGRICULTURE
Contemporary Concern Study
AUGUST 27, 2017 PGP
IIM BANGALORE
Abhinav Mishra 1611004
Anshul Agrawal 1611006
Report Submitted to Professor Dr. Rupa Chanda
1
1 CONTENTS
2 Background ..................................................................................................................................... 2
3 Events Timeline ............................................................................................................................... 2
4 Indian Agriculture ........................................................................................................................... 3
5 Challenges with Agreement on Agriculture (AoA) Perspective of developing countries ............... 4
5.1 Design Issues ........................................................................................................................... 5
5.2 Implementation Issues ............................................................................................................ 5
5.2.1 Market Access: ................................................................................................................ 5
5.2.2 Domestic Support and Export Subsidies ......................................................................... 6
5.3 Impact of AoA on India ........................................................................................................... 6
6 Model Framework to forecast the required subsidy support ........................................................ 8
7 Conclusion ..................................................................................................................................... 12
8 Appendix ....................................................................................................................................... 13
9 References .................................................................................................................................... 15

2
2 BACKGROUND
In the 1980s, the highly protectionist agri-business in industrial countries fueled by the agricultural
export subsidies were dumping surplus production and was thus distorting the world markets. There
was a need to negotiate a new set of multilateral trade agreements. As the Uruguay Round concluded
in December 1993, the WTO designed an Agreement on Agriculture to minimize the distortion and
maximize the agricultural trade across multiple nations. It was aimed to utilize the food surplus
effectively and minimize both the extremes - food dumping and hunger. It was intended to make the
agricultural markets more accessible to the farmers around the world by cutting down on tariffs,
reducing domestic support and eliminating export subsidies. The act was ratified in Morocco next year
and was implemented from January 1, 1995. The agreement called for reduction commitments by both
developed and developing countries over a fixed deadline(Year 2000-Developed and Year 2004-
Developing), whereas LDCs-Least developed countries were exempted. There was a special and
differential treatment clause to address the concerns raised by developing countries. However, the
implementation did not turn out to be a fair deal for the developing nations. Although Developed
countries were asked to reduce the tariffs by 36% in 6 years as compared to 24% for developing
countries in 10 years, the former was starting from a soaring high level as compared to latter. Instead
of an equal trading market which was proposed, the lopsided Agreement on agriculture was drifting
developing nations in an unjust state. Worst affected by this development were the farmers with small
landholdings and peasants with their income dependent on agriculture from developing countries since
their products can now be substituted with cheaper imports. Industrialized economies were able to
protect their producers with the existing support whereas the relatively behind-markets of developing
nations were opened for trade liberalization.
3 EVENTS TIMELINE
In Mar 2003, countries missed the deadline to decide the formula for reduction along the three pillars
of AoA. WTO Reports in 20031 argued that the agricultural subsidies in the developed countries are not
meant for poor and vulnerable farmers rather to top corporations in the agribusiness. Further, for the
developed countries, a large chunk of reduction in subsidy was attained through transferring prohibited
(Amber) subsidies to Permitted (Green and Blue Box) subsidies.
The Fourth Ministerial conference in Doha, 2001 introduced the Doha Development agenda to address
the disagreements in agriculture. The member countries were divided into two factions: developed
nations led by EU, US, Canada and Japan and the developing countries led by India, China, Brazil and
South Africa. Till 2008, multiple attempts were made (2004 - Geneva, 2006 - Hong Kong), but no
compromise was reached between the two sides on issues in agreement on agriculture. A G-33 group
led by India submitted a proposal to WTO for exemption of the 10% subsidy support ceiling in
requirement for their food security programs. The Bali package was rolled in December 2013 to address
a portion of the Doha round but the implementation was further postponed due to varied views on the
food security and public stockholding between the WTO and Developing countries. Finally, a
temporary arrangement was agreed upon in the form of a 'Peace Clause' providing time to resolve the
existing disagreement. The peace clause which concludes in 2017 provided a temporary protection to
the developed countries from breaching the subsidy limits for the food security programs. There have
been studies (Sharma, 2016), (Rashmi Banga, 2015), (Pal, 2001) etc. which argue that India has been
able to be within the de minims level till now. However, going forward the trends in minimum support
1 WTO Annual Report 2003, page 22

3
price, increasing procurement level and widening food security requirements will restrict the policy
space for India in the coming years. Nirmala Sitharaman, the current commerce minister in her latest
meeting with the director general WTO (July 20, 2017) has stressed that the outcome of the eleventh
ministerial conference must find a stable resolve to the problem of food security obligations and public
stockholding of grains.
4 INDIAN AGRICULTURE
Agriculture is the foundation of the Indian economy. India stands at number two across the world in
agricultural produce. More than half of the population is dependent on the rural economy as the source
of employment. Agriculture activities contributes around 17.3% of the GVA (Gross value added) during
2016-17. Landholdings are scattered, smaller in size (Almost 3/4th of the landholdings are less than 2
hectare). Resources of irrigation are limited with only 35% of the total agricultural land under irrigation.
Inputs for production are lesser developed. Hence the crop yield is low. (Yield of Rice is almost one
third of the United States). These low income small landholding farmers with limited irrigation facilities
and relatively less developed inputs of production(power, fertilizer, seeds) require government support.
In the past, Indian agriculture policy has been to keep the food prices low for the end consumers and
incentivize production by providing domestic support and subsidies. This agricultural policy has been
successful for India. India turned from a food deficit country to a food surplus country even with an
increasing population( Population increased almost 4 times from 1950 to 2012, India's food production
has grown five times becoming a sixth largest net exporter worldwide.)
Moreover, India is a home to a population of 1.3 billion people with a 1.5% annual growth rate. GHI
Report published in 2015 ranked India as one of the leading countries in a serious hunger of situation.
In 2013, National Food Security Act (NFSA) was signed by the Indian government to ensure subsidized
food grains availability to two-third of the population. The Public Distribution System will ensure five
kg per person per month at a highly subsidized price. To meet this requirement and to ensure access to
food for the Indian population is a humongous challenge and responsibility of the Indian government.
Given this scenario of the Indian agriculture, it is imperative to provide domestic support to Indian
farmers. The developing nations have repeatedly negotiated for a “food subsidy box” to not include the
domestic support in the Permitted subsidy calculations. However, WTO has negated any such box
formation. It is concerned that once the green box is tampered with other activities which are listed in
the box will be deemed irrelevant and difficult to implement. Also, stocks which might be procured for
food security might end up reaching the world market distorting the international trade.
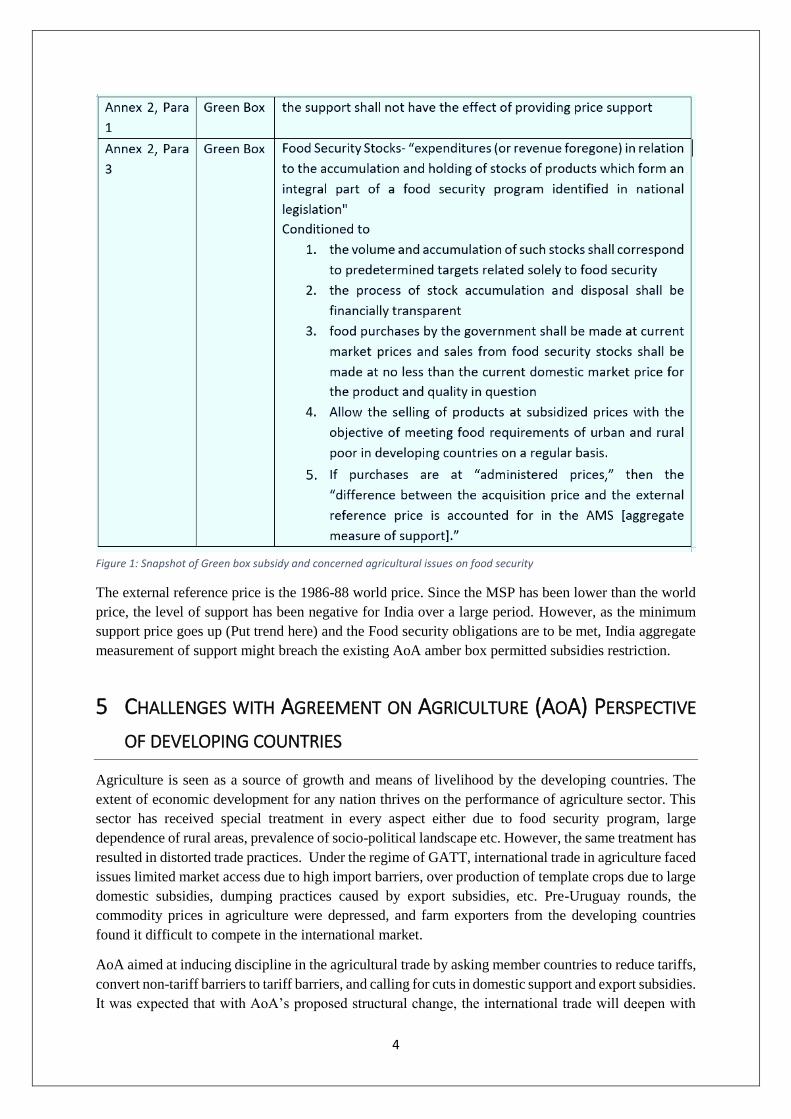
The following table from agreement on agriculture addresses this concern as:
4
Figure 1: Snapshot of Green box subsidy and concerned agricultural issues on food security
The external reference price is the 1986-88 world price. Since the MSP has been lower than the world
price, the level of support has been negative for India over a large period. However, as the minimum
support price goes up (Put trend here) and the Food security obligations are to be met, India aggregate
measurement of support might breach the existing AoA amber box permitted subsidies restriction.
5 CHALLENGES WITH AGREEMENT ON AGRICULTURE (AOA) PERSPECTIVE
OF DEVELOPING COUNTRIES
Agriculture is seen as a source of growth and means of livelihood by the developing countries. The
extent of economic development for any nation thrives on the performance of agriculture sector. This
sector has received special treatment in every aspect either due to food security program, large
dependence of rural areas, prevalence of socio-political landscape etc. However, the same treatment has
resulted in distorted trade practices. Under the regime of GATT, international trade in agriculture faced
issues limited market access due to high import barriers, over production of template crops due to large
domestic subsidies, dumping practices caused by export subsidies, etc. Pre-Uruguay rounds, the
commodity prices in agriculture were depressed, and farm exporters from the developing countries
found it difficult to compete in the international market.
AoA aimed at inducing discipline in the agricultural trade by asking member countries to reduce tariffs,
convert non-tariff barriers to tariff barriers, and calling for cuts in domestic support and export subsidies.
It was expected that with AoA’s proposed structural change, the international trade will deepen with

5
increasing share of exports from developing countries, transparency in trade, and spatial distribution of
agricultural production. (Pal, 2001)
However, as observed from the comparison in the agricultural trade between developing and developed
countries, AoA have fallen short of expectations. The international prices declined due to large export
subsidies and domestic support provided by the developed countries to its producers. It is argued that
the failure of AoA in liberalizing agricultural trade lies in its design and implementation schemes. It
fails on three frontiers of market access, domestic support and export subsidies.
5.1 DESIGN ISSUES AoA in its policies have ignored the differences among the macro-economic setting of countries in their
respective agriculture sector. It assumes that the developing and developed countries will experience
benefits alike from similar liberalization policies. As observed from the works of Xiaozhen et al. the
fundamental problem with AoA is that it assumes that condition under which production and
agricultural trade in developed nations are operated are prevalent by large in developing nations as well
(Xiaozhen Li, June 2008). From policy perspective, it must be realized that the agriculture is practiced
as source of livelihood and survival in developing nations. Hence, the provisions under AoA should be
designed fairly that imparts more protection to the developing economy rather developed economy.
The provision of special safeguards (SSG) is another point of contention in the design of AoA. SSG
were introduced as a design element to help member nations protect their agriculture trade from
unexpected surge in import volume or low prices due to conversion of non-tariff barriers to tariff
barriers. This allowed nations to impose additional import duty as SSG while converting non-tariff
barriers to tariff barriers. At the time of operation, only 22 member countries (16 developed EU nations)
had non-tariff trade barriers. The developing nations were allowed to avail SSG benefits only on 31.8%
of products as compared to 68.2% for developed nations (Actionaid). The SSG mechanism was
significantly skewed in the interests of developed nations.
5.2 IMPLEMENTATION ISSUES Inherent problems with the design elements of AoA have resulted in unfair favor to developed countries.
Implementation of AoA have allowed developed nations to continue to heavily support their domestic
agriculture and exports while manipulating tariffs on imports. The failure in implementation were is
aspect of market access, domestic support and export subsidies.
5.2.1 Market Access:
The developed nations leveraged the loopholes in the AoA to benefit most by manipulating tariff cut
provisions. The AoA didn’t specify the process for conversion of non-tariff barriers to tariff barriers.
This resulted in high equivalent tariff conversions. This distorted the very level playing field intention
of AoA. Though the developed countries were required to make steeper cuts, the levels of tariffs were
significantly higher than the developing counterparts. This resulted in on an average a higher deduction
in tariffs from developing nations than developed countries.
The tariff cut imposed on the member nations were applicable on overall tariff levels and thus varied
significantly with each product. Developed nations exploited this by reducing tariffs marginally on key
products and significantly on products which availed no benefits to their economy. At an aggregate
level, they were able to meet their tariff cut obligations.

6
Exports from the developing countries stagnated due to high import tariffs. Also tariff reduction resulted
in higher prices for agricultural products. Most of the developing countries are dependent on agricultural
imports, removal of non-tariff barriers will result in high prices having a negative impact on their
economy. Thus the developing countries found themselves at the losing side of the international trade.
Improved market access is still a distant reality for the developing world.
5.2.2 Domestic Support and Export Subsidies
Once AoA was implemented, developed countries were obligated to reduce their domestic support
under Amber box category. However, most of the developed countries resorted to manipulating
subsidies and progressively shifted them from Amber box to Green / Blue box.
Substantial support of developed economies to their agriculture lead to dual of problem of
overproduction and dumping activities. Export subsidies to farm producers reduced the gap between
the domestic and world prices whereas domestic supported the higher costs of production in developed
nations. As a result, the production levels were abnormally high which resulted in the dumping activities
in developing economies. These resulted into threefold problems for developing economies – depressed
market prices, misplaced exports, and low domestic production levels.
5.3 IMPACT OF AOA ON INDIA One of major contentions between the international communities has been the domestic support and
export subsidies that are distorting the international trade. The massive domestic support of ₹1.4 Trillion
rupees ($21 Billion) per year for the India’s recently rolled out national food security program have
raised concerns among the developed nations.
At the centre of the negotiations two key issues stem out from Indian point of view. The first is with
due to food security program which is perceived to bring in trade distortions. There is a growing concern
that with increasing population and food consumption, India’s food subsidy bill will rise breaching the
de Minimis level under its WTO commitments.
The objection from developed countries against India’s massive public stockholding of food grains
stems from the possibility of distortion in trade practices and dumping of food stock procured for
domestic consumption. However, a study conducted by Center for WTO, IIFT (Rashmi Banga, 2015)
refutes the proposition that the NFSA bill distort the international prices as the procurement levels will
barely meet the consumption requirements. At the current level of procurement levels, the possibility
of distortion of agriculture trade seems remote with growing domestic consumption. Also the analysis
in the same study (Rashmi Banga, 2015) highlights the difference in the procurement cost and export
unit value for wheat. This establishes the fact that Indian procurement activities do not have any
distortionary value as perceived by developed countries.
Apart from the issue of public stockholding of grains, the developed member nations are rooting for
capping the minimum support price as well as the reducing the input subsidies provided by Indian
government to its farmers. India provides domestic support to its farmers in the farm of direct price
support as MSP (Minimum price support) and indirect product subsidies like fertilizer, fuel, seeds etc.
The average support in form subsidy received by an Indian farmer is in the range of ₹ 1000-1500 ($ 20-
22) when compared with the average support of $ 2500 to a US farmer.

7
Figure 2: Comparison of average support as % of GDP, GFR between developing and developed countries. Source: PSE estimate from OECD
Based on the extent of supported provided, India provides less support then compared to its counterparts
US and EU. However, the point of concern is that majority of Indian subsidies related to procurement
and indirect product based fall under amber box category. This is putting a pressure on Indian
Government to reduce its input and price support subsidies. However, if these subsidies do not act as
incentive to cover the costs of production and cannot be observed from the same lens of “distorted
trade” subsidies. Removal of input subsidies however will create an upward pressure on cost of
production, thereby raising the food prices. Higher food prices will translate into a socio-economic
problem for India where 30% of population belong to marginalized section of society.
Figure 3: MSP vs. cost of production for major agricultural commodities (2016). Prices are in INR / Quintal. Source: INDIASTAT.com, Agricultural Statistics at a glance 2016
Another issue from Indian point of view is the method used for calculation of AMS. WTO method for
calculation uses a fixed external reference price (ERP) from a base year (1986-88 for India) to assess
0.00%
0.50%
1.00%
1.50%
2.00%
2.50%
0%
20%
40%
60%
Japan EU Canada US China Brazil South Africa
% of GDP % of GFR
0
1000
2000
3000
4000
Wheat Barley Masur (Lentil) Paddy Jowar Bajra
Cost of Production MSP

8
the level of price support. India chose to notify the ERP in the base year in domestic currency. This
measure is flawed as it ignores, inflations and exchange rate fluctuations in its calculations. Notification
in domestic currency prevented any exchange fluctuations to be considered in calculation for AMS.
This doesn’t capture true level of support because MSP which is linked to cost levels of production are
based on current prices whereas ERP is based on prices three decades old.
6 MODEL FRAMEWORK TO FORECAST THE REQUIRED SUBSIDY SUPPORT
Therefore, the basic aim of our study is to estimate the level of true domestic support provided under
the amber box category. The objective of our model is to forecast the required domestic subsidy support
by Indian Farmers for the next few years. Aggregate measurement of support is to be estimated for the
increasing procurement levels to support the national food security program. We will evaluate that
whether these increasing AMS levels would breach the Agreement on Agriculture permitted subsidies
(Amber box) and the policy space available for India to implement the PDS model. We have chosen
rice for our analysis since it is a major export agricultural commodities. Spices and other cereals though
as a group have higher share in exports by value, individual components have lesser value share.
Figure 4: Share of exports of major agricultural commodities by Value. Source: Agricultural Statistics at a glance 2016
Estimating production levels:
The Production level Ot is the product of crop area At and its yield Yt. We have treated Area and Yield
exogenous due to limited scope of our project. The Production level forecast would be based on
mathematical extrapolation of the past data.
Ot = At x Yt (1)
Total demand would be the sum of urban and rural demand.
Demand = Demand Rural + Demand Urban (2)
We will estimate the procurement levels to meet the demand due to food security obligations. For
example: an estimate would be procurement to meet 75% rural demand and 50% urban demand. Given
the current procurement levels, we estimate government to procure ~50% of the demand for food
security. Based on past levels these estimates would be obtained.
0.0%
10.0%
20.0%
30.0%
Rice Wheat Spices Other Cereals
Share of Exports 2012 2013 2014 2015

9
Given the procurement level to meet the demand from the current production level we will estimate the
aggregate measurement of support needed for this procurement levels as a percentage of total
agricultural output based on AoA norms. We will identify the breach level, if any and the Year of breach
as per the regulations under Amber box.
Forecasting Area under Cultivation and Total Rice Production
We used data of area under cultivation of rice and total rice production from year 1950 to 2015 to
generate future forecasts for the years 2016 to 2022. Forecasting was done using time series Auto
Regressive Integrated Moving Average (ARIMA) modelling technique. In the literature, this model was
used by (Prabakaran, 2014) and was validated on the available data. The technique ARIMA (p,d,q)
involves transforming the existing time series to a stationary(d) series, identifying the required order of
Auto regression(p) and moving average(q). Criterion such as AIC and BIC are the used to identify the
best model.
Using our data from 1950 to 2015 (Area under cultivation in ‘000 Hectares and Total Rice Production
in ‘000 tonnes), we identified that ARIMA (1, 1, 1) provides the least AIC values. Below is the
forecasted output of our model:
Year 2016 2017 2018 2019 2020 2021 2022
Area under Rice cultivation Forecast
(‘000 Hectares)
44153 44383 44592 44800 45007 45215 45422
Year 2016 2017 2018 2019 2020 2021 2022
Total Rice Production Forecast
('000 tonnes)
107895 108947 110276 111574 112875 114176 115477
The details of the each of the forecasting model is provided in Appendix.
Forecasting Demand for Rice
The demand for rice can be broken down into direct and indirect consumption. Direct refers to the
domestic consumption of rice whereas indirect refers to industrial usage, seed and waste. The indirect
demand is referred as SFW demand. The demand is forecasted using the per capita expenditure and
modelling per capita consumption accordingly. The indirect demand is extrapolated based on the
historic trends. Forecasting of direct demand is mentioned below:
Predicting the per capita consumption of rice is broken down into following three steps:
1. Estimating the expenditure elasticity of rice
2. Predicting India’s total household food consumption
3. Share of rice in total food consumption
Most of the studies predict demand for agricultural products either using linear expenditure system
(LES) or quadratic almost ideal demand system (QUAIDS) (Ganesh Kumar A, 2012). LES is a subset
of QUAIDS and is therefore used for the demand estimation owing to simplicity of equation.
The LES model estimates elasticities for agricultural products using following equation:
𝑆𝑖 = 𝛼𝑖 + ∑ 𝛽𝑖𝑗 𝐿𝑛 𝐹𝑃𝑖𝑗 + 𝛾𝑖𝑓(𝐿𝑛 𝑃𝐶𝐺𝐼⁄ ) + 𝜇𝐴 (3)

10
Si is portion of ith product in household food consumption, Fpi is the price, and Pc is per capita
consumption and GI is denoted by stone geometric price Index2.
The per capita consumption is based on the per capita income levels. This is forecasted using the
following equation:
𝐿𝑛 𝑃𝑐 = 𝑎 + 𝑏𝑖𝐿𝑛𝑃𝑓 + 𝑏2𝐿𝑛𝑃𝑛𝑓 + 𝑓(𝑐𝑖𝐿𝑛 𝑌) + 𝑑𝑍 (4)
Pf is the price index of food items whereas Pnf is the index for non-food items and Y is per capita Income
measured as net national product (NNP) per capita at factor cost.
Ganesh Kumar et al. in their study segmented population based on rural and urban regions and by
income levels. The coefficients obtained after regression were different for different income classes and
different region. However they did not found any statistical difference between their elasticities (Ganesh
Kumar A, 2012). They estimated the elasticity for Rice with respect to food expenditure as -0.21. We
observe from the past data that the per capita consumption of rice is declining. This validates the use of
-0.21 as Rice elasticity. Ganesh Kumar et al. (Ganesh Kumar A, 2012) estimated the per capita
consumption with respect to the per capita income using following equation
𝐿𝑛 𝑃𝐶 = −0.88 − 0.35𝐿𝑛𝑃𝑓 + 0.61𝐿𝑛𝑃𝑛𝑓 + 4.9(𝐿𝑛 𝑌) − 0.49 𝐿𝑛 𝑌2 (5)
The R2 for this regression was observed to be 0.99 (Ganesh Kumar A, 2012)
The food consumption elasticity based on the above equation with respect to per capita income was
estimated as 0.77.
The demand is forecasted by assuming the per capita income growth to varying as per following
scenarios 4% growth, 5% growth and 6% growth level.
Based on this per capita income level growth rate, the forecasted values for per capita food consumption
in growth percentage are tabulated below:
Scenario (per Capita) 2015 2020 2025
4% income growth 3.05% 2.66% 2.29%
5% income growth 3.35% 2.92% 2.58%
6% income growth 3.62% 3.16% 2.74%
Table 1: Forecasts for per capita food consumption growth rates. (Ganesh Kumar A, 2012)
Using forecasted elasticity for Rice, and growth in per capita consumption depending on the scenarios
the following per capita demand for next ten years for Rice is estimated:
Year Scenario 1 (4%) Scenario 2 (5%) Scenario 3 (6%)
2018 5.70 5.66 5.63
2019 5.67 5.62 5.58
2020 5.63 5.58 5.54
2021 5.59 5.54 5.50
2022 5.56 5.51 5.46
2023 5.59 5.55 5.50 Table 2 Demand forecast for per capita consumption of Rice
2 ln(GI) = Σn i= 1 ln(Si FPi ) (R Green, 1990)

11
From the study if Ganesh Kumar et al. the indirect demand for rice is estimated to be 4.4% of total
demand consumption. Assuming a population growth rate for India to be 1.2%, the total annual demand
for rice (direct and indirect) is estimated to be
Year Scenario 1 (4%) Scenario 2 (5%) Scenario 3 (6%)
2018 95.4 94.6 93.8
2019 95.9 95.0 94.2
2020 97.7 96.9 96.1
2021 98.3 97.4 96.6
2022 99.0 98.0 97.1
2023 99.6 98.6 97.6 Table 3: Forecast for total annual demand in Million metric tonnes
Product Specific Support Calculations
We used the methodology developed by Sharma S. K., 2016 to calculate the rice specific product
support in India. The aggregate minimum support level is calculated for the procurement of the demand
levels above. Given the procurement levels, we calculated the eligible production.
Value of Production = Admiinistered Price x Production
Product Sepcific support = (Administered Price – External Reference Price) x Eligible Production
Where Eligile Production = Procurement Level x Production
We calculated Product Specific supoprt as a percentage of the value of production.
Year Administered
Price
($/Ton)
External
Reference
Price
($/Ton)
Eligible
Production
(mn ton)
Production
(mn ton)
Value of
Production
(mn $)
Product
Specific
Support
(mn $)
PS/VOP
2016 324.8 262.5 47.18 107.90 35044.30 2938.53 8.39%
2017 324.8 262.5 47.43 108.95 35385.99 2954.72 8.35%
2018 324.8 262.5 47.70 110.28 35817.64 2971.00 8.29%
2019 324.8 262.5 47.96 111.57 36239.24 2987.37 8.24%
2020 324.8 262.5 48.86 112.88 36661.80 3043.69 8.30%
2021 324.8 262.5 49.17 114.18 37084.36 3062.99 8.26%
2022 324.8 262.5 49.48 115.48 37506.93 3082.40 8.22%
For the adminstered prices we have used the 2015-2016 levels. If the situation worsens further and India
fail to negotiate during the Peace clause discussion, these administered price levels will be decreased.
Policy space for India given the 10% Amber box limit:
From our calculations we estimated that remaining within the Amber box levels, India can procure
56.26 million tonnes of rice assuming 2015-2016 administered price levels. It is 52% of the current
production levels. Also within the current requirement, there is a scope to increase the administered
price till $340.4 per tonne.

12
7 CONCLUSION
Using rice, given the current procurement levels and the forecasted demand, we have estimated that
India will not violate the de Minimis limit for the amber box product specific support till 2022.
Our estimate on this study is limited by multiple assumptions. The production and the area under
cultivation is modelled using ARIMA time series technique. Demand estimate incorporates population
and per capita income growth rates. Administered prices at 2015-2016 levels are utilised for the
calculation. Although currently India is within the Amber box limit, the 10% restriction has restricted
the policy space. Agriculture support is necessary for the marginalised farmers in India and it is about
time when the support will go beyond the permissible levels. When India will negotiate the signed peace
clause in Buenos Aires in December, 2017 the product specific support limit has to be negotiated which
is imperative for meeting the food security obligations for India and other developing countries.

13
8 APPENDIX
Below are the details about each of the forecasting models:
Area under cultivation:
The Mean Absolute Percent Error (MAPE) is 2.017 with an R-Square of 93.9%
Forecast Chart

14
Total rice production
The Mean Absolute Percent Error (MAPE) is 6.866 with an R-Square of 96.6%

15
9 REFERENCES
Actionaid. (n.d.). The WTO Agreement on Agriculture.
Debnath, D. B. (2017). Impact of India’s National Food Security Act on domestic and international rice
markets (Vol. 1635). Intl Food Policy Res Inst.
Eugenio Diaz-Bonilla, D. L. (2015). The Bali Agreement : An Assessment from the perspective of
Developing countries. International Food Policy Research Institute.
Ganesh Kumar A, R. M. (2012). Demand and supply of cereals in India 2010-2025. New Delhi:
International Food Policy Research Institute.
Pal, P. (2001). Implementation Issues of the Agreement on Agriculture and its Implications for
Developing Countries.
Prabakaran, K. C. (2014). Forecasting areas and production of rice in India using ARIMA model.
International Journal of Farm Sciences 4.1 , 99-106.
Rashmi Banga, C. S. (2015). Public stockholding of food in India: Can it distort international trade?
Indian Institute of Foreign Trade, Centre for WTO Studies, New Delhi.
Rena, R. (2012). Impact of WTO policies on developing countries: issues and perspectives.
TRANSNATIONAL CORPORATIONS REVIEW (CANADA), 77-88.
Sharma, D. S. (2013, January). Doha Negotiations and Domestic Support to Indian Agricultural Sector.
Indian Institute of Foreign Trade, New Delhi.
Sharma, S. K. (2016). WTO and its implications for India and China: Food security Vs Naked
Commercial Interest. Centre for WTO Studies.
Xiaozhen Li, W. W. (June 2008). WTO Agreement on Agriculture: A Developing Country Perspective.
Journal of Politics and Law, 1(2).


![Presentation Wto Agriculture[1]](https://img.dokumen.tips/doc/110x75/555734ebd8b42a320c8b50c5/presentation-wto-agriculture1.jpg)

