Embed Size (px)
Citation preview

Pa g e | 1
Impact of the Surge in Chinese Import on Indian Manufacturing Sector
Jitender Singh
Assistant Director
RESEARCH STUDIES OFFICE OF THE ECONOMIC ADVISER
DEPARTMENT OF INDUSTRIAL POLICY AND PROMOTION MINISTRY OF COMMERCE & INDUSTRY
UDYOG BHAWAN, NEW DELHI INDIA
July, 2012
Vie ws expre s s e d in th is pape r are t hos e o f t he author(s ) an d m ay not be at t ribut e d t o th e Government of India.

Pa g e | 2
Acknowledgement
This Study w ou ld not h ave been pos s ib le w ithou t the help of a num ber of people w h o w ith the ir k ind cooperation , active s uperv is ion an d s tead fas t s upport have m ad e th is res earch w ork reality .
I am ex trem ely gratefu l to Principal Ad vis er Dr. Man ju la Kris hn an , w hos e k een con tinuous encouragem en t and s ugges tions helped to com ple te th is w ork .
I am th ank fu l to S hri S rik ara Naik , Econom ic Ad vis er and S hri M.C. S ingh i, S en ior Economic Adviser for his valu able com m en ts an d encouragem en t to com ple te th is w ork . I a ls o ex tend m y s incere gratitud e to Ms . Man is h a Meen a, As s is tan t Director for s h arin g her valu able though ts an d help in g in und ers tan d ing the d ata. I als o th ank Shri Purohit, Economic Officer who provid ed th e d ata s upport.
Place:
Date: Jitender Singh

Pa g e | 3
Impact of the Surge in Chinese Import on Indian Manufacturing Sector
Abstract
In d ian im port trend reported a s urge in recen t pas t few y ears , pos s ib ly becau s e of cheap im port of Ch ines e m anufactu ring good s . The trad e d eficit w ith Ch in a is als o ris ing along w ith ris in g reques t for in trod ucing an ti d um ping m eas ures agains t Ch ines e im port. Thes e trend poin ts the need to check the profile of im port from Ch in a an d its rela tion w ith our d om es tic m anufactu ring prod uction s tructu re . The m ajor ques tion ad d res s ed in th is res earch s tud y is : How are trend s in im port from Ch in a as s ocia ted w ith im port and m anufactu ring in s pecific ind us try s ub-group in India?
A concord ance be tw een Ind ian Trad e Clarifica tion bas ed on Harm on iz ed S y s tem (ITC-HS ) Cod e and Nation al Ind us try Clas s if ication (NIC) a t 5 d igit level is d eveloped for las t 7 y ears for 268 item s of IIP (Ind ex of Ind us trial Prod uction) and im port, and s epara tely w ith im port from Ch in a. The ind ices for the im port, IIP (268 item s ) an d ind us try s ubgroups have been cons tructed . The export ind ex (u s ed s am e m ethod ology an d concord ance) is tak en from an earlier S tud y by S in gh i, M.C. 2011 .
The Ind ex of Ind us trial Prod uction (IIP) for 268 item s , Ind ex for Im port from all countries (Im port Ind ex from now ) and Ind ex for Export h as grow n res pectively by 107.8 %, 1773 .1 %, and 143 .4% in 2010-11 over the bas e of 2004-05 . The Ch in es e im port ind ex (Ch in es e ind ex from now ) for s am e item s h as grow n by 4618 .4% in 2010-11 over the bas e 2005-06 , w h ich is m uch h igher th an the im port ind ex. The s h are of the im ports of 268 item s from Ch in a in total im ports from Ch in a to Ind ia h as jum ped to 41 .3% in 2010-11 from 26.3% in 2005-06.
There are enough ev id ence to s u s pect th a t im port to In d ia from coun tries other th an Ch in a are now increas ingly been replaced by cheap Ch ines e im port. Therefore the im port to Ind ia is progres s ively concen tra ting w ith Ch in a. Broad ly the B as ic Good s an d the In term ed ia te Good s s ectors s eem
to be nega tively affected from the cheap Ch ines e im port. How ever, acros s industry sub-group there are num ber of prod ucts h aving negatively im pacted by Ch ines e import.
The large im port from Ch in a are noticed in ind us try s ub-group of rad io, te levis ion an d com m un ica tion equ ipm en t , follow ed by Mach inery an d equ ipm en t , office accoun ting an d com pu tin g m ach inery , other tran s port equ ipm en t , e lectrical m ach inery an d apparatu s , Bas ic Metals , Fabrica ted m eta l prod ucts , excep t m ach inery , Chem ical an d chem ical prod ucts , m otor veh icles , tra ilers and s em i-tra ilers , and rubber
an d plas tic prod ucts .
***

Pa g e | 4
Impact of the Surge in Chinese import on Indian Manufacturing
INTRODUCTION
Th e t ren d in im por ts to In d ia s h ows a s u rge in ch ea p Ch in es e im por ts of m a n u fa ctu r in g goods to In d ia , a ccu m u la t ion in In d ia s t ra de deficit with Ch in a a n d r is in g requ es t for in t rodu cin g a n t i du m pin g m ea s u res a ga in s t Ch in es e im por ts poin ts th e n eed to ch eck th e p rofile of im por ts from Ch in a a n d its rela t ion with ou r dom es t ic m a n u fa ctu r in g p rodu ct ion s t ru ctu re. Th e m a jor question this research study attempt to address is: How trends in imports from China are associated with manufacturing production in India?
Th e m a s s ive d ivers ified m a n u fa ctu r in g ca pa city crea t ion in Ch in a du r in g recen t pa s t h a s res u lted in dom es t ic m a rket s u rp lu s es of m a n u fa ctu red p rodu cts . Th e h u n t for n ew m a rkets ou ts ide to du m p th is glu t p rodu ct ion is well ca p tu red in th e s ta t is t ics . Ch in a s s h a re in wor ld expor ts between 200 0 a n d 2010 increas ed by 6 .5 percen ta ge poin ts com pa red to In d ia n just 0.8 percen ta ge poin ts . Arou n d h a lf of th is tota l in crea s e in th e Ch in a s share is with em ergin g a n d develop in g cou n tr ies wh ile for In d ia it is on ly 6 per cen t of the tota l in crea s e (Econ om ic Su rvey, 2011-12). Th e ea s y ta rget for Ch in es e expor ts is it s p roxim ity to In d ia wh ere m a n u fa ctu r in g s ector is s t ru gglin g to im prove its rela t ive s t ren gth in th e econ om y (m a n u fa ctu r in g s h a re in GDP is s ta gn a n t) a n d expor t of m a n u fa ctu r in g goods is la den on th e s m a ll s ca le s ector or based on the use of imported raw materials. A rising input requirements for in du s try a n d m a n u fa ctu r in g goods dem a n d in In d ia is reflected in in crea s e in the Non-POL non-bullion imports i.e. by 29.3 per cent in 2010-11.
China h a s becom e th e la rges t s ou rce of In d ia n im por ts with a n 11 .7 per cen t s h a re in it s tota l im por ts . In d ia s low expor t / im por t ra t io (0 .45 in 2010-11) with Ch in a is res u lt in g in h u ge t ra de deficit . Tra de deficit of In d ia with China have in crea s ed from US$ 19 .2 b illion in 2009-10 to US$ 23 .9 b illion in 2010-11 indicating the surge in imports from China.
Ch ea p Ch in es e im por ts h a ve a ls o s u rged in Afr ica , US a n d La t in Am erica n Cou n tr ies . Ch in a beca m e b igges t t ra d in g pa r tn er of Sou th Afr ica in a s h or t s pa n of t im e. Th e Ch in es e expor ts to Sou th Afr ica es pecia lly in textile sector, a re bu llyin g loca l in du s tr ies in Sou th Afr ica . In Bra zil in du s tr ia l ou tpu t

Pa g e | 5
is a ls o get t in g a dvers ely im pa cted from im por ts from Ch in a bes ides d u e to the sluggish global economy.
In th is ba ckdrop th e m os t ob viou s qu es t ion s likely to be ra is ed a re: why is t h ere a s urge in exp or t from Ch ina t o Ind ia in recen t y ea r? Whether Ch ina s m a nufa c t ur ing is acquiring com p et i t iveness over t h e t im e compared to India? The outward oriented growth in Chinese economy may be th e rea s on to boos t th e expor t a n d th erefore s u rge of im por ts to In d ia . Or Wh et h er Ind ia n manufacturing is los ing i t s com p e t i t ivenes s a ga ins t China? On e m a y s u s pect a bou t los s of com pet it iven es s of Indian Manufacturing in past few years, primarily due to fast rising cost of production, and infrastructure bottlenecks.
Or Is t h ere a ny unfa ir p la y by t h e Ch ina t o d um p t h e g lu t in Ind ia ? Th e u n fa ir p ra ct ices s u ch a s du m pin g of s u bs ta n da rd glu t p rodu ct ion in to India from China also seems to partially responsible for surge in import. In d ia s anti-dumping in it ia t ion s in crea s ed to 55 in 2008 , fell to 31 in 2009 , bu t a ga in in crea s ed to 41 in 2010 . The main cou n tr ies in volved in th es e in ves t iga t ion s a re Korea RP, Ch in es e, Ta ipei (Taiwan), etc.. Or Are im p or t from ot h er t h a n Ch ina t o Ind ia is ge t t ing rep la ced by Ch ines e im p or t ? It m a y be pos s ib le th a t th e im por t from cou n tr ies oth er th a n Ch in a to In d ia is in crea s in g bein g replaced by cheap Chinese import.
Th e los s of com pet it iven es s by th e In d ia n in du s try a n d th e u n fa ir p la y, if any, are the most important questions to be answered first. If the answer is yes for on e or both , th en cer ta in ly it wou ld ca r ry th e poten t ia l to ca u s e in ju ry to th e In d ia n m a n u fa ctu r in g in s h or t a n d lon g ru n . Th is s tu dy is a p relim in a ry investigation to look into the questions.
OBJECTIVES OF THE STUDY:
(i). To iden t ify th e in du s try s u b -group, a n d p rodu cts wh ere th e im por t , especially form Chinese, is impacting th e dom es t ic manufacturing production;
(ii). To iden t ify th e in d u s try s u bgrou p , a n d p rodu cts wh ere th e im por t from China is replacing the import to India from countries other than China;
DATA SOURCES & METHODOLOGY

Pa g e | 6
The data of industrial production for 268 items is sourced from the Office
of th e Econ om ic Advis er , Depa r tm en t of In du s tr ia l Produ ct ion & Policy (DIPP), Min is t ry of Com m erce & In du s try. Th e da ta on expor ts a n d im por ts is ta ken from the Department of Commerce, Ministry of Commerce & Industry. The data on im por t , expor t a n d dom es t ic p rodu ct ion for 2 68 item s is synchronized by a con corda n ce between th e ITC (HS) code and NIC Cla s s ifica t ion of in du s tr ia l Produ ct ion a t 5 Digit level. Ea ch HS code item for im por t is regrouped against its res pect ive dom es t ic in du s tr ia l p rodu ct ion a t NIC-5 d igit code. Th e im port from Ch in a for th e 268 item s h a s a ls o been h a rm on ized in to th e NIC cla s s ifica t ion a t 5 d igit level. The s tu dy covers a period of s even yea rs 2004-05 to 2010-11.
Even a fter con corda n ce, th e figu re for im por t , expor t a n d dom es t ic industrial production may not directly be comparable. The domestic production figures for the 268 items are reported in different units e.g. tones, rupee crores, m eters etc., a n d m a y n ot be d irect ly com pa ra b le with on e a n oth er a n d with im por t figu res . Th e im por t figu res h owever , a re a va ila b le u n iform ly in va lu e term s a n d th erefore ca r ry effect of th e in fla t ion , wh ich m a y be a bs en t from m a n y of th e dom es t ic p rodu ct ion figu res repor ted in term s of ph ys ica l ou tpu t . Th erefore th e in d ices a re con s tru cted for th e dom es t ic p rodu ct ion a n d im por t to make these comparable.
Th e in dex of th e im por t is defla ted with th e a ppropr ia te p r ice in dex con s tru cted from th e Wh oles a le Pr ice In dex (WPI) to elim in a te th e in fla t ion effect on im por t . S im ila r ly, for th e item s wh ere dom es t ic p rodu ct ion is repor ted in va lu e term s , th e s a m e is defla ted with a ppropr ia te p r ice in d ices . Th e u s e-ba s ed in d ices a re defla ted with th e overa ll WPI in dex for th e 268 item s . Th e fin a l in d ices for exp or t for 20 04-11 a re ta ken from a n ea r lier Res ea rch Stu dy by Mr. M.C. Sin gh i, Sr . Econ om ic Advis er , 2011 , for Office of th e Econ om ic Adviser.
Th es e 26 8 item s a ccou n t for 60 .4% weigh t in th e m a n u fa ctu r in g s ector a n d 45 .6% weigh t in th e overa ll In dex of In du s tr ia l Produ ct ion (IIP). Th e covera ge of DIPP a t b roa d grou ps of m a n u fa ctu r in g va r ies from a low of 1 .1 % for manufacture of coke, refin ed petroleu m p rodu cts a n d n u clea r fu el to 100% in 15 groups (Singhi, M.C. 2011).
LIMITATIONS OF THE STUDY:
Th e s tu dy covers on ly 45 .6% of th e weigh ts of IIP, 268 DIPP item s , for wh ich th e p rodu ct ion da ta is a va ila b le with th e Depa r tm en t of In du s tr ia l
Pa g e | 7
Produ ct ion & Prom otion (DIPP). Th erefore a ll th e lim ita t ion s of IIP a re in h eren t in the analysis.
RESULTS AND DISCUSSION
Index of Industrial Production (IIP) for 268 Items
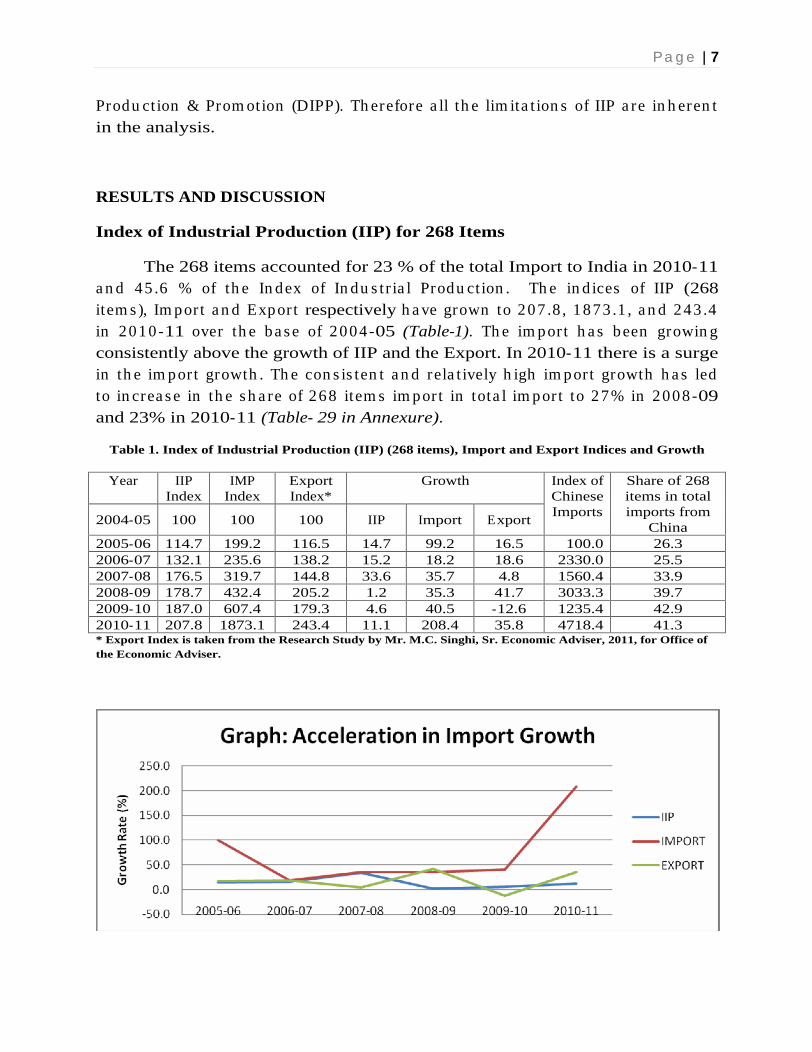
The 268 items accounted for 23 % of the total Import to India in 2010-11 a n d 45 .6 % of th e In dex of In du s tr ia l Produ ct ion . Th e in d ices of IIP (268 item s ), Im por t a n d Expor t respectively h a ve grown to 207 .8 , 1873 .1 , a n d 243 .4 in 2010-11 over th e ba s e of 2004-05 (Table-1). Th e im por t h a s been growin g consistently above the growth of IIP and the Export. In 2010-11 there is a surge in th e im por t growth . Th e con s is ten t a n d rela t ively h igh im por t growth h a s led to in crea s e in th e s h a re of 268 item s im por t in tota l im por t to 27% in 2008-09 and 23% in 2010-11 (Table- 29 in Annexure).
Table 1. Index of Industrial Production (IIP) (268 items), Import and Export Indices and Growth
Year IIP Index
IMP Index
Export Index*
Growth
2004-05
100 100 100 IIP Import Export
Index of Chinese Imports
Share of 268 items in total imports from
China 2005-06
114.7
199.2 116.5 14.7 99.2 16.5 100.0
26.3 2006-07
132.1
235.6 138.2 15.2 18.2 18.6 2330.0
25.5 2007-08
176.5
319.7 144.8 33.6 35.7 4.8 1560.4
33.9 2008-09
178.7
432.4 205.2 1.2 35.3 41.7 3033.3
39.7 2009-10
187.0
607.4 179.3 4.6 40.5 -12.6 1235.4
42.9 2010-11
207.8
1873.1 243.4 11.1 208.4 35.8 4718.4
41.3 * Export Index is taken from the Research Study by Mr. M.C. Singhi, Sr. Economic Adviser, 2011, for Office of the Economic Adviser.

Pa g e | 8
Th e in dex of im por t from Ch in a (Ch in es e In dex from n ow) for 268 item s
h a s grown even fa s ter to 4718 .4 in 2010-11 over th e ba s e of 2005-06, com pa red to in dex of im por t from a ll cou n tr ies (Im por t In dex from n ow). Th is m a m m oth growth in Ch in es e In dex from pa s t s ix yea rs h a s been con s idera b ly h igh er th a n th e Im por t In dex. Th erefore, th e Ch in es e im por t s h a re of th es e item s in tota l Ch in es e im por ts is ju m ped to 41 .3% in 2010-11 from 26 .3% in 2005-06 . Th is in d ica tes th a t In d ia is p rogres s ively s ou rcin g im por ts of th es e item s from Ch in a th erefore th e im por t from cou n tr ies oth er th a n Ch in a a re now increasingly being replaced by Chinese imports in these selected items.
USE BASED CLASSIFICATION
As per th e Use-based cla s s ifica t ion of IIP (268 item s ), th e im por t s h a re of th e Ca p ita l Goods is la rges t (8 .8% in 2010-11), followed by Con s u m er Goods (6 .5% a n d in term ed ia te goods (4 .7%), a n d Ba s ic Goods (2 .9%) (Table 29 . in Annexure).
Basic Goods
Th e va lu e of th e IIP of Ba s ic Goods h a s grown to 168 .4 in 2010-11 over the base 2004-05 (Table 2). Comparatively the Import Index has grown to 534.6 du r in g s a m e per iod . Th e Ch in es e In dex h owever , h a s grown even fa s ter to 4307 .4 in 2010-11 over th e b a s e of 20 05-06 th a n Im por t In dex a n d IIP. Th e s h a re of th e Ba s ic goods item s in th e tota l Ch in es e im por t , h owever rem a in a lm os t s ta gn a n t . Ma jor Ba s ic Goods , in term s of va lu e, im por ted from Ch in a are Alu m in u m , Copper a n d Copper Produ cts , Alu m in u m Sh eets / Pla tes , Aluminum Foils, Carbon Black, Wires (Copper), and Cement All Kinds.
The Ch in a s s h a re in tota l im por t to In d ia for the C.I. Ca s t in gs , Alu m in iu m Foils , Alu m in iu m wires & extru s ion s , Alu m in iu m sheets/Plates, An ilin e, Ca rbon Bla ck , Cem en t All Kin ds , Alu m in iu m , Su lph u r ic Acid In cl. Oleum, Copper and Copper Products etc increased considerably in 2006-09 but moderated thereafter. The period, 2006-09, is of high industrial growth in India wh ich m igh t s u bs ta n t ia te th a t th e h igh dom es t ic in du s tr ia l growth is increasingly fueled by larger import of basic goods from China.
Table 2. Basic Goods
Year IIP Index IMP Index Chinese Import
2004-05 100 100
Growth IMP Growth
Index Share

Pa g e | 9
2005-06 113.6 158.0 13.6 58.0 100.0 1.5 2006-07 122.6 279.5 7.9 76.9 2060.2 1.7 2007-08 140.3 395.8 14.4 41.6 3515.4 2.0 2008-09 147.1 697.3 4.9 76.2 2302.7 1.8 2009-10 161.0 499.9 9.5 -28.3 3204.0 1.5 2010-11 168.4 534.6 4.6 6.9 4307.4 1.6
Capital Goods
Th e in dex of ca p ita l goods in du s try h a s grown to 138 .6 in 2010-11 over th e ba s e of 2004-05 com pa red to Im p or t in dex 565 .5 du r in g th e s a m e per iod (Table 3 ). Th e dom es t ic p rodu ct ion of th e ca p ita l goods declin ed in du r in g th e 2008-09, the crisis time, however, the imports growth jumped to 43.4%. Later, th e growth of th e im por t h owever h a s declin ed to zero in recen t yea r , wh ereb y th e Ch in es e In dex h a s ju m ped con s idera b ly over th e ba s e of 2005-06 to 10793.1 in 2010-11.
Th e h igh growth in Ch in es e In dex over Im por t In dex s ign a ls th a t th e In d ia n im por t of Ca p ita l Goods a re reloca t in g its elf from res t of th e wor ld to China, es pecia lly for th e item s s u ch a s H.T. Insulators, Boilers, Footwear excep t lea th er , Refra ctory Br icks , Computers, Hea t Exch a n gers , Grinding Wheels, Pa cka gin g Ma ch in ery, Air Con d it ion er (Pa cka ged), Chillers, Electric Welding Machines, Fibre Optic Cable, Electric Motors Phase-I, Cooling Towers, Printers, Com pu ter Per iph era ls , Cranes, Tu rb in es & Acces s or ies , Lifts / Eleva tors & Com pon en ts th ereof, Ma gn es ite, Dea d Bu rn t, Cylinders, Pr in t in g Ma ch in ery, Sh ip Bu ild in g & Repa irs , In s u la ted Ca b les / Wires a ll Kin d , Sola r Power Sys tem s , Air & Ga s Com pres s ors , Text ile Ma ch in ery, Industrial Chains, Agr icu ltu ra l Ma ch in ery, UPS/Inverter/Converter, Construction Machine/Equipment, In du s tr ia l Blowers , Forklift, Tra n s form ers (Sm all), Loaders, DC Motors , Air Brea k Switch es / Circu it , Breakers, An d Generator/Alternator.
Table 3. Capital Goods
Years IIP IMP Index Chinese Imports
2004-05 100 100 Growth IIP Growth of IMP
Index Share
2005-06 108.2 332.8 8.2 232.8 100.0 15.8
2006-07 119.8 276.5 10.7 -16.9 4396.4 12.8
2007-08 127.9 354.2 6.8 28.1 1829.7 15.2
2008-09 127.7 507.8 -0.1 43.4 6091.5 14.3
2009-10 131.2 565.3 2.7 11.3 1090.1 16.3

Pa g e | 10
2010-11 138.6 565.5 5.6 0.0 10793.1 15.8
Ma in ca p ita l goods item s im por ted from Ch in a , in term s of va lu e,
includes Sh ip Bu ild in g & Repa irs , Com pu ters , Text ile Ma ch in ery, Air Con d it ion er (Pa cka ged), Pr in t in g Ma ch in ery, Com pu ter Per iph era ls , Boilers , In s u la ted Ca b les / Wires a ll Kin d , Ma ch in e Tools , Con s tru ct ion Machine/Equipmen, Sta b ilis ers , Tu rb in es & Acces s or ies , Refra ctory Br icks , Air & Ga s Com pres s ors , E lectr ic Motors Ph a s e-I, Lifts / Eleva tors & Com pon en ts th ereof, Pu m ps (in clu d in g power d r iven p u m ps ), Med ica l a n d Su rgica l Equ ipm en t (excep t x-ra y), Sola r Power Sys tem s , En gin es In cl. In tern a l Com bu s t ion a n d Dies el, En gin e, Agr icu ltu ra l Ma ch in ery, Transformers (Small), Gen era tor / Altern a tor , UPS/ In ver ter / Con ver ter , Pla s t ic Ma ch in ery In cl. Mou ld in g Ma ch in ery, Cra n es , Air Brea k Switch es / Circu it Brea kers , Ch illers , DC Motors, and Electric Motors(Excl. Phase-I).
Intermediate Goods
Th e va lu e of IIP for in term ed ia te goods h a ve in crea s ed to 303 .0 in 2010-11 a t th e ba s e of 2004-05 , com pa red to th e im por t in dex va lu e of 781 .5 du r in g th e s a m e per iod (Table 4 ). Th e im por t of in term ed ia te goods h a ve grown fa s ter th a n th e dom es t ic p rodu ct ion , a n d th e im por ts of in term ed ia te goods from China have grown even faster than the Import Index.
The import item s wh ere th e Ch in a is getting its h old a re Parts
Bicycle, Au to An cilla ry & Pa r ts , Sod iu m Hydros u lph a te/ Sod iu m , Hydros u lph ite, Glass Sheet, Tou gh en ed Gla s s , Fib re Gla s s , Dyes, Magnets, Plywood, Tin Con ta in ers , Weld in g Rods , Wh iten in g Agen ts , Power Ca pa citors , Graphite Electrodes/Anodes, Stra w An d Pa per Boa rds of All Kin ds , Pla s t ic Film Excl. Bopp Film , Steel Stru ctu res , Wood Ven eer, Alu m in iu m Tu bes / Pipes , Glass Bottles, Bea r in gs (Ba ll/ Roller ), HDPE Woven Sa cks , Ru bber Ch em ica l, Plastic Sheets, Adhesives, Colou r TV Pictu re Tu bes , Len s of All Kin ds , a n d IC Ch ips & Transistors.
Table 4. Intermediate Goods
Years IIP Index IMP Index Growth Chinese Import
2004-05 100 100 IIP IMPORT Index Share
2005-06 116.5 149.0 16.5 49.0 100.0 4.7
2006-07 140.6 218.9 20.7 46.9 2234.0 5.7

Pa g e | 11
2007-08
265.0 267.0 88.5 22.0 954.8 6.3
2008-09 281.1 337.2 6.1 26.3 1619.8 5.7
2009-10 274.0 498.6 -2.5 47.8 1281.7 5.4
2010-11 303.0 781.5 10.6 56.8 899.3 5.2
Th e m a jor im por ts from Ch in a , in term s of va lu e, a re Au to An cilla ry & Pa r ts , IC Ch ips & Tra n s is tors , Bea r in gs (Ba ll/ Roller ), Pa r ts
Bicycle, Steel Stru ctu res , Stra w An d Pa per Boa rds of All Kin ds , Dyes , Power Ca pa citors , Gra ph ite Electrodes / An odes , Pr in ted Circu it Boa rd / Pla te, Fib re Gla s s , Ma gn ets , Colou r TV Pictu re Tu bes , Syn th et ic Ru bber , Ru bber Ch em ica l, Weld in g Rods , Plywood , Adh es ives , Gea r Boxes , Tou gh en ed Gla s s , PVC Res in s , Newsprint, Plastic Sheets, Plastic Film Excl. Bopp Film, and Printing Ink.
Consumer Goods
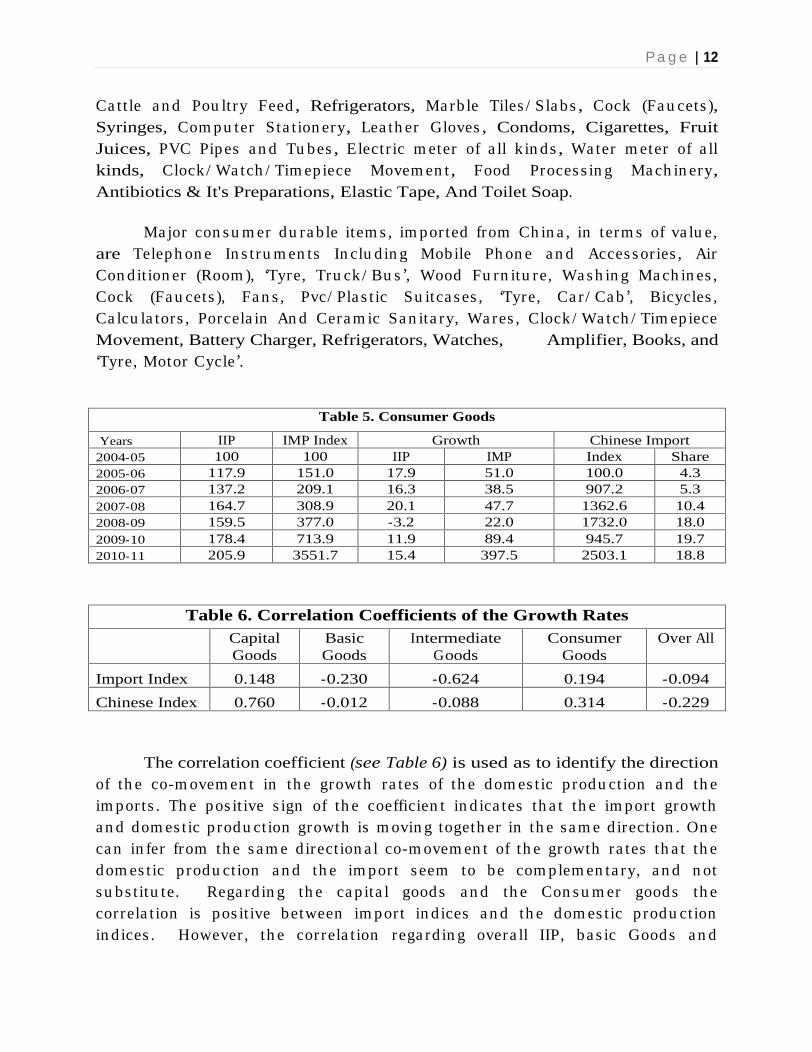
Th e va lu e of th e In dex of Con s u m er Goods h a s grown to 205 .9 in 2010-11 over th e ba s e of 2004-05 (Table 5 ). However , Im por t In dex h a s grown rela t ively m u ch fa s ter to 3551 .7 du r in g s a m e s even yea rs . Th e growth of th e Im por t In dex h a s b een fa s ter th a n th e dom es t ic p rodu ct ion of th e con s u m er goods . Th e va lu e of th e Ch in es e In dex h a s been con s idera b ly h igh er th a n IIP a n d Im por t In dex. Th e s h a re of th e Ch in es e im por ts h a s a ls o ju m ped to 18 .8 % in 2010-11 com pa red to ju s t 4 .3 % in 2005-06 . Th e im por ts of Con s u m er Du ra b les Goods is growin g a t m u ch fa s ter ra te th a n even th e oth er u s e ba s ed in du s tr ies a n d th erefore pu s h in g th e s h a re of Con s u m er Goods in tota l im por t from China.
Th e item s wh ere th e Ch in a s s h a re in tota l im por ts of th e res pect ive item s is r is in g a re Bicycles, PVC/ Pla s t ic Su itca s es , Terry Towel, Calculators, Glucose( powder & liquid), Ru bber Fla ps , Flu ores cen t Tu bes , Lea th er Sh oes , Fans, Ba t tery Ch a rger , Tyre, Tru ck / Bu s , Mixers & Grin ders , Tube, Cycle/Rickshaw, Tyre, Cycle/ Ricks h a w, Tu be, Tru ck , Teleph on e In s t ru m en ts Including, Mobile Ph on e An d Acces s or ies , Wood Fu rn itu re, Air Con d it ion er (Room), Vitamins, Porcela in An d Cera m ic Sa n ita ry, Wa res , Amplifier, Leather Ba gs , Wa llets , Pu rs es , Tyre, Motor Cycle , Pres s u re Cooker, Motor Cycles , Lea th er Ga rm en ts , Tooth Bru s h , Wa s h in g Ma ch in es , Apparels, Incandescent Lamp, Spor ts Goods , Ru bber , Ra zor Bla des / Sa fety Bla des , Pen s of All Kin d , Gla zed Tiles / Cera m ic Tiles , Tyre, Ca r / Ca b , Polyth en e Ba gs In cl. Hdpe & Ldpe, Ba gs , Scooter a n d Mopeds , Squ a s h es , J a m s , J ellies , Ketch u ps ,Etc.,
Pa g e | 12
Ca tt le a n d Pou lt ry Feed , Refrigerators, Ma rb le Tiles / Sla bs , Cock (Fa u cets ), Syringes, Com pu ter Sta t ion ery, Lea th er Gloves , Condoms, Cigarettes, Fruit Juices, PVC Pipes a n d Tu bes , Electr ic m eter of a ll k in ds , Wa ter m eter of a ll kinds, Clock / Wa tch / Tim ep iece Movem en t, Food Proces s in g Ma ch in ery, Antibiotics & It's Preparations, Elastic Tape, And Toilet Soap.
Ma jor con s u m er du ra b le item s , im por ted from Ch in a , in term s of va lu e, are Telep h on e In s t ru m en ts In clu d in g Mobile Ph on e a n d Acces s or ies , Air Con d it ion er (Room ), Tyre, Tru ck / Bu s , Wood Fu rn itu re, Wa s h in g Ma ch in es , Cock (Fa u cets ), Fa n s , Pvc/ Pla s t ic Su itca s es , Tyre, Ca r / Ca b , Bicycles , Ca lcu la tors , Porcela in An d Cera m ic Sa n ita ry, Wa res , Clock / Wa tch / Tim ep iece Movement, Battery Charger, Refrigerators, Watches, Amplifier, Books, and Tyre, Motor Cycle .
Table 5. Consumer Goods
Years IIP IMP Index Growth Chinese Import 2004-05 100 100 IIP IMP Index Share 2005-06 117.9 151.0 17.9 51.0 100.0 4.3 2006-07 137.2 209.1 16.3 38.5 907.2 5.3 2007-08 164.7 308.9 20.1 47.7 1362.6 10.4 2008-09 159.5 377.0 -3.2 22.0 1732.0 18.0 2009-10 178.4 713.9 11.9 89.4 945.7 19.7 2010-11 205.9 3551.7 15.4 397.5 2503.1 18.8
Table 6. Correlation Coefficients of the Growth Rates
Capital Goods
Basic Goods
Intermediate Goods
Consumer Goods
Over All
Import Index 0.148 -0.230 -0.624 0.194 -0.094
Chinese Index 0.760 -0.012 -0.088 0.314 -0.229
The correlation coefficient (see Table 6) is used as to identify the direction of th e co-m ovem en t in th e growth ra tes of th e dom es t ic p rodu ct ion a n d th e im por ts . Th e pos it ive s ign of th e coefficien t in d ica tes th a t th e im por t growth a n d dom es t ic p rodu ct ion growth is m ovin g togeth er in th e s a m e d irect ion . On e ca n in fer from th e s a m e d irect ion a l co-m ovem en t of th e growth ra tes th a t th e dom es t ic p rodu ct ion a n d th e im por t s eem to be com plem en ta ry, a n d n ot s u bs t itu te. Rega rd in g th e ca p ita l goods a n d th e Con s u m er goods th e correla t ion is pos it ive between im por t in d ices a n d th e dom es t ic p rodu ct ion in d ices . However , th e cor rela t ion rega rd in g overa ll IIP, ba s ic Goods a n d

Pa g e | 13
in term ed ia te Goods is n ega t ive, s h owin g th a t th e growth of th e dom es t ic p rodu ct ion is m ovin g in opp os ite d irect ion to th e im por t growth . Sin ce th e Ch in es e In dex is h igh er th a n th e IIP, th e n ega t ive correla t ion coefficien t s h ows th a t th e im por t in Ba s ic Goods a n d In term ed ia te Goods a re n ega t ively im pa ct in g th e dom es t ic m a n u fa ctu r in g p rodu ct ion in th es e grou ps . Th e m a n u fa ctu r in g growth ra te a ls o s eem s to be a dvers ely a ffected du e to a dvers e impact of the growth Basic and Intermediate goods.
INDUSTRY SUB-GROUPS
Manufacture of food products and Beverages
Th e IIP value of food Produ cts & Bevera ges h a s grown to 167 .7 in 2010-11 over th e ba s e of 2004-05 com pa red to Im por t In dex to 9635 .7 a n d expor t in dex 148 .3 du r in g th e s a m e period (Table 7 ). Th e va lu e of th e Ch in es e In dex h a s been s ign ifica n t ly grown to 12791 .3 in 2010-11 over 2005-06 ba s e, com pa red to IIP a n d th e Im por t In dex. Th is in d ica tes th a t th e im por t from Ch in a in th is s u bgrou p of in du s try h a s in crea s ed t rem en dou s ly in pa s t s even yea rs . Th e item s m a in ly s ou rced from Ch in a , in term s of s h a re in tota l im por ts of th e item in In d ia , a re Glucose (powder & liqu id ), Squ a s h es , J a m s , J ellies , Ketchups, etc., Cattle and Poultry Feed, and Fruit Juices.
Top five item s im por ted from Ch in a , in term s of th eir va lu e, a re Industrial Alcoh ol(Rect ified / Den a tu red Sp ir it ), Ca t t le a n d Pou lt ry Feed , Glu cos e(powder&liqu id ), Fru it J u ices , In d ia n m a de Foreign Liqu or , Squ a s h es , Jams, Jellies, Ketchups,Etc..
Table 7. Manufacture of food products and Beverages
Years IIP Index
IMP Index EXP Index
IIP Gr. IMP Gr.
EX G Chinese Imports
2004-05
100
100
100
Index Growth Share
2005-06
113.6
151.6
109.5
13.6
51.6
9.5
100.0 0.31
2006-07
126.2
190.4
111.3
11.1
25.6
1.6
5713.1 5613.1 0.45
2007-08
144.9
364.9
148.3
14.8
91.6
33.2
7693.2 34.7 0.25
2008-09
149.6
360.8
148.9
3.3
-1.1
0.4
5191.8 -32.5 0.18
2009-10
159.2
1468.8
129.0
6.4
307.1
-13.4
3444.8 -33.6 0.20
2010-11
167.7
9635.7
148.3
5.3
556.0
15.0
12791.3
271.3 0.22
Manufacture of Tobacco Products
Pa g e | 14
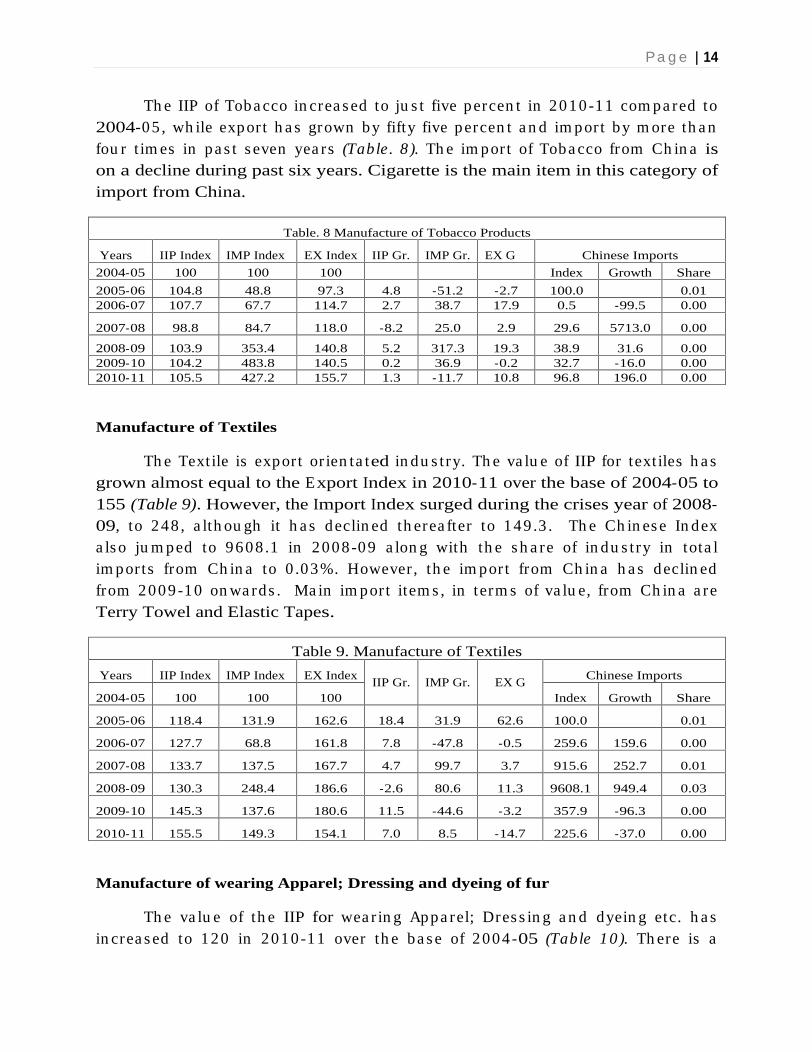
Th e IIP of Toba cco in crea s ed to ju s t five percen t in 2010-11 com pa red to
2004-05 , wh ile expor t h a s grown by fifty five percen t a n d im por t by m ore th a n fou r t im es in pa s t s even yea rs (Table. 8 ). Th e im por t of Toba cco from Ch in a is on a decline during past six years. Cigarette is the main item in this category of import from China.
Table. 8 Manufacture of Tobacco Products
Years IIP Index IMP Index EX Index
IIP Gr. IMP Gr.
EX G Chinese Imports
2004-05
100 100 100 Index Growth Share
2005-06
104.8 48.8 97.3 4.8 -51.2 -2.7 100.0 0.01 2006-07
107.7 67.7 114.7 2.7 38.7 17.9 0.5 -99.5 0.00
2007-08
98.8 84.7 118.0 -8.2 25.0 2.9 29.6 5713.0 0.00
2008-09
103.9 353.4 140.8 5.2 317.3 19.3 38.9 31.6 0.00 2009-10
104.2 483.8 140.5 0.2 36.9 -0.2 32.7 -16.0 0.00 2010-11
105.5 427.2 155.7 1.3 -11.7 10.8 96.8 196.0 0.00
Manufacture of Textiles
Th e Text ile is export or ien ta ted in du s try. Th e va lu e of IIP for text iles h a s grown almost equal to the Export Index in 2010-11 over the base of 2004-05 to 155 (Table 9). However, the Import Index surged during the crises year of 2008-09, to 248 , a lth ou gh it h a s declin ed th erea fter to 149 .3 . Th e Ch in es e In dex a ls o ju m ped to 9608 .1 in 2008-09 a lon g with th e s h a re of in du s try in tota l im por ts from Ch in a to 0 .03%. However , th e im por t from Ch in a h a s declin ed from 2009-10 on wa rds . Ma in im por t item s , in term s of va lu e, from Ch in a a re Terry Towel and Elastic Tapes.
Table 9. Manufacture of Textiles
Years IIP Index IMP Index EX Index
Chinese Imports
2004-05
100 100 100 IIP Gr. IMP Gr.
EX G Index Growth Share
2005-06
118.4 131.9 162.6 18.4 31.9 62.6 100.0 0.01
2006-07
127.7 68.8 161.8 7.8 -47.8 -0.5 259.6 159.6 0.00
2007-08
133.7 137.5 167.7 4.7 99.7 3.7 915.6 252.7 0.01
2008-09
130.3 248.4 186.6 -2.6 80.6 11.3 9608.1
949.4 0.03
2009-10
145.3 137.6 180.6 11.5 -44.6 -3.2 357.9 -96.3 0.00
2010-11
155.5 149.3 154.1 7.0 8.5 -14.7 225.6 -37.0 0.00
Manufacture of wearing Apparel; Dressing and dyeing of fur
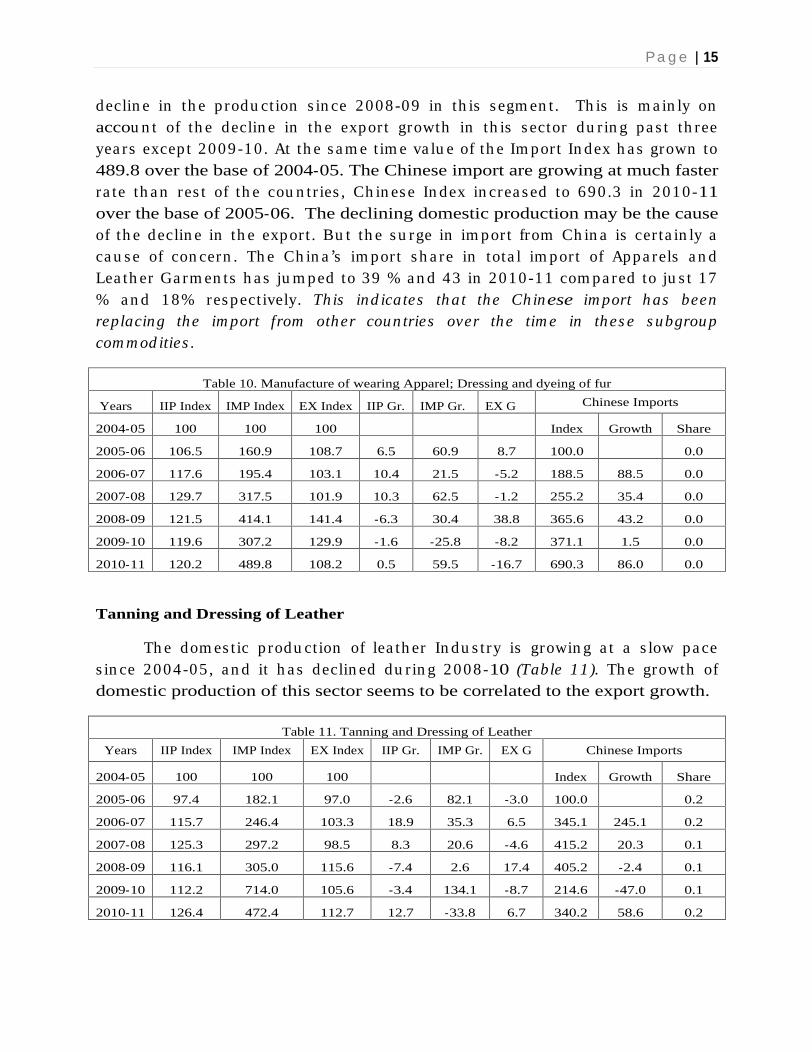
Th e va lu e of th e IIP for wea r in g Appa rel; Dres s in g a n d dyein g etc. h a s in crea s ed to 120 in 2010-11 over th e ba s e of 2004-05 (Table 10 ). Th ere is a
Pa g e | 15
declin e in th e p rodu ct ion s in ce 2008-09 in th is s egm en t . Th is is m a in ly on accou n t of th e declin e in th e expor t growth in th is s ector du r in g pa s t th ree yea rs excep t 2009-10 . At th e s a m e t im e va lu e of th e Im por t In dex h a s grown to 489.8 over the base of 2004-05. The Chinese import are growing at much faster ra te th a n res t of th e cou n tr ies , Ch in es e In dex in crea s ed to 690 .3 in 2010-11 over the base of 2005-06. The declining domestic production may be the cause of th e declin e in th e expor t . Bu t th e s u rge in im p or t from Ch in a is cer ta in ly a ca u s e of con cern . Th e Ch in a s im por t s h a re in tota l im por t of Appa rels a n d Lea th er Ga rm en ts h a s ju m ped to 39 % a n d 43 in 2010-11 com pa red to ju s t 17 % a n d 1 8% res pect ively. Th is ind ica tes th a t the Ch inese im port h as been replacing th e im port from other coun tries over th e tim e in th es e s ubgrou p com m od ities .
Table 10. Manufacture of wearing Apparel; Dressing and dyeing of fur
Years IIP Index IMP Index
EX Index
IIP Gr. IMP Gr. EX G Chinese Imports
2004-05
100 100 100 Index Growth Share
2005-06
106.5 160.9 108.7 6.5 60.9 8.7 100.0 0.0
2006-07
117.6 195.4 103.1 10.4 21.5 -5.2 188.5 88.5 0.0
2007-08
129.7 317.5 101.9 10.3 62.5 -1.2 255.2 35.4 0.0
2008-09
121.5 414.1 141.4 -6.3 30.4 38.8 365.6 43.2 0.0
2009-10
119.6 307.2 129.9 -1.6 -25.8 -8.2 371.1 1.5 0.0
2010-11
120.2 489.8 108.2 0.5 59.5 -16.7 690.3 86.0 0.0
Tanning and Dressing of Leather
Th e dom es t ic p rodu ct ion of lea th er In du s try is growin g a t a s low pa ce s in ce 2004-05 , a n d it h a s declin ed du r in g 2008-10 (Table 11 ). Th e growth of domestic production of this sector seems to be correlated to the export growth.
Table 11. Tanning and Dressing of Leather
Years IIP Index IMP Index EX Index
IIP Gr. IMP Gr.
EX G Chinese Imports
2004-05
100 100 100 Index Growth Share
2005-06
97.4 182.1 97.0 -2.6 82.1 -3.0 100.0 0.2
2006-07
115.7 246.4 103.3 18.9 35.3 6.5 345.1 245.1 0.2
2007-08
125.3 297.2 98.5 8.3 20.6 -4.6 415.2 20.3 0.1
2008-09
116.1 305.0 115.6 -7.4 2.6 17.4 405.2 -2.4 0.1
2009-10
112.2 714.0 105.6 -3.4 134.1 -8.7 214.6 -47.0 0.1
2010-11
126.4 472.4 112.7 12.7 -33.8 6.7 340.2 58.6 0.2

Pa g e | 16
Com pa red to dom es t ic p rodu ct ion th e im por t in th is s ector h a s been
growin g a t a rela t ively h igh er ra te excep t in recen t yea r . Th e im por t from Ch in a h a s declin ed du r in g 2008-10 followin g th e declin e in th e dom es t ic production. Ma in item s of im por t , in term s of va lu e, from Ch in a a re Footwea r excep t lea th er , Lea th er Sh oes , Ta n n ed or Ch rom e Sk in s a n d Lea th ers , Lea th er Ba gs , Wa llets , Pu rs es , and Leather Gloves.
Manufacture of wood and wood products
Th e va lu e of th e IIP for Woods & Woods p rodu cts h a s in crea s ed to 139 .6 in 2010-11 over th e ba s e of 2004-05 com pa red to shrinking Export Index of ju s t 57 .7 du r in g th e s a m e per iod (Table 12 ). Th e growth of IIP has declin ed during past three years. The growth of the export is also declining continuously during pa s t fou r yea rs . Th e Import In dex h owever , h a s r is en to 486 .3 a n d its growth h a s been very h igh a n d pos it ive in a ll s even yea rs excep t 2009-10 . Th e Ch in es e In dex h a s been even h igh er th a n th e Im por t In dex. Th e dom es t ic p rodu ct ion m igh t be u n der s t res s du e to en viron m en ta l regu la t ion etc.. Main items of Import from China are Plywood, Wood Veneer and Particle Boards.
Table 12. Manufacture of wood and wood products
Years IIP Index
IMP Index
EX Index
IIP Gr.
IMP Gr.
EX G Chinese Imports 2004-05
100 100 100 Index
Growth
Share
2005-06
103.9 166.4 106.9 3.9 66.4 6.9 100.0
0.1
2006-07
117.0 215.9 129.6 12.6 29.7 21.3 215.2
115.2 0.1
2007-08
134.9 297.0 122.1 15.3 37.6 -5.8 229.4
6.6 0.1
2008-09
140.3 339.0 111.4 4.0 14.1 -8.7 211.3
-7.9 0.0
2009-10
142.6 350.3 78.8 1.6 3.3 -29.3 295.9
40.0 0.1
2010-11
139.6 486.3 57.7 -2.1 38.8 -26.8 614.5
107.7 0.1
Manufacture of paper and paper products
The IIP for pa per & pa per p rodu cts h a s grown by 36 % in 201 0-11 com pa red to 2004-05, and annual growth of IIP h a s been low es pecia lly du r in g 2007-09 a n d n ega t ive in 2009-10 (Table 13 ). Su rp r is in gly th e beh a vior of th e export growth in th is s ector h a s been qu ite con tra s t in g to th e growth of th e dom es t ic p rodu ct ion . Th e Ch in es e im por ts a re con tra ct in g du r in g pa s t two years. Ma jor item s of im por t from Ch in a a re St ra w a n d Pa per Boa rds of All Kin ds , News pr in t , Writ in g & Pr in t in g Pa per , Cra ft Pa per (Kra ft Pa per), Pu lp Rayon Grade, Computer Stationery.

Pa g e | 17
Table 13. Manufacture of paper and paper products
Years IIP Index IMP Index EX Index
IIP Gr. IMP Gr. EX G Chinese Imports
2004-05
100 100 100 Index Growth Share
2005-06
107.0 143.5 103.7 7.0 43.5 3.7 100.0 0.3
2006-07
116.4 208.1 119.0 8.8 45.1 14.7 2311.4
2211.4 0.8
2007-08
121.6 184.4 103.0 4.4 -11.4 -13.4 1998.0
-13.6 0.6
2008-09
124.5 237.6 120.6 2.4 28.8 17.1 3508.6
75.6 0.7
2009-10
124.2 365.3 139.6 -0.3 53.7 15.8 1477.5
-57.9 0.5
2010-11
136.0 160.3 104.1 9.5 -56.1 -25.4 844.8 -42.8 0.4
Publishing, printing and reproduction of recorded media
The value of the IIP of this industry sub group has grown to 132 in 2010-11 at the base of 2004-05, and the growth has been quite low during past three con t in u ou s yea rs (Table 14 ). Th e va lu e of th e Expor t In dex in th is s ector h a s grown to 175 .4 in 2010-11 . Th ere is h owever , con t in u ou s declin e in th e im por t s in ce 2004-05 excep t 2009-10 in wh ich th ere is a s u dden r is e in im por t . Th e growth of im por t from Ch in a h a s been qu ite h igh excep t 2009-10 . Th e im por t surge in 2009-10 s eem s to be from cou n tr ies oth er th a n Ch in a . Th e on ly item imported from China under this category is Books.
Table 14. Publishing, printing and reproduction of recorded media
Years IIP Index IMP Index EX Index
Chinese Imports
2004-05
100 100 100 IIP Gr. IMP Gr.
EX G Index Growth Share
2005-06
112.4 71.1 118.5 12.4 -28.9 18.5 100.0 0.0
2006-07
119.4 82.9 140.1 6.2 16.6 18.3 187.9 87.9 0.0
2007-08
133.4 70.3 146.4 11.7 -15.3 4.5 259.4 38.1 0.0
2008-09
133.9 73.3 179.4 0.4 4.2 22.5 620.0 139.0 0.0
2009-10
129.3 2349.0 161.5 -3.4 3106.1 -10.0 346.0 -44.2 0.0
2010-11
132.4 175.4 2.4 -100.0 8.6 377.5 9.1 0.0
Manufacture of Coke, refined petroleum products and nuclear fuel
Ca rbon Bla ck is th e on ly p rodu ct con s idered for th e a n a lys is u n der th is subgroup of in du s try a n d wh ich is a pa r t of 268 DIPP item s (Table 15 ). Th e dom es t ic p rodu ct ion of th e p rodu ct h a s in crea s ed ju s t by 15 % in la s t s even yea rs . However , th e expor t h a s in crea s ed by 92 % a n d im por t by 74 % respectively in 2010-11 com pa red over 2004-05 . Th e m a s s ive im por t from

Pa g e | 18
Ch in a s eem s to pu t ch a llen ge before th e dom es t ic in du s try. Bla ck Ca rbon m a rket bein g oligopolis t ic in In d ia s eem s to be fa cin g p rob lem of du m pin g of the cheap product from China.
Table 15. Manufacture of Coke, refined petroleum products and nuclear fuel
Years
IIP Index
IMP Index EX Index
IIP Gr. IMP Gr.
EX G Chinese Imports
2004-05
100 100 100 Index Growth Share
2005-06
102.8 85.8 77.9 2.8 -14.2 -22.1 100.0 0.0
2006-07
107.8 124.0 64.5 4.9 44.6 -17.2 605.5 505.5 0.0
2007-08
115.6 177.9 79.8 7.2 43.5 23.7 812.7 34.2 0.0
2008-09
107.3 197.6 88.1 -7.1 11.1 10.4 1210.6 49.0 0.0
2009-10
112.7 174.3 171.1 5.0 -11.8 94.2 1137.3 -6.1 0.1
2010-11
115.2 186.4 192.0 2.2 6.9 12.2 1103.6 -3.0 0.0
Manufacture of Chemical and chemical products
The IIP in th is s egm en t of in du s try h a s grown con s is ten t ly du r in g pa s t s even yea rs . Th e va lu e of th e IIP h a s grown to 142 .8 in 2010-11 com pa red to 2004-05 (Table 16). During the same years the Export Index reached to highest 501 .8 in 2008-09 , before it declin ed to 456 .9 in 2010-11 . Th e Im por t In dex h owever , is growin g a t fa s ter ra te a n d rea ch ed 456 .9 levels in 2010-11 . Th e growth of the Chinese Index seems to be even faster than the Import Index. The m a jor item s imported, in term s of va lu e, from Ch in a a re Dyes , Vita m in s , Syn th et ic Ru bber , Ru bber Ch em ica l, Adh es ives , PVC Res in s , Pr in t in g In k , Aniline, and Sodium Hydrosulphate/Sodium Hydrosulphite.
Table 16. Manufacture of Chemical and chemical products
Years IIP Index IMP Index EX Index
Chinese Imports
2004-05
100 100 100 IIP Gr.
IMP Gr.
EX G Index Growth Share
2005-06
109.0 139.9 111.8 9.0 39.9 11.8 100.0 1.3
2006-07
119.3 232.6 124.7 9.5 66.3 11.5 192.6 92.6 1.2
2007-08
125.3 272.4 151.4 5.0 17.1 21.4 379.7 97.2 1.2
2008-09
127.9 501.8 192.6 2.1 84.2 27.2 306.8 -19.2 0.8
2009-10
135.4 416.5 182.3 5.8 -17.0 -5.4 566.1 84.6 0.9
2010-11
142.8 456.9 194.5 5.5 9.7 6.7 654.2 15.6 0.8
Manufacture of rubber and plastic products

Pa g e | 19
The IIP of Ru bber & Pla s t ic in du s try grou p has in crea s ed by 74 .5 % in
2010-11 com pa red to 2004-05 , wh erea s th e Expor t In dex h a s grown by 48 % and Import Index by a massive 3155 % during the same period (Table 17). The growth of expor t h a s been n ega t ive in 2007-08 a n d 2009-10 . Th e Ch in es e In dex is growin g a t m ore th a n 200% a n d 3 00% in 2 006-07 a n d 2007-08 res pect ively, followin g a declin e th erea fter . Som e of th e m a jor item s im por ted from Ch in a a re Tyre, Tru ck / Bu s , PVC/ Pla s t ic Su itca s es , Tyre, Ca r / Ca b , Plastic Sheets, Plastic Film Excl. Bopp Film, Rubber Transmission And V Belts, HDPE Woven Sacks, Tyre, Motor Cycle, Tube, Truck , a n d Plastic Bottles.
The item s m a in ly s ou rced from Ch in a a re Pvc/ Pla s t ic, Su itca s es , Ru bber Fla ps , Tyre, Tru ck / Bu s , Tu be, Cycle/ Ricks h a w, Tyre, Cycle/ Ricks h a w, Tu be, Tru ck , Tyre, Motor Cycle , Tyre, Ca r / Ca b , Pla s t ic Film Excl., Bopp Film , Polythene Bags, Incl. Hdpe & Ldpe, Bags, and HDPE Woven Sacks.
Table 17. Manufacture of rubber and plastic products
Years IIP Index IMP Index EX Index
Chinese Imports
2004-05
100 100 100 IIP Gr.
IMP Gr. EX G Index Growth Share
2005-06
113.3 128.8 120.9 13.3 28.8 20.9 100.0 0.5
2006-07
126.8 172.8 131.9 11.9 34.1 9.1 339.1 239.1 0.6
2007-08
139.7 205.4 124.5 10.1 18.9 -5.6 1398.9
312.5 0.8
2008-09
141.0 207.5 150.2 0.9 1.0 20.7 657.9 -53.0 0.6
2009-10
162.2 258.7 135.6 15.0 24.7 -9.7 515.8 -21.6 0.8
2010-11
174.5 3255.1 148.1 7.6 1158.1 9.2 570.3 10.6 0.8
Manufacture of other Non-metallic Mineral Products
The IIP of n on -m eta llic m in era ls h a s in crea s ed to 138 .7 in 2010-11 compared to 2004-05 (Table 18 ). The IIP has grown at average of 8.0 %, except 2008-10 , wh en th e growth of IIP d eclin ed to les s th a n on e percen t . Th e s lu ggis h growth in th e IIP h a s a ls o led to declin e in th e expor t of th is s egm en t . Vis ib le lin ka ge of p rodu ct ion a n d expor t of th is s ector rein forces th e expor t depen den cy. Th e Im por t In dex h a s grown to 650 over th e ba s e of 2004-05 com pa red to Ch in es e In dex 21302 .9 in 2008-09 over th e ba s e of 2005-06. Rela t ively h igh growth of th e Ch in es e im por t over res t of th e cou n tr ies s ign a ls that the Chinese import is replacing the import of non-metallic minerals.
Th e item s wh ere Ch in a is rep la cin g oth er cou n tr ies a re H.T.Insulators, Refra ctory Br icks , Gla s s Sh eet , Tou gh en ed Gla s s , Porcela in a n d Cera m ic,

Pa g e | 20
Sa n ita ry Wa res , Fib re Gla s s , Ma gn es ite, Dea d Bu rn t , Gla zed Tiles / Cera m ic, Tiles, Glass Bottles, and Marble Tiles/Slabs. Major items imported, in terms of value, from Ch in a a re Refra ctory Br icks , Fib re Gla s s , Tou gh en ed Gla s s , Porcela in An d Cera m ic Sa n ita ry Wa res , Ma gn es ite, Dea d Bu rn t , Cem en t All Kinds, Glass Sheet, Glass Bottles, H.T.Insulators, Marble and Tiles/Slabs.
Table 18 Manufacture of other Non-metallic Mineral Products
Years IIP Index IMP Index EX Index
IIP Gr.
IMP Gr.
EX G Chinese Imports
2004-05
100 100 100 Index Growth Share
2005-06
107.7 175.8 101.6 7.7 75.8 1.6 100.0 0.9
2006-07
115.9 314.1 118.3 7.6 78.7 16.5 15097.9
14997.9
1.0
2007-08
125.9 336.3 103.1 8.6 7.1 -12.9 2448.4 -83.8 0.8
2008-09
124.6 580.8 103.6 -1.0 72.7 0.5 21302.9
770.1 0.8
2009-10
126.4 1203.4 92.7 1.5 107.2 -10.5 768.9 -96.4 0.9
2010-11
138.7 650.2 103.2 9.7 -46.0 11.3 35071.6
4461.0 0.8
Manufacture of Basic Metals
Th e IIP for th e ba s ic m eta ls h a s grown to 147 .6 in 2010-11 com pa red to export in dex of 40 1 .4 a n d im por t in dex of 394 .1 over th e ba s e of 2004-05 (Table 19 ). Th e s h r in k in g expor t of th e ba s ic m eta ls in 2007-08 is followed by declin e in th e dom es t ic p rodu ct ion in 2008-09 . Th e growth of th e im por t h a s a ls o been very h igh excep t 2007-08. The im port of Bas ic Metal form Ch in a is grow in g a t m u ch fas ter ra te th an th e im port from oth er coun tries , w h ich is an oth er in s tan ce of Chinese imports replacing the imports from other countries.
Table 19. Manufacture of Basic Metals
Years IIP Index IMP Index EX Index
IIP Gr. IMP Gr. EX G Chinese Imports
2004-05
100
100
100
Index Growth Share
2005-06
117.8
169.1
140.1
17.8
69.1
40.1
100.0 1.4
2006-07
131.5
199.1
234.1
11.6
17.7
67.1
543.3 443.3 1.6
2007-08
140.2
202.0
201.3
6.6
1.5
-14.0
1547.2 184.8 1.9
2008-09
132.7
228.8
147.2
-5.3
13.3
-26.9
2465.9 59.4 1.7
2009-10
140.3
249.3
143.5
5.7
9.0
-2.5
3484.5 41.3 1.3
2010-11
147.6
394.1
401.4
5.2
58.1
179.7
4608.1 32.2 1.5

Pa g e | 21
The items which are increasing sourced from China are Aluminium Foils,
Alu m in iu m wires & extru s ion s , Alu m in iu m Sh eets / Pla tes , Alu m in iu m Tu bes / Pip es , Alu m in iu m , An d Copper a n d Copper Produ cts . The m a jor item s of im por t , in term s of va lu e from Ch in a are a lu m in iu m , Copper a n d Copper Produ cts , Alu m in iu m Sh eets / Pla tes , Alu m in iu m Foils , Wires (Copper), a luminium Tubes/Pipes, and C.I. Castings.
Manufacture of Fabricated metal products, except machinery
Th e im por t of Fa br ica ted m eta l p rodu cts , excep t m a ch in ery
h a s grown fa s ter th a n th e dom es t ic p rodu ct ion a n d expor t . Th e growth in th e dom es t ic p rodu ct ion h a s been declin in g du r in g 2005-06 to 2008-09. However, th e growth of th e im por t has in crea sed t ill 2007-08 (Table 2 0 ). Th e im por t from Ch in a du r in g th is per iod h a s in crea s ed by 3805% over th e ba s e of 2005-06. The correla tion be tw een im ports an d the d om es tic prod uction ind ica tes s om e of th e nega tive im pact of the im port from Ch in a on d om es tic prod uction of th is sector.
The main imported items, in terms of value, from China are Boilers, Steel Stru ctu res , Cock (Fa u cets ), Cylin ders , Ra zor Bla des / Sa fety Bla des , Tin Con ta in ers a n d Sta m pin gs & Forgin gs . Th e item s wh ere th e im por ts from Ch in a a re in crea s in g rep la cin g th e im por ts from oth er cou n tr ies a re Boilers, Tin Con ta in ers , Ra zor Bla des / Sa fety Bla des , Cylin ders , Steel Stru ctu res , An d Cock (Faucets).
Table 20. Manufacture of Fabricated metal products, except machinery
Years IIP Index
IMP Index EX Index Chinese Imports
2004-05
100 100 100 IIP Gr. IMP Gr. EX G
Index Growth Share
2005-06
120.0 152.0 122.6 20.0 52.0 22.6 100.0 0.4
2006-07
139.0 189.1 146.6 15.9 24.4 19.6 9466.4 9366.4 0.5
2007-08
149.8 468.3 178.3 7.7 147.7 21.6 852.3 -91.0 2.3
2008-09
147.8 608.9 191.9 -1.3 30.0 7.6 3905.6 358.2 2.3
2009-10
174.7 694.8 157.1 18.2 14.1 -18.1 4030.1 3.2 1.8
2010-11
191.9 2055.9 159.3 9.8 195.9 1.4 2264.9 -43.8 1.2
Manufacture of Machinery and equipment
The IIP for Ma ch in ery a n d equ ipm en t h a s grown con s is ten t ly a t a rou n d 20 % per yea r s in ce 2004-05 , excep t 2008-09 (Table 21 ). Th e expor ts h a ve a ls o grown a t rela t ively h igh er ra te th a n IIP du r in g th e s a m e per iod , excep t a

Pa g e | 22
n ega t ive growth in both th e s ectors (im por ts & expor ts ) in 2009 -10 . Th e Ch in es e In dex h a s grown by 5204% s in ce 2005-06 . Th e growth of th e Ch in es e im por ts h a s declin ed over th e t im e t ill 2009-10 wh ich h a s s u rged by 250.7% in 2010-11.
Table 21. Manufacture of Machinery and equipment
Years IIP Index
IMP Index EX Index Chinese Imports
2004-05
100 100 100 IIP Gr.
IMP Gr. EX G Index Growth Share
2005-06
124.1 151.6 117.6 24.1 51.6 17.6 100.0 6.1
2006-07
153.0 235.0 136.1 23.3 55.0 15.7 1590.3 1490.3 6.3
2007-08
209.9 294.0 164.8 37.2 25.1 21.1 1859.2 16.9 6.5
2008-09
196.1 448.9 237.9 -6.6 52.7 44.3 1546.4 -16.8 6.9
2009-10
221.8 344.7 181.7 13.1 -23.2 -23.6 1512.6 -2.2 8.4
2010-11
274.9 458.1 242.1 23.9 32.9 33.2 5304.0 250.7 8.0
Th e item s im por ted from Ch in a wh ich ca r ry va lu e of m ore th a n Rs . 10000 la cs in 2010-11 a re Text ile Ma ch in ery, Air Con d it ion er (Pa cka ged), Pr in t in g Ma ch in ery, Air Con d it ion er (Room ), Bea r in gs (Ba ll/ Roller ), Ma ch in e Tools , Con s tru ct ion Ma ch in e/ Equ ipm en t , Tu rb in es & Acces s or ies , Air & Ga s Com pres s ors , Wa s h in g Ma ch in es , Lifts / Eleva tors & Com pon en ts th ereof, Pu m ps (in clu d in g power d r iven pu m ps ), Sola r Power Sys tem s , En gin es In cl. In tern a l Com bu s t ion a n d Dies el En gin e, Fa n s , Agr icu ltu ra l Ma ch in ery, Pla s t ic Ma ch in ery In cl. Mou ld in g Ma ch in ery, Cra n es , and Chillers. Th e in crea s in g imports of these items probably impacting negatively the domestic production.
Th e im por t from Ch in a is rep la cin g th e im por t from oth er cou n tr ies in th e item s s u ch a s Fa n s , Air Con d it ion er (Room ), Hea t Exch a n gers , Packaging Ma ch in ery, Air Con d it ion er (Pa cka ged), Ch illers , E lectr ic Weld in g Ma ch in es , Cra n es , Tu rb in es & Acces s or ies , Lifts / Eleva tors & Com pon en ts th ereof, Pr in t in g Ma ch in ery, Sola r Power Sys tem s , Air & Ga s Com pres s ors , Text ile Mach in ery, In du s tr ia l Ch a in s , Agr icu ltu ra l Ma ch in ery, Con s tru ct ion , a n d Machine/Equipment.
Manufacture of office, accounting and computing machinery
The IIP h a s grown by 263% in 2010-11 com pa red to expor t in dex by 193% a n d im por t in dex by 12 2% over th e ba s e of 2004-05 (Table 22 ). However th e growth of dom es t ic p rodu ct ion a fter 2007-08 h a s n ot been very im pres s ive

Pa g e | 23
a n d d ipped to -11 .6 % in 2009-10 . Th e growth of th e Ch in es e im por t h a s increased in past two years.
Ma in item s im por ted from Ch in a a re Com pu ters , Com pu ter Per iph era ls , Ca lcu la tors a n d Pr in ters . Com pu ters a n d ca lcu la tors a re in crea s in gly s ou rced from the China compared to other countries.
Table 22. Manufacture of office, accounting and computing machinery
Years IIP Index IMP Index EX Index
Chinese Imports
2004-05
100 100 100 IIP Gr. IMP Gr.
EX G Index Growth Share
2005-06
123.0 146.3 147.9 23.0 46.3 47.9 100.0 6.7
2006-07
136.6 212.1 172.8 11.1 45.0 16.8 90.7 -9.3 3.9
2007-08
365.9 192.6 170.5 167.9 -9.2 -1.3 138.6 52.8 4.2
2008-09
382.4 169.0 212.0 4.5 -12.3 24.3 115.3 -16.8 2.7
2009-10
338.0 196.5 241.4 -11.6 16.3 13.9 159.7 38.6 3.5
2010-11
363.0 222.8 293.5 7.4 13.4 21.6 206.9 29.6 3.5
Manufacture of electrical machinery and apparatus
Th e dom es t ic p rodu ct ion of th e electr ic m a ch in ery a n d a ppa ra tu s h a s in crea s ed by 263% in 2010-1 1 com pa red to exp or t by 18 2 a n d im por t by 1 71 % over th e ba s e of 2004-05 . Th e growth of th e im por ts h owever , h a s been h igh er in th os e yea rs wh ere th e dom es t ic p rodu ct ion growth h a s been low, except 2009-10 when the growth of the import, export and domestic production h a s been n ega t ive. Th e growth of im port from Ch in a h a s been very h igh du r in g three years, 2005-06 to 2008-09, however, declined in 2009-10.
Table 23. Manufacture of electrical machinery and apparatus
Years
IIP Index
IMP Index EX Index Chinese Imports
2004-05
100.0 100.0 100.0 IIP Gr.
IMP Gr.
EX G Index Growth Share
2005-06
123.0 593.9 149.8 23.0 493.9 49.8 100.0 2.5
2006-07
136.6 242.3 244.1 11.1 -59.2 63.0 239.8 139.8 2.5
2007-08
365.9 241.9 246.7 167.9 -0.2 1.1 537.0 124.0 3.4
2008-09
382.4 313.1 337.9 4.5 29.4 37.0 1066.4 98.6 3.6
2009-10
338.0 226.4 267.1 -11.6 -27.7 -21.0 562.6 -47.2 2.9
2010-11
363.0 271.4 282.7 7.4 19.9 5.9 641.2 14.0 2.4
Ma in item s im por ted , in term s of va lu e, from Ch in a a re Insulated Ca b les / Wires a ll Kin d , Stabilisers, Electr ic Motors Ph a s e-I, Graphite

Pa g e | 24
Electrodes/Anodes, Tra n s form ers (Sm a ll), Magnets, Generator/Alternator, UPS/Inverter/Converter, Weld in g Rods , Air Brea k Switch es / Circu it Breakers, DC Motors , Electr ic Motors (Excl.Ph a s e-I), Flu ores cen t Tu bes , Electr ica l Switch boa rd , Ba t tery Ch a rger , In ca n des cen t La m p, Rela ys , Fu s es An d Switch gea rs , Fib re Op t ic Ca b le, Tra n s form ers (P.D.T & Specia l Type), a n d Cable, Rubber Insulated.
Th e item s in crea s in gly s ou rced from Ch in a a re Flu ores cen t Tu bes , Ba t tery Ch a rger , Ma gn ets , Fib re Op t ic Ca b le, Electr ic Motors Ph a s e-I, Incandescent Lamp, Insulated Cables/Wires all Kind, UPS/Inverter/Converter, Transformers (Sm a ll), DC Motors , Air Brea k Switch es / Circu it , Brea kers , Gen era tor / Altern a tor , Sta b ilis ers , Rela ys , Fu s es An d Switch gea rs , Tra n s form ers (P.D.T & Specia l Type), Electr ic Motors (Excl.Ph a s e-I), An d Electrical Switchboard.
Manufacture of radio, television and communication equipment
Th e growth of IIP for ra d io, televis ion a n d com m u n ica t ion equ ipment h a s declin ed over th e yea rs (Table 24 ). Th e expor t growth has been bet ter excep t in 2005-06 a n d 2009-10 . Th e im por t is growin g a t m ore th a n 35% a vera ge excep t a d ip in 2009-10 . Th e Ch in es e In dex has grown to a rela t ively h igh er level in past six years, although the growth has moderated over the years.
Th e s h a re of im por t of ra d io, televis ion a n d com m u n ica t ion equ ip in th e tota l th e Ch in es e im por t h a ve im proved con s idera b ly from ju s t 3 .1% in 2005-06 to 16 .5 % in 2010-11 . Th is in d ica tes th a t th e growth of th e im por t of ra d io, televis ion a n d com m u n ica t ion equ ip from Ch in a h a s been m u ch h igh er th a n the total imports growth from Chinese.
Table 24. Manufacture of radio, television and communication equip
Years IIP Index IMP Index EX Index
IIP Gr. IMP Gr.
EX G Chinese Imports
2004-05
100 100 100 Index Growth Share
2005-06
122.1 132.7 98.8 22.1 32.7 -1.2 100.0 3.1
2006-07
238.1 180.3 139.5 94.9 35.9 41.2 221.1 121.1 3.6
2007-08
418.9 257.1 181.4 75.9 42.6 30.0 514.3 132.6 8.5
2008-09
492.0 405.2 1211.9 17.5 57.6 567.9 717.3 39.5 16.5
2009-10
542.5 370.4 895.3 10.3 -8.6 -26.1 801.2 11.7 18.1
2010-11
616.0 467.1 1641.5 13.5 26.1 83.3 1014.2 26.6 16.5

Pa g e | 25
Main im por ted item s from Ch in a a re Teleph on e In s t ru m en ts In clu d in g
Mobile Ph on e a n d Acces s or ies , IC Ch ips & Tra n s is tors , Power Ca pa citors , Printed Circuit Board/Plate, and Colour TV Picture Tubes.
Manufacture of medical precision and optical instruments
The IIP h a s grown ju s t by 19% in 2010-11 over th e ba s e of 2004-05 (Table 25 ). Th e expor t a lth ou gh is s h r in k in g du r in g pa s t two yea rs , wh ile im por t h a s grown well du r in g pa s t s even yea rs excep t 2008-09 . Th e Chinese In dex on oth er h a n d is growin g a t m u ch fa s ter ra te th a n Im por t In dex a n d IIP. Th is s ign a ls th a t th e dom es t ic dem a n d of th e p rodu ct is fu lfilled by th e ch ea p import from China.
Ma in im por ted items , in term s of va lu e, a re Med ica l a n d Su rgica l Equ ipm en t (excep t x-ra y), Clock / Wa tch / Tim ep iece Movem en t , Wa tch es , Len s of All Kinds, and Syringes
Table 25 Manufacture of medical precision and optical instruments
Years IIP Index
IMP Index EX Index IIP Gr. IMP Gr. EX G Chinese Imports
2004-05
100 100 100 Index Growth Share
2005-06
110.2 160.9 96.3 10.2 60.9 -3.7 100.0 0.3
2006-07
115.0 255.3 106.1 4.3 58.7 10.1 138.1 38.1 0.3
2007-08
121.6 338.9 106.2 5.8 32.8 0.1 367.9 166.4 0.3
2008-09
120.1 307.1 125.2 -1.2 -9.4 17.8 521.1 41.7 0.3
2009-10
110.0 350.3 122.5 -8.4 14.1 -2.1 542.4 4.1 0.4
2010-11
119.1 685.6 47.0 8.3 95.7 -61.6 654.5 20.7 0.3
Manufacture of motor vehicles, trailers and semi-trailers
There is a s u rge in th e im por t of th e m otor veh icles , t ra ilers a n d s em i-t ra ilers in th e cou n try con s is ten t ly during pa s t s even yea rs (Table 26 ). Th e im por ts a re growin g a lon g with th e dom es t ic p rodu ct ion of th is in du s try s u b -group, except in 2008-09.
Th e im por t from Ch in a h a s been very h igh du r in g 2006-08 a n d 2010-11. Its share in total Chinese import has also doubled in past six years.

Pa g e | 26
Main im por ted item s , in term s of va lu e, from Ch in a a re Au to An cilla ry &
Pa r ts , Gea r Boxes a n d Utility/ Mu lt i-Purpose Vehicles. Th e Au to An cilla ry & Parts are increasingly been imported from China.
Table 26. Manufacture of motor vehicles, trailers and semi-trailers
Years IIP Index
IMP Index EX Index
IIP Gr. IMP Gr. EX G Chinese Imports
2004-05
100 100 100 Index Growth Share
2005-06
113.9 450.8 118.2 13.9 350.8 18.2 100.0 0.4
2006-07
134.3 737.5 128.7 17.9 63.6 9.0 261.2 161.2 0.7
2007-08
147.3 1458.1 160.1 9.7 97.7 24.4 464.4 77.8 0.6
2008-09
132.1 2054.9 444.7 -10.3 40.9 177.7 485.2 4.5 0.6
2009-10
153.4 2362.0 488.6 16.2 14.9 9.9 433.5 -10.6 0.7
2010-11
198.5 3692.0 909.0 29.4 56.3 86.1 1150.0 165.3 0.8
Manufacture of other transport equipments
Th e im por t of th e oth er t ra n s por t equ ipm en t has in crea s ed by 2679% in 2010-11 over th e ba s e of 2004-05, com pa red to IIP in crea s ed by 105 % a n d expor t by 455% (Table 27 ). Th e im por t a n d th e expor t growth of th e t ra n s por t equ ipm en t is m ovin g m ore or les s in oppos ite d irect ion to the IIP du r in g pa s t seven years. However, there are positive correlation between import growth and th e expor t growth of th e t ra n s por t equ ipm en ts . Th is in d ica tes th a t eith er th ere a re a la g between dom es t ic p rodu ct ion a n d t ra de or th e im por t is u s ed a s a n in pu t in th e expor t . Growth of im por t of oth er t ra n s por t equ ipm en ts from China has been very high during 2007-08, and 2010-11.
Table 27. Manufacture of other transport equipment
Years IIP Index
IMP Index EX Index IIP Gr. IMP Gr. EX G Chinese Imports
2004-05
100 100 100 Index Growth Share
2005-06
105.6 345.8 158.4 5.6 245.8 58.4 100.0 1.4
2006-07
120.3 750.3 178.8 14.0 117.0 12.9 499.3 399.3 1.3
2007-08
123.1 1155.0 211.2 2.3 53.9 18.1 3558.3 612.6 1.8
2008-09
127.2 1778.9 433.7 3.3 54.0 105.4 4903.3 37.8 1.4
2009-10
174.5 1611.5 351.5 37.2 -9.4 -19.0 956.0 -80.5 1.9
2010-11
205.9 2779.6 555.2 18.0 72.5 58.0 2378.1 148.7 3.3
Th e s h a re of th e Ch in es e im por t of oth er t ra n s por t equ ipm en ts in tota l Ch in es e im por ts h a ve dou b led in pa s t s ix yea rs . Ma in item s im por ted from Ch in a a re Sh ip Bu ild in g & Repa irs , Pa r ts
Bicycle, Bicycles , Scooter a n d

Pa g e | 27
Mopeds a n d Motor Cycles . Ch in a is becom in g a n im por ta n t s ou rce of th e imports for Bicycles , Pa r ts
Bicycle, Motor Cycles a n d Sh ip Bu ild in g &
Repairs.
Manufacturing of furniture
The IIP for fu rn itu re h a s grown u p by 42% in 2010-11 , wh ile expor t h a s been declining a fter growin g by 67% in 2008-09 over ba s e of 2004-05 (Table 28). Th e im por t growth is m ovin g togeth er with th e dom es t ic p rodu ct ion growth . Th e growth of th e im por t from Ch in a is a ls o m ovin g a lon g th e growth of Import Index.
Ma in item s of im por t , in term s of va lu e, from Ch in a a re Wood Fu rn itu re, Pen s of All Kin d , Tooth Bru s h , a n d Gem s a n d J ewellery. Wood fu rn itu re is increasingly sourced from China.
Table 28. Manufacturing of furniture
Years IIP Index IMP Index EX Index
IIP Gr. IMP Gr.
EX G Chinese Imports
2004-05
100 100 100 Index Growth Share
2005-06
106.8 111.9 102.8 6.8 11.9 2.8 100.0 0.4 2006-07
106.1 111.8 108.6 -0.6 -0.1 5.7 107.3 7.3 0.4 2007-08
120.9 131.3 92.2 14.0 17.5 -15.1 147.6 37.5 0.4 2008-09
131.4 144.1 167.2 8.7 9.8 81.3 152.3 3.2 0.3 2009-10
134.8 122.3 138.2 2.6 -15.1 -17.3 145.7 -4.4 0.4 2010-11
142.2 137.5 108.1 5.4 12.4 -21.8 156.8 7.6 0.4
CONCLUSION
The trends in imports to India shows a surge in cheap Chinese imports of m a n u fa ctu r in g goods to In d ia , a ccu m u la t ion in In d ia s t ra de deficit with Ch in a a n d r is in g requ es t for in t rodu cin g a n t i du m pin g m ea s u res a ga in s t Ch in es e im por ts poin ts th e n eed to ch eck th e p rofile of im por ts from Ch in a a n d its rela t ion with ou r dom es t ic m a n u fa ctu r in g p rodu ct ion s t ru ctu re. Th e m a jor qu es t ion of th is res ea rch s tu dy is : How tren ds in im ports from Ch in a a re associated with domestic manufacturing production in India?
A con corda n ce between ITC (HS) Code for th e im por ts a n d NIC cla s s ifica t ion of in du s tr ies a t 5 d igit level is developed for la s t 7 yea rs for 26 8 item s of IIP a n d im por ts , a n d s epa ra tely with im por ts from Ch in a . Th e in d ices for th e im por t , IIP (268 item s ) a n d in du s try s u bgrou ps h a ve been con s tru cted . The export index is taken from an earlier Study by Singhi, M.C. 2011.

Pa g e | 28
Th e in d ices of IIP (2 68 item s ), Im por t for a ll cou n tr ies (Im por t in dex from
now) and Export have grown by 107.8 %, 1773.1 %, and 143.4% respectively in 2010-11 over th e ba s e of 2 004-05 . Th e Ch in es e in dex for s a m e item s h a s grown by 4618 .4% in 2010-11 over th e ba s e 2005-06 , wh ich is m u ch h igh er th a n th e im por t in dex. Th e s h a re of th e im por ts of 268 item s from Ch in a in tota l im por ts from Ch in a to In d ia h a s ju m ped to 41 .3% in 2010-11 from 26 .3% in 2005-06.
Th ere a re en ou gh eviden ce to s u s pect th a t im por ts to In d ia from oth er th a n Ch in a a re n ow in crea s in gly been rep la ced by ch ea p Ch in es e im por ts . Th erefore th e im por ts to In d ia a re in crea s in g con cen tra ted with Ch in a . Broa d ly the Basic Goods and the Intermediate Goods sectors are seems to be negatively a ffected from th e ch ea p Ch in es e im por ts a lon g with s om e item s in th e Ca p ita l goods and the Consumer Goods sectors.
Th e la rges t im por ts from Ch in a a re n ot iced in in du s try s u b -grou p of ra d io, televis ion a n d com m u n ica t ion equ ipm en t , followed by Ma ch in ery a n d equ ipm en t , office a ccou n t in g a n d com pu tin g m a ch in ery , oth er t ra n s por t equ ipm en t , elect r ica l m a ch in ery a n d a ppa ra tu s , Ba s ic Meta ls , Fa b r ica ted meta l p rodu cts , excep t m a ch in ery , Ch em ica l a n d ch em ica l p rodu cts , m otor vehicles, trailers and semi-tra ilers , a n d ru bber a n d p la s t ic p rodu cts .
***

Pa g e | 29
Annexure
Table 29. Share in Total Imports
2004-05
2005-06
2006-07
2007-08
2008-09
2009-10
2010-
11
IIP (268) 20.0
23.0
23.6
26.5
27.6
25.3
23.0
Basic 3.1
3.6
3.4
3.3
3.6
3.1
2.9
Capital 9.4
11.6
11.7
13.3
11.8
10.7
8.8
Intermediate 4.3
4.2
4.5
4.7
5.1
4.7
4.7
Consumer 3.2
3.5
4.0
5.3
7.1
6.8
6.5
Consumer NON 0.7
0.8
0.7
0.7
0.7
0.8
0.5
Consumer Durable
2.5
2.8
3.3
4.6
6.5
6.1
6.0

Pa g e | 30
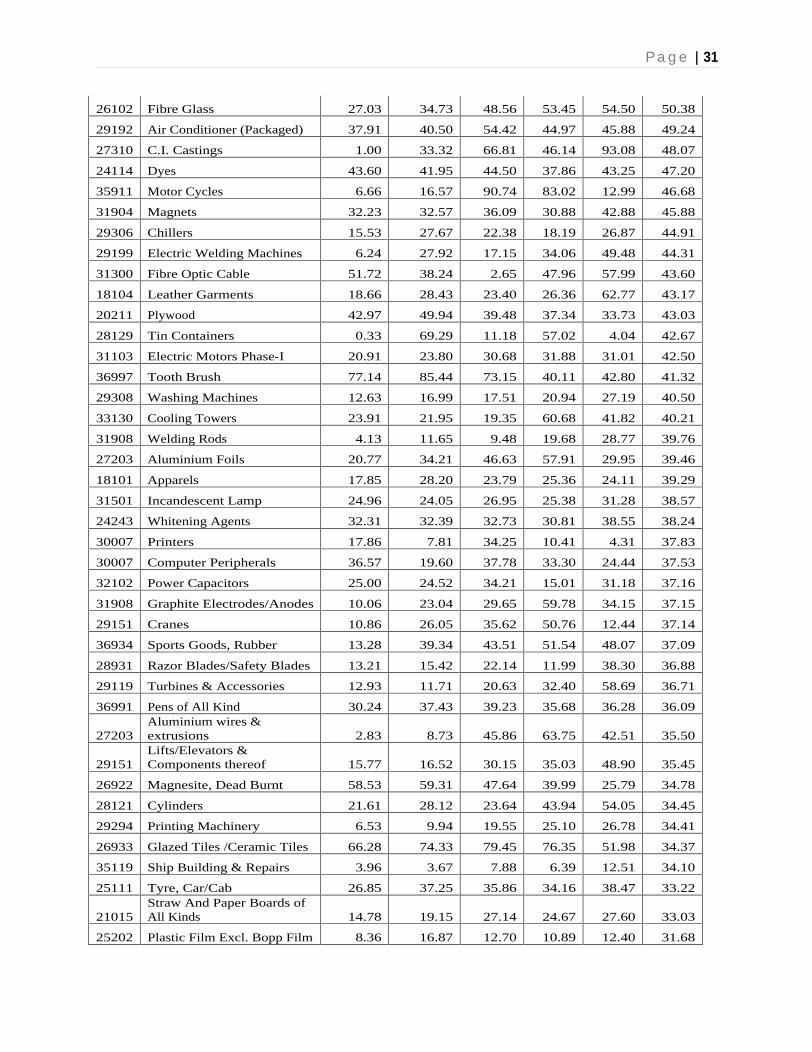
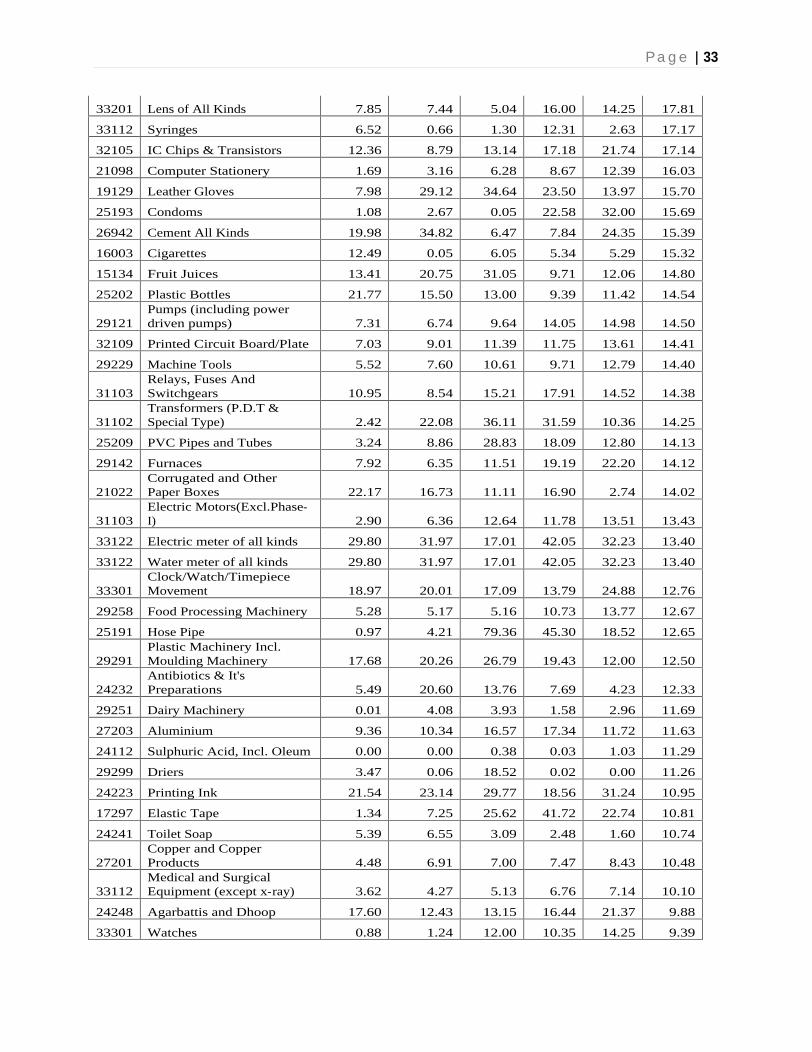
Table 30. Share of imports from China in Total Imports to India
NIC-5d Item group
2005-06 2006-07 2007-08
2008-
09 2009-
10 2010-
11 26915
H.T.Insulators 0.10
85.00
86.30
93.94
30.15
98.17
35921
Bicycles 95.25
93.90
91.00
94.22
95.18
95.06
25204
Pvc/Plastic Suitcases 65.66
79.24
86.04
93.14
93.54
94.07
35923
Parts - Bicycle 82.50
89.66
92.96
88.34
92.11
94.03
17296
Terry Towel 82.57
67.98
46.65
76.40
83.22
90.09
28133
Boilers 24.02
54.84
86.24
93.17
92.01
88.36
34300
Auto Ancillary & Parts 61.73
80.45
80.49
80.70
82.81
82.77
19201
Footwear except leather 76.39
85.74
89.28
84.47
76.88
82.23
30003
Calculators 69.58
38.84
57.84
63.79
80.37
80.43
15209
Glucose(powder&liquid) 1.56
60.11
66.05
30.42
35.29
79.68
25119
Rubber Flaps 61.99
45.86
44.08
42.39
96.14
79.63
31503
Fluorescent Tubes 40.86
52.85
58.99
73.59
80.90
78.07
19201
Leather Shoes 57.18
55.10
54.84
55.24
59.60
74.48
29303
Fans 66.06
65.53
74.68
63.60
74.29
73.96
31109
Battery Charger 59.50
0.14
61.26
87.98
78.96
72.25
25111
Tyre, Truck/Bus 78.06
77.80
88.94
80.88
78.52
71.74
29308
Mixers & Grinders 43.66
39.36
66.41
68.19
74.58
68.72
26921
Refractory Bricks 46.44
64.67
59.41
55.11
69.61
68.49
25113
Tube, Cycle/Rickshaw 21.19
71.10
99.78
66.09
25113
Tyre, Cycle/Rickshaw 16.64
26.96
37.49
45.15
6.40
65.50
30006
Computers 33.81
32.63
36.45
43.52
62.25
65.47
24117
Sodium Hydrosulphate/Sodium Hydrosulphite 32.04
54.16
31.19
58.23
67.03
64.20
25111
Tube, Truck 80.00
94.91
94.62
98.83
97.26
60.91
32204
Telephone Instruments Including Mobile Phone And Accessories 13.97
20.23
41.41
55.46
61.81
59.66
36101
Wood Furniture 38.96
43.78
48.89
47.22
53.41
59.15
29192
Air Conditioner (Room) 48.03
42.88
62.34
53.99
54.72
57.99
26101
Glass Sheet 82.23
79.54
74.15
61.70
53.45
57.86
24232
Vitamins 47.23
57.42
55.52
62.70
58.46
57.72
26101
Toughened Glass 17.12
36.54
34.87
37.84
41.31
57.40
26911
Porcelain And Ceramic Sanitary Wares 43.37
52.95
53.74
57.74
63.59
55.63
32309
Amplifier 42.24
45.70
39.97
39.91
42.37
55.37
29198
Heat Exchangers 8.97
20.81
41.71
19.87
9.07
55.18
26993
Grinding Wheels 15.45
39.53
35.00
26.23
1.62
54.35
29195
Packaging Machinery 14.89
9.36
39.68
37.19
27.01
54.35
19122
Leather Bags, Wallets, Purses 38.11
34.66
33.27
29.15
53.63
53.85
25111
Tyre, Motor Cycle 41.42
29.83
19.87
29.37
33.13
53.41
28997
Pressure Cooker 57.37
39.37
20.64
58.69
12.75
52.85
Pa g e | 31
26102
Fibre Glass 27.03
34.73
48.56
53.45
54.50
50.38
29192
Air Conditioner (Packaged) 37.91
40.50
54.42
44.97
45.88
49.24
27310
C.I. Castings 1.00
33.32
66.81
46.14
93.08
48.07
24114
Dyes 43.60
41.95
44.50
37.86
43.25
47.20
35911
Motor Cycles 6.66
16.57
90.74
83.02
12.99
46.68
31904
Magnets 32.23
32.57
36.09
30.88
42.88
45.88
29306
Chillers 15.53
27.67
22.38
18.19
26.87
44.91
29199
Electric Welding Machines 6.24
27.92
17.15
34.06
49.48
44.31
31300
Fibre Optic Cable 51.72
38.24
2.65
47.96
57.99
43.60
18104
Leather Garments 18.66
28.43
23.40
26.36
62.77
43.17
20211
Plywood 42.97
49.94
39.48
37.34
33.73
43.03
28129
Tin Containers 0.33
69.29
11.18
57.02
4.04
42.67
31103
Electric Motors Phase-I 20.91
23.80
30.68
31.88
31.01
42.50
36997
Tooth Brush 77.14
85.44
73.15
40.11
42.80
41.32
29308
Washing Machines 12.63
16.99
17.51
20.94
27.19
40.50
33130
Cooling Towers 23.91
21.95
19.35
60.68
41.82
40.21
31908
Welding Rods 4.13
11.65
9.48
19.68
28.77
39.76
27203
Aluminium Foils 20.77
34.21
46.63
57.91
29.95
39.46
18101
Apparels 17.85
28.20
23.79
25.36
24.11
39.29
31501
Incandescent Lamp 24.96
24.05
26.95
25.38
31.28
38.57
24243
Whitening Agents 32.31
32.39
32.73
30.81
38.55
38.24
30007
Printers 17.86
7.81
34.25
10.41
4.31
37.83
30007
Computer Peripherals 36.57
19.60
37.78
33.30
24.44
37.53
32102
Power Capacitors 25.00
24.52
34.21
15.01
31.18
37.16
31908
Graphite Electrodes/Anodes
10.06
23.04
29.65
59.78
34.15
37.15
29151
Cranes 10.86
26.05
35.62
50.76
12.44
37.14
36934
Sports Goods, Rubber 13.28
39.34
43.51
51.54
48.07
37.09
28931
Razor Blades/Safety Blades
13.21
15.42
22.14
11.99
38.30
36.88
29119
Turbines & Accessories 12.93
11.71
20.63
32.40
58.69
36.71
36991
Pens of All Kind 30.24
37.43
39.23
35.68
36.28
36.09
27203
Aluminium wires & extrusions 2.83
8.73
45.86
63.75
42.51
35.50
29151
Lifts/Elevators & Components thereof 15.77
16.52
30.15
35.03
48.90
35.45
26922
Magnesite, Dead Burnt 58.53
59.31
47.64
39.99
25.79
34.78
28121
Cylinders 21.61
28.12
23.64
43.94
54.05
34.45
29294
Printing Machinery 6.53
9.94
19.55
25.10
26.78
34.41
26933
Glazed Tiles /Ceramic Tiles 66.28
74.33
79.45
76.35
51.98
34.37
35119
Ship Building & Repairs 3.96
3.67
7.88
6.39
12.51
34.10
25111
Tyre, Car/Cab 26.85
37.25
35.86
34.16
38.47
33.22
21015
Straw And Paper Boards of All Kinds 14.78
19.15
27.14
24.67
27.60
33.03
25202
Plastic Film Excl. Bopp Film 8.36
16.87
12.70
10.89
12.40
31.68

Pa g e | 32
25202
Polythene Bags Incl. Hdpe & Ldpe Bags 1.42
86.31
62.10
33.04
20.12
31.55
31200
Insulated Cables/Wires all Kind 25.30
25.45
26.44
38.89
33.54
30.84
29305
Solar Power Systems 7.84
6.12
5.78
6.61
13.69
30.30
29121
Air & Gas Compressors 12.08
16.02
7.76
8.36
29.16
30.18
29262
Textile Machinery 16.59
19.13
19.01
30.67
36.01
30.16
27203
Aluminium Sheets/Plates 20.83
26.78
38.36
38.97
28.08
29.97
35912
Scooter and Mopeds 38.08
83.69
81.93
87.76
55.96
29.64
29131
Industrial Chains 21.31
29.78
22.96
22.46
30.75
28.61
29211
Agricultural Machinery 19.86
15.13
18.65
20.92
45.20
28.04
31104
UPS/Inverter/Converter 20.53
13.02
27.54
25.09
28.79
27.96
29119
Construction Machine/Equipment 3.44
11.87
13.43
18.38
23.11
27.54
29303
Industrial Blowers 28.55
1.61
23.49
14.84
37.18
26.80
28112
Steel Structures 26.56
31.21
59.09
38.25
54.21
26.71
29191
Forklift 2.76
4.72
9.44
25.36
19.47
26.57
20211
Wood Veneer 4.31
9.80
10.12
7.19
15.11
26.51
31102
Transformers (Small) 52.29
63.26
53.39
59.99
55.54
26.28
27203
Aluminium Tubes/Pipes 15.51
30.12
29.70
35.46
34.73
26.07
26103
Glass Bottles 13.99
21.90
22.37
20.00
21.37
25.74
15135
Squashes, Jams, Jellies, Ketchups,Etc. 31.80
39.22
54.06
36.12
38.54
25.73
29244
Loaders 40.12
67.90
77.54
9.42
10.97
25.50
15331
Cattle and Poultry Feed 20.67
16.10
20.88
22.14
23.09
24.78
24111
Aniline 16.81
9.69
60.97
22.96
28.34
24.60
29131
Bearings (Ball/Roller) 10.14
11.97
15.07
15.37
20.20
24.33
25202
HDPE Woven Sacks 15.39
24.42
34.13
35.88
27.36
24.14
31103
DC Motors 9.65
18.27
15.27
15.20
21.12
23.90
24219
Rubber Chemical 19.44
24.47
28.42
25.85
25.03
23.88
25209
Plastic Sheets 28.85
23.18
15.67
18.74
16.08
23.83
29306
Refrigerators 8.68
6.86
13.44
17.68
28.40
23.78
31200
Air Break Switches / Circuit Breakers 24.70
23.99
33.28
30.85
20.19
23.08
24295
Adhesives 10.24
9.19
0.00
0.00
19.61
22.53
31901
Generator/Alternator 2.16
13.71
51.95
26.70
37.76
21.34
26960
Marble Tiles/Slabs 7.79
6.10
17.09
20.91
31.93
20.58
25192
Rubber Transmission And V Belts 6.09
8.68
9.02
17.55
17.79
19.62
29254
Sugar Machinery 0.56
0.75
0.38
2.46
1.36
19.56
28994
Cock (Faucets) 4.35
7.35
7.25
10.82
16.79
18.99
23109
Carbon Black 3.70
15.50
14.49
19.41
20.66
18.76
31901
Stabilisers 12.55
13.70
18.52
23.23
21.40
18.57
32101
Colour TV Picture Tubes 8.89
16.80
22.90
17.85
17.80
18.25
Steel 4.93
11.53
16.08
16.97
9.09
18.12
Pa g e | 33
33201
Lens of All Kinds 7.85
7.44
5.04
16.00
14.25
17.81
33112
Syringes 6.52
0.66
1.30
12.31
2.63
17.17
32105
IC Chips & Transistors 12.36
8.79
13.14
17.18
21.74
17.14
21098
Computer Stationery 1.69
3.16
6.28
8.67
12.39
16.03
19129
Leather Gloves 7.98
29.12
34.64
23.50
13.97
15.70
25193
Condoms 1.08
2.67
0.05
22.58
32.00
15.69
26942
Cement All Kinds 19.98
34.82
6.47
7.84
24.35
15.39
16003
Cigarettes 12.49
0.05
6.05
5.34
5.29
15.32
15134
Fruit Juices 13.41
20.75
31.05
9.71
12.06
14.80
25202
Plastic Bottles 21.77
15.50
13.00
9.39
11.42
14.54
29121
Pumps (including power driven pumps) 7.31
6.74
9.64
14.05
14.98
14.50
32109
Printed Circuit Board/Plate 7.03
9.01
11.39
11.75
13.61
14.41
29229
Machine Tools 5.52
7.60
10.61
9.71
12.79
14.40
31103
Relays, Fuses And Switchgears 10.95
8.54
15.21
17.91
14.52
14.38
31102
Transformers (P.D.T & Special Type) 2.42
22.08
36.11
31.59
10.36
14.25
25209
PVC Pipes and Tubes 3.24
8.86
28.83
18.09
12.80
14.13
29142
Furnaces 7.92
6.35
11.51
19.19
22.20
14.12
21022
Corrugated and Other Paper Boxes 22.17
16.73
11.11
16.90
2.74
14.02
31103
Electric Motors(Excl.Phase-I) 2.90
6.36
12.64
11.78
13.51
13.43
33122
Electric meter of all kinds 29.80
31.97
17.01
42.05
32.23
13.40
33122
Water meter of all kinds 29.80
31.97
17.01
42.05
32.23
13.40
33301
Clock/Watch/Timepiece Movement 18.97
20.01
17.09
13.79
24.88
12.76
29258
Food Processing Machinery 5.28
5.17
5.16
10.73
13.77
12.67
25191
Hose Pipe 0.97
4.21
79.36
45.30
18.52
12.65
29291
Plastic Machinery Incl. Moulding Machinery 17.68
20.26
26.79
19.43
12.00
12.50
24232
Antibiotics & It's Preparations 5.49
20.60
13.76
7.69
4.23
12.33
29251
Dairy Machinery 0.01
4.08
3.93
1.58
2.96
11.69
27203
Aluminium 9.36
10.34
16.57
17.34
11.72
11.63
24112
Sulphuric Acid, Incl. Oleum 0.00
0.00
0.38
0.03
1.03
11.29
29299
Driers 3.47
0.06
18.52
0.02
0.00
11.26
24223
Printing Ink 21.54
23.14
29.77
18.56
31.24
10.95
17297
Elastic Tape 1.34
7.25
25.62
41.72
22.74
10.81
24241
Toilet Soap 5.39
6.55
3.09
2.48
1.60
10.74
27201
Copper and Copper Products 4.48
6.91
7.00
7.47
8.43
10.48
33112
Medical and Surgical Equipment (except x-ray) 3.62
4.27
5.13
6.76
7.14
10.10
24248
Agarbattis and Dhoop 17.60
12.43
13.15
16.44
21.37
9.88
33301
Watches 0.88
1.24
12.00
10.35
14.25
9.39
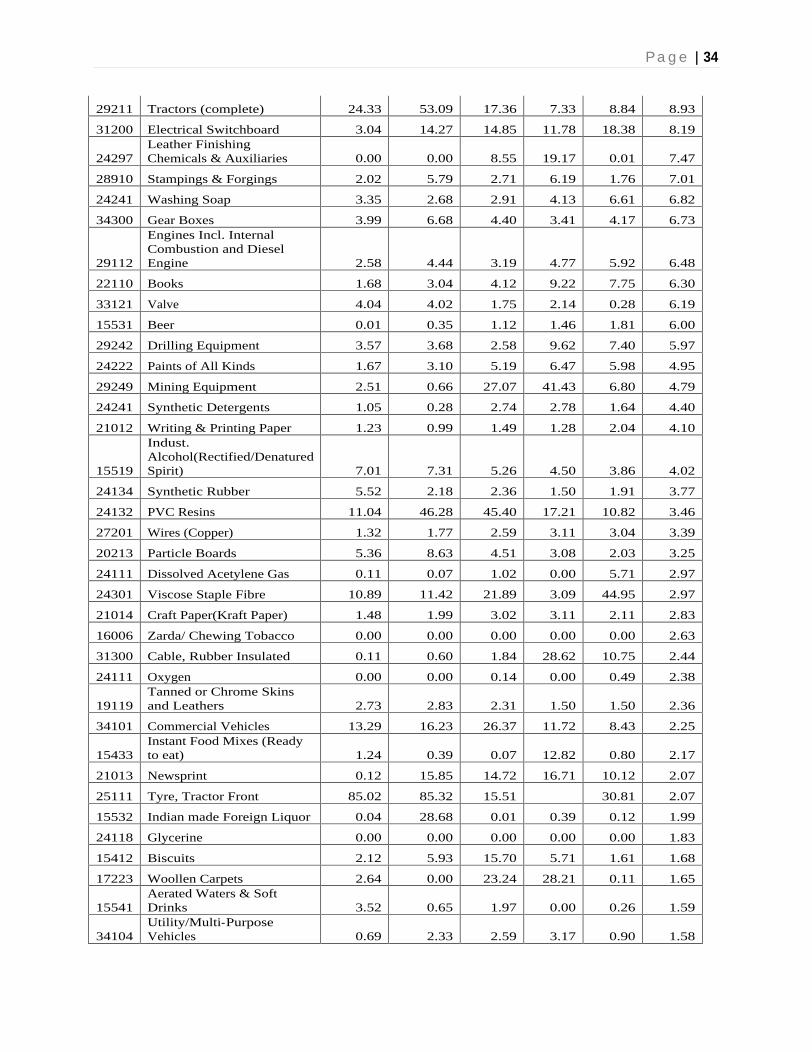
Pa g e | 34
29211
Tractors (complete) 24.33
53.09
17.36
7.33
8.84
8.93
31200
Electrical Switchboard 3.04
14.27
14.85
11.78
18.38
8.19
24297
Leather Finishing Chemicals & Auxiliaries 0.00
0.00
8.55
19.17
0.01
7.47
28910
Stampings & Forgings 2.02
5.79
2.71
6.19
1.76
7.01
24241
Washing Soap 3.35
2.68
2.91
4.13
6.61
6.82
34300
Gear Boxes 3.99
6.68
4.40
3.41
4.17
6.73
29112
Engines Incl. Internal Combustion and Diesel Engine 2.58
4.44
3.19
4.77
5.92
6.48
22110
Books 1.68
3.04
4.12
9.22
7.75
6.30
33121
Valve 4.04
4.02
1.75
2.14
0.28
6.19
15531
Beer 0.01
0.35
1.12
1.46
1.81
6.00
29242
Drilling Equipment 3.57
3.68
2.58
9.62
7.40
5.97
24222
Paints of All Kinds 1.67
3.10
5.19
6.47
5.98
4.95
29249
Mining Equipment 2.51
0.66
27.07
41.43
6.80
4.79
24241
Synthetic Detergents 1.05
0.28
2.74
2.78
1.64
4.40
21012
Writing & Printing Paper 1.23
0.99
1.49
1.28
2.04
4.10
15519
Indust. Alcohol(Rectified/Denatured Spirit) 7.01
7.31
5.26
4.50
3.86
4.02
24134
Synthetic Rubber 5.52
2.18
2.36
1.50
1.91
3.77
24132
PVC Resins 11.04
46.28
45.40
17.21
10.82
3.46
27201
Wires (Copper) 1.32
1.77
2.59
3.11
3.04
3.39
20213
Particle Boards 5.36
8.63
4.51
3.08
2.03
3.25
24111
Dissolved Acetylene Gas 0.11
0.07
1.02
0.00
5.71
2.97
24301
Viscose Staple Fibre 10.89
11.42
21.89
3.09
44.95
2.97
21014
Craft Paper(Kraft Paper) 1.48
1.99
3.02
3.11
2.11
2.83
16006
Zarda/ Chewing Tobacco 0.00
0.00
0.00
0.00
0.00
2.63
31300
Cable, Rubber Insulated 0.11
0.60
1.84
28.62
10.75
2.44
24111
Oxygen 0.00
0.00
0.14
0.00
0.49
2.38
19119
Tanned or Chrome Skins and Leathers 2.73
2.83
2.31
1.50
1.50
2.36
34101
Commercial Vehicles 13.29
16.23
26.37
11.72
8.43
2.25
15433
Instant Food Mixes (Ready to eat) 1.24
0.39
0.07
12.82
0.80
2.17
21013
Newsprint 0.12
15.85
14.72
16.71
10.12
2.07
25111
Tyre, Tractor Front 85.02
85.32
15.51
30.81
2.07
15532
Indian made Foreign Liquor
0.04
28.68
0.01
0.39
0.12
1.99
24118
Glycerine 0.00
0.00
0.00
0.00
0.00
1.83
15412
Biscuits 2.12
5.93
15.70
5.71
1.61
1.68
17223
Woollen Carpets 2.64
0.00
23.24
28.21
0.11
1.65
15541
Aerated Waters & Soft Drinks 3.52
0.65
1.97
0.00
0.26
1.59
34104
Utility/Multi-Purpose Vehicles 0.69
2.33
2.59
3.17
0.90
1.58
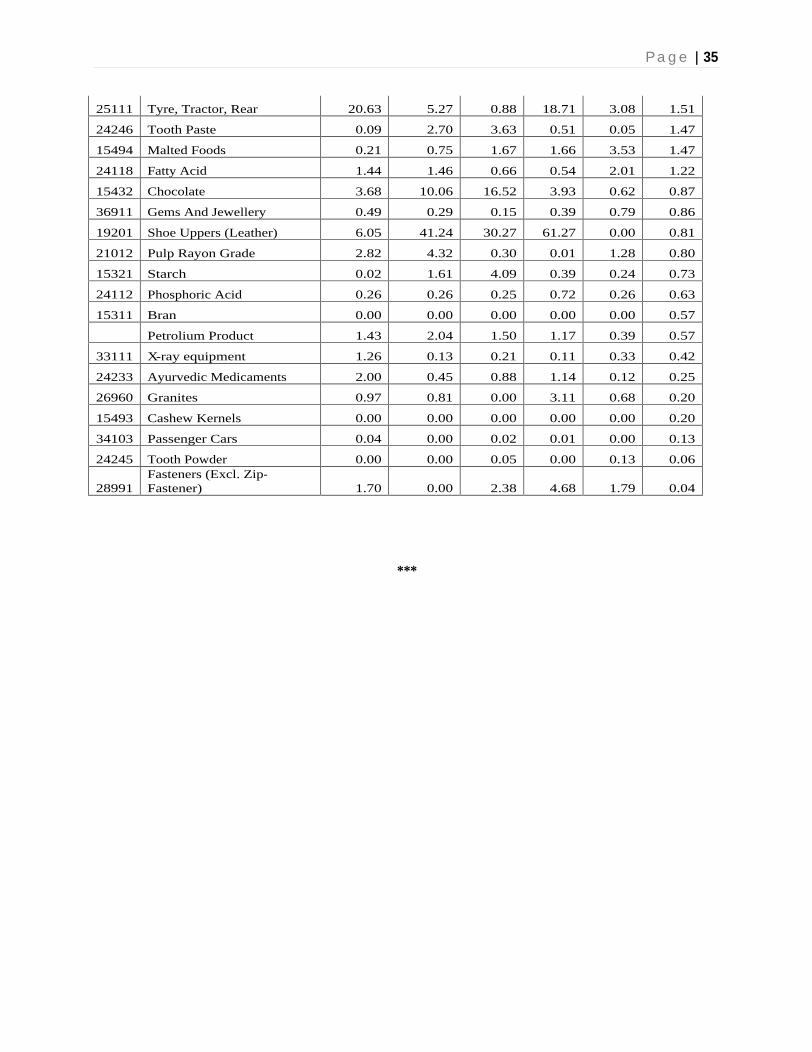
Pa g e | 35
25111
Tyre, Tractor, Rear 20.63
5.27
0.88
18.71
3.08
1.51
24246
Tooth Paste 0.09
2.70
3.63
0.51
0.05
1.47
15494
Malted Foods 0.21
0.75
1.67
1.66
3.53
1.47
24118
Fatty Acid 1.44
1.46
0.66
0.54
2.01
1.22
15432
Chocolate 3.68
10.06
16.52
3.93
0.62
0.87
36911
Gems And Jewellery 0.49
0.29
0.15
0.39
0.79
0.86
19201
Shoe Uppers (Leather) 6.05
41.24
30.27
61.27
0.00
0.81
21012
Pulp Rayon Grade 2.82
4.32
0.30
0.01
1.28
0.80
15321
Starch 0.02
1.61
4.09
0.39
0.24
0.73
24112
Phosphoric Acid 0.26
0.26
0.25
0.72
0.26
0.63
15311
Bran 0.00
0.00
0.00
0.00
0.00
0.57
Petrolium Product 1.43
2.04
1.50
1.17
0.39
0.57
33111
X-ray equipment 1.26
0.13
0.21
0.11
0.33
0.42
24233
Ayurvedic Medicaments 2.00
0.45
0.88
1.14
0.12
0.25
26960
Granites 0.97
0.81
0.00
3.11
0.68
0.20
15493
Cashew Kernels 0.00
0.00
0.00
0.00
0.00
0.20
34103
Passenger Cars 0.04
0.00
0.02
0.01
0.00
0.13
24245
Tooth Powder 0.00
0.00
0.05
0.00
0.13
0.06
28991
Fasteners (Excl. Zip-Fastener) 1.70
0.00
2.38
4.68
1.79
0.04
***