Embed Size (px)
Citation preview

www.eia.govU.S. Energy Information Administration Independent Statistics & Analysis
Impact of the Panama Canal widening on U.S. LPG exports
ForNew York Energy ForumOctober 18, 2016 | New York, NY
ByWarren WilczewskiIndustry EconomistPetroleum, Natural Gas, and Biofuels Analysis

LPG UsesEnd-use products End-use sectors
Ethane Petrochemical feedstock for ethylene production; power generation
Plastics; anti-freeze; detergents
Industrial
Propane Fuel for space heating, water heating, cooking, drying, and transportation; petrochemical feedstock
Fuel for heating, cooking, and drying; plastics
Industrial (includes manufacturing and agriculture), residential, commercial, and transportation
Butanes: normal butane and isobutane
Petrochemical and petroleum refinery feedstock; motor gasoline blending
Motor gasoline; plastics; synthetic rubber; lighter fuel
Industrial and transportation
New York Energy Forum | The Opening of the Panama Canal: LNG and LPG ShippingOctober 18, 2016 | New York, NY
Not all LPG is created equal
2

HGL production by sourcemillion barrels per day
The road from net LPG importer to world’s No. 1 exporter runs straight through a gas processing plant
Source: EIA U.S. Refiner & Blender Production and U.S. Natural Gas Plant Field Production; Short Term Energy Outlook Sept. 2016
3New York Energy Forum | The Opening of the Panama Canal: LNG and LPG ShippingOctober 18, 2016 | New York, NY
0
1
2
3
4
5Gas plantRefinery
Forecast
0.5
1.0
1.5
2.0
2.5Natural gas plant liquids productionNatural gas marketed productionCrude oil production
Forecast
natural gas, crude oil, and natural gas plant liquids production, indexed to Jan. 2008
8.7% annual Δ
6.6%7.5%
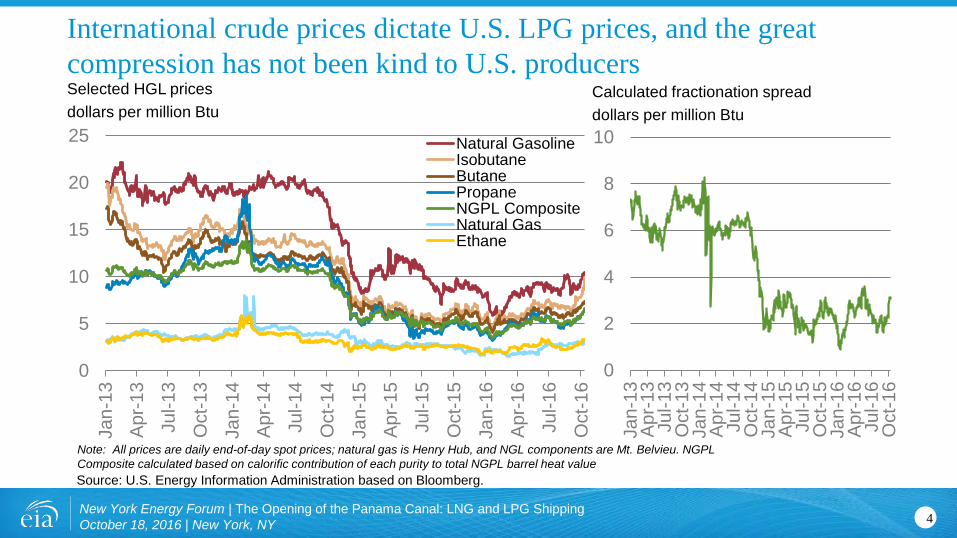
International crude prices dictate U.S. LPG prices, and the great compression has not been kind to U.S. producers
New York Energy Forum | The Opening of the Panama Canal: LNG and LPG ShippingOctober 18, 2016 | New York, NY 4
Selected HGL pricesdollars per million Btu
Source: U.S. Energy Information Administration based on Bloomberg.
0
5
10
15
20
25Ja
n-13
Apr
-13
Jul-1
3
Oct
-13
Jan-
14
Apr
-14
Jul-1
4
Oct
-14
Jan-
15
Apr
-15
Jul-1
5
Oct
-15
Jan-
16
Apr
-16
Jul-1
6
Oct
-16
Natural GasolineIsobutaneButanePropaneNGPL CompositeNatural GasEthane
Calculated fractionation spreaddollars per million Btu
Note: All prices are daily end-of-day spot prices; natural gas is Henry Hub, and NGL components are Mt. Belvieu. NGPL Composite calculated based on calorific contribution of each purity to total NGPL barrel heat value
0
2
4
6
8
10
Jan-
13A
pr-1
3Ju
l-13
Oct
-13
Jan-
14A
pr-1
4Ju
l-14
Oct
-14
Jan-
15A
pr-1
5Ju
l-15
Oct
-15
Jan-
16A
pr-1
6Ju
l-16
Oct
-16
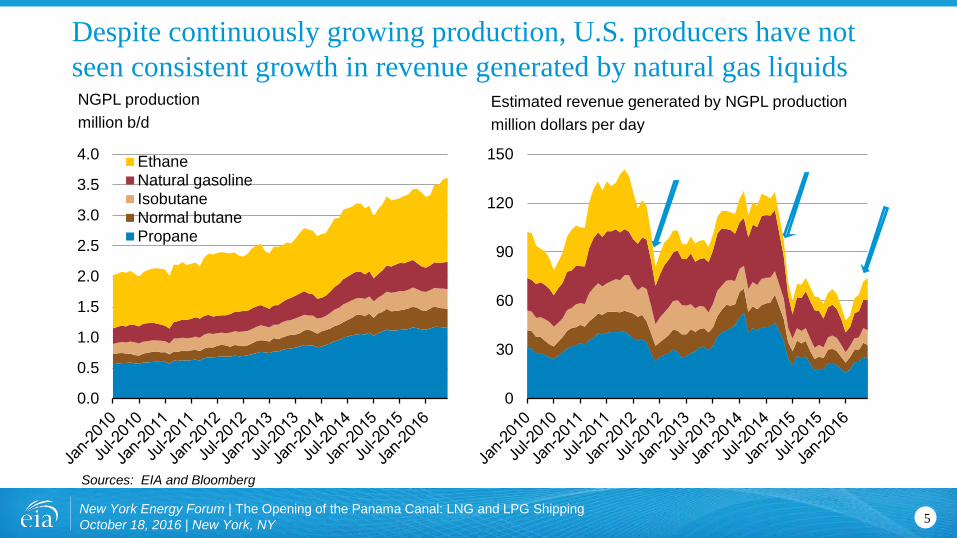
Sources: EIA and Bloomberg
0.0
0.5
1.0
1.5
2.0
2.5
3.0
3.5
4.0 EthaneNatural gasolineIsobutaneNormal butanePropane
Estimated revenue generated by NGPL productionmillion dollars per day
NGPL productionmillion b/d
New York Energy Forum | The Opening of the Panama Canal: LNG and LPG ShippingOctober 18, 2016 | New York, NY
Despite continuously growing production, U.S. producers have not seen consistent growth in revenue generated by natural gas liquids
5
0
30
60
90
120
150

Company Location
Terminal capacity
(1,000 b/d) Startup
Investment ($bil)*estimated
Total Pre-2013 United States 196 pre-2013 --
Enterprise Channelview, TX 115 2013Q1 0.3*
Targa Resources Galena Park, TX 120 2013Q3 0.24
Petrogas Energy Ferndale, WA 30 2014Q2 0.24
Targa Resources Galena Park, TX 120 2014Q3 0.24
Sunoco Logistics Marcus Hook, PA 40 2014Q3 0.27*
DCP Midstream Chesapeake, VA 8 2014Q4 0.1*
Sunoco Logistics Nederland, TX 197 2015Q1 0.4*
Enterprise Channelview, TX 49 2015Q2 0.1
Occidental Ingleside, TX 66 2015Q3 0.4
Enterprise Channelview, TX 230 2015Q4 0.5*
Buckeye/Trafigura Corpus Christi, TX 50 2016Q1 0.35*EnLink Riverside, LA 6 2016Q2 0.2Phillips66 Freeport, TX 150 2016Q3 0.8*
Sage Midstream Longview, WA 47 2016Q4 0.28*
Kinder Morgan Fairless Hills, PA 25 2017Q1 0.4*
Pembina Portland, OR 37 2018 0.5*
Total United States 1,234 1,181 2013-2018 4.8 4.1
Seeing higher net-backs, producers and midstream companies are looking to the export market for additional demand
Source: EIA based on news reports and company filings
6New York Energy Forum | The Opening of the Panama Canal: LNG and LPG ShippingOctober 18, 2016 | New York, NY
Propane/butane export terminal projects HGL pipelines and export terminals
××
×

-
200
400
600
800
1,000
1,200
1,400IsobutaneNormal butanePropane Exports
Non-Ref Export CapacityRefrigerated Export Capacity
U.S. total exports of propane and butanesthousand b/d
After major terminal capacity build-out 2013 to 2016, exports of propane and butanes no longer constrained by terminal capacity
Source: Dept. of Commerce, EIA
7New York Energy Forum | The Opening of the Panama Canal: LNG and LPG ShippingOctober 18, 2016 | New York, NY
Exports restrained by terminal capacity
Volumes dictated by market demand

-
200
400
600
800
1,000
2010 2011 2012 2013 2014 2015 2015to Jul
2016to Jul
OtherAsia-PacificEuropeSouth AmericaCaribbean & Cent. AmericaNorth America
-50
0
50
100
150 To N.W. EuropeTo E. AsiaTo Edmonton
U.S. propane exports by destination1,000 b/d
price spread between Mt. Belvieu and export destinationscents per U.S. gallon
New York Energy Forum | The Opening of the Panama Canal: LNG and LPG ShippingOctober 18, 2016 | New York, NY
After saturating Latin American market, U.S. exporters reached Europe, then Asia, where petrochemical feedstock consumes most incremental LPG barrels
Source: EIA, Dept. of Commerce
8
Source: Bloomberg

Panama Canal – the past and the future for LPG carrier transits
9New York Energy Forum | The Opening of the Panama Canal: LNG and LPG ShippingOctober 18, 2016 | New York, NY
Source: Panama Canal Authority, picture taken June 17, 2012
The Ronald N, one of three currently-serving VLGCs capable of passing through the old Panama Canal locks, transiting the Miraflores Locks
Panama Canal size restrictions and estimated product tanker capacity
Source: U.S. Energy Information Administration
Panamax (old locks)
Neopanamax(new locks)
Note: Ship capacities vary based on hull design, draft limitations, and types of product carried

New York Energy Forum | The Opening of the Panama Canal: LNG and LPG ShippingOctober 18, 2016 | New York, NY
Ship-to-ship transfers off of Panama are history. Is the canal expansion to blame?
10
0
20
40
60
80
100
120
140
2010 2011 2012 2013 2014 2015 2016
Aruba
Panama
Dominican Republic
Monthly U.S. propane exports to potential ship-to-shiptransfer destinationsthousand barrels per day
Source: U.S. Energy Information Administration, Petroleum Supply Monthly
Propane ship-to-ship transfer patterns

crude oil
distillate
gasoline
jet fuel
kerosene
LPG
petroleum coke
New York Energy Forum | The Opening of the Panama Canal: LNG and LPG ShippingOctober 18, 2016 | New York, NY
Panama Canal has seen a marked increase in LPG transits, nearly all Pacific-bound
Source: U.S. Energy Information Administration, based on Panama Canal Authority
11
2.6
0.2
1.3
0.7
0.2
0.04
1.1
10 8 6 4 2 0
NorthboundPacific to Atlantic(million long tons)
3.0
9.5
9.1
0.3
0.2
4.1
4.1
0 2 4 6 8 10
SouthboundAtlantic to Pacific(million long tons)
Note: A long ton is equal to 2,240 U.S. pounds, used in shipping to denote cargo volumes
Petroleum traffic via the Panama Canal, 2015 Panama Canal and lock system

India
Malaysia
Indonesia
Singapore
Thailand
Southern China
Taiwan
Northern China
South Korea
Japan
Chile
Ecuador
0
0.076923
0.153846
0.230769
0.307692
0.384615
0.461538
0.538461
0.615384
0.692307
0.76923
0.846153
0.923076
0.999999
0 10 20 30 40
Approximate voyage time from U.S. Gulf Coast to major ports in selected countriesdays
South America
Asia
Panama CanalSuez Canalother
The expanded Panama Canal significantly reduces transit times to East Asia and Pacific South America
Source: U.S. Energy Information Administration
12New York Energy Forum | The Opening of the Panama Canal: LNG and LPG ShippingOctober 18, 2016 | New York, NY

0
50
100
150
200
250
300
350
Jan-
13M
ay-1
3S
ep-1
3Ja
n-14
May
-14
Sep
-14
Jan-
15M
ay-1
5S
ep-1
5Ja
n-16
May
-16
Sep
-16
Spot Freight USGC-Asia (basis COGH)
1 Year Time Charter Freight Equivalent
VLGC current fleet and orderbookNo. of ships
U.S. Gulf Coast to East Asia (basis COGH)$/tonne
New York Energy Forum | The Opening of the Panama Canal: LNG and LPG ShippingOctober 18, 2016 | New York, NY
As VLGC fleet grows, rates decline, allowing U.S. LPG to travel longer distances with lower arbs
Source: Poten & Partners
13
-202468
1012141618
Q1
2012
Q4
2012
Q3
2013
Q2
2014
Q1
2015
Q4
2015
Q3
2016
Q2
2017
Q1
2018
Q4
2018
Q3
2019
Current Fleet
ConfirmedorderbookScrappings
0
50
100
150
200
250
300
Q1
2012
Q4
2012
Q3
2013
Q2
2014
Q1
2015
Q4
2015
Q3
2016
Q2
2017
Q1
2018
Q4
2018
Current Fleet
Confirmedorderbook
VLGC current fleet and orderbookNo. of ships

Loaded cost of U.S. propane in E. Asia$/bbl
Panama Canal vs. alternative routes from the U.S. Gulf Coast to E. Asia: Fully loaded spot
Sources: U.S. Energy Information Administration, Poten & Partners, Bloomberg
14New York Energy Forum | The Opening of the Panama Canal: LNG and LPG ShippingOctober 18, 2016 | New York, NY
Assuming 33-day voyage around the cape vs. 21-day voyage through the Panama Canal
0
10
20
30
40
50
60
70
80
90vi
a C
ape
via
Sue
zvi
a P
anam
avi
a C
ape
via
Sue
zvi
a P
anam
avi
a C
ape
via
Sue
zvi
a P
anam
avi
a C
ape
via
Sue
zvi
a P
anam
avi
a C
ape
via
Sue
zvi
a P
anam
avi
a C
ape
via
Sue
zvi
a P
anam
avi
a C
ape
via
Sue
zvi
a P
anam
avi
a C
ape
via
Sue
zvi
a P
anam
avi
a C
ape
via
Sue
zvi
a P
anam
avi
a C
ape
via
Sue
zvi
a P
anam
avi
a C
ape
via
Sue
zvi
a P
anam
avi
a C
ape
via
Sue
zvi
a P
anam
avi
a C
ape
via
Sue
zvi
a P
anam
avi
a C
ape
via
Sue
zvi
a P
anam
avi
a C
ape
via
Sue
zvi
a P
anam
a
2013 Q1 2013 Q2 2013 Q3 2013 Q4 2014 Q1 2014 Q2 2014 Q3 2014 Q4 2015 Q1 2015 Q2 2015 Q3 2015 Q4 2016 Q1 2016 Q2 2016 Q3
Spot Freight USGC-AsiaCanal tollTerminaling costMt. Belvieu (non-LST) Propane

Loaded cost of U.S. propane in E. Asia$/bbl
Panama Canal vs. alternative routes from the U.S. Gulf Coast to E. Asia: Belvieu + toll and fuel
Sources: U.S. Energy Information Administration, Poten & Partners, Bloomberg
15New York Energy Forum | The Opening of the Panama Canal: LNG and LPG ShippingOctober 18, 2016 | New York, NY
Assuming 33-day voyage around the cape vs. 21-day voyage through the Panama Canal
0
10
20
30
40
50
60
70
80
90vi
a C
ape
via
Sue
zvi
a P
anam
avi
a C
ape
via
Sue
zvi
a P
anam
avi
a C
ape
via
Sue
zvi
a P
anam
avi
a C
ape
via
Sue
zvi
a P
anam
avi
a C
ape
via
Sue
zvi
a P
anam
avi
a C
ape
via
Sue
zvi
a P
anam
avi
a C
ape
via
Sue
zvi
a P
anam
avi
a C
ape
via
Sue
zvi
a P
anam
avi
a C
ape
via
Sue
zvi
a P
anam
avi
a C
ape
via
Sue
zvi
a P
anam
avi
a C
ape
via
Sue
zvi
a P
anam
avi
a C
ape
via
Sue
zvi
a P
anam
avi
a C
ape
via
Sue
zvi
a P
anam
avi
a C
ape
via
Sue
zvi
a P
anam
avi
a C
ape
via
Sue
zvi
a P
anam
a
2013 Q1 2013 Q2 2013 Q3 2013 Q4 2014 Q1 2014 Q2 2014 Q3 2014 Q4 2015 Q1 2015 Q2 2015 Q3 2015 Q4 2016 Q1 2016 Q2 2016 Q3
Fuel CostCanal tollMt. Belvieu (non-LST) Propane

-505
1015202530354045
via Cape via Suez via Panama
-505
1015202530354045
via Cape via Suez via Panama
E. Asia propane spot less GoM commodity + transport$/b
E. Asia propane spot less GoM commodity + toll and fuel$/b
New York Energy Forum | The Opening of the Panama Canal: LNG and LPG ShippingOctober 18, 2016 | New York, NY
How does it all net out?
Sources: U.S. Energy Information Administration, Poten & Partners, Bloomberg
16

• Short-Term Outlook for Hydrocarbon Gas Liquids - supplement to STEOhttp://www.eia.gov/forecasts/steo/special/supplements/2016/hgl/pdf/2016_sp_01.pdf
• Energy Explained: Hydrocarbon Gas Liquidshttp://www.eia.gov/energyexplained/index.cfm?page=hgls_home
• Annual Energy Outlook Issues in Focus: Hydrocarbon Gas Liquids Production and Related Industrial Developmenthttps://www.eia.gov/forecasts/aeo/hgl.cfm
• Drilling Productivity Report Drilled but Uncompleted Wells (DUCs) Supplementhttps://www.eia.gov/petroleum/drilling/pdf/duc_supplement.pdfhttp://www.eia.gov/petroleum/drilling/
17New York Energy Forum | The Opening of the Panama Canal: LNG and LPG ShippingOctober 18, 2016 | New York, NY
Recent EIA HGL-related data products

Thank you
18New York Energy Forum | The Opening of the Panama Canal: LNG and LPG ShippingOctober 18, 2016 | New York, NY
Warren WilczewskiOffice of Petroleum, Natural Gas, and Biofuels [email protected]

• Previous approach used reported monthly data and forecasted monthly export totals, with weekly exports shown flat
• Current approach uses daily exports data shared with EIA by Customs & Border Patrol that is parsed by EIA and summed to weekly using the same cut-offs as our surveys
• Because EIA does not have early access to Canadian imports data, these exports are modeled
– U.S. exports data consist of imports reported by Statistics Canada as coming from the U.S.
Monthly propane exports for 2016Thousand barrels per day
New York Energy Forum | The Opening of the Panama Canal: LNG and LPG ShippingOctober 18, 2016 | New York, NY
New EIA methodology for weekly exports data in Weekly Petroleum Supply Report (WPSR)
Source: EIA, Statistical Methodology of Estimating Petroleum Exports Using Data from U.S. Customs and Border Protection
19

• Initial exports moved to Canada by pipeline to feed existing petrochemical facilities in Ontario and Alberta
• March 2016, marine exports began to Norway from Marcus Hook, PA
– First shipment to Sweden in September
• September 2016, marine exports began to Norway from Morgan’s Point, TX
– Shipments will head to the U.K., Brazil, and India
• Marine exports will equal as much ethane as 3 world-scale crackers by year-end 2017
0
20
40
60
80
100MarinePipeline
U.S. exports of ethanethousand b/d
New York Energy Forum | The Opening of the Panama Canal: LNG and LPG ShippingOctober 18, 2016 | New York, NY
U.S. now exports ethane to petrochemical facilities abroad via pipeline and tanker, and capacity for both is growing
Source: EIA
20

U.S. ethane export terminals and announced destinations for U.S. marine ethane exports
New York Energy Forum | The Opening of the Panama Canal: LNG and LPG ShippingOctober 18, 2016 | New York, NY
U.S. ethane exports give new lease on life to older petrochemical facilities overseas
Source: EIA, company public filings and press releases; Photo courtesy of Enterprise Product Partners
21
JS INEOS Intrepid loading at Morgan’s Point, TX for inaugural ethane export to Europe

New York Energy Forum | The Opening of the Panama Canal: LNG and LPG ShippingOctober 18, 2016 | New York, NY
What are HGL?
22


![Rebuilding the Panama Canal Engineering Works [1] Panama ... · Rebuilding the Panama Canal ... – Construction of two lock facilities – Excavation of new access channels and widening](https://img.dokumen.tips/doc/110x75/5f0c63b47e708231d4352929/rebuilding-the-panama-canal-engineering-works-1-panama-rebuilding-the-panama.jpg)