Embed Size (px)
Citation preview

Community Living Policy Center
• Aims to advance policies and practices that promote community living outcomes for individuals with disabilities of all ages through research and knowledge translation.
• The CLPC received support from the National Institute for Disability, Independent Living, and Rehabilitation Research (NIDILRR) within the Administration for Community Living, U.S. Department of Health and Human Services (Grant # 90RTCP0004). The contents of this webinar do not necessarily represent the policy of NIDILRR, ACL, or HHS, and you should not assume endorsement by the Federal Government.

Community Living Policy Center Partners• Lurie Institute for Disability Policy at Brandeis University• University of California, San Francisco (UCSF)• Association of University Centers on Disabilities (AUCD)• Autistic Self Advocacy Network (ASAN)• Disability Rights Education & Defense Fund (DREDF)• Disability Policy Consortium (DPC)• Centene Corporation• National Association of States United for Aging and Disabilities (NASUAD)• Mike Oxford, Topeka Independent Living Resource Center• Henry Claypool, National Policy Expert• Disability and Aging Collaborative

Webinar Logistics
• The power point and archived recording will be available on the Community Living Policy Center website:
• www.communitylivingpolicy.org• Webinar is being live captioned• Time for questions following speakers
• Submit questions via the Chat function

Presenters
Carol IrvinMathematica
Steve KayeUniversity of California San Francisco
Nicole JorwicThe Arc of the United States

The Cost Savings and Quality of Life Implications of the Money Follows the Person Demonstration
July 25, 2019
Carol V. Irvin

• Principal Aims• Reduce reliance on institutional care• Develop community-based long-term care
opportunities• Enable people with disabilities to participate fully
in their communities and improve their quality of life
Money Follows the Person (MFP) Rebalancing Demonstration
7

Legislative History
• Established by Deficit Reduction Act of 2005• 5-year demonstration and $2 billion in grant funding for states
• Extended and expanded by the Affordable Care Act of 2010• 5-year extension and additional $2 billion in grant funds
• Extended by the Medicaid Extenders Act of 2019• Added $112 million for federal fiscal year 2019
8

OR
AZ NM
WY
UT
RICT
AK
HI
SCGAAL
NCTN
MA
ME
NHVT
NY
NJPA
DEMD
WV
KY
OH
MI
MT
ID
WA
TX
CANV
CO
ND
SD
NE IA
MS
INIL
MN
WI
MO
AROK
KS
LA
VA
FL
State with MFP programNo MFP program in state
A Popular Demonstration...
9

Source: Mathematica analysis of Medicaid Analytic eXtract (MAX) data from 2006 through 2014.
1,221,024 1,147,364
1,084,786
-
200,000
400,000
600,000
800,000
1,000,000
1,200,000
1,400,000
2006 2007 2008 2009 2010 2011 2012 2013 2014
Num
ber o
f Ind
ivid
uals
More Than One Million Eligible for MFP In Any Given Year
Older adults Physical disabilities Intellectual disabilities Total
...Sizeable Eligible Population...
10
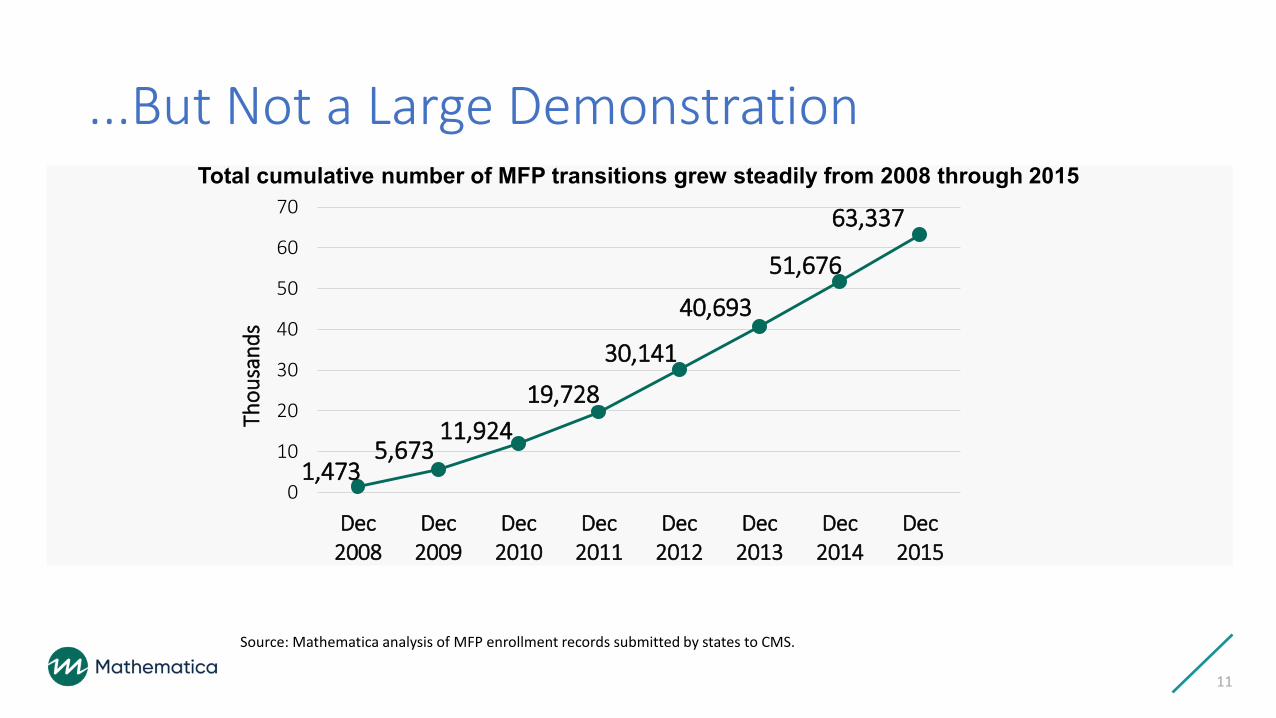
Source: Mathematica analysis of MFP enrollment records submitted by states to CMS.
1,4735,673
11,92419,728
30,141
40,693
51,676
63,337
0
10
20
30
40
50
60
70
Dec2008
Dec2009
Dec2010
Dec2011
Dec2012
Dec2013
Dec2014
Dec2015
Thou
sand
s
Total cumulative number of MFP transitions grew steadily from 2008 through 2015
...But Not a Large Demonstration
11

• Average per-beneficiary-per-month (PBPM) expenditures declined by $1,840 (23 percent)Older adults
• Average PBPM expenditures declined by $1,730 (23 percent)
People with physical disabilities
• Average PBPM expenditures declined by $4,013 (30 percent)
People with intellectual/developmental
disabilities
Community-Based Services Are Less Costly than Institutional Care
12

Savings Were Accrued by Medicaid
• MFP participants generated total savings of $978 million in medical and LTSS costs• $1 billion in savings to Medicaid • $25 million increase to Medicare because of gains in Medicare coverage
during the first year
13

Assessing Costs Extremely Difficult—Could Not Assess All Costs• Housing – room and board
• Costs beyond the first year after the transition• Attempted to look at costs two years post transition, but results were inconclusive
14

Changes in Costs Not Unique to MFP
• The decline in costs observed among MFP participants is similar to what we see for others who transition outside the demonstration
• Did MFP transition beneficiaries who would not have transitioned otherwise?• Never detected a robust increase in transitions after MFP began• MFP participants had characteristics that suggested they had fewer connections to the
community
15

Other Avenues for Cost Savings
• Did MFP help beneficiaries remain longer in the community?• Did MFP reduce the likelihood of someone returning to facility level care? • When someone returns to a facility, is the stay shorter because of MFP?
• Did MFP provide more access to medical care?• If MFP provides higher quality HCBS, are medical care costs lower as a result?
16

Supported infrastructure changes• Helped states establish formal transition programs• Catalyst to interagency collaboration between
health and housing• Improved access to community-based LTSS
Stronger State LTSS Systems
MFP Provided Other Benefits
17
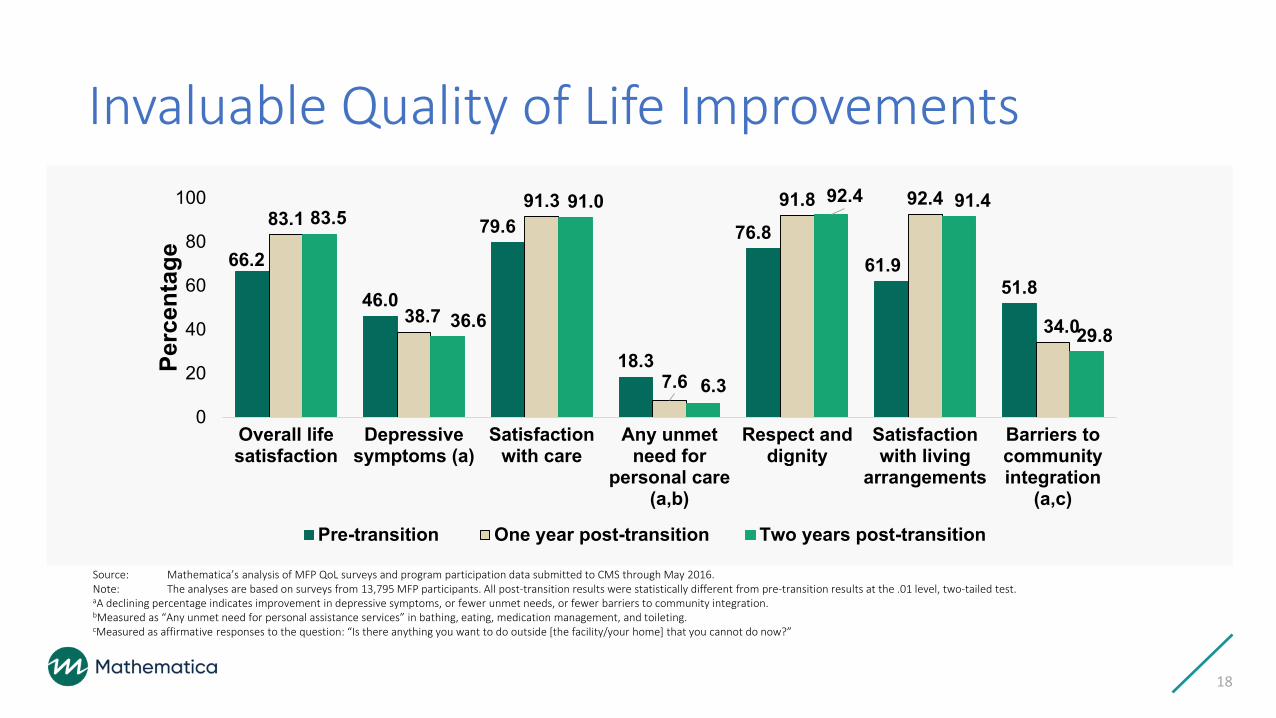
Source: Mathematica’s analysis of MFP QoL surveys and program participation data submitted to CMS through May 2016.Note: The analyses are based on surveys from 13,795 MFP participants. All post-transition results were statistically different from pre-transition results at the .01 level, two-tailed test.aA declining percentage indicates improvement in depressive symptoms, or fewer unmet needs, or fewer barriers to community integration. bMeasured as “Any unmet need for personal assistance services” in bathing, eating, medication management, and toileting.cMeasured as affirmative responses to the question: “Is there anything you want to do outside [the facility/your home] that you cannot do now?”
66.2
46.0
79.6
18.3
76.861.9
51.8
83.1
38.7
91.3
7.6
91.8 92.4
34.0
83.5
36.6
91.0
6.3
92.4 91.4
29.8
0
20
40
60
80
100
Overall lifesatisfaction
Depressivesymptoms (a)
Satisfactionwith care
Any unmetneed for
personal care(a,b)
Respect anddignity
Satisfactionwith living
arrangements
Barriers tocommunityintegration
(a,c)
Perc
enta
ge
Pre-transition One year post-transition Two years post-transition
Invaluable Quality of Life Improvements
18

Source: Mathematica’s analysis of MFP QoL surveys and program participation data submitted to CMS through May 2016.Note: The analyses are based on surveys from 13,795 MFP participants.
18.3
10.8
1.62.7
8.07.6
4.1
1.4 1.52.6
0.0
2.0
4.0
6.0
8.0
10.0
12.0
14.0
16.0
18.0
20.0
Any unmet care need Bathing Meals Medications Toileting
Perc
enta
ge
Pre-transition One Year Post-transtion
Unmet Needs Declined Post Transition
19
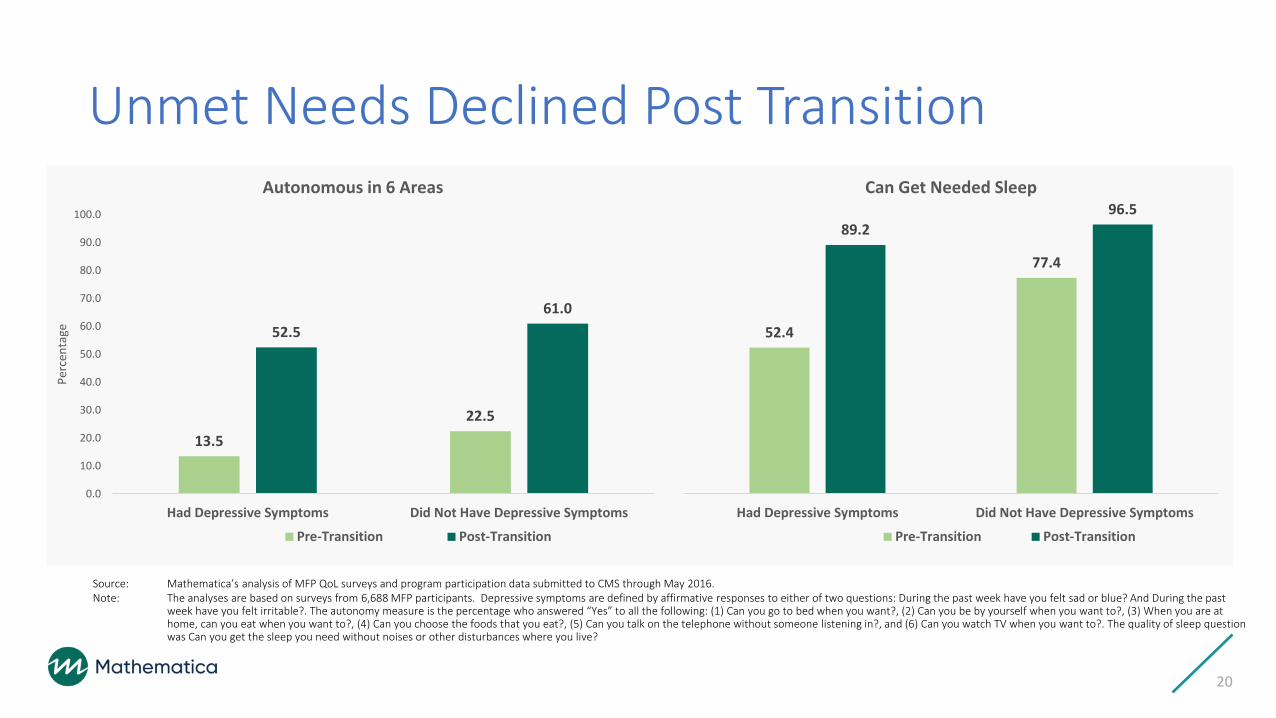
20
13.522.5
52.561.0
0.0
10.0
20.0
30.0
40.0
50.0
60.0
70.0
80.0
90.0
100.0
Had Depressive Symptoms Did Not Have Depressive Symptoms
Perc
enta
ge
Autonomous in 6 Areas
Pre-Transition Post-Transition
52.4
77.4
89.296.5
Had Depressive Symptoms Did Not Have Depressive Symptoms
Can Get Needed Sleep
Pre-Transition Post-Transition
Unmet Needs Declined Post Transition
Source: Mathematica’s analysis of MFP QoL surveys and program participation data submitted to CMS through May 2016.Note: The analyses are based on surveys from 6,688 MFP participants. Depressive symptoms are defined by affirmative responses to either of two questions: During the past week have you felt sad or blue? And During the past
week have you felt irritable?. The autonomy measure is the percentage who answered “Yes” to all the following: (1) Can you go to bed when you want?, (2) Can you be by yourself when you want to?, (3) When you are at home, can you eat when you want to?, (4) Can you choose the foods that you eat?, (5) Can you talk on the telephone without someone listening in?, and (6) Can you watch TV when you want to?. The quality of sleep question was Can you get the sleep you need without noises or other disturbances where you live?

Next Steps?
• Demonstrations are temporary• Either end or adopted permanently
• Community-based beneficiaries are less costly and have a higher quality of life than those residing in facilities• Divert beneficiaries from facility-based care• Focus on the transition when a facility admission occurs
21

Early Access to Community
Services Leads to Less Reliance on Institutional
Care
Transition
• Increase the likelihood of returning to the community and community-based services when an institutional stay occurs
Divert
• Decrease the likelihood of a long institutional stay
Make Community-Based LTSS Available As Early As Possible
22

For More Information
23
MFP webpagehttps://www.medicaid.gov/medicaid/ltss/money-follows-the-person/index.html
Carol Irvin, [email protected]

Steve Kaye
CLPC Webinar7/25/19
Evidence for the Impact of Money Follows the Person

• State programs• 2007: 30 states + DC• 2011–12: 14 more states• 6 states never participated• 1 (OR) dropped out
• Cumulative total 9/07–6/18: 91,540 transitions
• I/DD: 14,856• Non-I/DD: 76,684
• Some states transition >2% of institutional pop per year
Source: Mathematica, CMS
Money Follows the Person transitions

Data sources
• MFP Transitions: Mathematica Policy Research reports & CMS• Institutional utilization
‣ Nursing home residents & occupancy: Federal CASPER & OSCAR databases, from UCSF & Kaiser Family Foundation reports, with adjustments
‣ Nursing home residents: CMS tabulations from Minimum Data Set (MDS)‣ ICF/IID population: Residential Information Systems Project (RISP) reports from
U. Minnesota, updated by RISP team
• LTSS expenditures‣ Truven/IBM Watson Health reports w/ adjustments‣ CMS Medicaid Budget & Expenditure System (MBES) for bulk “supplemental
payments”

Analysis, Part I: Non-I/DD population
• States classified as High, Medium, or Low/Non-MFP States‣ Based on 2012-17 ave. annual number of MFP transitions, relative to the state
population‣ High MFP: CT, DE, DC, GA, HI, ID, KS, LA, MD, MA, NE, ND, OH, RI, TN, VT, WA‣ Low/Non-MFP states:
- No MFP program: AK, AZ, FL, NM, UT, WY + OR (early dropout)- Few non-I/DD transitions: AL, CA, CO, IA, KY, MN, NC, OK, SC, VA
• Institutional population: NH residents without ID (~98%)• LTSS expenditures: Non-I/DD-specific HCBS + nursing homes
• Home health not counted as HCBS• “Supplemental payments” excluded from NH expenditures

• Change 2007-17• High –7.1%• Medium –4.5%• Low –1.7%
Source: CASPER/OSCAR tabulations from KFF & UCSF
Nursing home population declined in High & Medium MFP states

• Change 2007-17(# per 100,000 pop, averaged across states)
• High –71.0• Medium –44.7• Low –40.2
Source: CASPER/OSCAR tabulations from KFF & UCSF
Proportion of state pop in nursing homes: High MFP states had largest decline

• Change 2012–18• High –7.0%• Medium –3.7%• Low –2.4%
• “Permanent-stay” based on residents’ expectations when admitted/readmitted
Source: MDS 3.0
Permanent-stay nursing home residents: Reductions in High/Medium MFP states

• Change 2007-17(percentage points, averaged across states)
• High –6.1• Medium –5.4• Low –4.0
Source: CASPER/OSCAR tabulations from KFF & UCSF
Nursing home occupancy: Greater reduction in High & Medium MFP states

• Change 2010–16($ per capita, adjusted for inflation)
• High –$29.52• Medium –$23.79• Low –$10.77
• CA & NM omitted due to missing/ inconsistent data
Source: Truven/IBM Watson Health & CMS MBES reports
Medicaid nursing home expenditures declined more in High & Medium MFP states

• Change 2010-16(percentage points, averaged across states)
• High +7.6• Medium +7.3• Low +4.0
• CA, FL, ID, NJ, NM omitted due to missing/ inconsistent data
Source: Truven/IBM Watson Health reports
Rebalancing: High & Medium MFP States had larger increase in HCBS % of LTSS Spending

Analysis, Part II: I/DD population
• States classified as High, Medium, or Low/Non-MFP States‣ Based on 2012-17 ave. annual number of MFP transitions of people with I/DD,
relative to the state population• High-MFP: AR, CT, ID, IL, IA, KS, LA, MS, MO, NJ, ND, OH, OK, SD, TX, VA, WA‣ Low/Non-MFP states:
- No MFP program: AK, AZ, FL, NM, UT, WY + OR (early dropout)- No I/DD transitions: AL, ME, MI, RI, SC, VT, WV- Few I/DD transitions: HI, MN, NH
• Institutional population: ICF/IID pop + NH residents with ID (~2%)• LTSS expenditures: I/DD-specific HCBS & ICF/IID
• “Supplemental payments” excluded from ICF/IID expenditures

• Change 2008-17(# per 100,000 pop, averaged across states)
• High –16.6• Medium –12.0• Low –4.5
Source: RISP; CASPER/OSCAR tabulations from KFF & UCSF
Larger declines in institutionalized state pop in High & Medium MFP states

• Change 2010–16($ per capita, adjusted for inflation)
• High –$18.25• Medium –$20.63• Low –$3.53
• NC omitted due to missing data
Source: Truven/IBM Watson Health & CMS MBES reports
Medicaid ICF/IID expenditures declined in High & Medium MFP states

• Change 2010-16(percentage points, averaged across states)
• High +9.4• Medium +8.8• Low +1.8
• NC omitted due to missing data
Rebalancing: High & Medium MFP States had larger increase in HCBS % of LTSS Spending
Source: Truven/IBM Watson Health & CMS MBES reports

Conclusions• States with robust MFP programs substantially reduced nursing home
& ICF/IID utilization relative to other states• Reduced nursing home occupancy rates suggest that transitioned
residents are not being replaced by new residents• Reductions in “permanent-stay” NH residents are particularly
important• Suggests that MFP targets those would not otherwise return to community
• High & Medium MFP states rebalanced their Medicaid LTSS systems faster than Low/non-MFP states
• MFP appears to have been successful in helping states shift away from institutional services and toward HCBS
• Tiny program that works: Permanent part of Medicaid?

Money Follows the Person-EMPOWER Care Act (S. 548, H.R. 1342)
Nicole Jorwic, J.D. Senior Director of Public Policy,
The Arc of the United States

Money Follows the Person Money Follows the Person (MFP) gives states additional federal Medicaid funds to help transition people from institutions to the community
Congressional Intent: Rebalance the Long-Term Care system from institution to community
Mechanism: Enhanced federal match earned on HCBS for each MFP participant enrolled in HCBS program following discharge from a qualified institution

Federal Demonstration Project • Originated under the Deficit Reduction Act of 2005
• Expanded by the Affordable Care Act Rebalancing Initiative
Congressional Intent: Rebalance the Long-Term Care system from institution to community **Strong Bi-Partisan support
Mechanism: Enhanced federal match earned on HCBS for each MFP participant enrolled in HCBS program following discharge from a qualified institution
History

Legislative History of MFP
• First became law through the The Deficit Reduction Act of 2005 (S. 1932)
• Reauthorized as part of the Affordable Care Act (H.R. 3590) (Senate passed the House version) and the
• Program expired September 30, 2016

Recent MFP Activity
There have been several short term extension bills, but the EMPOWER Care Act (S. 548, H.R. 1342) would extend and improve the MFP program through 2023
A 4.5 year extension passed the House in June now we will look to the Senate

The EMPOWER Care Act improves MFP by reducing how long someone must be in a nursing home before becoming eligible to transition from 90 days to 60.
The bill also enhances the reporting and accountability of MFP funding
Requires the federal government to identify and share the most effective state strategies for transitioning beneficiaries from institutional to qualified community settings, including how such strategies vary for different types of beneficiaries.
Changes in Current Legislation

Questions
Submit your questions via the Chat

Thank You For Attending
• Follow Us on Twitter:@CLPolicy
• Websitewww.communitylivingpolicy.org