Embed Size (px)
Citation preview

Loyola University Chicago Loyola University Chicago
Loyola eCommons Loyola eCommons
Dissertations Theses and Dissertations
2013
Impact of Team Citizenship Behaviors on Performance in Impact of Team Citizenship Behaviors on Performance in
Women's Sports Teams Women's Sports Teams
Rachael Nichole Martinez Loyola University Chicago
Follow this and additional works at: https://ecommons.luc.edu/luc_diss
Part of the Organizational Behavior and Theory Commons
Recommended Citation Recommended Citation Martinez, Rachael Nichole, "Impact of Team Citizenship Behaviors on Performance in Women's Sports Teams" (2013). Dissertations. 531. https://ecommons.luc.edu/luc_diss/531
This Dissertation is brought to you for free and open access by the Theses and Dissertations at Loyola eCommons. It has been accepted for inclusion in Dissertations by an authorized administrator of Loyola eCommons. For more information, please contact [email protected].
This work is licensed under a Creative Commons Attribution-Noncommercial-No Derivative Works 3.0 License. Copyright © 2013 Rachael Nichole Martinez

LOYOLA UNIVERSITY CHICAGO
IMPACT OF TEAM CITIZENSHIP BEHAVIORS ON
PERFORMANCE IN WOMEN’S SPORTS TEAMS
A DISSERTATION SUBMITTED TO
THE FACULTY OF THE GRADUATE SCHOOL
IN CANDIDACY FOR THE DEGREE OF
DOCTOR OF PHILOSOPHY
PROGRAM IN SOCIAL PSYCHOLOGY
BY
RACHAEL N. MARTINEZ
CHICAGO, ILLINOIS
MAY 2013

Copyright by Rachael Martínez, 2013All rights reserved.
iii
ACKNOWLEDGEMENTS
Over the course of my graduate career, I have received support and encourage-
ment from a great number of individuals. First and foremost, I would like to express my
deep and sincere gratitude to my mentor and committee chair, Dr. R. Scott Tindale, who
has helped me every step of the way. His guidance made this journey possible. I would
also like to extend many thanks to my dissertation committee of Dr. James Larson, Dr.
Tracy DeHart, and Dr. Grayson Holmbeck for their support as I moved from an idea to a
completed study. In addition, Dr. Fred Bryant (Loyola University Chicago faculty mem-
ber) and Linda Poggensee (Statistical Analyst at US Department of Veterans Affairs) both
provided valuable statistical advice. Thanks are also due to Loyola University Chicago
for providing the funds with which to complete my research and writing. Finally, I owe
my loving thanks to my husband, Ian Martínez, for spending countless hours proofread-
ing, listening to me talk about my research, and being my biggest supporter.

iv
TABLE OF CONTENTS
ACKNOWLEDGEMENTS iii
LIST OF TABLES vii
LIST OF FIGURES x
ABSTRACT xi
CHAPTER ONE: ORGANIZATIONAL CITIZENSHIP BEHAVIOR 1Organizational Citizenship Behavior: The construct and its origins 1Organizational Citizenship Behavior and Performance 5
Empirical Evidence of OCB-Performance Relationship 9OCB-Performance Relationship: Individual versus Group Level 11
CHAPTER TWO: TASK INTERDEPENDENCE 13Task Interdependence: The Construct Defined 13Task Interdependence of Softball and Tennis Teams 13Task Interdependence as a Moderator of the OCB-Performance Relationship 15
CHAPTER THREE: ANTECEDENTS OF ORGANIZATIONAL CITIZENSHIP BEHAVIOR 17
Group Member Satisfaction 17Group Cohesion 18Leadership 19A Study on the Antecedents of OCB in Sport Teams 21
CHAPTER FOUR: OVERVIEW OF CURRENT STUDY 24Hypotheses 25
CHAPTER FIVE: METHODS 27Participants 27Procedure and Materials 29Measures/Variables 31Demographic Information 31
Team Citizenship Behavior 31Team Cohesiveness 32Perceptions of Transformational Leadership 33Athlete Satisfaction 34Performance Outcomes for Softball and Tennis Teams 34
v
CHAPTER SIX: RESULTS 36Reliability Analyses 36
Preseason Measures 36Postseason Measures 37
Team Citizenship Behavior Scales: Confirmatory Factor Analyses 37Preseason and Postseason Ratings of Self-TCB 38Preseason and Postseason Ratings of Team-TCB 40
Multigroup Confirmatory Factor Analyses 41Preliminary Analyses 46
T-tests (independent and paired) 46Correlational Analyses 48
Primary Analyses 50Multiple Regression Analyses 51
Multilevel Regression Analyses 60
CHAPTER SEVEN: DISCUSSION 66Athlete-Level Results 66
Preseason Rating of Self-TCB 67Preseason Rating of Team-TCB 68Postseason Ratings of Self and Team-TCB 69
Team-Level Results 69Preseason Rating of Self-TCB 69Preseason Rating of Team-TCB 75Postseason Ratings of Self-TCB and Team-TCB 76Relationships Between Variables 77
Limitations and Future Directions 78
APPENDIX A: EMAILS TO COACHES 82
APPENDIX B: DEMOGRAPHIC INFORMATION FORMS 86
APPENDIX C: TEAM CITIZENSHIP BEHAVIOR SCALES 89
APPENDIX D: GROUP ENVIRONMENT QUESTIONNAIRE 93
APPENDIX E: MULTIFACTOR LEADERSHIP QUESTIONNAIRE 95
APPENDIX F: ATHLETE SATISFACTION QUESTIONNAIRES 97
APPENDIX G: T-TESTS 99
APPENDIX H: CORRELATIONAL ANALYSES 106
vi
APPENDIX I: MULTIPLE REGRESSION ANALYSES 111
APPENDIX J: MULTIPLE REGRESSION ANALYSES PREDICTING LOW AND HIGH TASK INTERDEPENDENCE PERFORMANCE COMPOSITES 114
APPENDIX K: MULTILEVEL REGRESSION ANALYSES 117
REFERENCE LIST 120
VITA 125

vii
LIST OF TABLES
Table 1. Goodness-of-fit statistics for measurement models of preseason ratings of self-TCB (N = 427) 39
Table 2. Goodness-of-fit statistics for measurement models of postseason ratings of self-TCB (N = 301) 39
Table 3. Goodness-of-fit statistics for measurement models of preseason ratings of team-TCB (N = 429) 40
Table 4. Goodness-of-fit statistics for measurement models of postseason ratings of team-TCB (N = 301) 41
Table 5. Goodness-of-fit statistics for measurement models of preseason self-TCB scale (softball, N = 339; tennis, N = 88) 42
Table 6. Goodness-of-fit statistics for measurement models of preseason team-TCB scale (softball, N = 345; tennis, N = 84) 42
Table 7. Goodness-of-fit statistics for measurement models of postseason self-TCB scale (softball, N = 240; tennis, N = 61) 43
Table 8. Goodness-of-fit statistics for measurement models of postseason team-TCB scale (softball, N = 240; tennis, N = 61) 43
Table 9. Descriptive statistics of age and year in sport 46
Table 10. Distribution of race/ethnicity across softball and tennis 47
Table 11. Multiple regression results for preseason self-TCB ratings predicting team performance 55
Table 12. Multiple regression results for preseason team-TCB ratings predicting team performance 57
Table 13. Multilevel regression analyses for all athletes with preseason self-TCB predicting individual performance 63

viii
Table 14. Multilevel regression analyses for all athletes with preseason team-TCB predicting individual performance 64
Table 15. Independent t-tests to examine differences between tennis and softball teams on aggregated team variables 100
Table 16. Paired sample t-tests to examine differences between pre- and postseason aggregated team scores for tennis 101
Table 17. Paired sample t-tests to examine differences between pre- and postseason aggregated team scores for softball 102
Table 18. Independent t-tests to examine differences between tennis and softball athletes 103
Table 19. Paired sample t-tests to examine differences between pre- and postseason scores for tennis athletes 104
Table 20. Paired sample t-tests to examine differences between pre- and postseason scores for softball athletes 105
Table 21. Correlations between team-level variables at preseason 107
Table 22. Correlations between team-level variables at postseason 108
Table 23. Correlations between athlete-level variables at preseason 109
Table 24. Correlations between athlete-level variables at postseason 110
Table 25. Multiple regression results for postseason self-TCB ratings predicting team performance 112
Table 26. Multiple regression results for postseason team-TCB ratings predicting team performance 113
Table 27. Multiple regression results for preseason self-TCB ratings predicting low task interdependence performance composite 115
Table 28. Multiple regression results for preseason self-TCB ratings predicting high task interdependence performance composite 116

ix
Table 29. Multilevel regression analyses for all athletes with postseason self-TCB predicting individual performance 118
Table 30. Multilevel regression analyses for all athletes with postseason team-TCB predicting individual performance 119
Table 31. Multilevel regression analyses with postseason team-TCB predicting individual performance 119

x
LIST OF FIGURES
Figure 1. Hypothesis 1A: Individual TCBs are positively related to individual-level performance outcome. 44
Figure 2. Hypothesis 1B: Team TCBs are positively related to team-level performance outcome. 44
Figure 3. Hypothesis 2A: Task interdependence will moderate the effects of individual self-report of TCBs and coach’s ratings of TCB on individual performance. 44
Figure 4. Hypothesis 2B: Task interdependence will moderate the effects of the aggregated value of TCBs and coach’s ratings of TCB on team performance. 45
Figure 5. Hypothesis 3: Athlete satisfaction, team cohesiveness, and perceptions of leadership behaviors will have positive relationships with team-level TCB and with team performance. 45
xi
ABSTRACT
In organizational psychology literature, organizational citizenship behaviors (OCB)
have demonstrated a significant relationship with performance outcomes. However, the existing
research has shown some inconsistencies in the strength and direction of this relationship. More-
over, research has not yet explored the actual relationship between OCB and sports team perfor-
mance (individual- and team-level), nor has research investigated potential moderators of this
relationship. The current study examined the relationship between OCB and sports team perfor-
mance and whether this OCB-performance relationship was moderated by task interdependence
(i.e., sport). Two types of collegiate teams—softball and tennis—were utilized to represent two
different levels of task interdependence with softball being considered more interdependent than
tennis. I surveyed athletes and their respective coaches from these teams. The athletes answered
questions pertaining to team citizenship behaviors (helping, civic virtue, and sportsmanship),
team cohesiveness (GEQ), athlete satisfaction (ASQ), and perceptions of transformational
leadership behaviors (MLQ), while the coaches simply rated each of their athletes on the extent
to which that athlete displays team citizenship behaviors (TCBs). The athletes and coaches filled
out these questionnaires twice, once at the beginning of the season and again at the end of the
season. Performance statistics were collected from each team’s website. Results indicated that
TCBs sometimes significantly predicted performance with helping behavior being the strongest
predictor. However, the effect of TCBs on performance differed between tennis and softball
teams. The circumstances under which TCBs might be helpful are discussed.
1
CHAPTER ONE
ORGANIZATIONAL CITIZENSHIP BEHAVIOR
All teams are not created equal, and research is needed to explore the intricacies
of team dynamics over a variety of different contexts. Though sports teams and organiza-
tional teams come from two different environments with diverse demands, several of the
same constructs underlie performance in both teams. In the separate studies conducted
with sports teams and organizational teams, these constructs have been demonstrated to
have a relationship with performance time and time again. And in everyday discussion,
connections have been made between performances of both groups. For example, many
leaders in business settings use sports analogies to describe aspects of performance in
organizations (e.g., we scored a touchdown, hit a home run, etc.). Studying efficient and
effective organizational teams can shed light on the conditions under which sports teams
are successful. However, there are relatively few studies that have attempted a cross-
disciplinary approach by using organizational constructs to understand performance in
sports teams. This is one purpose of the present study.
Organizational Citizenship Behavior: The construct and its origins
Organizational citizenship behavior (OCB) is a well-studied topic in organization-
al research and could potentially provide insight to group dynamics within sports teams.
The theory underlying OCB can be traced back to Chester Barnard (1938, 1968) who
emphasized the importance of members’ willingness to go beyond that which is required

2
of them. Barnard recognized the importance of formal structure and controls in organi-
zational functioning, but unlike his contemporaries, he did not believe they accounted
for the essential nature of informal, cooperative systems. Specifically, Barnard argued
that “it is clear that the willingness of persons to contribute to the cooperative system is
indispensable” (Barnard, 1938, p. 84). Barnard’s idea of “willingness to contribute” went
beyond mere grudging compliance and possession of skills for performing job tasks.
Instead, Barnard draws a distinction between the formal and informal systems by refer-
ring to “willingness” as an aspect of people that in the collective encourages a stream of
cooperative endeavors and ultimately, a sense of interconnectedness.
Katz and Kahn’s The Social Psychology of Organizations (1966) built upon Bar-
nard’s ideas and argued that effective organizations require three forms of employee con-
tributions. To elicit these employee contributions, the organization must (1) attract and
retain people, (2) ensure that employees demonstrate reliable job performance, and (3)
evoke “innovative and spontaneous behavior: performance beyond role requirements for
accomplishments of organization functions” (p. 337). The third category closely reflects
Barnard’s concept of “willingness to contribute” and includes behaviors such as partici-
pation in cooperative activities with fellow employees, self-training, etc. Though essential
in order for organizations to operate successfully, Katz and Kahn (1939) note that these
extra-role behaviors (i.e., behavior that cannot be required from employees for a given
job) are often taken for granted.
3
“Within every work group in a factory, within any division in a government bu-reau, or within any department of a university are countless acts of cooperation without which the system would break down. We take those everyday acts for granted, and few of them are included in the formal role prescriptions for any job” (p. 339).
Therefore, team members’ abilities to contribute specific skills or carry out specific func-
tions cannot be discounted; however, they are not sufficient for understanding organiza-
tional effectiveness in its entirety.
Organ (1977) also understood that organizational effectiveness was more than just
the sum of its parts. As a response to the skepticism about worker satisfaction affecting
productivity, Organ (1977) played devil’s advocate to both explain and defend the view.
In his article, he does this by making a distinction between tangible measures of perfor-
mance (i.e., quantitative measure of productivity) and other, less tangible (qualitative),
types of worker contributions which could include helping coworkers, following rules of
the workplace, and accommodating changes called for by managers (Organ, 1977). Inter-
estingly, Organ (1977) did not call these contributions OCB nor propose further research
investigating these contributions. Instead, two of his doctoral students—Tom Bateman
and C. Ann Smith—read his devil’s advocacy piece and got the ball rolling.
To elaborate on the nature and forms of “willingness to cooperate,” Bateman
and Organ (1983), as well as Smith, Organ, and Near (1983), proposed the construct of
organizational citizenship behavior (OCB). Bateman’s study (Bateman & Organ, 1983)
was primarily conducted to test the effects of job overload on behaviors and attitudes, and
as an addition, the researchers added to the study the supervisors’ ratings of subjects’ job
performance (quantitative and qualitative contributions). To develop a measure to capture

4
these discretionary contributions (i.e., OCB), Bateman and Organ (1983) began by list-
ing out employee behaviors that fit this description. The list included behaviors such as
“constructive statements about the department, expression of personal interest in the work
of others, suggestions for improvement, training new people, respect for the spirit as well
as the letter of housekeeping rules, care for organizational property, and punctuality and
attendance well beyond standard or enforceable levels” (Organ, 1990, p. 46). In addi-
tion, the list also included negative behaviors that a member refrains from doing, such as
“finding fault with other employees, expressing resentment, complaining about insignifi-
cant matters, and starting arguments with others” (Organ, 1990, p. 46). These latter items
were included to demonstrate that OCB reflects not only the members’ willingness to act
in a constructive manner, but also their willingness to endure occasional costs, inconve-
niences, and minor frustrations on the path to the organization’s collective goals. Unfortu-
nately, the preliminary investigation into the dimensional structure of OCB (based on 30
items) was uninterpretable (Organ, 1983).
Soon after, Smith, Organ, and Near (1983) conducted a study in which they inter-
viewed supervisory personnel in two manufacturing organizations, asking them, “What
are the things you’d like your employees to do more of, but really can’t make them do,
and for which you can’t guarantee any definite rewards, other than your appreciation?”
(Organ, Podsakoff, & MacKenzie, 2006, p. 16). From the managers’ responses, the re-
searchers created a list of behaviors that were expected to positively impact effectiveness
and make the manager’s job easier, and therefore improve the workflow. Using this list of
behaviors, Smith constructed a scale and upon analysis, found that two clear-cut factors

5
emerged—altruism (e.g., helping a specific person) and general compliance (e.g., adher-
ence to various rules).
Since then, Organ (1988) has defined OCB as “individual behavior that is discre-
tionary, not directly or explicitly recognized by the formal reward system, and that in the
aggregate promotes the effective functioning of the organization” (Organ, 1988, p. 4). In
addition, Organ (1988) has suggested that OCB is conceptualized by five factors—help-
ing, conscientiousness, sportsmanship, courtesy, and civic virtue. More recently, Podsa-
koff and MacKenzie (1994) developed a scale based on Organ’s (1988) and Williams and
Anderson’s (1991) conceptualization of OCB, which was further revised by Podsakoff et
al. (1997), that includes these various factors within three subscales—helping behavior
(helping others with or preventing the occurrence of problems), civic virtue (responsible
participation, involvement, and concern about the organization), and sportsmanship (tol-
erating problems without complaining). This conceptualization was utilized in the current
study.
Organizational Citizenship Behavior and Performance
Within the original definition of OCB put forth by Organ (1988), there are two
key distinctions—(1) the emphasis is on volitional behaviors, rather than ones required
by the job, and (2) individual acts of OCB may have little if any effect on organizational
functioning, but the accumulation of such acts will improve team performance (Aoyagi et
al., 2008). More recently, however, Organ (1997) defined OCB as “performance that sup-
ports the social and psychological environment in which task performance takes place”
(p. 95). One notable difference between the original and revision definitions of OCB is
6
that the revised definition highlights the distinction that exists between OCBs and task
performance (Podsakoff et al., 2009). Both OCBs and task performance are potential out-
comes of a variety of individual-level and team-level factors in groups; however, research
has also demonstrated that OCBs can improve performance outcomes in organizations.
Since Organ and his colleagues (Organ and Bateman, 1983; Smith, Organ, &
Near, 1983) developed the construct of OCB, Podsakoff et al. (2009) estimate that more
than 650 articles have been published about OCBs and related constructs. One of the
primary reasons for the interest in OCBs is that they are expected to be positively related
to measures of organizational success. The interest in performance is based on the idea
that more helpful and cooperative employees will perform better and be perceived as
performing better by their supervisors, and help their colleagues perform better result-
ing in increased collective performance. The notion that OCB influences performance is
founded on theories such as the Social Exchange Theory (Blau, 1964) and the norm of
reciprocity (Gouldner, 1960). Organ provides an example of such behavior in his book,
Organizational citizenship behavior: its nature, antecedents, and consequences (Organ,
Podsakoff, & MacKenzie, 2006).
During his summer college days, Dennis Organ worked at a local paper mill. On
one particular night, Dennis was assigned the task of pushing large rolls of paper off an
elevator and then fitting metal bands around each end of each roll with a special tool.
He believes that most people could have picked up the task in just a few trials but his
mechanical ineptitude prevented him from doing so. He wasn’t able to keep up with the
loads of paper coming off the elevator. Fortunately, a regular paper mill employee saw

7
him struggling and came over to assist. Without criticism, the man (who Dennis refers
to as Sam, short for the Good Samaritan) helped Dennis make it to the end of his shift
without the whole factory having to slow down their machines due to Dennis’ awkward
operating skills. In this situation, Sam willingly helped Dennis (without being ordered or
requested to do so, and without reward) perform his task (possibly affecting his ability to
perform his own task), and later, Dennis reciprocated the favor. Sam’s behavior contrib-
uted in a small way to the functioning of the group, and overall, to the functioning of the
paper mill. Alone, Sam’s actions may not have impacted the organization greatly. How-
ever, if such actions were repeated over and over again by Sam, Dennis, and other mem-
bers of the paper mill, the aggregate of these actions over time could result in a better
functioning paper mill than if these actions were infrequent. In addition, Sam’s supervisor
might be inclined to give higher performance ratings to Sam because of his behaviors
(Borman & Motowidlo, 1997; Borman, White, & Dorsey, 1995).
For a variety of reasons, OCBs have the potential to influence performance evalu-
ations and judgments made by managers. Managers might base their evaluations of em-
ployees on OCBs due to conscious (e.g., importance of OCB, job expectations, OCB as a
sign of employee commitment, and notions of fairness) and/or unconscious (e.g., implicit
theories, schema-triggered affect, behavioral distinctiveness, attributional processes, and
illusory correlations) processes (Organ et al., 2006). For example, managers who value
OCBs and feel these behaviors enhance organizational effectiveness will be likely to fa-
vorably evaluate employees who exhibit more OCBs than those who exhibit fewer OCBs.
In addition, researchers have identified multiple reasons why OCBs might influ-

8
ence organizational effectiveness or performance. For one, OCBs have the potential to
enhance coworker or managerial productivity (cf. MacKenzie, Podsakoff, & Fetter, 1991,
1993; Organ, 1988; Podsakoff & MacKenzie, 1994). When employees voluntarily help
new coworkers learn the ropes, the coworkers become better employees faster, which in
turn benefits the work group as a whole. This concept can also be applied to sport teams.
When more experienced players take time to help new players figure out how practices
are run, the new player will catch on quicker, allowing practices to run more smoothly
and effectively. Also, helping behaviors exhibited by employees or athletes can enhance
managerial productivity. If the manager or coach does not have to take time explaining
the ins and outs to the new employee/athlete, that frees up their time to focus on more
productive tasks such as planning. Managerial productivity may also be boosted when
group members offer suggestions for improving group performance (civic virtue) or don’t
waste the manager’s time by complaining about trivial issues (sportsmanship) (Organ et
al., 2006).
OCBs may also improve organizational performance by reducing the need to de-
vote valuable resources to purely maintenance functions (Organ, 1988; Organ et al., 2006).
Helping behaviors such as cheerleading (e.g., encouraging group members when they
are down) and peacekeeping (e.g., acting like a peacemaker when other group members
have disagreements) often result in enhanced team spirit, morale, and cohesiveness, which
reduces the need for the group to spend time and energy on group-maintenance functions.
Similarly, courteous behavior such as not creating problems decreases conflict within the
group, which again reduces the need to allocate time to conflict-management activities.

9
OCBs might also benefit an organization by decreasing the variability in its per-
formance. Employees can minimize variability in performance by voluntarily (1) picking
up slack for workers who are absent or have heavy workloads (helping), (2) participat-
ing in cross-training (self-development), and (3) going above and beyond the call of
duty in performing one’s own work responsibilities (conscientiousness) (Organ et al.,
2006). When employees help out fellow workers who are absent or overburdened, they
are facilitating the successful completion of projects. With regard to sport teams, athletes
can help out their fellow team members when they miss a practice due to unforeseen
circumstances. That way, the absent athlete gets the practice time they need to perform,
and the whole team benefits from that athlete’s performance. Employees who work on
self-development are better able to take on various roles to help out the organization, and
in the same way, athletes who practice different positions or skills are able to fill in if a
teammate is injured. Finally, the extent that employees and athletes go above and beyond
the call of duty is an indicator of their commitment both to their personal development
and the development of the group. Organ et al. (2006) admits that, individually, these
behaviors may be inconsequential, but collectively, they have the power to significantly
improve organizational performance.
Empirical Evidence of OCB-Performance Relationship
The OCB construct is young. When Organ and colleagues first started research-
ing OCB in the early 1990s, there was only one known study to have examined the
OCB-performance relationship. Karambayya (1990) was the first to explicitly explore
the relationship between work unit performance/satisfaction and unit member’s OCBs.

10
Utilizing 18 intact work groups, she measured performance ratings for the work groups,
employee OCB ratings from supervisors, and self-report of satisfaction from employees.
As expected, she found that employees in high-performing work groups were more satis-
fied and exhibited more OCBs than their low-performing counterparts. Though the results
were promising, Organ et al. (2006) claims that a few limitations (e.g., subjective ratings
of performance) compromise the validity of the study. As a response to Karambayya’s
(1990) pioneering study, Organ and colleagues began a series of studies to reliably assess
the relationship between OCBs and organizational effectiveness (cf. Table 7.2 in Organ et
al., 2006). Specifically, the studies examined the effects of OCB on group/organizational
effectiveness in insurance agency units (Podsakoff & MacKenzie, 1994), pharmaceutical
sales teams (MacKenzie, Podsakoff, & Ahearne, 1996), paper mill work crews (Podsa-
koff, Ahearne, & MacKenzie, 1997), and limited-menu restaurants (Walz & Niefhoff,
2000). The referenced studies primarily used objective measures of group performance
(quantity and quality) and relatively traditional measures of OCBs.
All of the studies reported by Organ et al. (2006) in Table 7.2, with the excep-
tion of Karambayya’s study, utilized a variation of the scale developed by Podsakoff
and MacKenzie (1994) which measures three OCB dimensions—helping behavior,
sportsmanship, and civic virtue. This conceptualization of OCB was used in the current
study as well. Overall, the studies reported by Organ et al. (2006) provide support for
OCB-performance relationship. Specifically, helping behavior was significantly related to
every outcome variable except for customer complaints in Walz & Niehoff’s (2000) study
(limited-menu restaurants). Moreover, helping behavior always had a positive impact on

11
performance with the exception of the negative impact it had on quantity of performance
in Podsakoff and Mackenzie’s (1994) study (insurance sales sample), which was attribut-
ed to high turnover rate and other factors potentially tied to task characteristics (e.g., task
interdependence). For example, insurance agents were compensated based on individual
performance, which could affect the degree to which the agents helped one another, and
the degree to which helping another agent detracted from one’s own performance. Similar
to helping behavior, civic virtue generally enhanced performance with positive effects
for the insurance agency units, pharmaceutical sales teams, and limited-menu restaurants
(Podsakoff & MacKenzie, 1994; MacKenzie et al., 1996; Walz & Niehoff, 2000). Finally,
sportsmanship was found to improve the quantity of performance, but only in the insur-
ance agency units and paper mill work crews.
OCB-Performance Relationship: Individual versus Group Level
Research has provided evidence in support of the relationship between OCBs and
performance, but currently, much of the evidence exists at the individual level of analysis.
For example, research has demonstrated that OCBs impact a number of individual-level
outcomes such as performance evaluations, reward allocation decisions, and employee
withdrawal-related activities (e.g., turnover intentions, actual turnover, and absentee-
ism) (Podsakoff et al., 2009). As mentioned before, managers or supervisors may include
OCBs in their performance evaluations and reward allocation decisions because they may
recognize that these behaviors may make their own jobs easier. Numerous scholars argue
that there is also a relationship between OCBs and group-level performance and that it
may be distinct from the individual level of analysis. In fact, Organ and Ryan (1995)

12
argued that, “OCB is more interesting as a group-level phenomenon and… this is the
preferred level at which to theorize about… OCB” (p. 797). Studies, like those presented
above, investigating this relationship have indeed found that OCBs have the potential to
affect organizational effectiveness, customer satisfaction, and group- or unit-level turn-
over (Podsakoff et al., 2009).
Though there is substantial evidence that OCBs have a relationship with group-
level performance outcomes, the direction of this relationship is not always consistent.
For example, helping behavior can increase (Podsakoff et al., 1997) or decrease (Pod-
sakoff & MacKenzie, 1994) work group performance. In addition, average effect sizes
differ across different kinds of group. According to Nielsen et al.’s (2009) meta-analysis,
these effects sizes range from r = -.36 in bank branches (Naumann & Bennett, 2002) to
r = .44 in military units (Ehrhart et al., 2006). Due to these existing inconsistencies in the
literature, more research is needed at the group level examining the OCB-performance
relationship as well as addressing potential moderators of this relationship such as task in-
terdependence, criterion type (i.e., subjective vs. objective measures of performance), and
rating source (e.g., peers, supervisors, self) (Nielsen et al., 2009; Podsakoff et al., 2000).
The present study aimed to examine the relationship between OCB and performance
while taking task interdependence into account as a potential moderator of this relation-
ship. Moreover, this relationship was addressed at both the individual- and group-levels;
however, the group-level was the primary focus.

13
CHAPTER TWO
TASK INTERDEPENDENCE
Task Interdependence: The Construct Defined
Task interdependence can be defined as the extent to which group members (e.g.,
employees or teammates) depend on other members of their group to carry out the task
effectively and efficiently (Bachrach et al., 2006; Van der Vegt & Janssen, 2003; Brass,
1985; Kigundu, 1983). In a high task interdependence situation, group members may
be more likely to work together on the task and exchange information and resources
(McCann & Ferry, 1979; Thompson, 1967). A low task interdependence situation may
be characterized as an individual working alone but still contributing to a shared group
task (Kiggundu, 1983; Mitchell & Silver, 1990). In general, the members within a soft-
ball team and the members within a tennis team have independent tasks (e.g., batting or
singles matches) that contribute to the overall group task (e.g., playing softball to win, or
winning the overall tennis tournament). However, there are instances in which softball
teams and tennis teams perform highly interdependent tasks (e.g., subtasks) on the way to
achieving their overall goal.
Task Interdependence of Softball and Tennis Teams
In softball, batting may be a relatively independent action by each player, whereas
defense is a combination of the individual’s actions with the actions of other team mem-
bers. It can be argued that batting is not a completely individual action because batting
14
contributes to overall offense. For example, the coach may signal to the batter to lay
down a bunt in order to advance the runner on first to second. This action requires that the
batter get the bunt down and the runner makes sure the bunt is down before running to
second. Ultimately, the batter is sacrificing her opportunity to hit for the good of the team.
Defense requires even more coordination between players. For example, say the team is
on the field for defense and there is a runner from the opposing team on first base. The
players have to be aware of the runner on first in case of a steal, but also need to be ready
to react according to where the ball is hit. The batter hits a hard grounder to shortstop. Si-
multaneously, the runner is running, the shortstop is fielding the ball, the second baseman
is running to cover second base, the first baseman is running to cover first base, the right
fielder is running to back up first base in case of a poor throw, the third baseman is cover-
ing third in case of an error, and the center and left fielders are backing up their respective
bases. In a perfect scenario, the shortstop cleanly fields the ball and whips it to second for
an out, then the second baseman turns the ball for a double play at first. On this particular
play (i.e., a grounder to short stop), team performance depends on the individual perfor-
mance of the shortstop, second baseman, and first baseman as well as their combined,
coordinated efforts. The double play is not successful if any one player makes a mistake.
Along the same lines, tennis players will sometimes play doubles matches, which reflect
a high task interdependence situation. In a doubles match, two tennis players have to
demonstrate highly coordinated actions within a relatively small space. This goes to show
that teams are multifaceted, as well as their tasks, and do not always fall in one category.
However, certain sports do reflect a general level of task interdependence and this level of
15
task interdependence may differ among sports. For example, basketball and rowing teams
could be considered highly interdependent, softball and baseball teams could be consid-
ered moderately interdependent, and tennis and golf teams could be considered the least
interdependent of sports teams. Many organizations are set up such that individuals work
relatively independently on group tasks. Softball and tennis were chosen as the two sport
teams of interest because both reflect similar task structures to many organizations.
Task Interdependence as a Moderator of the OCB-Performance Relationship
For both low and high interdependent tasks, performance depends on the suc-
cessful coordination of skills and effort among members and other team levels processes
such as collective efficacy. However, the strength of the relationship between team level
processes (e.g., team cohesiveness, collective efficacy) and group performance might
depend on the level of task interdependence. For example, team cohesiveness has been
demonstrated to have a positive relationship with performance in both low and high task
interdependence situations. However, team cohesiveness may be more important in teams
that perform tasks high in interdependence. In other words, a task that requires a lot of
coordination also requires some degree of cohesiveness among its members, more so than
a task that requires less coordination.
In the same way, the relationship between OCB and performance may depend
on the level of task interdependence (Organ, 1988). Though OCB researchers (Pearce
& Gregersen, 1991; Organ, 1988; Organ, Smith, & Near, 1983) have acknowledged the
potential for task interdependence to affect employee OCB, little research has actually
explored the influence of task interdependence on the OCB-performance relationship.

16
Theoretically, all teams, regardless of level of task interdependence, should benefit from
OCB. However, the degree to which OCB impacts performance may depend on the level
of task interdependence (Podsakoff et al., 2000).
Performance in organizations is evaluated mainly based on performance evalu-
ations given by managers, and research has shown that managers take these altruistic
behaviors into account when evaluating their employees (Podsakoff, MacKenzie, Paine,
& Bachrach, 2000). Therefore, the importance that managers attribute to these behaviors
should correspond to the impact these behaviors have on performance (Podsakoff et al.,
2000). Bachrach, Powell, Bendoly, and Richey (2006) recently explored the impact of
task interdependence on the relationship between OCB and performance evaluations in
three separate studies and found that task interdependence may affect the importance at-
tributed to OCB by evaluators. Specifically, OCB is weighted as more important in high
task interdependence situations. However, how does task interdependence interact with
OCB to influence performance? Bommer et al. (2007) conducted a study that examined
OCB across different levels of interdependence and found that the degree of interdepen-
dence required for the performance of a team’s task may impact the appropriateness and
frequency of OCBs (Nielsen et al., 2009). This is just one study, and more research is
needed to examine the actual effects of OCB on performance at different levels of task
interdependence.

17
CHAPTER THREE
ANTECEDENTS OF ORGANIZATIONAL CITIZENSHIP BEHAVIOR
Since the development of the construct, researchers have discovered various
antecedents of OCB such as individual characteristics, task characteristics, organizational
characteristics and leadership behaviors, as well as organizational effectiveness (primary
consequence) (Aoyagi et al., 2008). Group member satisfaction has been the main indi-
vidual characteristic studied thus far. Cohesion is the only organizational characteristic
that has shown a consistent, positive relationship with OCB. Task characteristics have
received the least research attention thus far. OCB has accounted for variance (ranging
from 18 to 39%) in various aspects of performance over multiple studies (Aoyagi et al.,
2008). Group member satisfaction, cohesion, and leadership are common constructs in
both Organizational and Sports Psychology. If these characteristics influence OCB in or-
ganizational teams, it stands to reason that these constructs can be applied to understand
OCB in sports teams.
Group Member Satisfaction
Group member satisfaction is simply the extent to which the employee is satisfied
with various aspects of their job (e.g., work, boss, etc.). One reason that Organ developed
the concept of OCB was because he believed that the job satisfaction–job performance
relationship could not be adequately explored by merely using quality and/or quantity as
the sole measures of performance (Aoyagi et al., 2008). Workers, whether satisfied or not,

18
still have to complete their work, or they will be replaced. Though performance measures
are necessary in investigating this relationship, Organ felt it necessary to also identify
behaviors in which satisfied group members would be more likely to engage to promote
the overall effectiveness of the team. As predicted, Bateman and Organ (1983) found that
the relationship between satisfaction and OCB was stronger than the relationship between
satisfaction and performance. In a meta-analysis, Bateman and Organ (1995) found that
satisfaction had correlations of .22 to .24 with types of OCB (e.g., helping) which are
comparatively stronger than the .18 correlation between job satisfaction and performance
(measures based on quality and/or quantity of work). Although these correlations are
quite modest, it is important to note that the correlations in their meta-analysis are based
on single-factor OCB measures. When the single-factor measures are treated as individual
indicators of an overall latent factor (as in structural equation modeling), the correlation
between satisfaction and OCB is .38 (.44 when value is corrected for reliability of mea-
sures) (Aoyagi et al., 2008). Group member satisfaction has been found in most cases to
be positively related to OCB and is expected to demonstrate the same relationship in this
study.
Group Cohesion
Coaches and leaders are often interested in enhancing the cohesiveness of their
teams because cohesion and performance are also believed to be positively related. Group
cohesiveness refers to the extent that group members feel like they belong to the group.
Specifically, Carron et al. (1998, 2002) define cohesion as “a dynamic process that is re-
flected in the tendency of a group to stick together and remain united in the pursuit of its

19
instrumental objectives and/or satisfaction of member affective needs” (p. 213). Highly
interdependent teams such as a rowing team and a fireman crew will be more effective
if its group members are united in pursuit of a common goal. This is because success
depends on highly coordinated actions in which team members are very reliant on each
other. This should hold true even with groups containing individuals that function some-
what independently from each other. Based on this theory, a softball team and a tennis
team will not perform to their greatest potential if the team members are not cohesive. If
the teams lack cohesiveness, the members will be disjointed and unlikely to work to-
gether to achieve their group goals. Because group members in highly cohesive groups
tend to engage in more positive and frequent interactions (Schriescheim, 1980), they also
experience more positive psychological states than do members in noncohesive groups
(Gross, 1954). Individuals who perceive things in a positive way are more prone to be
prosocial (George & Brief, 1992; Isen & Baron, 1991). As a result, these individuals are
more likely to participate in OCB behaviors toward their group members. Similar to the
relationship between group member satisfaction and OCB, cohesion has been found to be
positively related to OCB.
Leadership
Zaccaro, Heinen, and Shuffler (2009) claim that team leadership is absolutely
essential for team effectiveness. Leaders serve multiple functions for the team. Zaccaro
et al. (2009) pinpoint three core team leadership functions: “(1) setting the direction for
team action; (2) managing team operations; and (3) developing the team’s capacity to
manage their own problem-solving processes.” (p. 95). These functions fall under the

20
umbrella of responsibilities for both coaches and bosses. Summed up, leaders help the
team set goals and adhere to the goals, assign roles to the team members, promote cohe-
siveness, and manage conflict. The contribution of leadership to any one team depends
on the degree to which the leaders help the team members accomplish more together than
the sum of all of their individual abilities or efforts (Zaccaro et al., 2009). Leaders should
strive to provide direction for collective action and help the teams maintain a state of
minimal process loss (Zaccaro et al., 2009). The importance of leadership is illustrated in
sports teams that consistently rank at the top of their divisions year after year with differ-
ent players, but always with the same coach. Leaders must have a team with the resources
to perform the task as well as the appropriate techniques to shape the team.
However, all types of leadership behaviors and techniques are not equal across
different teams and tasks. The two frequently advocated forms of leadership for teams
are transformational leadership and empowering leadership. Transformational leader-
ship “uses charisma and intellectual stimulation to encourage team followers to transcend
personal self-interest in order to accomplish team goals” (Stewart, 2006). Empower-
ing leadership “develops follower self-capacity to achieve a state where teams actually
lead themselves” (Stewart, 2006). The most effective type of leadership depends on the
team and the task. Generally, coaches on sports team utilize transformational leadership
to motivate team members to improve the collective good. Softball and tennis, like any
sport, can be unpredictable. Motivation does not translate into performance in all cases.
For example, batters will go through “slumps” where their hitting leaves something to
be desired. From experience, it is not for lack of trying, but rather lack of confidence.

21
Besides the typical details (e.g., forming a lineup), coaches are in a position to inspire
confidence in team members and provide direction. All in all, effective leadership should
set the stage for success. Though leadership has been identified by leaders in both sport
and business as crucial for success (Weinberg & McDermott, 2002), there has been very
little research on its relationship with OCB, especially with regard to sports teams.
A Study on the Antecedents of OCB in Sport Teams
With the purpose of introducing OCB into sport psychology literature and exam-
ining its utility in sport, Ayoagi et al. (2008) conducted a study with 193 student-athletes
investigating the relationship between predictors of performance (leadership, cohesion,
and satisfaction) and OCB. The researchers predicted that leadership would be associated
with satisfaction, cohesion, and OCB, satisfaction would be related to cohesion and OCB,
and cohesion would be associated with OCB. Using SEM, their hypothesis was partially
supported. Their results indicated that their path model provided an acceptable fit to the
data. All regression paths were significant except for the path between athlete satisfaction
and OCB. And, all the regression weights were positive except for the effects of leader-
ship on cohesion and satisfaction on OCB. The nonsignificant athlete satisfaction–OCB
relationship was especially surprising since OCB originated to better explain the satis-
faction–performance relationship. However, the relationships between satisfaction and
cohesion and cohesion and OCB were especially strong. The researchers attribute the
nonsignificant satisfaction–OCB relationship to the strength of cohesion as a predictor
in sports compared to an organizational environment. Finally, the negative relationship
between leadership and cohesion was unexpected. The researchers suggest that maybe

22
“when athletes are at odds with their coach, they turn to each other for support and be-
come a more cohesive unit” (Aoyagi et al., 2008, p. 37). In summary, Aoyagi et al. (2008)
demonstrated significant correlations between OCB and team cohesion and athlete satis-
faction. Moreover, past research shows that team cohesion and athlete satisfaction have
both demonstrated significant relationships with team performance. Overall, this offers
preliminary evidence for the validity of OCB as a predictor of team performance in sport,
and the authors provide some future directions. There are also major limitations in this
study that need to be addressed in future studies.
In this study, OCB was only measured from the perspective of the athletes, which
calls into question the reliability of self-report data. However, the athletes were prom-
ised confidentiality, so this should not have been an issue that greatly influenced athlete
responses. Still, the authors suggest measuring OCB from different perspectives (e.g.,
coaches and teammates). In addition, the way in which leadership was measured (in-
cluding multiple components such as autocratic behavior and democratic behavior) may
have led to the unexpected negative relationship between leadership and team cohesion.
Because of this, the authors call into question the validity of their leadership measure. In
addition, the data were gathered in a relatively short time space and left no room for pre-
dicting possible changes over the course of a season. Finally, performance was not mea-
sured in this study. Performance must be measured in future studies to accurately depict
the relationship between OCB and performance.
Though not mentioned in the limitations section of this study, it would be infor-
mative to see whether relationships between the constructs differ based on task type and

23
level of interdependence. A seemingly obvious limitation is the use of athletes from both
individual sports (i.e., track, golf, wrestling, etc.) and team sports (i.e., soccer, basketball,
softball, etc.). All of these athletes were clumped together for the analysis. This is a major
issue considering that individual sports require little to no communication and coordina-
tion, and therefore, cohesiveness between teammates compared to team sports. Even the
represented team sports ranged in levels of interdependence of team members. In future
research, it is important that team sports be categorized based on level of interdepen-
dence. As this study was the first study of OCB in sports, more research is needed on
examining the relationships between OCB and constructs related to performance, as well
as performance itself. This is a major aim of the present study.
24
CHAPTER FOUR
OVERVIEW OF CURRENT STUDY
The primary purpose of this study was to examine the relationship between or-
ganizational citizenship behaviors (OCB), an organizational construct, and sports team
performance. In addition, the study assessed whether this OCB-performance relationship
is moderated by task interdependence (i.e., sport). In organizational psychology literature,
OCB has demonstrated a significant relationship with both individual- and group-level
organizational outcomes time and time again. However, the existing research has shown
some inconsistencies in the strength and direction of this relationship. Aoyagi et al.
(2008) was the first to introduce OCB into sport psychology literature and offered pre-
liminary evidence for OCB as a unique and meaningful construct in sports. In addition,
Aoyagi et al. (2008) identified three main antecedents of OCB in sports—athlete satisfac-
tion, cohesion, and leadership behavior. In his study, athlete satisfaction and cohesion
were positively related with OCB. Opposite to what was predicted, leadership behavior
was negatively related to OCB, which calls for further research into the leadership be-
havior–OCB relationship and the scale used to measure leadership behavior. Most impor-
tantly, research has not yet explored the actual relationship between OCB and sports team
performance (individual- and team-level), nor has research investigated potential modera-
tors of this relationship. The present study utilized two types of collegiate teams—softball
and tennis—to represent two different levels of task interdependence with softball being

25
considered more interdependent than tennis. Due to the groups of interest, organizational
citizenship behaviors were termed team citizenship behaviors (TCBs).
Hypotheses
Hypothesis 1A
I predict that individual ratings of self-TCBs and team-TCBs will be positively re-
lated to an individual-level performance composite. In addition, I predict that the coach’s
overall TCB rating of the athlete will be positively related to individual performance.
Research in organizational psychology has shown that individual TCBs are linked to im-
proved individual performance and this effect is expected in the sports domain as well.
Hypothesis 1B
I predict that team-level TCBs, which are aggregated scores of the team members’
ratings of self-TCBs and team-TCBs, will be positively related to a team-level perfor-
mance composite. In addition, it is predicted that the coach’s average TCB rating of the
team will be positively related to team performance. Organ and Ryan (1995) argued that
it is more informative to examine the OCB construct at the group-level since an aggregate
of these behaviors is believed to positively impact organizational effectiveness. The TCB-
performance relationship is also expected to be present in sport teams.
Hypothesis 2A
I predict that sport will moderate the effects of individual self-report of TCBs and
coach’s ratings of TCB on individual performance. Specifically, the TCB-performance
relationship is expected to be stronger for softball athletes compared to tennis athletes.
26
Hypothesis 2B
I predict that sport will also moderate the effects of the aggregated value of TCBs
and coach’s ratings of TCB on team performance. Specifically, the TCB-performance
relationship is expected to be stronger for softball teams compared to tennis teams.
Hypothesis 3
I predict that athlete satisfaction, team cohesiveness, and perceptions of leadership
behaviors will have positive relationships with team-level TCB and with team perfor-
mance. Research has demonstrated positive, significant relationships among the above
variables and these relationships are expected to be present in the current study as well.
27
CHAPTER FIVE
METHODS
Participants
I recruited women’s collegiate softball and women’s collegiate tennis teams from
NCAA Division I, Division II, and Division III universities and colleges that are gener-
ally located in the Midwest, or very near. After contacting over 225 coaches, 25 softball
coaches and 15 tennis coaches agreed to have their teams participate in the study. The
distribution of Divisions was somewhat different between softball and tennis—Division
I (softball, 24%; tennis, 60%), Division II (softball, 44%; tennis, 20%), and Division III
(softball, 32%; tennis, 20%). Teams did not differ in performance based on NCAA Divi-
sion level. On average, softball teams were composed of 19 members, and on average,
tennis teams had 9 members. The teams included 458 softball athletes (77.4%) and 134
tennis athletes (22.6%) for a total of 592 athletes. In the preseason, 448 of the 592 ath-
letes responded to the survey for an overall response rate of 75.7%. Of the 448 athletes
who responded in the preseason, 357 were softball athletes (79.7%) and 91 were tennis
athletes (20.3%). In the postseason, 325 of the 592 athletes responded to the survey for
an overall response rate of 54.9%. Of the 325 athletes who responded in the postseason,
258 were softball athletes (79.4%) and 67 were tennis athletes (20.6%). The proportions
of responses in the preseason and postseason accurately reflect the overall proportion of
softball and tennis athletes in this sample. A smaller portion of athletes (N = 272, 46%)

28
responded both at preseason and postseason. Of the 272 athletes that responded both at
preseason and postseason, 218 (80%) were softball and athletes and 54 (20%) were tennis
athletes. Three of the 25 softball teams did not participate in the postseason survey. At
the team level, an independent samples t-test indicated that the three teams that did not
respond in the postseason did not differ in performance from the teams that did respond.
At the individual level, to determine whether those who responded to the survey
were different to those who did not respond, I conducted independent samples t-tests.
Performance data and a coach TCB rating were available for almost every athlete. When
comparing these two groups in the preseason, those who responded did not demonstrate
significantly different performance scores or coach ratings. This indicates that, in the
preseason, the athletes who responded were representative of the all of the athletes in the
sample. In the postseason, those who responded had similar performance scores to those
who did not respond. However, these groups differed on coach TCB rating such that
those who responded (M = 6.0) were given significantly higher coach ratings than those
who did not respond (M = 5.6). These results could indicate that athletes who are given
higher TCB ratings (i.e., exhibit more TCBs) were more likely to respond in the postsea-
son compared to those who received lower coach ratings.
Finally, I compared those who responded at preseason but not at postseason to
those who did respond at postseason to determine if the athletes who dropped out were
markedly different than the athletes who did not drop out. On the performance measure,
there were no significant differences between athletes who responded and those who
dropped out of the study. However, there were some differences between these groups
29
on the preseason and postseason coach ratings of TCB. Namely, those who responded in
the postseason were given higher TCB ratings by their coaches than those who did not
respond. Once again, this could demonstrate that athletes who receive higher TCB rat-
ings (i.e., participate in more TCBs) were more likely to exert the effort to respond to the
survey compared to those who received lower ratings.
Based on the preseason sample, the ages of the athletes ranged from 17 to 23 with
an average age of 19.8 (SD = 1.2). The number of years having participated on the team
(i.e., year in sport) ranged from one to six years with an average of 2.2 years (SD = 1.2).
This indicates that an average respondent was likely to be a sophomore. The preseason
sample was primarily composed of Caucasians (approximately 90%), followed by small
percentages who identified themselves as Hispanic/Latino (3.4%) and African-American/
Black (1.4%). The remaining 5% of the sample classified themselves among the fol-
lowing races/ethnicities—Asian (0.9%), Multiracial (0.9%), Filipino/Filipino-American
(0.7%), Biracial (0.7%), American Indian/Alaska Native (0.2%), East Indian/Pakistani
(0.2%), Pacific Islander (0.2%), and Other (1.1%). As expected, the postseason sample
demonstrated similar demographic characteristics to the preseason sample. Athletes who
responded to both the preseason and postseason surveys were entered into a raffle draw-
ing, of which 20 athletes were randomly selected to receive a $20 Visa gift card.
Procedure and Materials
I compiled a list of Midwestern universities and colleges along with the contact
information for their softball coaches and tennis coaches, which included the head coach
and assistant coaches for each team. A separate email was sent to each team explaining
30
the purpose of the study and asking whether the coach would be interested in participat-
ing (See Appendix A for Recruitment Email to Coaches). If the coach indicated that they
would be interested in their team participating in the study, I sent a follow-up email with
additional information about how the study would proceed (See Appendix A for Response
to Coaches Who Are Interested). If the coach indicated that they might be interested in
their team participating, I sent a follow-up email with additional information to help them
decide whether they would like to participate (See Appendix A for Response to Coaches
Who Might Be Interested). If the coach indicated that they were not interested, I sent an
email thanking them for their time.
Before the first questionnaires were sent out in January, coaches were asked to
provide an electronic statement saying they agree to have their team participate in the
study. After that statement was received, the link to fill out the athlete questionnaire was
sent to the coach who then forwarded it to their team. There was also a separate link
for the coach’s questionnaire. Both questionnaires were created on SurveyMonkey and
were available on any computer that had access to the internet. At the beginning of both
questionnaires, there was an informed consent form in which the athlete or coach had to
select an option that says, “Yes, I agree to participate” to continue on to the questionnaire.
The athlete’s questionnaire included measures of team citizenship behavior, team cohe-
siveness, athlete satisfaction, and perceptions of leadership behaviors, and took between
10 and 15 minutes. The coach’s questionnaire involved the coach rating each player on
one question, the extent to which that player demonstrates team citizenship behaviors,
and took between 5 and 10 minutes. The first questionnaire came at the beginning of
31
the team’s season (January/February) and the second and last questionnaire came after
conference games but before tournament play (April/May). At the end of the season (after
tournament play), I collected performance statistics from each team, which represented
their performance over the season. These statistics were available on each team’s website
and could be viewed by the public.
Measures/Variables
Demographic Information
Student-athletes indicated their full name (for the purposes of matching their pre-
and postseason survey responses), college/university, sport, role(s) on their team, year in
school, years on the team, age, and race/ethnicity. Similarly, coaches indicated their full
name, college/university, sport, coaching responsibility to team, years having coached at
the current program, years having coached in their career, age, gender, and race/ethnicity
(See Appendix B).
Team Citizenship Behavior
The measure of Team Citizenship Behavior (TCB) is based on a construct in
Organizational Psychology literature, Organizational Citizenship Behavior (OCB),
developed by Organ (1988). Empirical research by MacKenzie, Podsakoff, and Fetter
(1991, 1993), Podsakoff and MacKenzie (1994), and Podsakoff et al. (1997) has shown
that OCB is best measured by three subscales—helping behavior, sportsmanship, and
civic virtue. The items from the OCB scale were translated to apply to sports teams (e.g.,
“Willingly share my expertise with other members of the crew” to “Willingly share my
expertise with other teammates”). Most OCB research has measured citizenship behavior

32
from the perspective of the supervisor rather than from the work group members them-
selves. In this study, team citizenship behavior was measured both from the perspective
of each athlete as well as their respective coach. The athlete filled out the scale twice—
once with regard to their self-TCB, and again with regard to their team’s TCB. For the
athlete questionnaire, the three subscales of the TCB—helping behavior, sportsmanship,
and civic virtue—had seven items, three items, and three items, respectively. All items
were rated using a 7-point rating scale (1 = strongly disagree, 2 = disagree, 3 = disagree
somewhat, 4 = neutral, 5 = agree somewhat, 6 = agree, 7 = strongly agree). See Appendix
B. Podsakoff and MacKenzie (1994) have demonstrated the convergent and discriminant
validity of the OCB measure. In the interest of time, the coach’s questionnaire required
the coach to provide one overall rating of team citizenship behavior for each athlete. See
Appendix C.
Team Cohesiveness
Team cohesiveness refers to the extent that team members feel like they belong to
the team. A revised version of the Group Environment Questionnaire (GEQ; Carron et al.,
1985) was used to measure cohesion. Carron et al. (1985) developed the Group Environ-
ment Questionnaire (GEQ), which is based on a conceptual model in which cohesion is
considered to be a result of four primary constructs—Individual Attractions to the Group-
Task (member’s feelings about his or her personal involvement with the group’s task),
Individual Attractions to the Group-Social (a member’s feelings about his or her personal
social interactions with the group), Group Integration-Task (a member’s perceptions of
the similarity and unification of the group as a whole around its tasks and objectives),
33
and Group Integration-Social (a member’s perception of the similarity and unification of
the group as a social unit). Because the individual attractions subscales had some over-
lap with the other measures, only the group integration-social (4 items) and group inte-
gration-task (5 items) subscales of GEQ were included in the preseason and postseason
surveys. All items were rated using a 7-point rating scale described above. Higher scores
reflect stronger perceptions of cohesiveness within the team. See Appendix D.
Perceptions of Transformational Leadership
A portion of the Multifactor Leadership Questionnaire - Member Form (MLF-
MF; Avolio & Bass, 2004) (Appendix E) was used to measure athletes’ perceptions of
their coach’s leadership behaviors. The MLQ-MF is a 45-item questionnaire that mea-
sures multiple aspects of transactional, transformational, and laissez-faire leadership
behaviors. In the athlete questionnaires, only the scales measuring transformational lead-
ership behaviors were included since these are the leadership behaviors of interest. The
transformational leadership scales in the MLQ-MF measure idealized influence (attribute;
e.g., “Displays a sense of power and confidence”), idealized influence (behavior; e.g.,
“Specifies the importance of having a strong sense of purpose”), inspirational motivation
(e.g., “Articulates a compelling vision of the future”), and individualized consideration
(e.g., “Helps me to develop my strengths”). The scale for intellectual stimulation was
excluded because the items are not as relevant in a sport setting (e.g., “Seeks differing
perspectives when solving problems”). Ultimately, there were 12 items measuring trans-
formational leadership behaviors and each item was rated on a 5-point scale (0 = not at
all, 1 = once in a while, 2 = sometimes, 3 = fairly often, and 4 = frequently, if not always)

34
indicating the frequency with which the coach fits these statements. The MLQ-MF has
shown adequate reliability and validity (Avolio & Bass, 2004).
Athlete Satisfaction
Athlete satisfaction was measured using the Athlete Satisfaction Questionnaire
(ASQ) (Riemer & Chelladurai, 1998). The complete ASQ includes 15 subscales contain-
ing 56 total items. In order to keep the athlete questionnaire brief, only three of the 15
subscales were used. The other subscales were not included because they are somewhat
redundant with the other questionnaires. The three subscales that were included measure
athlete satisfaction with individual performance (two items), team performance (two
items), and ability utilization (four items) (i.e., the extent to which the athlete’s abilities
are used on the team). All items were rated using a 7-point rating scale. See Appendix F
for the pre- and postseason athlete satisfaction questionnaires.
Performance Outcomes for Softball and Tennis Teams
Individual-Level Outcomes
There is a range of statistics in softball that reflect performance at the individual
and team levels. At the individual level for the softball athletes, a variety of statistics were
used including batting average, slugging percentage, on base percentage, fielding per-
centage, and ERA (only applicable for pitchers). To reflect performance at the individual
level for tennis players, singles and doubles win-loss percentages were collected. These
statistics are available to the general public and were collected from each team’s website.
Because the performance statistics between softball and tennis differ, the individual sta-
tistics were first transformed to z-scores and averaged to form a composite performance
35
score for each athlete. Separate reliability analyses of the individual softball performance
measures and tennis performance measures demonstrated acceptable reliabilities—α =
.89 and α = .98—respectively. Therefore, composites of the performance measures could
be formed.
Team-level Outcomes
As with individual success, team success was operationally defined by a combina-
tion of team-level statistics. Similar to the individual-level statistics, the team-level sta-
tistics were first transformed to z-scores and averaged to form a composite performance
score for each team. A composite was formed, rather than simply using a team’s win-loss
percentage, because a team’s win-loss record is not entirely representative of the team’s
success. For example, a softball team could have batted and fielded well against the op-
posing team but still have lost for a variety of reasons (e.g., hits were not consecutive).
Thus, win-loss percentage was included as one factor in the composite team performance
score, rather than acting as the sole indicator of team performance.
The softball team performance composite included team batting average, slug-
ging percentage, on base percentage, fielding percentage, ERA, and win-loss percentage.
The tennis team performance composite included overall singles and doubles win-loss
percentages, as well as the team win-loss percentage. The team win-loss percentage for
tennis is a separate statistic from the singles and doubles win-loss percentages. Separate
reliability analyses of the softball performance measures and tennis performance mea-
sures demonstrated acceptable reliabilities—α = .90 and α = .98—respectively. Therefore,
composites of the performance measures could be formed.

36
CHAPTER SIX
RESULTS
I first examined the reliability of the scales by calculating Cronbach’s alphas. I
also tested the structure of the scales across sport by using Confirmatory Factor Analy-
ses (CFA). After determining that TCB is best represented by three subscales—helping,
civic virtue, and sportsmanship, I used these measures in the subsequent analyses, which
included preliminary t-tests and correlational analyses, multiple regression analyses, and
multilevel regression analyses.
Reliability Analyses
Cronbach’s alphas were calculated to determine the internal consistency of all the
measures—preseason and postseason. In addition, the individual team members’ GEQ,
MLQ, and ASQ scores were averaged to form a composite for each team. To determine
whether the team members’ scores should be averaged, I ran intraclass correlations. On
average, the analyses exhibited acceptable alphas, which demonstrates that it was reason-
able to form a team composite of GEQ, MLQ, and ASQ for each team.
Preseason Measures
The 13 items of the preseason rating of self Team Citizenship Behavior (TCB)
demonstrated a Cronbach’s alpha of .74, and analyses also indicated that deleting any
of the items would not significantly increase the alpha. Confirmatory Factor Analyses
(CFA) address why this alpha falls below the acceptable cutoff of .80, and a solution is
37
determined to account for the lack of reliability. The 13 items of the preseason rating of
team-TCB had a Cronbach’s alpha of .89, which exceeds the acceptable level of .80. In
addition, the GEQ (cohesiveness), MLQ (leadership), and ASQ (athlete satisfaction) all
exhibited acceptable scale reliabilities—a = .89, a = .90, and a = .86—respectively.
Postseason Measures
The 13 items of the postseason rating of self-TCB (a = .80) and the 13 items of
the postseason rating of team-TCB (a = .90) demonstrated acceptable reliabilities. In ad-
dition, the GEQ, MLQ, and ASQ all exhibited acceptable scale reliabilities—a = .89, a =
.93, and a = .88—respectively.
Team Citizenship Behavior Scales: Confirmatory Factor Analyses
I used LISREL 8.80 for Windows (Jöreskog & Sörbom 2006) to examine the
factor structure of the Team Citizenship Behavior (TCB) scale. I conducted confirmatory
factor analyses (CFA) including all softball and tennis athletes. Based on previous evi-
dence that the Organizational Citizenship Behavior scale (Podsakoff et al., 1997) consists
of three factors, I tested several measurement models to confirm that the Team Citizenship
Behavior (TCB) scales used in this study are best explained by three latent factors. All of
the measurement models were fit to each of the TCB scales—preseason rating of self-TCB,
preseason rating of team-TCB, postseason rating of self-TCB, postseason rating of team-
TCB. I used six different measures to assess the goodness-of-fit of tested CFA models—(1)
maximum-likelihood goodness-of-fit chi-square value with its accompanying degrees of
freedom and p value, (2) the goodness-of-fit index, (3) the standardized root mean square
residual (SRMSR), (4) the root mean square error of approximation (RMSEA), (5) the

38
non-normed fit index (NNFI; also known as Tucker Lewis Index/Coefficient), and (6) the
comparative fit index (CFI). The first four are measures of absolute fit (e.g., how close to
perfect the model is) and the last two are measures of relative fit (e.g., how close the model
fits compared with the null model).
Preseason and Postseason Ratings of Self-TCB
To examine whether the preseason rating of self-TCB is best represented by one
overall factor, I first conducted a global, one-factor model with the 13 items of Team
Citizenship Behavior. The results indicated that the one-factor model provided a poor fit
to the data, χ2(65, N = 427) = 417.16, p < .001, RMSEA = .12, SRMR = .095, GFI = .86,
CFI = .82, NNFI = .79. None of the indices for goodness-of-fit were at acceptable levels.
Podsakoff et al. (1997) concluded that TCB is best reflected by three factors—helping,
civic virtue, and sportsmanship. Therefore, a three-factor correlated (oblique) model of
TCB was conducted. The results of this model demonstrated significantly better fit com-
pared with the one-factor model, χ2(62, N = 427) = 227.88, p < .001, RMSEA = .082,
SRMR = .064, GFI = .92, CFI = .92, NNFI = .90. According to goodness-of-fit measures,
this model provides a good fit to the data. In addition, a final model with a single second-
order factor and three first-order factors was conducted to examine whether the three fac-
tors—helping, civic virtue, and sportsmanship—are explained by one second-order latent
factor—TCB. Goodness-of-fit indices were identical to that of the three-factor correlated
model indicating that the three correlated factors are measuring the construct of TCB (See
Table 1).
The above models were also imposed on the postseason rating of self-TCB. As with
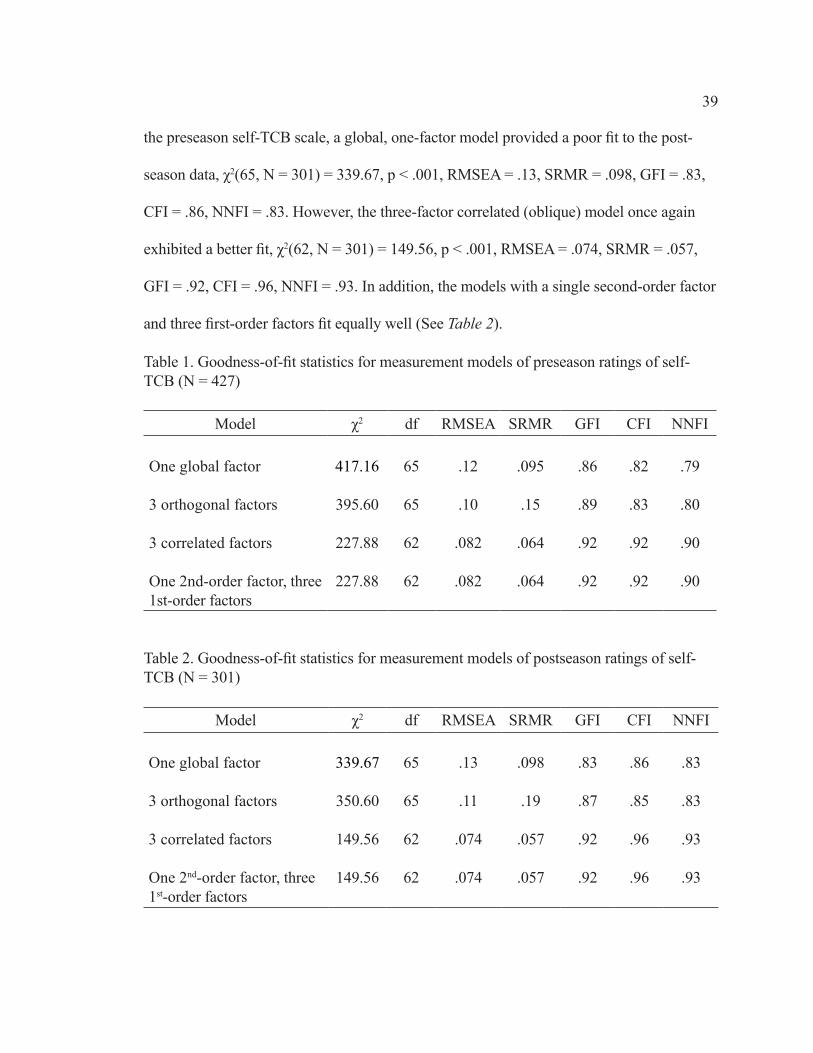
39
the preseason self-TCB scale, a global, one-factor model provided a poor fit to the post-
season data, χ2(65, N = 301) = 339.67, p < .001, RMSEA = .13, SRMR = .098, GFI = .83,
CFI = .86, NNFI = .83. However, the three-factor correlated (oblique) model once again
exhibited a better fit, χ2(62, N = 301) = 149.56, p < .001, RMSEA = .074, SRMR = .057,
GFI = .92, CFI = .96, NNFI = .93. In addition, the models with a single second-order factor
and three first-order factors fit equally well (See Table 2).
Table 1. Goodness-of-fit statistics for measurement models of preseason ratings of self-TCB (N = 427)
Model χ2 df RMSEA SRMR GFI CFI NNFI
One global factor
3 orthogonal factors
3 correlated factors
One 2nd-order factor, three 1st-order factors
417.16
395.60
227.88
227.88
65
65
62
62
.12
.10
.082
.082
.095
.15
.064
.064
.86
.89
.92
.92
.82
.83
.92
.92
.79
.80
.90
.90
Table 2. Goodness-of-fit statistics for measurement models of postseason ratings of self-TCB (N = 301)
Model χ2 df RMSEA SRMR GFI CFI NNFI
One global factor
3 orthogonal factors
3 correlated factors
One 2nd-order factor, three 1st-order factors
339.67
350.60
149.56
149.56
65
65
62
62
.13
.11
.074
.074
.098
.19
.057
.057
.83
.87
.92
.92
.86
.85
.96
.96
.83
.83
.93
.93
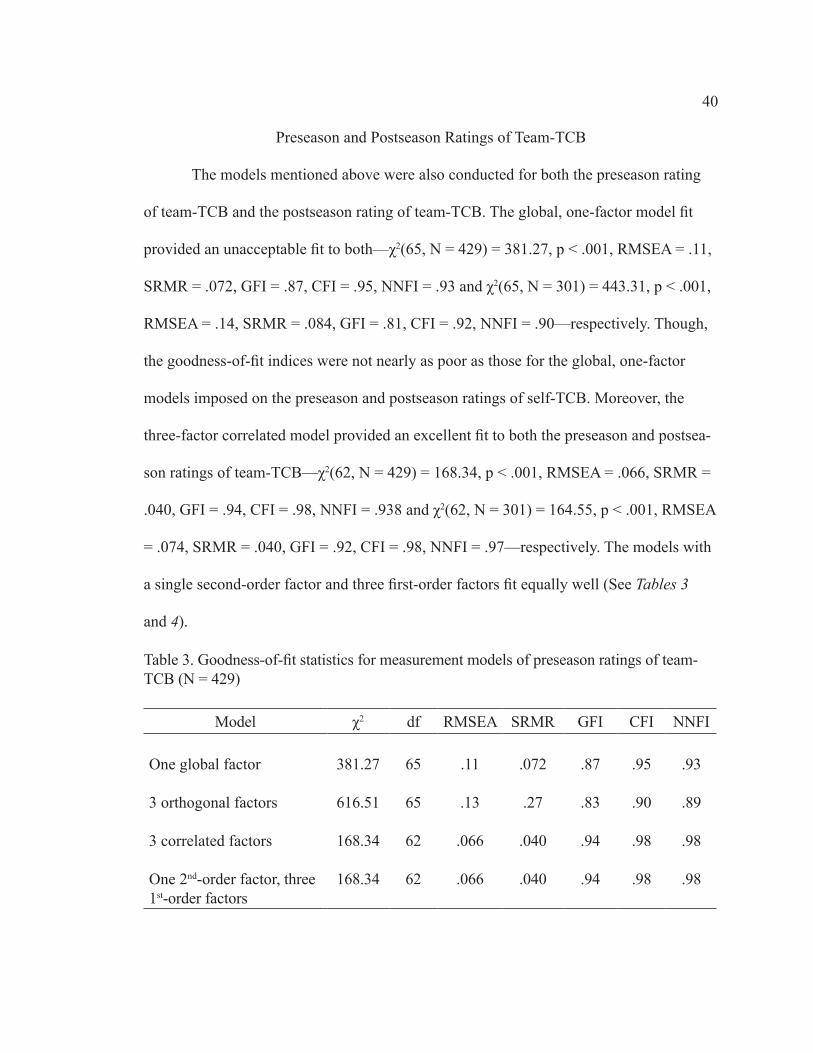
40
Preseason and Postseason Ratings of Team-TCB
The models mentioned above were also conducted for both the preseason rating
of team-TCB and the postseason rating of team-TCB. The global, one-factor model fit
provided an unacceptable fit to both—χ2(65, N = 429) = 381.27, p < .001, RMSEA = .11,
SRMR = .072, GFI = .87, CFI = .95, NNFI = .93 and χ2(65, N = 301) = 443.31, p < .001,
RMSEA = .14, SRMR = .084, GFI = .81, CFI = .92, NNFI = .90—respectively. Though,
the goodness-of-fit indices were not nearly as poor as those for the global, one-factor
models imposed on the preseason and postseason ratings of self-TCB. Moreover, the
three-factor correlated model provided an excellent fit to both the preseason and postsea-
son ratings of team-TCB—χ2(62, N = 429) = 168.34, p < .001, RMSEA = .066, SRMR =
.040, GFI = .94, CFI = .98, NNFI = .938 and χ2(62, N = 301) = 164.55, p < .001, RMSEA
= .074, SRMR = .040, GFI = .92, CFI = .98, NNFI = .97—respectively. The models with
a single second-order factor and three first-order factors fit equally well (See Tables 3
and 4).
Table 3. Goodness-of-fit statistics for measurement models of preseason ratings of team-TCB (N = 429)
Model χ2 df RMSEA SRMR GFI CFI NNFI
One global factor
3 orthogonal factors
3 correlated factors
One 2nd-order factor, three 1st-order factors
381.27
616.51
168.34
168.34
65
65
62
62
.11
.13
.066
.066
.072
.27
.040
.040
.87
.83
.94
.94
.95
.90
.98
.98
.93
.89
.98
.98

41
Table 4. Goodness-of-fit statistics for measurement models of postseason ratings of team-TCB (N = 301)
Model χ2 df RMSEA SRMR GFI CFI NNFI
One global factor
3 orthogonal factors
3 correlated factors
One 2nd-order factor, three 1st-order factors
443.31
535.61
164.55
164.55
65
65
62
62
.14
.14
.074
.074
.084
.30
.040
.041
.81
.81
.92
.92
.92
.90
.98
.98
.90
.88
.97
.97
Multigroup Confirmatory Factor Analyses
To test the invariance of this three-factor (correlated) model across sport, I used
multigroup confirmatory factor analyses (CFA). For each of the four scales—preseason rat-
ing of self-TCB, preseason rating of team-TCB, postseason rating of self-TCB, postseason
rating of team-TCB, I conducted one model assessing the invariance of factor correlations
and another assessing the invariance of factor covariances. Results indicated that the matri-
ces are not completely invariant across sport (See Tables 5–8). In particular, the covariance
matrices were especially different. Because of unique error variance associated with each
sport, the items should not be simply averaged across the entire scale, or even averaged for
subscales. Instead, the unique error variance must be accounted for within each sport. In
order to do this, I separated softball and tennis athletes into two separate files, and then I
extracted a single factor (regression form) from each subscale using Principal Axis Factor-
ing (PAF). PAF separates the variance in items into common variance (which is predicted
by the latent variables) and unique error variance (which is unrelated to the latent vari-
ables). These factor scores (one for each subscale—helping, civic virtue, sportsmanship)
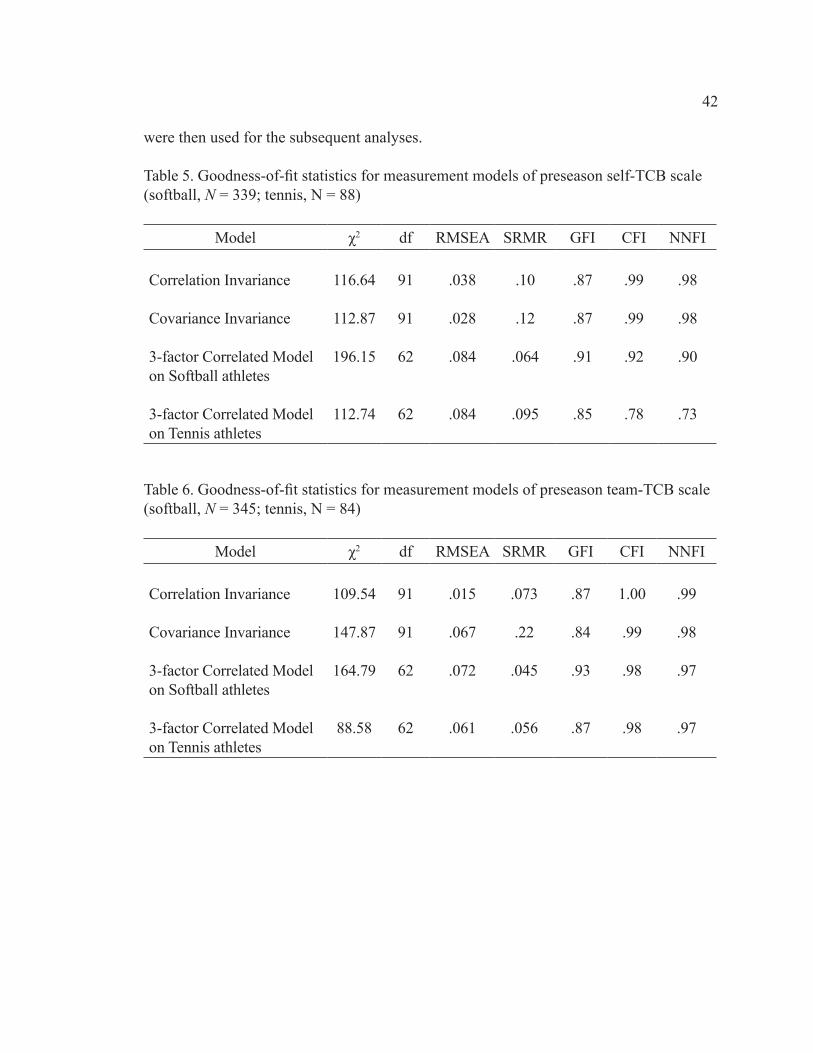
42
were then used for the subsequent analyses.
Table 5. Goodness-of-fit statistics for measurement models of preseason self-TCB scale (softball, N = 339; tennis, N = 88)
Model χ2 df RMSEA SRMR GFI CFI NNFI
Correlation Invariance
Covariance Invariance
3-factor Correlated Model on Softball athletes
3-factor Correlated Model on Tennis athletes
116.64
112.87
196.15
112.74
91
91
62
62
.038
.028
.084
.084
.10
.12
.064
.095
.87
.87
.91
.85
.99
.99
.92
.78
.98
.98
.90
.73
Table 6. Goodness-of-fit statistics for measurement models of preseason team-TCB scale (softball, N = 345; tennis, N = 84)
Model χ2 df RMSEA SRMR GFI CFI NNFI
Correlation Invariance
Covariance Invariance
3-factor Correlated Model on Softball athletes
3-factor Correlated Model on Tennis athletes
109.54
147.87
164.79
88.58
91
91
62
62
.015
.067
.072
.061
.073
.22
.045
.056
.87
.84
.93
.87
1.00
.99
.98
.98
.99
.98
.97
.97

43
Table 7. Goodness-of-fit statistics for measurement models of postseason self-TCB scale (softball, N = 240; tennis, N = 61)
Model χ2 df RMSEA SRMR GFI CFI NNFI
Correlation Invariance
Covariance Invariance
3-factor Correlated Model on Softball athletes
3-factor Correlated Model on Tennis athletes
116.80
427.20
126.24
92.31
91
91
62
62
.041
.20
.070
.076
.13
.29
.055
.096
.83
.69
.92
.82
.99
.82
.96
.87
.98
.69
.95
.84
Table 8. Goodness-of-fit statistics for measurement models of postseason team-TCB scale (softball, N = 240; tennis, N = 61)
Model χ2 df RMSEA SRMR GFI CFI NNFI
Correlation Invariance
Covariance Invariance
3-factor Correlated Model on Softball athletes
3-factor Correlated Model on Tennis athletes
155.67
142.28
146.42
85.64
91
91
62
62
.036
.051
.077
.053
.11
.15
.044
.050
.77
.79
.91
.84
.99
.99
.97
.98
.97
.98
.97
.97

44
Diagramming Hypotheses
Figure 1. Hypothesis 1A: Individual TCBs are positively related to individual-level per-
formance outcome.
Figure 2. Hypothesis 1B: Team TCBs are positively related to team-level performance
outcome.
Figure 3. Hypothesis 2A: Task interdependence will moderate the effects of individual
self-report of TCBs and coach’s ratings of TCB on individual performance.

45
Figure 4. Hypothesis 2B: Task interdependence will moderate the effects of the aggre-
gated value of TCBs and coach’s ratings of TCB on team performance.
Figure 5. Hypothesis 3: Athlete satisfaction, team cohesiveness, and perceptions of
leadership behaviors will have positive relationships with team-level TCB and with team
performance.
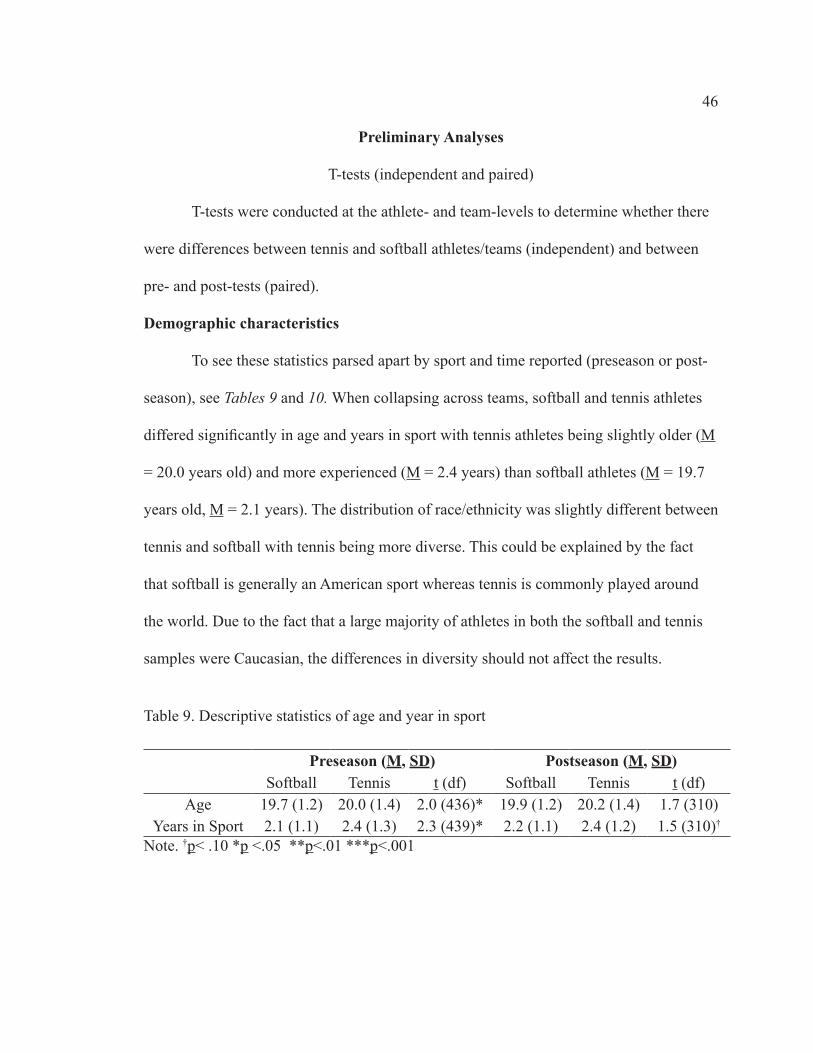
46
Preliminary Analyses
T-tests (independent and paired)
T-tests were conducted at the athlete- and team-levels to determine whether there
were differences between tennis and softball athletes/teams (independent) and between
pre- and post-tests (paired).
Demographic characteristics
To see these statistics parsed apart by sport and time reported (preseason or post-
season), see Tables 9 and 10. When collapsing across teams, softball and tennis athletes
differed significantly in age and years in sport with tennis athletes being slightly older (M
= 20.0 years old) and more experienced (M = 2.4 years) than softball athletes (M = 19.7
years old, M = 2.1 years). The distribution of race/ethnicity was slightly different between
tennis and softball with tennis being more diverse. This could be explained by the fact
that softball is generally an American sport whereas tennis is commonly played around
the world. Due to the fact that a large majority of athletes in both the softball and tennis
samples were Caucasian, the differences in diversity should not affect the results.
Table 9. Descriptive statistics of age and year in sport
Preseason (M, SD) Postseason (M, SD)Softball Tennis t (df) Softball Tennis t (df)
Age 19.7 (1.2) 20.0 (1.4) 2.0 (436)* 19.9 (1.2) 20.2 (1.4) 1.7 (310)Years in Sport 2.1 (1.1) 2.4 (1.3) 2.3 (439)* 2.2 (1.1) 2.4 (1.2) 1.5 (310)†
Note. †p< .10 *p <.05 **p<.01 ***p<.001

47
Table 10. Distribution of race/ethnicity across softball and tennis
Preseason PostseasonSoftball (n=352)
Tennis(n=89)
Softball(n=247)
Tennis (n=67)
RaceCaucasian 328 (93.2%) 70 (78.7%) 227 (91.9%) 47 (73.4%)
Hispanic/Latino 10 (2.8%) 5 (5.6%) 8 (3.2%) 4 (6.3%)African-American/Black 3 (0.9%) 3 (3.4%) 3 (1.2%) 1 (1.6%)
Asian 1 (0.3%) 3 (3.4%) 1 (0.4%) 4 (6.3%)Multiracial 3 (0.9%) 1 (1.1%) 3 (1.2%) 2 (3.1%)
Filipino/Filipino-American 2 (0.6%) 1 (1.1%) 2 (0.8%) 1 (1.6%)Biracial 2 (0.6%) 1 (1.1%) 2 (0.8%) 3 (4.7%)
American Indian/Alaska Native 1 (0.3%) 0 1 (0.4%) 0East Indian/Pakistani 0 1 (1.1%) 0 1 (1.6%)
Pacific Islander 0 1 (1.1%) 0 0Other 2 (0.6%) 3 (3.4%) 0 1 (1.6%)
Independent variables
Important to mention, the averages of the raw TCB subscales were used in the
independent t-test analyses because the extracted factors have means of zero and thus
would show no differences. Thus, the comparisons between softball and tennis athletes/
teams on the TCB subscale averages are reported in the tables but not discussed here. The
only significant difference between teams that emerged (excluding the TCB subscales)
was on the postseason measure of athlete satisfaction (ASQ). At the postseason, tennis
teams were significantly more satisfied (M = 5.41) than softball teams (M = 4.77).
There were also a few differences between preseason and postseason scores. In
tennis teams, preseason coach rating of TCB differed significantly from postseason coach
rating of TCB such that coaches rated their players as exhibiting more TCBs in the post-
season. Similarly, civic virtue (self) increased significantly from pre- to postseason for

48
tennis teams. In softball teams, there were significant differences in the pre- and postsea-
son ratings of coach TCB rating, MLQ, ASQ, and sportsmanship (team). All of these dif-
ferences showed a decrease from pre- to postseason scores, with the exception of coach
rating of TCB, which showed an increase. To see t-test results from comparison between
sports and between athletes, see Tables 15–20 in Appendix G.
Correlational Analyses
It was predicted that the measured variables—all ratings of TCB (team citizenship
behaviors), MLQ (transformational leadership behaviors), ASQ (athlete satisfaction), and
GEQ (cohesiveness)—would be correlated with each other, and with performance mea-
sures (Hypothesis 3). Specifically, it was predicted that ASQ, GEQ, and MLQ would have
positive relationships with TCBs and with team performance. Therefore, bivariate corre-
lations were conducted between all variables at the athlete- and team-levels. These tables
can be viewed in Appendix H. As seen in Table 21, many of the correlations between
preseason team-level variables were significant, and all significant relationships were in
the positive direction. Of note, helping behavior (self) was significantly and positively
related to civic virtue (self) but was not significantly related to sportsmanship behavior
(self). Though, the relationship was positive, as predicted. As expected, all of the ratings
of team-TCB behaviors—helping, civic virtue, and sportsmanship—were significantly
and positively related to each other. MLQ, ASQ, and GEQ were significantly related
with each other as well. Interestingly, the coach rating of TCB was significantly corre-
lated with only one other preseason variable—high task interdependence performance
composite. This indicates that higher mean coach ratings of athlete TCB for the team are

49
associated with better team performance at tasks that require more coordination among
team members (i.e., fielding and doubles matches). This indicates that perhaps TCBs
(e.g., helping behaviors) are more beneficial to team performance outcomes that require
more coordinated effort between team members, or vice versa. In addition, the high task
interdependence performance composite was positively correlated with helping behavior
(team) and team cohesiveness (GEQ). Here, greater helping behavior and cohesiveness
team scores are associated with better high task interdependence performance (i.e., field-
ing/ERA and doubles matches).
The correlational analyses between postseason team-level variables revealed simi-
lar results. However, there were some notable differences. Civic virtue behavior (team),
sportsmanship behavior (team), MLQ, ASQ, and GEQ were each positively correlated
(at least marginally significant) to both team win-loss percentage and team performance
composite. Since these relationships were not significant at the preseason, it is highly
plausible that team performance could be influencing these measures, rather than the
other way around. Similarly, low task interdependence performance was significantly and
positively correlated with ASQ. This suggests that athletes on a team are more satisfied
when they performed better as individuals. Interesting to note, the correlation between
high task interdependence performance and ASQ is not significant. However, high task
interdependence performance is significantly related to both sportsmanship and civic
virtue behaviors (team).
At the athlete-level, the correlations between variables at the preseason and post-
season were nearly identical. Almost all measures (excluding performance measures and
50
coach rating of TCB), were significantly and positively correlated with each other. In the
preseason correlations, coach rating of TCB was significantly related to ASQ, individual
performance, and high task interdependence performance. In the postseason, it was relat-
ed to MLQ and ASQ. Regarding performance measures, ASQ was significantly correlated
with individual performance composite and low task interdependence performance, but
not the high task interdependence composite, at both the preseason and postseason (See
Tables 21-24 in Appendix H).
Primary Analyses
To explore whether Team Citizenship Behaviors (TCB) were related to perfor-
mance and if these relationships were moderated by sport, I conducted multiple regres-
sion analyses predicting team performance and multilevel regression analyses predicting
individual performance. Analyses were run separately for the preseason and postseason
variables. The focus of the following analyses is primarily on the preseason measures
since causal inferences can be made between these measures (collected at the beginning
of the season) and performance measures (collected at the end of the season). Analyses
examining the effects of postseason measures on performance will be discussed but must
be interpreted with caution as it is unclear whether postseason ratings affect performance,
or vice versa. In addition, the sample size is not as representative in the postseason as it
is in the preseason. Therefore, the differences between preseason and postseason scores
were not used as predictors.

51
Multiple Regression Analyses
To test whether Team Citizenship Behaviors (TCB) are positively related to team-
level performance outcomes (Hypothesis 1B) and if these relationships are moderated
by sport (Hypothesis 2B), I conducted a series of multiple regression analyses in SPSS
(PASW Statistics 18.0, 2009) using the procedures outlined by Aiken & West (1991).
Specifically, I centered each of the continuous predictor variables by subtracting the ap-
propriate sample means. The factors extracted from each TCB subscale were extracted
in regression form and thus were already centered for these analyses. I then conducted
hierarchical regression analyses predicting composite team performance outcomes from
the centered main effects of the TCB subscales (helping, civic virtue, and sportsmanship),
coach rating of TCB, team cohesiveness (GEQ), perceptions of transformational leader-
ship (MLQ), and athlete satisfaction (ASQ), as well as the dichotomous variable (tennis,
softball) and the interaction terms between TCB subscales and sport. In each analysis,
sport and the TCB variables were entered into the first block of predictors, the interaction
terms were entered into the second block, and the remaining variables (GEQ, MLQ, and
ASQ) were entered into the final block. The sport and TCB variables were entered first
because they are the primary variables of interest in these analyses, and the interaction
terms and remaining variables were entered into the second and third blocks to determine
whether they account for any variance above and beyond the separate TCB factors.
Preseason Rating of Self-TCB
At the beginning of their respective seasons, athletes rated themselves on the ex-
tent to which they exhibit Team Citizenship Behaviors toward their teammates. As men-

52
tioned before, factor scores were extracted from each subscale—helping, civic virtue, and
sportsmanship—using Principal Axis Factoring. These individual factor scores were then
aggregated to form three subscale scores for each team. Do self-reported TCBs (at pre-
season) positively predict team-level performance and is this relationship moderated by
sport? To test this, a multiple regression analysis was run on the team performance com-
posite measure. For the first block of predictors (sport and TCB variables), R for regres-
sion was not significantly different from zero, F(5, 34) = .673, p = .647, with R2 at .090. R
for regression was only marginally significant in the second model—F(9, 30) = 1.951, p
= .082, R2 = .369—but was significant in the final model including all predictors—F(12,
27) = 2.418, p = .028, R2 = .518. R2 in the final model indicates that all of the predictors
together account for 51.8% of the variance in the outcome variable—team performance
composite measure. In addition, these analyses demonstrated a significant R change in
the transition from the first to second model and a marginally significant R change from
the second to third model—ΔR = .279, ΔF = 3.319, p = .023 and ΔR = .149, ΔF = 2.778,
p = .060—respectively. This indicates that the second model accounted for significant
variance above and beyond the first model, and the third model accounted for additional
variance beyond the second model.
When all predictors are in the model (i.e., the third model), there was a margin-
ally significant effect of helping behaviors on team performance (B = -1.270, β = -.539, p
= .092), indicating that helping behaviors have a negative impact on team performance.
This trend is opposite of what I predicted. In addition, there was a marginally significant
effect of MLQ on performance (B = .962, β = .347, p = .084). Transformational leader-
53
ship behaviors exhibited by the coaches are positively related to team performance. There
were no significant effects of sport, coach TCB rating, civic virtue, sportsmanship, team
cohesiveness, or athlete satisfaction on team performance. However, there was a mar-
ginally significant Sport x Coach TCB Rating interaction and a marginally significant
Sport x Sportsmanship interaction. Most notably, the Sport x Helping interaction reached
significance (See Table 11).
The nature of the two-way interactions was determined using the procedures
outlined by Aiken and West (1991). Specifically, I separately tested the significance of
the simple slopes in softball teams and tennis teams. Exploring the marginally signifi-
cant Sport x Coach TCB Rating interaction, simple slope tests revealed that coach TCB
rating was positively related to team performance in tennis teams (B = .797, β = .685, p
= .024) but not in softball teams (B = .017, β = .014, p = .933). Similarly, simple slope
tests investigating the marginally significant Sport x Sportsmanship interaction revealed a
positive association between sportsmanship behaviors (subset of TCB) and team perfor-
mance in tennis teams (B = 1.814, β = .463, p = .028) but not in softball teams (B = -.346,
β = -.088, p = .719). These results suggest that higher mean coach ratings of athlete TCB
and self-reported sportsmanship behaviors correspond to better team performance, but
only in tennis teams. Finally, simple slope tests exploring the significant Sport x Helping
interaction demonstrated that helping behavior was inversely associated with team per-
formance for softball teams (B = -1.270, β = -.539, p = .092). Helping behavior was not
significantly related to team performance in tennis teams (B = .972, β = 870, p = .274).
These results suggest that helping behavior has a potentially negative impact on team

54
performance in softball teams, whereas in tennis teams, helping behavior has a poten-
tially positive impact on team performance, though not significant. Since these results are
contrary to predictions (Hypothesis 1B), they will be discussed in depth in the discussion
section.

55
Table 11. Multiple regression results for preseason self-TCB ratings predicting team performance
Measures R R2 ΔR2 ΔF df B SE β
Model 1 .30 .09 .09 .673 (5, 34)Sport .168 .290 .096
Coach TCB Rating .205 .191 .176
Helping (Self) .431 .597 .183
Civic Virtue (Self) -.476 .840 -.143
Sportsmanship (Self) .749 .662 .191
Model 2 .608 .369 .279 3.319* (4, 30)Sport .246 .258 .140
Coach TCB Rating .017 .211 .015
Helping (Self) -.907 .771 -.385
Civic Virtue (Self) -.036 .911 -.011
Sportsmanship (Self) .207 .994 .053
Sport*Coach TCB Rating .691 .416 .316
Sport*Helping 2.033 1.132 .631†
Sport*Civic Virtue -.368 1.642 -.069
Sport*Sportsmanship 1.555 1.289 .310
Model 3 .720 .518 .149 2.778† (3, 27)Sport .420 .251 .240
Coach TCB Rating .017 .196 .014
Helping (Self) -1.270 .727 -.539†
Civic Virtue (Self) -.001 .846 0
Sportsmanship (Self) -.346 .951 -.088
Sport*Coach TCB Rating .780 .385 .357†
Sport*Helping 2.242 1.093 .696*
Sport*Civic Virtue -.676 1.623 -.127
Sport*Sportsmanship 2.161 1.235 .431†
GEQ .353 .293 .257
MLQ .962 .536 .347†
ASQ -.349 .352 -.184Note. †p< .10 *p <.05 **p<.01 ***p<.001
56
Preseason Rating of Team-TCB
In the preseason, athletes were also instructed to rate the extent to which their
team, as a whole, exhibits Team Citizenship Behaviors. Following the process mentioned
for the preseason rating of self-TCB, factor scores were extracted from each subscale
and aggregated to the team level. As before, a hierarchical regression was run on the
team performance composite measure to determine whether team-TCBs (at preseason)
positively predict team-level performance and if the strength of this relationship depends
on sport. R for regression was nonsignificant for the first, second, and third blocks of
predictors—F(5, 34) = .580, p = .715, R2 = .079 and F(9, 30) = .392, p = .930, R2 = .105
and F(12, 27) = .804, p = .644, R2 = .263—respectively. Nor was there significant change
between any of the models (See Table 12). The standardized regression weights suggest
that the strongest predictor of these analyses is team cohesiveness (GEQ) (B = .730, β =
.532, p = .097), which is only marginally significant. The direction suggests that higher
team cohesiveness leads to better team performance.
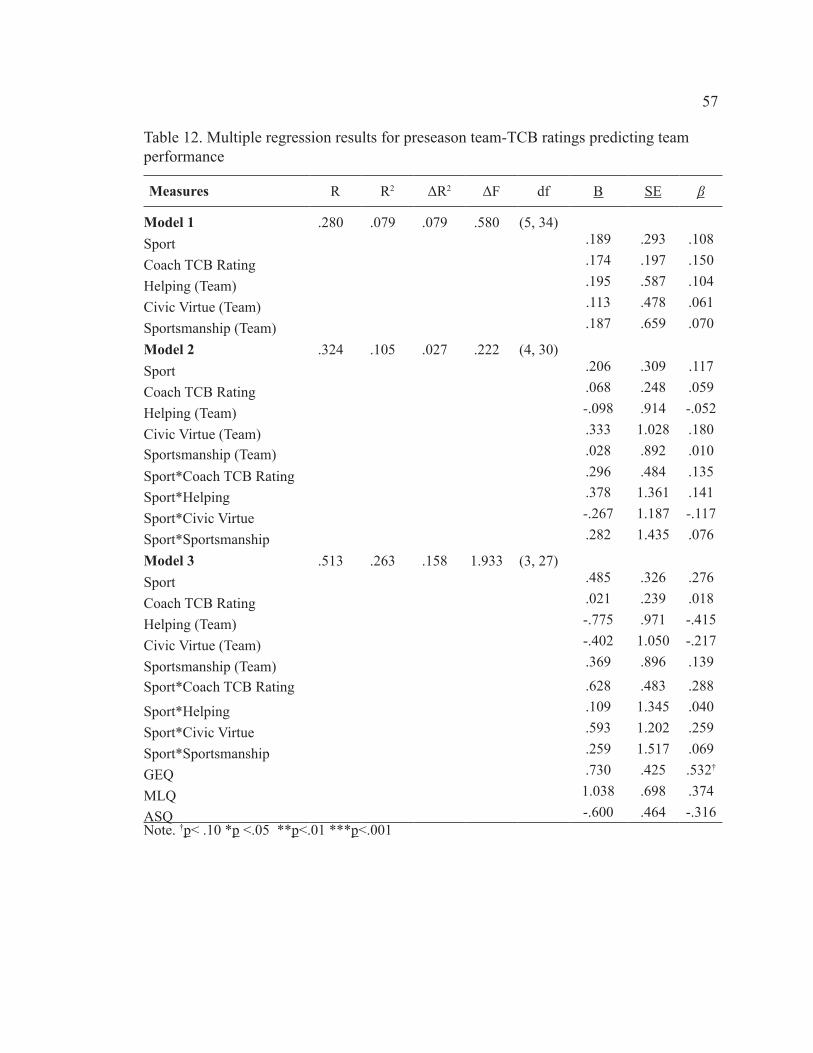
57
Table 12. Multiple regression results for preseason team-TCB ratings predicting team performance
Measures R R2 ΔR2 ΔF df B SE β
Model 1 .280 .079 .079 .580 (5, 34)Sport .189 .293 .108
Coach TCB Rating .174 .197 .150
Helping (Team) .195 .587 .104
Civic Virtue (Team) .113 .478 .061
Sportsmanship (Team) .187 .659 .070
Model 2 .324 .105 .027 .222 (4, 30)Sport .206 .309 .117
Coach TCB Rating .068 .248 .059
Helping (Team) -.098 .914 -.052
Civic Virtue (Team) .333 1.028 .180
Sportsmanship (Team) .028 .892 .010
Sport*Coach TCB Rating .296 .484 .135
Sport*Helping .378 1.361 .141
Sport*Civic Virtue -.267 1.187 -.117
Sport*Sportsmanship .282 1.435 .076
Model 3 .513 .263 .158 1.933 (3, 27)Sport .485 .326 .276
Coach TCB Rating .021 .239 .018
Helping (Team) -.775 .971 -.415
Civic Virtue (Team) -.402 1.050 -.217
Sportsmanship (Team) .369 .896 .139
Sport*Coach TCB Rating .628 .483 .288
Sport*Helping .109 1.345 .040
Sport*Civic Virtue .593 1.202 .259
Sport*Sportsmanship .259 1.517 .069
GEQ .730 .425 .532†
MLQ 1.038 .698 .374
ASQ -.600 .464 -.316Note. †p< .10 *p <.05 **p<.01 ***p<.001

58
Postseason Ratings of Self and Team-TCB
Toward the end of their respective seasons, athletes rated themselves on the extent
to which they exhibit Team Citizenship Behaviors toward their teammates. Multiple re-
gression analyses revealed that R for regression was not significantly different from zero
for any of the blocks of predictors. However, these analyses demonstrated a significant R
change in the transition from the second to third model, ΔR = .433, ΔF = 3.802, p = .023.
The standardized regression weights suggest that the strongest predictor of these analy-
ses is athlete satisfaction (ASQ) (B = .569, β = .476, p = .041), and the second strongest
predictor is team cohesiveness (GEQ) (B = .474, β = .346, p = .077), which was only
marginally significant. See Table 25 in Appendix I.
In the postseason, athletes were also instructed to rate the extent to which their
team, as a whole, exhibits Team Citizenship Behaviors. Here, hierarchical regression
analyses revealed that all three blocks of predictors accounted for significant variance in
the performance outcome—team performance composite. The results for the first, sec-
ond, and third blocks are as follows—F(5, 31) = 3.267, p = .017, R2 = .345 and F(9, 27) =
2.265, p = .049, R2 = .430 and F(12, 24) = 2.833, p = .014, R2 = .586—respectively (See
Table 26 in Appendix I).
Looking at the third model (See Table 24), there were no significant effects of
sport, coach TCB rating, helping, civic virtue, sportsmanship, GEQ, MLQ, or ASQ on
team performance. However, there was a significant Sport x Sportsmanship interaction.
Simple slope tests revealed that sportsmanship behavior was positively associated with
team performance in tennis teams (B = 1.106, β = .657, p = .012), indicating that a greater

59
amount of these behaviors are related to improved team performance. This relationship
was not present in softball teams (B = -.387, β = -.230, p = .490).
Follow-up Analyses
Opposite to what was predicted, multiple regression analyses examining the effect
of preseason ratings of self-TCB on team performance demonstrated that helping behav-
ior had a marginally significant negative effect on softball team performance (B = -1.270,
β = -.539, p = .092) but a positive effect on tennis team performance (B = .972, β = 870,
p = 274), though not significant. To further explore when helping behaviors might have
a negative effect on softball team performance, I reran the same analyses but with dif-
ferent performance outcome variables. I created two team performance composites that
reflected low task interdependence performance measures and high task interdependence
measures. For softball, the low task interdependence performance composite included
the average of standardized scores for batting average, on base percentage, and slugging
percentage, whereas for tennis, it included singles win-loss percentage (standardized). For
softball, the high task interdependence composite included the average of standardized
scores for fielding percentage and earned run average, and for tennis, it included doubles
win-loss percentage (standardized).
First, I ran a multiple regression analysis on the low task interdependence team
performance composite. For the first block of predictors (sport and TCB subscales), R
for regression was not significantly different from zero, F(5, 34) = .295, p = .912, with R2
at .204. However, R for regression was significant in the second and third models—F(9,
30) = 2.807, p = .016, R2 = .457 and F(9, 30) = 2.817, p = .012, R2 = .556—respectively.

60
This analysis only demonstrated a significant R change in the transition from the first to
second model, ΔR = .416, ΔF = 5.741, p = .001. When all predictors are in the model,
helping behavior demonstrated a significant negative effect on team performance. There
were no other significant effects. However, there was a marginally significant Sport x
Coach TCB Rating interaction. Conducting simple slope tests revealed that coach TCB
rating has a significant positive impact on low task interdependence team performance in
tennis teams (B = .781, β = .613, p = .034), but not in softball teams (B = -.232, β = -.182,
p = .269). In addition, the main effect of helping behavior was qualified with a significant
Sport x Helping Behavior interaction. Here, the simple slope tests revealed that helping
behavior negatively impacts low task interdependence performance in softball teams (B
= -2.053, β = -.795, p = .012), but not in tennis teams (B = 1.125, β = .436, p = .230).
Interestingly, when I conducted the multiple regression analyses on the high task
interdependence performance composite, there were no significant effects and no signifi-
cant interactions. Concerning helping behavior, these results could indicate that helping
behaviors may detract from performance that is more independent than team-oriented
(e.g., batting vs. fielding), but only in softball teams. See Tables 27 and 28 in Appendix J.
Multilevel Regression Analyses
To test whether Team Citizenship Behaviors (TCB) are positively related to indi-
vidual-level performance outcomes and if these relationships are moderated by sport, I
conducted a series of multilevel regression analyses. Because the data contains two levels
of analysis with individual athletes (Level 1) nested within teams (Level 2), I conducted
these analyses using PROC MIXED within SAS v9.1.3 (SAS Institute, 2002). This ap-

61
proach allows for the simultaneous estimation of regression equations for athletes from
the same team, while controlling for the interdependence between observations. Multi-
level regression analyses were used to examine the main effects of the TCB subscales
(helping, civic virtue, and sportsmanship), coach TCB rating, team cohesiveness (GEQ),
perceptions of transformational leadership (MLQ), and athlete satisfaction (ASQ), as
well as the dichotomous variable (tennis, softball) and the interaction terms between TCB
subscales and sport.
Team cohesiveness (GEQ, Level-2 variable) was excluded from the final analyses
because preliminary analyses showed that it did not account for significant variance in the
individual performance outcome variable. To confirm that it should be excluded, I fitted
an unconditional means model, examining variation in individual performance across
schools, and then examined the effect of cohesiveness to see if it accounted for significant
variance in the individual outcome variable. It did not and thus was excluded from the
final analyses. Therefore, individual performance was predicted from the following equa-
tion:
Individual performanceij = γ00 + γ10(sport) + γ20(helping) + γ30 (civic virtue) + γ40(sportsmanship) + γ50(coach TCB rating) + γ60(sport x helping) + γ70(sport x civic virtue) + γ80(sport x sportsmanship) + γ90(MLQ) + γ100(ASQ) + u0j + u1j + rij.
Individual performanceij refers to the performance composite for athlete i from team j,
and γ00 refers to the average performance observed across athletes (adjusted for other
predictors in the model). The term γ10 represents the effect of sport (Level-2 variable) on
athlete i’s individual performance. The terms γ20, γ30, and γ40 represent the effects of help-
ing, civic virtue, and sportsmanship on athlete i’s individual performance, respectively.

62
The term γ50 represents the effects of coach rating of TCB on individual performance. All
Level-1 continuous variables were centered around the grand mean. The term γ60, γ70, and
γ80 represent the coefficients for the Sport x Helping interaction, Sport x Civic Virtue in-
teraction, and Sport x Sportsmanship interaction, respectively. The interaction terms were
calculated by multiplying each of the TCB subscale factor scores by the dichotomous
sport variable. Finally, the last two terms (γ90 and γ100) account for the effects of MLQ and
ASQ.
Preseason Rating of Self-TCB
Are self-reported TCBs (at preseason) positively related to performance for tennis
athletes? The multilevel regression analyses on individual performance for all athletes
revealed a positive significant main effect of coach rating of TCB (b = .073, p = .045) and
a marginally significant effect of ASQ (b = .099, p = .062). There were no other main ef-
fects, including a nonsignificant effect of sport (b = -.204, p = .187), which indicates that
tennis and softball athletes do not differ in performance scores. The interactions—sport x
helping, sport x civic virtue and sport x sportsmanship—did not reach any level of sig-
nificance (See Table 13).

63
Table 13: Multilevel regression analyses for all athletes with preseason self-TCB predict-ing individual performance
Individual Performance (DV)b SE
Intercept .145 .128Sport -.204 .152Coach TCB Rating .072* .036Helping (Self) .102 .125Civic Virtue (Self) -.053 .153Sportsmanship (Self) .020 .104Sport x Helping -.228 .140Sport x Civic Virtue .209 .168Sport x Sportsmanship -.058 .118MLQ .082 .080ASQ .099† .053
Note. †p< .10 *p <.05 **p<.01 ***p<.001
Preseason Rating of Team-TCB
To what extent do team-TCBs (at preseason) relate to individual performance?
This model demonstrated similar results to the model conducted with preseason ratings of
self-TCB on individual performance. There was a positive significant main effect of ASQ
(b = .104, p = .047) and a marginally significant effect of coach rating of TCB (b = .075,
p = .044). Once again, tennis and softball athletes do not differ in performance (b = -.165,
p = .290) confirming that sport alone does not impact individual performance. Finally,
none of the interactions were significant. (See Table 14).

64
Table 14: Multilevel regression analyses for all athletes with preseason team-TCB pre-dicting individual performance
Individual Performance (DV)b SE
Intercept .103 .129Sport -.165 .153Coach TCB Rating .075* .037Helping (Team) .200 .158Civic Virtue (Team) -.131 .166Sportsmanship (Team) .080 .124Sport x Helping -.235 .174Sport x Civic Virtue .092 .181Sport x Sportsmanship -.058 .137MLQ .059 .084ASQ .104* .052
Note. †p< .10 *p <.05 **p<.01 ***p<.001
Postseason Ratings of Self and Team-TCB
As with the preseason predictor variables, multilevel regression analyses were
conducted using the postseason predictors—helping, civic virtue, sportsmanship, coach
rating of TCB, MLQ, and ASQ—for tennis and softball athlete performance. Multilevel
regression analyses revealed that overall, there were no significant effects of TCBs on
individual performance, nor were there significant interactions between sport and these
behaviors. However, the main effect of ASQ was again significant (b = .249, p < .0001)
and MLQ had a marginally significant effect on individual performance (b = -.139, p =
.090) (See Table 29 in Appendix K).
Next, I examined the effects of postseason ratings of team-TCB on individual
performance. When the multilevel regression analyses were conducted with the post-

65
season ratings of team-TCB, some interesting significant main effects and interactions
emerged. However, these must be interpreted with caution, as it is more likely that per-
formance over the season is affecting the ratings, rather than vice versa. Here, there was a
significant main effect of sportsmanship (b = .363, p = .007), and a marginally significant
positive effect of civic virtue (b = .435, p = .085). The effect of helping behaviors was
negative, but not significant (b = -.408, p = .111). In addition, the effects of the TCB be-
haviors—helping, civic virtue, and sportsmanship—were qualified by significant interac-
tions with sport—b = .484, p = .076 (marginally significant) and b = -.601, p = .027 and
b = -.381, p = .012—respectively. Once again, ASQ had a positive significant effect (b =
.225, p < .0001) (See Table 30 in Appendix K)
To explore the significant interactions, a simpler model (excluding interaction
terms) was run separately on tennis and softball athletes. This way, the direction and
magnitude of the estimates from both models could be compared. Analyses revealed that
sportsmanship behavior was positively associated with individual performance for ten-
nis athletes, but only marginally so. Sportsmanship behaviors showed a negative, though
nonsignificant, relationship with individual performance for softball athletes. Helping be-
havior and civic virtue did not show significant relationships with individual performance
for either softball or tennis athletes (See Table 31 in Appendix K).

66
CHAPTER SEVEN
DISCUSSION
Organizational Citizenship Behaviors have demonstrated significant relationships
with both individual- and group-level organizational outcomes and these relationships
were expected to be present in sport teams as well. However, the existing research has
shown some inconsistencies in the strength and direction of this relationship. The primary
purpose of this study was to examine the relationship between team citizenship behaviors
(TCB) and sports team performance and whether this TCB-performance relationship is
moderated by sport. One of the key distinctions of OCB is that individual acts of OCB
may have little if any effect on organizational functioning, but the accumulation of such
acts will improve team performance. Though the relationships were explored at both the
individual- and team-levels, the focus of the discussion will revolve mainly around the
team-level analyses. However, the athlete-level results will be discussed first, which will
provide a nice segue into the team-level results.
Athlete-Level Results
When examining the results from the separate analyses on softball and tennis ath-
letes, the difference in sample sizes must be taken into account. It is possible that some of
the effects that are significant for softball might not be for tennis due to the smaller sample
size.

67
Preseason Rating of Self-TCB
Hypothesis 1A stated that TCBs would be positively related to individual per-
formance, and Hypothesis 2A stated that sport would moderate the effects of TCBs on
individual performance. Examining the effects of the preseason ratings of self-TCB on
performance produced some interesting results at the athlete level. When examining
softball and tennis athletes separately, there were no effects of helping, civic virtue, or
sportsmanship for tennis athletes but there were effects of helping and civic virtue for
softball athletes. These results showed that for softball athletes, more individual help-
ing behavior led to decreased individual performance. The effects of helping behavior
are similar to those at the team-level. This relationship was predicted to be positive but
instead was negative. If an athlete helps out other athletes, it could take time away (and
be a distraction) from working on their own skills. This may be especially true in softball
where the positions are more different compared to tennis. The effect of civic virtue was
also significant such that more civic virtue led to increased individual performance. When
softball athletes are more invested in their team (civic virtue), they tend to perform better
as individuals. Perhaps investing in their team is positively associated with investing in
skill improvement, too. Moreover, athlete satisfaction (ASQ) produced a significant main
effect such that the more satisfied a softball athlete is at the beginning of the season, the
better she performs over the course of the season.
The overall analysis revealed a positive significant effect of coach rating of TCB
indicating that athletes rated higher on TCBs also perform better. An explanation for this
effect could be that athletes who participate in TCBs to a greater extent are more often

68
than not the recipients of their teammates’ TCBs, which could boost their own perfor-
mance. It could also be that coach’s ratings are not impartial but instead are influenced
by the skill level of the athlete and the potential contributions the athlete will make to the
team skill-wise. Thus, an athlete perceived as more skillful might receive a higher rating
of TCBs, and a more skillful athlete is likely to perform better over the season compared
to a less skillful athlete. When looking at tennis and softball separately, this positive ef-
fect was only significant for softball teams. If the ratings are indeed based more on skill
than on actual TCBs, it could be that softball coaches are better able to predict individual
performance than tennis coaches. This makes sense since coaches already have an idea of
who will be starting games and who will be the nonstarters (i.e., players that usually sit
the bench). In other words, starting players see more playing time compared to nonstart-
ers, and thus are more likely to outperform those who do not see as much playing time.
There are often more nonstarters on a softball team compared with tennis teams.
Preseason Rating of Team-TCB
The full model conducted on both softball and tennis athletes demonstrated a
positive main effect of ASQ, which indicates that controlling for the ratings of team-TCB,
athlete satisfaction still significantly predicts individual performance. Upon examining
the individual analyses on softball and tennis, this effect is still only present in the soft-
ball athlete sample. The lack of significance for this effect in tennis teams could be due
to the smaller sample size. However, it could also be due to other factors. The athlete
satisfaction measure (ASQ) specifically asks how satisfied an athlete is with their playing
time on the team, among other things. An athlete who starts most games/matches is more
69
likely to be satisfied and is more likely to outperform nonstarters since they are seeing
more playing time.
Postseason Ratings of Self and Team-TCB
Whereas the self-TCB ratings were better preseason predictors of individual
performance compared to the team-TCB ratings, here, the team-TCB ratings are better
postseason predictors than the self-TCB ratings. The athletes may start as a group of indi-
viduals at the beginning of the season but become more united as the season progresses.
In other words, they may be more team-minded when they responded to the postseason
survey. The only significant effect that emerged in the analyses of self-TCBs was ASQ
and it was significant for both softball and tennis athletes. In the overall model exploring
the effects of team-TCBs, ASQ was again significant. In addition, there was a significant
main effect of sportsmanship. This indicates that an athlete’s perception of her team’s
sportsmanship behaviors is positively related to her individual performance. That is, if
she perceives her team to be positive-minded and encouraging, her performance benefits.
Team-Level Results
Preseason Rating of Self-TCB
Hypothesis 1B stated that TCBs would be positively related to team performance,
and Hypothesis 2B stated that sport would moderate the effects of TCBs on team perfor-
mance. As expected, the analyses examining the effects of preseason ratings of TCBs—
helping, civic virtue, and sportsmanship—on team performance yielded some significant
results. However, there also emerged some differences between tennis and softball teams
in the strength and direction of these relationships. When examining the preseason self-
70
TCB ratings, there were marginally significant Sport x Coach TCB Rating and Sport x
Sportsmanship interactions. Moreover, there was a significant Sport x Helping Behavior
interaction. First looking at the Sport x Coach TCB Rating interaction, simple slope tests
showed a significant positive effect for coach rating of athlete TCB on team performance,
but only in tennis teams. These results indicate that a higher mean coach rating of athlete
TCBs corresponds to better than average team performance over the season. In simple
terms, this means that if team members exhibit more TCBs, on average, it should re-
sult in improved performance. Based on these results, this was not the case for softball
teams. However, these results may not be as clear-cut as they seem. Though all coaches
were given the exact same instructions and rated their athletes on the same 7-point scale,
coaches differed somewhat in their ratings across teams. For example, some coaches
utilized the full range of ratings (one to seven), whereas other coaches dished out mainly
sixes and sevens. It is difficult to determine whether the coach’s ratings are equivalent to
one another. In addition, coaches might have been influenced by the athlete’s skill level
when rating the extent to which each one exhibited TCBs. Consequently, athletes deemed
more skillful might have been awarded higher ratings of TCB due to their contribution
to the team’s potential to win. These results have been noted but are not given substantial
weight considering the potential differences between coach ratings, and the fact that the
coach gave a single rating of athlete TCB, rather than separate ratings on helping, civic
virtue, and sportsmanship behaviors.
Exploring the marginally significant Sport x Sportsmanship interaction revealed
a significant positive effect of sportsmanship behaviors on team performance in ten-
71
nis teams. This suggests that when tennis athletes demonstrate sportsmanship behaviors
(i.e., tolerating problems without complaining), they are more likely to perform better as
a unit. By refraining from complaining, a more positive attitude can be maintained and
therefore, less energy will be spent on group maintenance functions. This relationship
did not emerge as significant in softball teams. Here, the lack of support for a positive
relationship between sportsmanship behaviors and team performance could be due to a
variety of reasons. For one, the relationship might not exist. More likely, however, is that
there are other factors at work here that might attenuate this relationship. Softball teams
typically have more members than tennis teams because of the nature of the game. For
example, a softball game requires more members playing at any one time and a greater
variety of positions. Therefore, softball teams tend to have more nonstarters than do ten-
nis teams. In general, nonstarters might report that they complain more (i.e., exhibit fewer
sportsmanship behaviors) than do starters. Because of this, tennis athletes might be on
a more level playing field, so to speak. In other words, tennis athletes on any one team
might be more likely to respond similarly than softball athletes on any one team. If this
were the case, the average rating of sportsmanship behavior (and other TCBs) for each
team could depend on the number of starters and nonstarters that responded to the survey.
The softball team-TCB averages would be more affected than the tennis team-TCB aver-
ages. A scenario could be that all the starters from a particular softball team responded
to the preseason survey, and few, if any, nonstarters responded to the survey. If the start-
ers said they never complain, then the team would have a very high mean sportsmanship
behavior score. However, what if the nonstarters on the same team complain all the time?

72
Their scores would not be accounted for because they did not respond to the survey.
Factor in average or below average team performance and the expected positive relation-
ship disappears. This issue should be taken into consideration when drawing conclusions
about these results.
Research has shown that TCBs are related to performance, though evidence
is stronger for some forms of TCB (i.e., helping) than for others (i.e., civic virtue and
sportsmanship). As expected, helping behavior was generally the strongest predictor of
the three types of TCBs in all of the analyses. In addition, this relationship was moderated
by sport (Hypothesis 2B). Contrary to predictions, the simple slope tests investigating this
interaction indicated that helping behavior was negatively related to team performance
in softball teams. The relationship was positive in tennis teams, though not significant.
It is important to note that (1) the negative relationship observed within softball teams is
only marginally significant, and (2) the Type 1 error rate is inflated due to the multiple
analyses that were conducted. These results must be interpreted with caution. At the very
least, the opposite direction of the helping behavior-performance relationship between
tennis and softball teams should be addressed. Research has shown that the direction of
the TCB-performance relationship is not always consistent. As mentioned before, help-
ing behavior can increase or decrease work group performance. For example, Podsakoff
et al. (1994) found that helping behavior decreased performance in a sample of insurance
agency units, while MacKenzie et al. (1996) found it increased performance in a sample
of pharmaceutical sales teams. One explanation for this difference is that the insurance
sales agents were compensated on the basis of their individual performance, whereas the
73
compensation for the pharmaceutical teams was entirely based on team performance.
Therefore, it stands to reason that the pharmaceutical teams would be more inclined to
provide help to their peers compared to the insurance sales agents. The idea of interde-
pendence was integrated into the current study by the inclusion of two types of sports
teams—tennis and softball.
In this study, tennis was originally classified as less interdependent than softball.
However, this general classification may be too simplistic. As discussed in the introduc-
tion, sports are multifaceted and can consist of both independent and interdependent
tasks. In this case, softball includes both batting, which is more independent, and field-
ing, which is more interdependent. Along the same lines, tennis includes singles matches
and doubles matches, the former task being more independent than the latter. Softball,
as a sport, could be considered more interdependent than tennis in the sense that there
are a greater number of moving parts that contribute to the effectiveness of the whole
unit. Thus, softball may require more overall interaction between members. However,
the positions are more differentiated in softball than they are in tennis. Therefore, help-
ing behaviors may translate differently across sport. Independent t-tests at the team-level
showed that softball teams rated their teammates as being more helpful than tennis teams
(p < .01). Even though softball appears to exhibit more helping behaviors (based on TCB
subscale averages), the actual behaviors may be more effective in tennis.
In tennis, the same set of skills underlies performance in singles and doubles
matches. A primarily doubles player could help a singles player via practice, coaching,
etc., and a singles player could help a doubles player. In softball, there is also a basic

74
set of skills that all players must have which includes the ability to hit, field, and throw.
However, there are slightly different skill requirements among positions. For example,
fielding in the dirt infield requires different techniques than fielding in the grassy outfield.
When the positions become even more specific (pitcher and catcher), it is unlikely that an
outfielder could help a pitcher in her skill development, and vice versa. The transferabil-
ity of skills among athletes is more fluid in tennis than in softball.
Items on the helping behavior subscale touch on the above aspects (helping team-
mates in practice, sharing expertise, giving time to teammates, etc.) but it also touches
on less tangible aspects such as encouraging teammates when they are down and offer-
ing help to teammates when there are disagreements. Thus, the lack of significant results
for both tennis and softball teams cannot be entirely explained by differences in sport.
The differences between organizational and sport teams might shed some light on these
results. Increased motivation in an organization generally translates to improved perfor-
mance, whereas in sports, it does not always translate into better performance. For ex-
ample, batters will go through “slumps.” Due to the degree of unpredictability in sports,
helping behaviors may not directly translate into better performance, or the relationship
may not be as strong.
Since the results were in the opposite direction as predicted, I conducted some
follow-up multiple regression analyses with different outcome variables—a low task
interdependence performance composite and high task interdependence composite. These
post hoc analyses must be interpreted with great caution, as the Type 1 error rate is most
likely inflated due to the multiple analyses that were previously conducted. When predict-
75
ing the low task interdependence composite, there was a significant main effect of help-
ing behavior, which was qualified by a significant Sport x Helping Behavior interaction.
Compared to analyses run on the original team performance composite, the relationship
between helping behavior and team performance was still negative, but in these analyses,
it was significant. Moreover, when I conducted the multiple regression analyses on the
high task interdependence performance composite, there were no significant main effects
or interactions. Namely, helping behavior did not have a significant effect on softball low
task interdependence performance. The significant negative effect was isolated to inde-
pendent tasks (i.e., batting) in softball. The relationship between helping behaviors and
performance was positive for tennis in both analyses, though not significant.
This indicates that helping behaviors may detract from performance that is more
independent than team-oriented (e.g., batting vs. fielding), but only in softball. Perhaps
this is the case because in softball, only one athlete can be batting at a time. Therefore,
if an athlete is helping her teammate(s) with batting practice (e.g., pitching balls to the
batter), she can’t simultaneously be practicing her own batting. In tennis, teammates can
be simultaneously practicing their skills (e.g., serving back and forth on either side of the
net). It appears that interdependence of a specific task, as well as the nature of the task,
within sport may play a role in the relationship between helping behaviors and perfor-
mance.
Preseason Rating of Team-TCB
The only result that emerged from this analysis was a marginally significant effect
of team cohesiveness (GEQ) on team performance. The direction suggests that higher

76
team cohesiveness leads to better team performance. Since GEQ was not significant in
the prior analyses, it also indicates that preseason self-TCB ratings account for more
variance in team performance than preseason team-TCB ratings. On average, athletes
tended to rate themselves higher on TCBs (i.e., helping, civic virtue, and sportsmanship
behaviors) compared to the ratings they assigned to their teams on these same behav-
iors. The aggregate team scores also reflected these differences. Athletes may have rated
themselves higher because they are biased. However, it could also be that their rating of
the team’s TCBs is generally lower because it reflects the entire team (i.e., players who
exhibit lots of TCB and those who do not demonstrate many). In addition, athletes who
exhibit more TCBs may be more invested in the team, and thus more likely to respond to
the survey. Therefore, this could result in higher ratings of self-TCB and slightly lower
ratings of team-TCB (accounting for all teammates’ TCBs).
Postseason Ratings of Self-TCB and Team-TCB
Because these athletes provided these postseason ratings at the end of their sea-
son, it is highly likely that their performance, as well as their team’s performance, im-
pacted their ratings. Therefore, the relationships examined provide evidence of correla-
tion rather than causation. The multiple regression analysis of self-TCB ratings predicting
team performance revealed only a significant main effect of athlete satisfaction predicting
team performance. Here, the greater the average athlete satisfaction on the team, the bet-
ter the overall team performance. It can be argued that better team performance resulted
in more satisfied athletes.
The multiple regression analysis of team-TCB ratings predicting performance

77
demonstrated a significant Sport x Sportsmanship interaction. Sportsmanship behav-
ior was positively associated with team performance in tennis teams, but not in softball
teams. Due to the cross-sectional nature of the postseason survey, this merely means that
higher sportsmanship behaviors are associated with better team performance. It could be
that for tennis teams who performed well, they attributed the team’s success partially to
sportsmanship behaviors (i.e., being a team player).
Relationships Between Variables
Hypothesis 3 stated that athlete satisfaction (ASQ), team cohesiveness (GEQ),
and perceptions of leadership behaviors (MLQ) would have positive relationships with
team-level TCB and with team performance. The correlations between preseason team-
level variables (Table 17) confirmed that ASQ, GEQ, and MLQ were indeed related
to several TCBs. Interestingly, the correlations were much stronger with the ratings
of team-TCB than with ratings of self-TCB. Specifically, team cohesiveness was only
significantly and positively related to helping behavior (self) and sportsmanship (self).
However, ASQ, GEQ, and MLQ were all significantly and positively related to all team-
TCBs (helping, civic virtue, and sportsmanship). Moreover, the relationships between
TCBs and other variables (ASQ, GEQ, and MLQ) were stronger than those between
TCBs and hard measures of performance. It appears that TCBs, ASQ, GEQ, and MLQ
are more related with each other than they are with hard measures of performance. One
explanation for this is that ASQ, GEQ, and MLQ are antecedents of TCB, as proposed
by organizational researchers, and therefore have stronger relationships with TCB com-
pared to performance. Another is that sport performance is variable and depends on a

78
combination of these variables working in conjunction with each other as opposed to just
one standing alone. Though the aforementioned variables had stronger relationships with
TCB, a couple of them did demonstrate significant positive relationships with a subset of
performance outcomes. Helping behaviors (team) and group cohesiveness were both sig-
nificantly associated with high task interdependence performance outcomes. That is, the
more helping behaviors a team shows as a whole, or the more cohesiveness the team is,
the better the team is expected to perform on tasks that require more coordination among
its members (i.e., fielding, doubles matches). These are promising findings for establish-
ing a relationship between helping behaviors and aspects of team performance.
Limitations and Future Directions
As expected, and as organizational research has shown, team citizenship behav-
iors demonstrated significant relationships with team performance. However, opposite as
predicted, the magnitude and direction of these relationships were inconsistent between
softball and tennis teams. For example, sportsmanship behaviors (team) showed a sig-
nificant positive relationship with performance for tennis teams, but this relationship was
not significant for softball. Also, similar to previous research on TCBs, helping behav-
ior generally emerged as the strongest TCB predictor of performance. However, help-
ing behavior had an overall negative effect on softball performance, although the effect
was only marginally significant. When performance was broken down into high and low
task interdependence performance composites (post hoc analyses), the negative effect of
helping behaviors on softball team performance was significant only for the latter. This
might indicate that helping behavior can be helpful (or at least not detrimental), but only

79
in some situations. Namely, helping behavior might be more likely to negatively impact
tasks that are independent in nature (e.g., batting). However, tennis is a more independent
sport compared to softball, and helping behavior did not have a negative effect on either
high or low task interdependence performance in tennis teams. Therefore, these tentative
results may not be based entirely on the interdependence of the task but should also take
into account the nature of the task. For example, only one athlete can be batting at a time,
whereas in tennis, athletes can be practicing at the same time. Therefore, if an athlete
is helping her teammate(s) with batting practice (e.g., pitching balls to the batter), she
can’t simultaneously be practicing her own batting. If a batter is taking time away from
her batting practice to help a fellow teammate, she’s lost that time to work on her own
skills. This can also apply to members within organizations. When Sam (the good Sa-
maritan) left his station to help Dennis, he may have gotten behind on his own work. This
study examined two different types of teams with the expectation that one type of team
(softball) would benefit more from TCBs because overall, it is considered more interde-
pendent (i.e., a team sport) than tennis. Rather than applying one broad label to a sport,
researchers should consider the various tasks within the sport and examine how their
corresponding levels of interdependence and unique characteristics interact with TCBs to
impact performance. The TCB-performance relationship is complex within sport teams
and future research is needed to assess what role they play for different types of teams
and tasks.
There are also some general limitations to this study that should be considered.
For one, softball and tennis athletes differed significantly in age and years in sport with
80
tennis athletes being slightly older and more experienced compared to softball athletes.
These two variables were added to the analyses to determine the effects they would have
on the results. Adding them as covariates attenuated the effects but did not change the
general pattern of the results. For the sake of power, these two variables were excluded
from the overall analyses. Therefore, the differences between the athletes could account
for some of the results presented here. Future studies should attempt to recruit a higher
number of athletes with the samples being relatively equivalent in size and demographics
across teams.
Another issue is that all TCB results were self-report. Therefore, these analyses
looked at perceptions of TCBs and their effects on performance. Though the coach’s
rating was also included as an additional rating of athlete TCB, it was one overall rating
of TCB rather than separate ratings of helping behavior, civic virtue, and sportsmanship.
In addition, the coach’s ratings could be biased based on athlete skill and a host of other
factors. Future studies might address this limitation by having a third party observe the
athletes and provide ratings. Also, softball and tennis might not be as different from each
other in terms of interdependence as opposed to other teams (e.g., basketball vs. golf).
Future research on the role of interdependence in the TCB-performance relationship
might benefit from observing teams that are more distinct in terms of interdependence.
Despite its limitations, the results from the present study provide a foundation on
which to further examine how team citizenship behaviors apply to the sport world. For
one, utilizing real teams and athletes is important for understanding how TCBs operate.
In addition, measuring these behaviors at the preseason could be invaluable for prepar-

81
ing teams to perform optimally during the season. If coaches have an idea of how their
teams rank on these behaviors and when these behaviors are helpful, they can better focus
their efforts. For example, softball coaches could provide extra assistants during batting
practice so that all athletes get more reps. That way, players aren’t losing time developing
their own skills by helping out a teammate. And for tasks that are more interdependent,
coaches can encourage athletes in similar positions (outfielder, doubles match player)
to work together to improve their skill set. Understanding how, when, and why TCBs
improve team performance can offer both sport teams and organizational teams an edge
to their opposition.

82
APPENDIX A
EMAILS TO COACHES

83
Recruitment Email To Coaches
Hello Coaches, I’m a former athlete on the University of Michigan softball team currently in the dis-sertation phase of my doctoral studies in social psychology at Loyola University Chi-cago. My research focuses primarily on groups, in particular, factors that influence group performance. Since I have a great interest in sports and factors that have the potential to improve performance, it’s my hope that for my dissertation, I can study women’s sports teams. This is where your team comes in. This is what the study would entail for each player and coach -- an online preseason ques-tionnaire (10-15 min in January/February 2012), an online postseason (but before tourna-ment play) questionnaire (10-15 min), and overall season statistics (collected just once at the end of the season). The questionnaire will include a measure of team citizenship behaviors (e.g., sportsmanship, helping behaviors), perceptions of leadership, team cohe-siveness, and athlete satisfaction. From experience, I know your time and your players’ time is limited which is why the questionnaires will be quick and painless. In addition, I will provide every team that participates with a full report of the results, which might be helpful in understanding your own team’s performance. More research like this is needed to understand the specific conditions under which certain factors influence performance in sports teams. If you’re interested in furthering this research by participating in my study, I can provide you with additional information. Please let me know whether you are definitely interested, might be interested, or not at all interested (and I can take you off my list). Thank you so much for your time and I look forward to hearing from you soon! Best of luck in your season! Sincerely, Rachael Martinez, MA

84
Response to Coaches Who Are Interested
Hello Coach, Thank you for your help! Let me give you a few more details about the study as well as the timeline. Like I said, each player and coach will fill out an online preseason ques-tionnaire and an online postseason questionnaire. The preseason questionnaire will most likely come at the end of January/beginning of February and the postseason questionnaire will come before your end-of-season tournament play. Therefore, you should hear from me only twice during your season. Since these questionnaires are online, they are relatively hassle-free and can be filled out on any computer that has the internet. The questionnaires can be sent out in one of two different ways (whichever you prefer) -- (1) I email you a link and you forward that link to your team, or (2) you provide me with your players’ email addresses and I will send them the link directly. The players’ questionnaires will take approximately 10 to 15 min-utes. The coach’s questionnaire is very short and simply consists of the coach rating each player on one question. Therefore, if you have 10 players, you will provide 10 ratings. This will probably take 5 minutes. If the overall 2012 season statistics (including all the matches/games before end-of-season tournament play) are on your team’s website, I can pull them from there on my own. Most importantly, I am promising confidentiality to every player and coach. Because of this, I cannot show how individual athletes or teams rank relative to other athletes or teams. Instead, I will be reporting the overall results, which might be informative for understanding, and possibly improving, your own team’s performance. After the report is finished, you will receive an electronic copy. If you have any further questions, please do not hesitate to contact me! I will be in touch with you in the near future. Sincerely, Rachael Martinez, MA
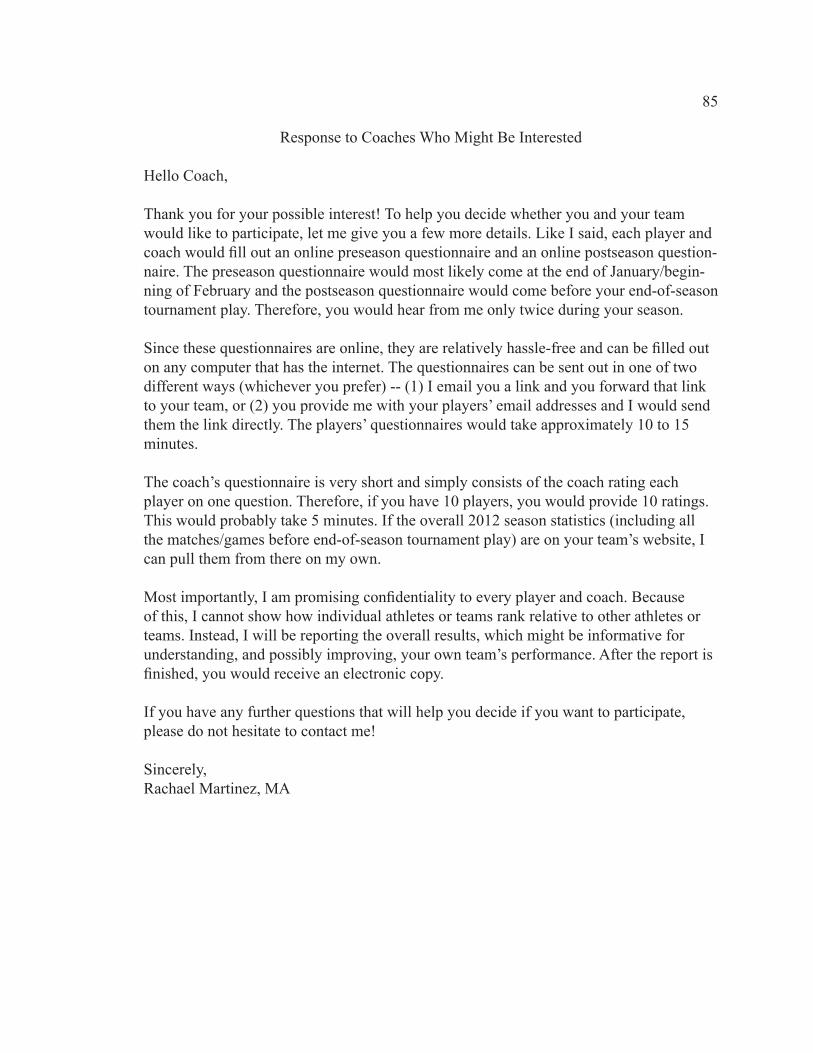
85
Response to Coaches Who Might Be Interested
Hello Coach, Thank you for your possible interest! To help you decide whether you and your team would like to participate, let me give you a few more details. Like I said, each player and coach would fill out an online preseason questionnaire and an online postseason question-naire. The preseason questionnaire would most likely come at the end of January/begin-ning of February and the postseason questionnaire would come before your end-of-season tournament play. Therefore, you would hear from me only twice during your season. Since these questionnaires are online, they are relatively hassle-free and can be filled out on any computer that has the internet. The questionnaires can be sent out in one of two different ways (whichever you prefer) -- (1) I email you a link and you forward that link to your team, or (2) you provide me with your players’ email addresses and I would send them the link directly. The players’ questionnaires would take approximately 10 to 15 minutes. The coach’s questionnaire is very short and simply consists of the coach rating each player on one question. Therefore, if you have 10 players, you would provide 10 ratings. This would probably take 5 minutes. If the overall 2012 season statistics (including all the matches/games before end-of-season tournament play) are on your team’s website, I can pull them from there on my own. Most importantly, I am promising confidentiality to every player and coach. Because of this, I cannot show how individual athletes or teams rank relative to other athletes or teams. Instead, I will be reporting the overall results, which might be informative for understanding, and possibly improving, your own team’s performance. After the report is finished, you would receive an electronic copy. If you have any further questions that will help you decide if you want to participate, please do not hesitate to contact me!
Sincerely, Rachael Martinez, MA

86
APPENDIX B
DEMOGRAPHIC INFORMATION FORMS

87
Student-Athlete Demographic Information
1. What is your full name?2. What college/university do you attend?3. What sport do you play?4. Indicate your role(s) on this team (e.g., pitcher, singles match player, etc.)5. What year are you in school?
a. Freshmanb. Sophomorec. Juniord. Seniore. Fifth yearf. Sixth year
6. I am currently participating in my:a. First season on this teamb. Second season on this teamc. Third season on this teamd. Fourth season on this teame. Fifth season on this teamf. Sixth season on this team
7. What is your age?8. How would you classify your race/ethnicity? (please check the one option that best describes you)
a. African-American/Blackb. American Indian/Alaska Nativec. East Indian/Pakistanid. Filipino/Filipino-Americane. Asianf. Pacific Islanderg. Hispanic/Latinoh. White/Caucasiani. Biracialj. Multiracialk. Other (please specify)

88
Coach Demographic Information
1. What is your full name?2. At which university/college do you currently coach?3. What sport do you coach? (If you coach more than one, list the sport for which you’re filling out this survey)4. Please indicate your coaching responsibility to this team.
a. Head coachb. Associate head coachc. Assistant coachd. Other (please specify)
5. Approximately how many years have you coached at this program? (enter a whole number)6. Approximately how many years have you coached during your entire coaching career? (enter a whole number)7. What is your age?8. What is your gender?9. How would you classify your race/ethnicity? (please check the one option that best describes you)
a. African-American/Blackb. American Indian/Alaska Nativec. East Indian/Pakistanid. Filipino/Filipino-Americane. Asianf. Pacific Islanderg. Hispanic/Latinoh. White/Caucasiani. Biracialj. Multiracialk. Other (please specify)

89
APPENDIX C
TEAM CITIZENSHIP BEHAVIOR SCALES

90
Athlete Team Citizenship Behavior Scale (report about the self)
This questionnaire will ask you questions regarding the behaviors you might exhibit toward your teammates. Please rate the extent to which you agree with the following statements.
1. I help out other teammates if someone falls behind in her practice.2. I willingly share my expertise with other players on the team.3. I try to act like a peacemaker when other teammates have disagreements.4. I take steps to try to prevent problems with other teammates.5. I willingly give my time to teammates who have sport-related problems.6. I “touch base” with other teammates before initiating actions that might affect
them. 7. I encourage my teammates when they are down.8. I provide constructive suggestions about how the team can improve its effective-
ness.9. I am willing to risk disapproval to express beliefs about what’s best for the team.10. I attend and actively participate in team meetings.11. I always focus on what is wrong with our situation, rather than the positive side.12. I spend a lot of time complaining about trivial matters.13. I always find fault with what other teammates are doing.

91
Athlete Team Citizenship Behavior Scale (report about the team, as a whole)
Now, please rate the extent to which you agree with the following statements about your team as a whole.
1. My teammates help each other out if someone falls behind in her practice.2. My teammates willingly share their expertise with other players on the team.3. My teammates try to act like peacemakers when other players on the team have
disagreements.4. My teammates take steps to try to prevent problems with other teammates.5. My teammates willingly give their time to teammates who have sport-related
problems.6. My teammates “touch base” with other teammates before initiating actions that
might affect them. 7. My teammates encourage other teammates when they are down.8. My teammates provide constructive suggestions about how the team can improve
its effectiveness.9. My teammates are willing to risk disapproval to express beliefs about what’s best
for the team.10. My teammates attend and actively participate in team meetings.11. My teammates always focus on what is wrong with our situation, rather than the
positive side.12. My teammates spend a lot of time complaining about trivial matters.13. My teammates always find fault with what other teammates are doing.

92
Coach Team Citizenship Behavior Ratings of Athletes
Please read the following description about team citizenship behaviors and subsequently rate the degree to which you agree that each athlete reflects these behaviors. (The coach will rate each statement on a 7-point rating scale (1 = strongly disagree to 7 = strongly agree).
Team citizenship behaviors are behaviors exhibited by athletes that are not essential to successfully performing the task, but do help the team function more effectively as a unit. Examples of these behaviors include an athlete helping out another teammate if she falls behind in her practice, providing constructive suggestions about how the team can im-prove its performance, and/or refraining from complaining about trivial issues. In other words, an athlete who displays team citizenship behaviors is a team member who goes above and beyond the call of duty to help out her team.
___Name of Athlete #1___ displays team citizenship behaviors on a regular basis.
1 2 3 4 5 Never Seldom Occasionally Often Always
___Name of Athlete #2___ displays team citizenship behaviors on a regular basis.
1 2 3 4 5 Never Seldom Occasionally Often Always
Etc.

93
APPENDIX D
GROUP ENVIRONMENT QUESTIONNAIRE
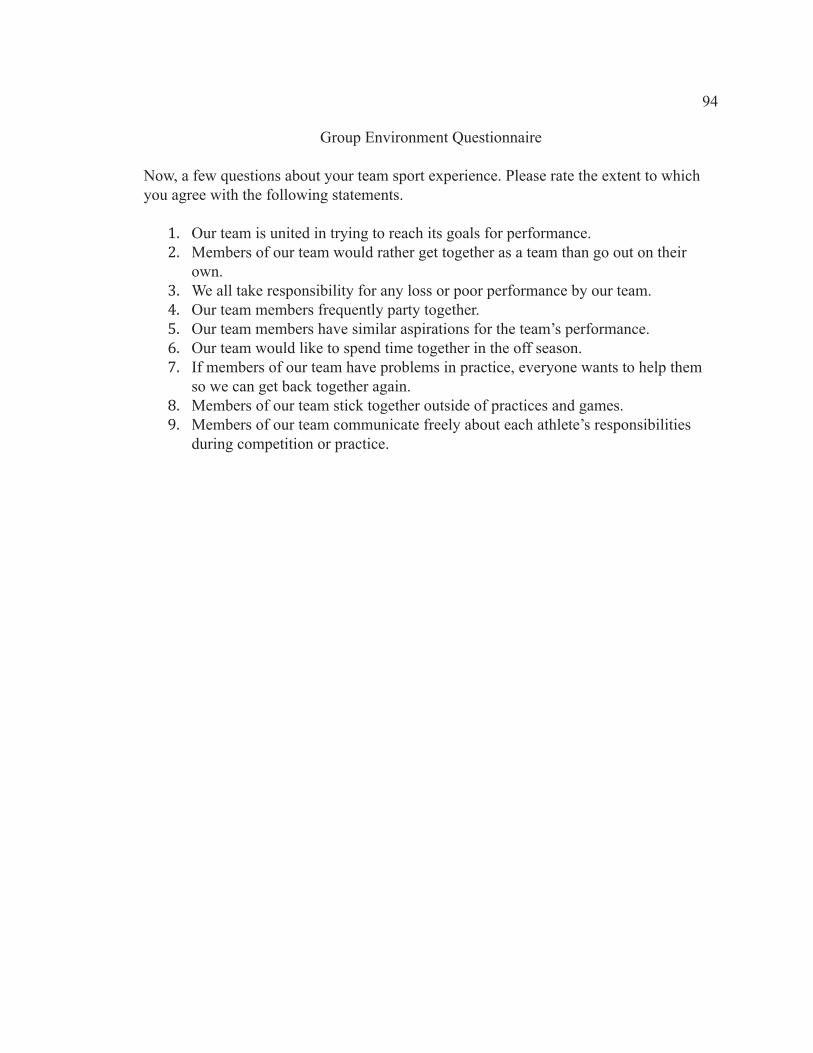
94
Group Environment Questionnaire
Now, a few questions about your team sport experience. Please rate the extent to which you agree with the following statements.
1. Our team is united in trying to reach its goals for performance.2. Members of our team would rather get together as a team than go out on their
own.3. We all take responsibility for any loss or poor performance by our team.4. Our team members frequently party together.5. Our team members have similar aspirations for the team’s performance.6. Our team would like to spend time together in the off season.7. If members of our team have problems in practice, everyone wants to help them
so we can get back together again.8. Members of our team stick together outside of practices and games.9. Members of our team communicate freely about each athlete’s responsibilities
during competition or practice.
95
APPENDIX E
MULTIFACTOR LEADERSHIP QUESTIONNAIRE
(TRANSFORMATIONAL LEADERSHIP BEHAVIORS)
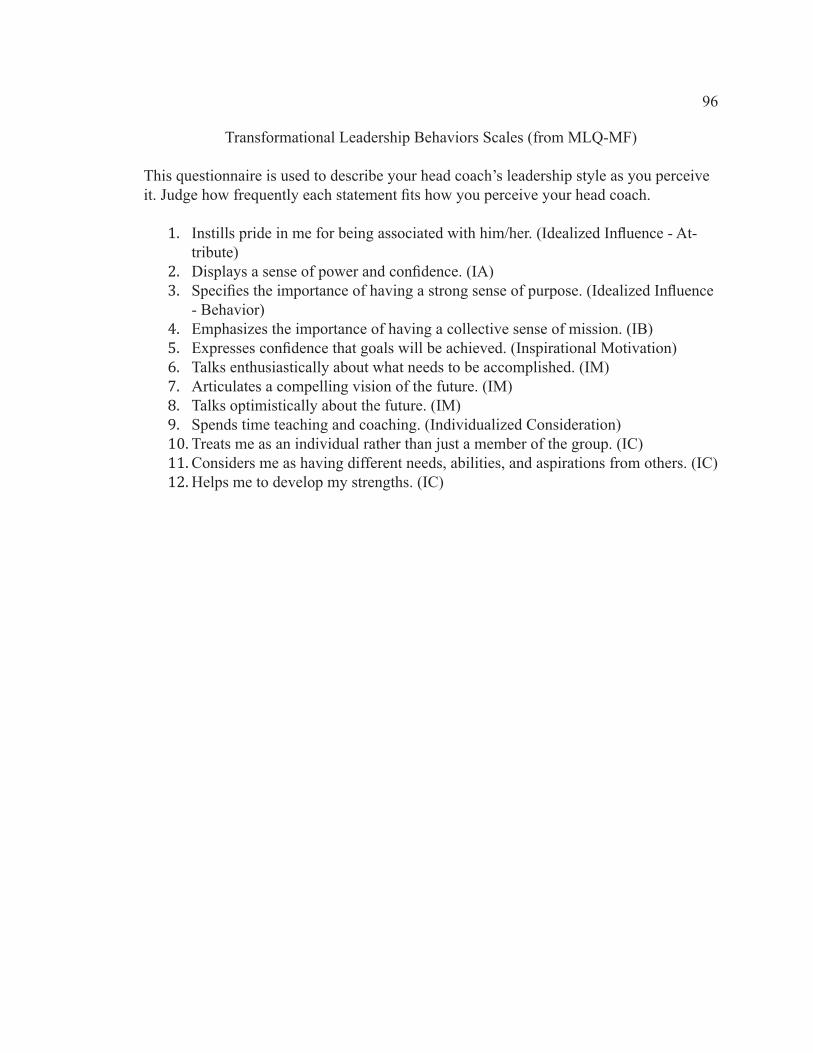
96
Transformational Leadership Behaviors Scales (from MLQ-MF)
This questionnaire is used to describe your head coach’s leadership style as you perceive it. Judge how frequently each statement fits how you perceive your head coach.
1. Instills pride in me for being associated with him/her. (Idealized Influence - At-tribute)
2. Displays a sense of power and confidence. (IA)3. Specifies the importance of having a strong sense of purpose. (Idealized Influence
- Behavior)4. Emphasizes the importance of having a collective sense of mission. (IB)5. Expresses confidence that goals will be achieved. (Inspirational Motivation)6. Talks enthusiastically about what needs to be accomplished. (IM)7. Articulates a compelling vision of the future. (IM)8. Talks optimistically about the future. (IM)9. Spends time teaching and coaching. (Individualized Consideration)10. Treats me as an individual rather than just a member of the group. (IC)11. Considers me as having different needs, abilities, and aspirations from others. (IC)12. Helps me to develop my strengths. (IC)

97
APPENDIX F
ATHLETE SATISFACTION QUESTIONNAIRES

98
Athlete Satisfaction: Preseason Questionnaire
Please rate the degree to which you are satisfied with various aspects of your team sport experience.
1. My performance in the preseason. 2. The improvement in my skill level from the beginning of this year until now.3. My team’s overall performance in preseason play.4. The degree to which my team has met its goals for the preseason.5. The degree to which my abilities are used on the team.6. The extent to which my role matches my potential.7. The amount of time I played during preseason games.8. The degree to which my role on the team matches my preferred role.
Athlete Satisfaction: Postseason Questionnaire
Please rate the degree to which you are satisfied with various aspects of your team sport experience.
1. My performance over the season. 2. The improvement in my skill level from the beginning of this season until now.3. My team’s overall performance during the season.4. The degree to which my team has met its goals for the season thus far.5. The degree to which my abilities are used on the team.6. The extent to which my role matches my potential.7. The amount of time I play during games.8. The degree to which my role on the team matches my preferred role.

99
APPENDIX G
T-TESTS

100
Table 15. Independent t-tests to examine differences between tennis and softball teams on aggregated team variables
Sportt dfSoftball Tennis
Preseason Coach TCB Rating 5.50 (.79) 5.35 (.65) -.60 38Postseason Coach TCB Rating 5.88 (.70) 5.74 (.64) -.64 35Preseason Helping (Self) 5.88 (.22) 5.81 (.29) -.87 38Postseason Helping (Self) 5.88 (.24) 5.84 (.39) -.42 35Preseason Civic Virtue (Self) 5.62 (.26) 5.62 (.26) .05 38Postseason Civic Virtue (Self) 5.63 (.37) 5.84 (.36) 1.74† 35Preseason Sportsmanship (Self) 5.27 (.22) 5.20 (.36) -.77 38Postseason Sportsmanship (Self) 5.37 (.35) 5.14 (.70) -1.32 35Preseason Helping (Team) 5.69 (.36) 5.26 (.58) -2.86** 38Postseason Helping (Team) 5.56 (.39) 5.33 (.65) -1.32 35Preseason Civic Virtue (Team) 5.67 (.32) 5.19 (.61) -3.28** 38Postseason Civic Virtue (Team) 5.55 (.43) 5.53 (.57) -.14 35Preseason Sportsmanship (Team) 4.63 (.43) 4.28 (.58) -2.19* 38Postseason Sportsmanship (Team) 4.31 (.74) 4.09 (.99) -.78 35Preseason GEQ 5.76 (.57) 5.38 (.66) -1.91† 38Postseason GEQ 5.64 (.67) 5.57 (.61) -.301 35Preseason MLQ 4.30 (.32) 4.16 (.28) -1.38 38Postseason MLQ 4.01 (.46) 4.15 (.51) .89 35Preseason ASQ 5.39 (.38) 5.17 (.54) -1.50 38Postseason ASQ 4.77 (.58) 5.41 (.77) 2.90** 35Team Win-Loss Percentage .48 (.19) .57 (.19) 1.44 38
Note. †p< .10 *p <.05 **p<.01 ***p<.001
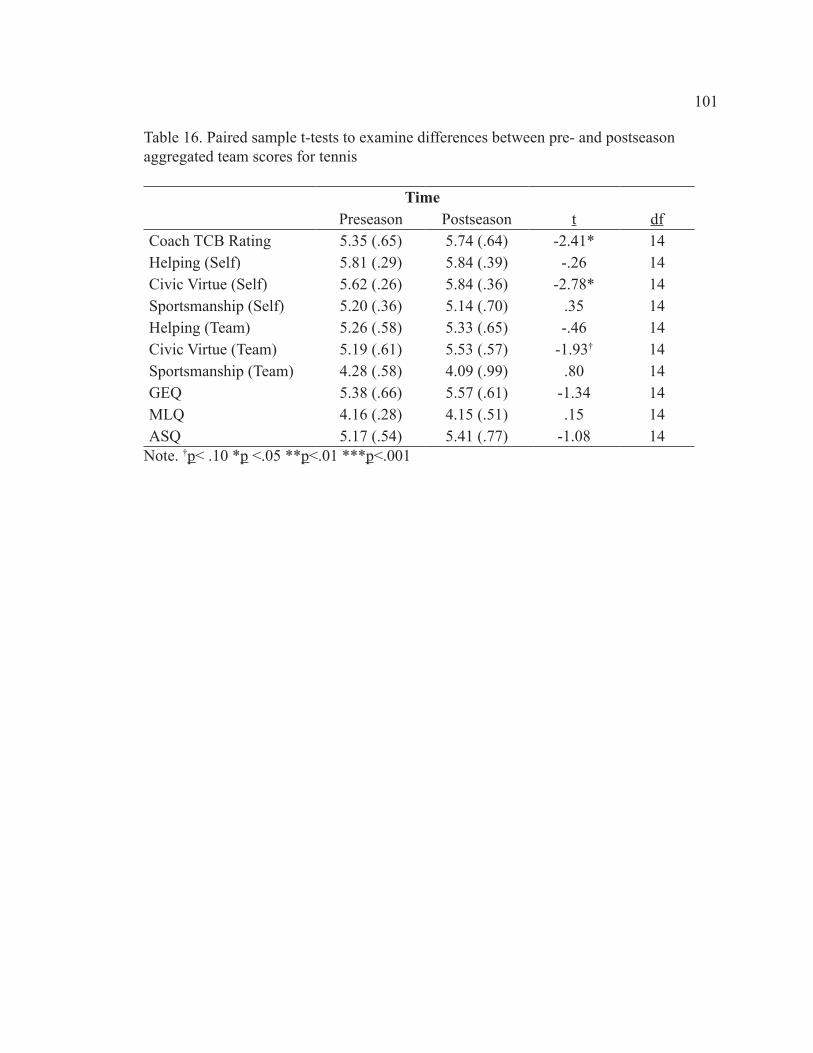
101
Table 16. Paired sample t-tests to examine differences between pre- and postseason aggregated team scores for tennis
Timet dfPreseason Postseason
Coach TCB Rating 5.35 (.65) 5.74 (.64) -2.41* 14Helping (Self) 5.81 (.29) 5.84 (.39) -.26 14Civic Virtue (Self) 5.62 (.26) 5.84 (.36) -2.78* 14Sportsmanship (Self) 5.20 (.36) 5.14 (.70) .35 14Helping (Team) 5.26 (.58) 5.33 (.65) -.46 14Civic Virtue (Team) 5.19 (.61) 5.53 (.57) -1.93† 14Sportsmanship (Team) 4.28 (.58) 4.09 (.99) .80 14GEQ 5.38 (.66) 5.57 (.61) -1.34 14MLQ 4.16 (.28) 4.15 (.51) .15 14ASQ 5.17 (.54) 5.41 (.77) -1.08 14
Note. †p< .10 *p <.05 **p<.01 ***p<.001

102
Table 17. Paired sample t-tests to examine differences between pre- and postseason aggregated team scores for softball
Timet dfPreseason Postseason
Coach TCB Rating 5.56 (.80) 5.89 (.70) -2.67* 21Helping (Self) 5.90 (.22) 5.88 (.24) .40 21Civic Virtue (Self) 5.61 (.27) 5.63 (.37) -.23 21Sportsmanship (Self) 5.25 (.22) 5.37 (.35) -1.49 21Helping (Team) 5.67 (.36) 5.56 (.39) 1.84† 21Civic Virtue (Team) 5.65 (.33) 5.55 (.43) 1.48 21Sportsmanship (Team) 4.64 (.45) 4.31 (.74) 2.92** 21GEQ 5.71 (.60) 5.64 (.67) 1.02 21MLQ 4.29 (.31) 4.01 (.46) 4.44*** 21ASQ 5.41 (.38) 4.77 (.58) 4.91*** 21
Note. †p< .10 *p <.05 **p<.01 ***p<.001

103
Table 18. Independent t-tests to examine differences between tennis and softball athletes
Athletest dfSoftball Tennis
Preseason Coach TCB Rating 5.48 (1.37) 5.37 (1.23) -.86 570Postseason Coach TCB Rating 5.90 (1.20) 5.76 (1.08) -1.16 500Preseason Helping (Self) 5.88 (.63) 5.85 (.57) -.35 445Postseason Helping (Self) 5.88 (.62) 5.87 (.56) -.16 320Preseason Civic Virtue (Self) 5.61 (.84) 5.65 (.72) .49 445Postseason Civic Virtue (Self) 5.62 (.85) 5.89 (.62) 2.36* 320Preseason Sportsmanship (Self) 5.26 (1.09) 5.23 (1.04) -.28 445Postseason Sportsmanship (Self) 5.40 (1.08) 5.22 (1.25) -1.14 320Preseason Helping (Team) 5.68 (.80) 5.33 (1.00) -3.53*** 440Postseason Helping (Team) 5.57 (.87) 5.38 (1.05) -1.47 310Preseason Civic Virtue (Team) 5.66 (.85) 5.27 (.93) -3.78*** 440Postseason Civic Virtue (Team) 5.59 (.94) 5.58 (1.01) -.09 310Preseason Sportsmanship (Team) 4.59 (1.29) 4.37 (1.34) -1.44 440Postseason Sportsmanship (Team) 4.38 (1.42) 4.16 (1.55) -1.06 310Preseason GEQ 5.76 (.94) 5.44 (.98) -2.80** 438Postseason GEQ 5.67 (1.03) 5.61 (.96) -.41 309Preseason MLQ 4.28 (.64) 4.18 (.63) -1.25 437Postseason MLQ 4.05 (.79) 4.21 (.75) 1.49 309Preseason ASQ 5.38 (.94) 5.25 (.94) -1.19 437Postseason ASQ 4.75 (1.31) 5.32 (1.19) 3.12** 307
Note. †p< .10 *p <.05 **p<.01 ***p<.001
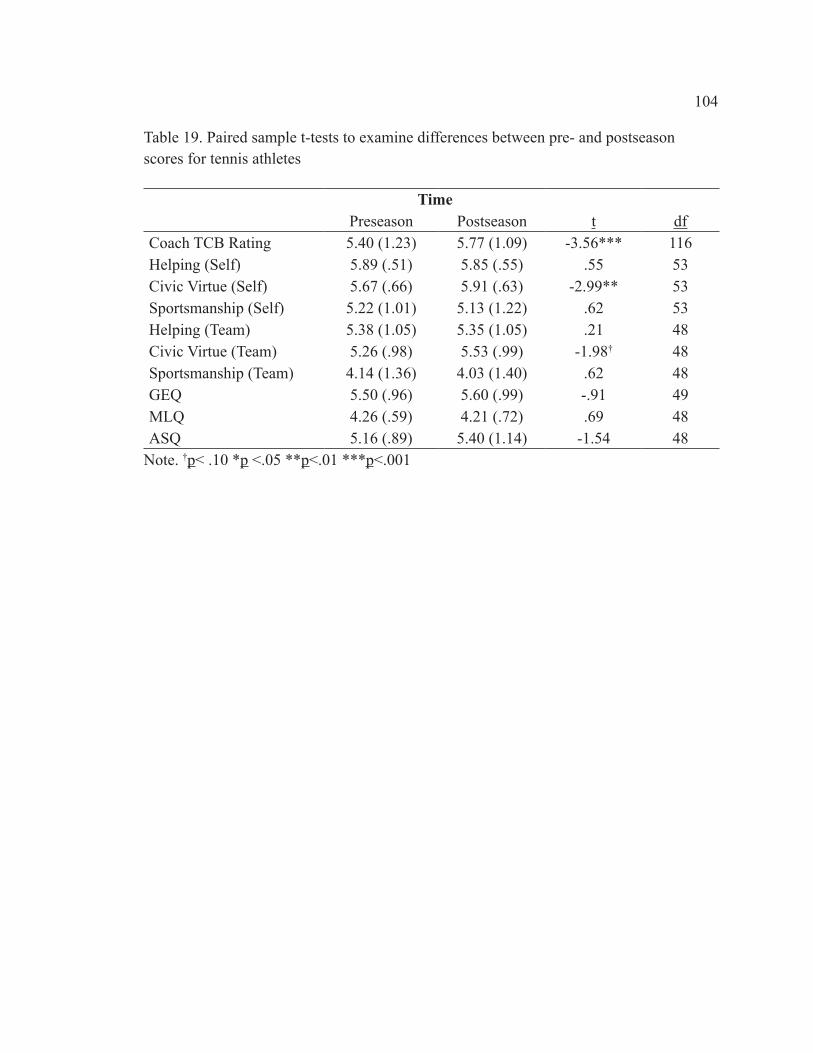
104
Table 19. Paired sample t-tests to examine differences between pre- and postseason scores for tennis athletes
Timet dfPreseason Postseason
Coach TCB Rating 5.40 (1.23) 5.77 (1.09) -3.56*** 116Helping (Self) 5.89 (.51) 5.85 (.55) .55 53Civic Virtue (Self) 5.67 (.66) 5.91 (.63) -2.99** 53Sportsmanship (Self) 5.22 (1.01) 5.13 (1.22) .62 53Helping (Team) 5.38 (1.05) 5.35 (1.05) .21 48Civic Virtue (Team) 5.26 (.98) 5.53 (.99) -1.98† 48Sportsmanship (Team) 4.14 (1.36) 4.03 (1.40) .62 48GEQ 5.50 (.96) 5.60 (.99) -.91 49MLQ 4.26 (.59) 4.21 (.72) .69 48ASQ 5.16 (.89) 5.40 (1.14) -1.54 48
Note. †p< .10 *p <.05 **p<.01 ***p<.001

105
Table 20. Paired sample t-tests to examine differences between pre- and postseason scores for softball athletes
Timet dfPreseason Postseason
Coach TCB Rating 5.61 (1.36) 5.91 (1.21) -4.06*** 371Helping (Self) 5.86 (.59) 5.89 (.62) -.72 216Civic Virtue (Self) 5.56 (.81) 5.65 (.82) -1.46 216Sportsmanship (Self) 5.24 (1.09) 5.37 (1.10) -1.67† 216Helping (Team) 5.65 (.80) 5.57 (.85) 1.55 209Civic Virtue (Team) 5.67 (.84) 5.55 (.96) 1.91† 209Sportsmanship (Team) 4.70 (1.31) 4.35 (1.41) 3.98*** 209GEQ 5.74 (.95) 5.64 (1.05) 1.79† 207MLQ 4.33 (.59) 4.05 (.80) 6.37*** 207ASQ 5.44 (.89) 4.73 (1.32) 7.98*** 206
Note. †p< .10 *p <.05 **p<.01 ***p<.001
106
APPENDIX H
CORRELATIONAL ANALYSES

107
Tabl
e 21
. Cor
rela
tions
bet
wee
n te
am-le
vel v
aria
bles
at p
rese
ason
Varia
ble
12
34
56
78
910
1112
1314
1. C
oach
TC
B R
atin
g1
2. H
elpi
ng (S
elf)
-.015
1
3. C
ivic
Virt
ue (S
elf)
-.035
.759
**1
4. S
ports
man
ship
(Sel
f)-.0
23.2
40.2
181
5. H
elpi
ng (T
eam
).0
66.6
37**
.524
**.1
391
6. C
ivic
Virt
ue (T
eam
).0
82.5
49**
.538
**.0
76.7
67**
1
7. S
ports
man
ship
(Tea
m)
.188
.482
**.4
32**
.264
†.7
33**
.563
**1
8. M
LQ.0
66.1
72.1
75.1
27.4
83**
.556
**.2
92†
1
9. A
SQ.1
15.2
09.1
46-.1
25.4
50**
.565
**.3
23*
.560
**1
10. G
EQ-.0
02.5
05**
.371
*.1
24.7
32**
.617
**.4
77**
.548
**.5
75**
1
11. W
in-lo
ss p
erce
ntag
e.1
75.0
84.0
10.2
13.1
81.1
32.1
28.2
18-.0
42.1
951
12. T
eam
per
form
ance
.164
.111
.022
.196
.205
.180
.197
.230
.075
.263
†.9
40**
1
13. L
ow T
I Per
form
ance
.048
-.020
-.083
.152
.091
.129
.149
.168
.099
.174
.815
**.9
30**
1
14. H
igh
TI p
erfo
rman
ce.3
15*
.309
†.1
88.1
94.3
50*
.257
.272
†.2
70†
.118
.391
*.8
18**
.863
**.6
37**
1
Not
e. † p
< .1
0 *p
<.0
5 **
p<.0
1 **
*p<.
001
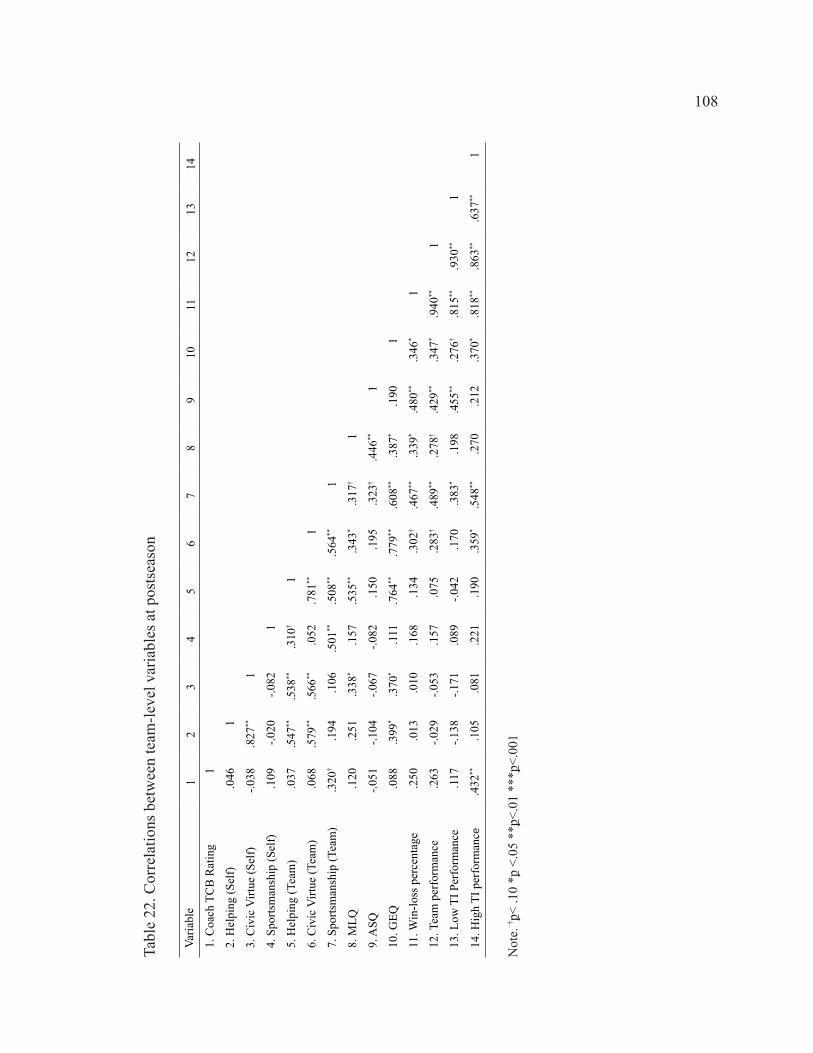
108
Tabl
e 22
. Cor
rela
tions
bet
wee
n te
am-le
vel v
aria
bles
at p
osts
easo
n
Varia
ble
12
34
56
78
910
1112
1314
1. C
oach
TC
B R
atin
g1
2. H
elpi
ng (S
elf)
.046
1
3. C
ivic
Virt
ue (S
elf)
-.038
.827
**1
4. S
ports
man
ship
(Sel
f).1
09-.0
20-.0
821
5. H
elpi
ng (T
eam
).0
37.5
47**
.538
**.3
10†
1
6. C
ivic
Virt
ue (T
eam
).0
68.5
79**
.566
**.0
52.7
81**
1
7. S
ports
man
ship
(Tea
m)
.320
†.1
94.1
06.5
01**
.508
**.5
64**
1
8. M
LQ.1
20.2
51.3
38*
.157
.535
**.3
43*
.317
†1
9. A
SQ-.0
51-.1
04-.0
67-.0
82.1
50.1
95.3
23†
.446
**1
10. G
EQ.0
88.3
99*
.370
*.1
11.7
64**
.779
**.6
08**
.387
*.1
901
11. W
in-lo
ss p
erce
ntag
e.2
50.0
13.0
10.1
68.1
34.3
02†
.467
**.3
39*
.480
**.3
46*
1
12. T
eam
per
form
ance
.263
-.029
-.053
.157
.075
.283
†.4
89**
.278
†.4
29**
.347
*.9
40**
1
13. L
ow T
I Per
form
ance
.117
-.138
-.171
.089
-.042
.170
.383
*.1
98.4
55**
.276
†.8
15**
.930
**1
14. H
igh
TI p
erfo
rman
ce.4
32**
.105
.081
.221
.190
.359
*.5
48**
.270
.212
.370
*.8
18**
.863
**.6
37**
1
Not
e. † p
< .1
0 *p
<.0
5 **
p<.0
1 **
*p<.
001

109
Tabl
e 23
. Cor
rela
tions
bet
wee
n at
hlet
e-le
vel v
aria
bles
at p
rese
ason
Varia
ble
12
34
56
78
910
1112
131.
Coa
ch T
CB
Rat
ing
1
2. H
elpi
ng (S
elf)
.052
1
3. C
ivic
Virt
ue (S
elf)
.080
†.5
16**
1
4. S
ports
man
ship
(Sel
f)-.0
62.1
44**
.016
1
5. H
elpi
ng (T
eam
)-.0
51.4
84**
.264
**.1
32**
1
6. C
ivic
Virt
ue (T
eam
)-.0
04.3
36**
.229
**.1
26**
.700
**1
7. S
ports
man
ship
(Tea
m)
-.053
.175
**.1
10*
.540
**.4
55**
.369
**1
8. M
LQ.0
91†
.279
**.1
38**
.183
**.4
34**
.410
**.3
16**
1
9. A
SQ.1
83**
.205
**.1
88**
.131
**.2
61**
.236
**.1
85**
.390
**1
10. G
EQ.0
08.3
81**
.253
**.0
78.6
75**
.533
**.2
97**
.409
**.2
84**
1
11. I
ndiv
idua
l Per
form
ance
.118
**.0
06.0
76-.0
21.0
05-.0
12.0
22.0
65.1
20*
.028
1
12. L
ow T
I Per
form
ance
.079
†-.0
65.0
59-.0
36-.0
58-.0
86†
-.020
-.030
.121
*-.0
25.9
21**
1
13. H
igh
TI p
erfo
rman
ce.1
24**
.064
.033
-.006
.046
.016
.020
.043
.012
.056
.665
**.2
01**
1
Not
e. † p
< .1
0 *p
<.0
5 **
p<.0
1 **
*p<.
001

110
Tabl
e 24
. Cor
rela
tions
bet
wee
n at
hlet
e-le
vel v
aria
bles
at p
osts
easo
n
Varia
ble
12
34
56
78
910
1112
131.
Coa
ch T
CB
Rat
ing
1
2. H
elpi
ng (S
elf)
.098
†1
3. C
ivic
Virt
ue (S
elf)
.069
.663
**1
4. S
ports
man
ship
(Sel
f).0
85.2
77**
.143
*1
5. H
elpi
ng (T
eam
).0
63.5
11**
.372
**.2
44**
1
6. C
ivic
Virt
ue (T
eam
).0
35.3
73**
.286
**.1
93**
.763
**1
7. S
ports
man
ship
(Tea
m)
.101
.320
**.2
56**
.539
**.5
13**
.415
**1
8. M
LQ.2
26**
.265
**.2
45**
.273
**.4
28**
.349
**.3
66**
1
9. A
SQ.1
38*
.184
**.2
47**
.069
.291
**.2
26**
.247
**.4
40**
1
10. G
EQ.0
80.2
61**
.189
**.1
58*
.536
**.5
32**
.317
**.3
43**
.152
*1
11. I
ndiv
idua
l Per
form
ance
.049
.012
.070
.060
.032
.008
.077
.076
.315
**.0
281
12. L
ow T
I Per
form
ance
.046
.036
.068
.092
.036
.014
.103
†.1
26*
.352
**-.0
25.9
21**
1
13. H
igh
TI p
erfo
rman
ce.0
69.0
17.0
64.0
01.0
15-.0
23.0
02-.0
36.0
75.0
56.6
65**
.201
**1
Not
e. † p
< .1
0 *p
<.0
5 **
p<.0
1 **
*p<.
001

111
APPENDIX I
MULTIPLE REGRESSION ANALYSES
(POSTSEASON VARIABLES)
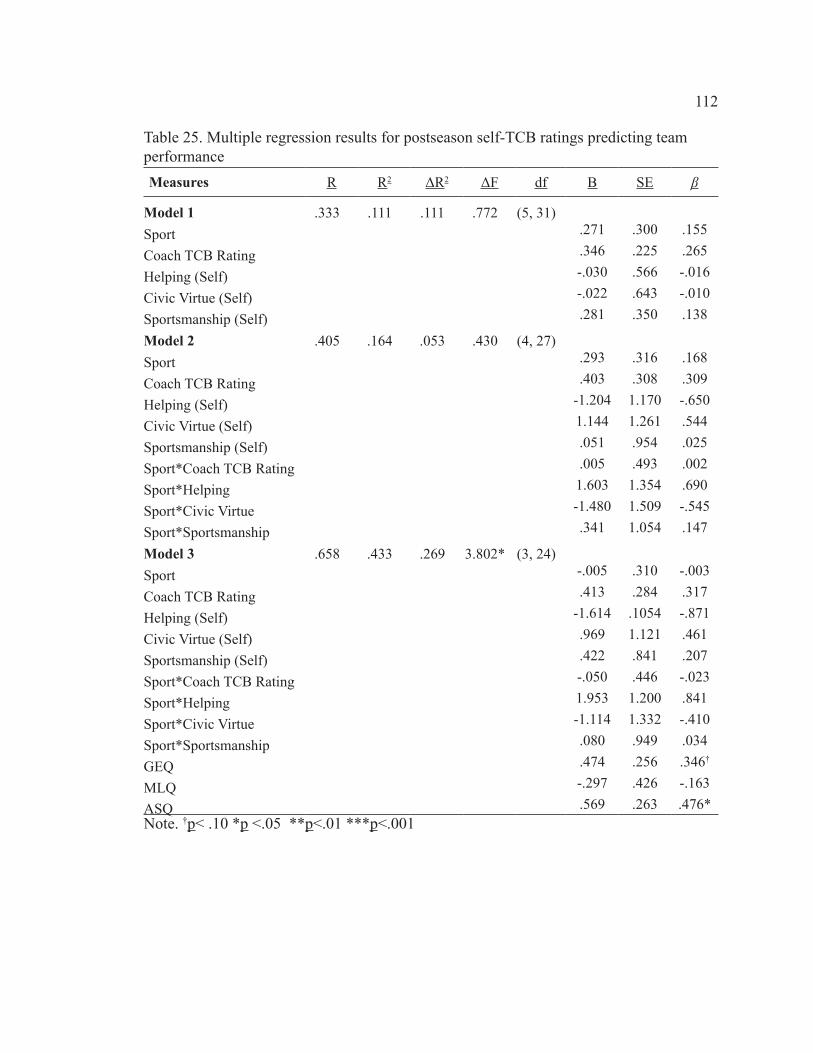
112
Table 25. Multiple regression results for postseason self-TCB ratings predicting team performanceMeasures R R2 ΔR2 ΔF df B SE β
Model 1 .333 .111 .111 .772 (5, 31)Sport .271 .300 .155
Coach TCB Rating .346 .225 .265
Helping (Self) -.030 .566 -.016
Civic Virtue (Self) -.022 .643 -.010
Sportsmanship (Self) .281 .350 .138
Model 2 .405 .164 .053 .430 (4, 27)Sport .293 .316 .168
Coach TCB Rating .403 .308 .309
Helping (Self) -1.204 1.170 -.650
Civic Virtue (Self) 1.144 1.261 .544
Sportsmanship (Self) .051 .954 .025
Sport*Coach TCB Rating .005 .493 .002
Sport*Helping 1.603 1.354 .690
Sport*Civic Virtue -1.480 1.509 -.545
Sport*Sportsmanship .341 1.054 .147
Model 3 .658 .433 .269 3.802* (3, 24)Sport -.005 .310 -.003
Coach TCB Rating .413 .284 .317
Helping (Self) -1.614 .1054 -.871
Civic Virtue (Self) .969 1.121 .461
Sportsmanship (Self) .422 .841 .207
Sport*Coach TCB Rating -.050 .446 -.023
Sport*Helping 1.953 1.200 .841
Sport*Civic Virtue -1.114 1.332 -.410
Sport*Sportsmanship .080 .949 .034
GEQ .474 .256 .346†
MLQ -.297 .426 -.163
ASQ .569 .263 .476*Note. †p< .10 *p <.05 **p<.01 ***p<.001

113
Table 26. Multiple regression results for postseason team-TCB ratings predicting team performance
Measures R R2 ΔR2 ΔF df B SE β
Model 1 .587 .345 .345 3.267* (5, 31)Sport .206 .256 .118
Coach TCB Rating .151 .204 .116
Helping (Team) -.813 .426 -.450†
Civic Virtue (Team) .679 .462 .360
Sportsmanship (Team) .799 .319 .475*
Model 2 .656 .430 .085 1.008 (4, 27)Sport .246 .258 .141
Coach TCB Rating .277 .257 .212
Helping (Team) -.464 .725 -.257
Civic Virtue (Team) .801 .835 .425
Sportsmanship (Team) .041 .589 .025
Sport*Coach TCB Rating -.265 .431 -.122
Sport*Helping -.582 .901 -.245
Sport*Civic Virtue .092 1.011 .035
Sport*Sportsmanship 1.251 .716 .516†
Model 3 .766 .586 .156 3.015* (3, 24)Sport .070 .264 .040
Coach TCB Rating .303 .239 .232
Helping (Team) -1.140 .775 -.631
Civic Virtue (Team) .905 .770 .481
Sportsmanship (Team) -.387 .552 -.230
Sport*Coach TCB Rating -.350 .393 -.161
Sport*Helping -.506 .934 -.213
Sport*Civic Virtue -.206 .934 -.080
Sport*Sportsmanship 1.493 .683 .616*
GEQ .479 .368 .350
MLQ .608 .360 .334
ASQ .183 .218 .153
Note. †p< .10 *p <.05 **p<.01 ***p<.001

114
APPENDIX J
MULTIPLE REGRESSION ANALYSES PREDICTING
LOW AND HIGH TASK INTERDEPENDENCE PERFORMANCE COMPOSITES
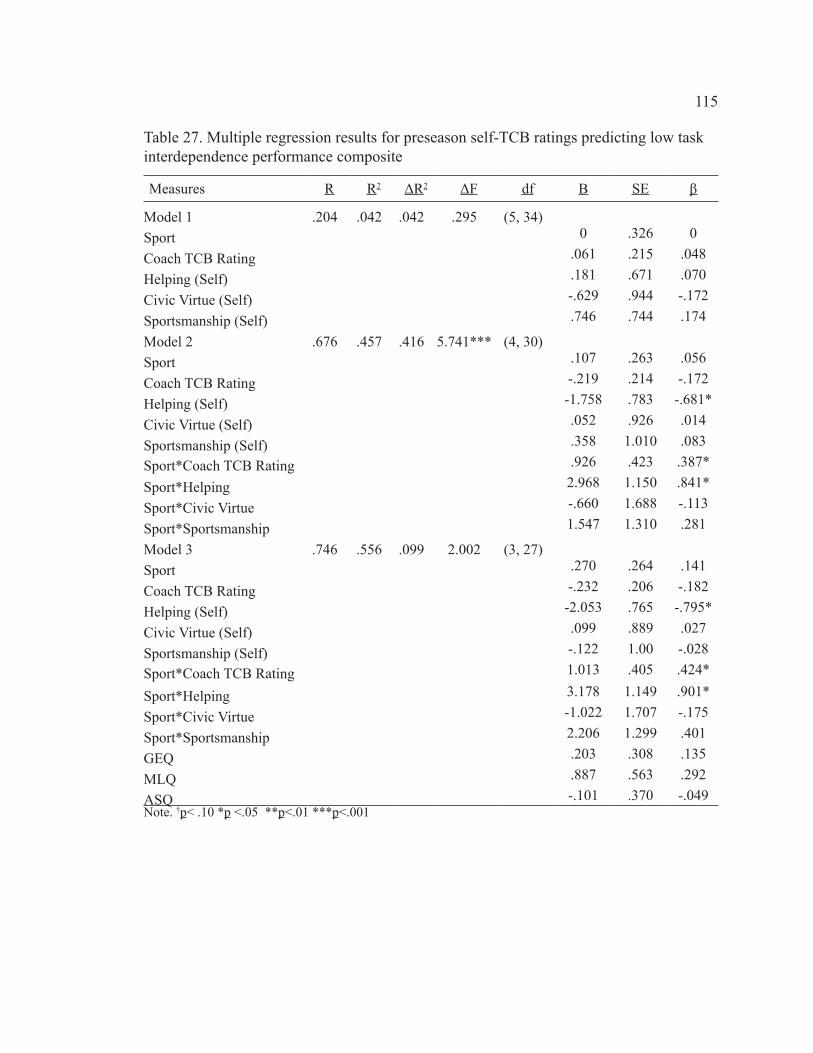
115
Table 27. Multiple regression results for preseason self-TCB ratings predicting low task interdependence performance composite
Measures R R2 ΔR2 ΔF df B SE β
Model 1 .204 .042 .042 .295 (5, 34)Sport 0 .326 0
Coach TCB Rating .061 .215 .048
Helping (Self) .181 .671 .070
Civic Virtue (Self) -.629 .944 -.172
Sportsmanship (Self) .746 .744 .174
Model 2 .676 .457 .416 5.741*** (4, 30)Sport .107 .263 .056
Coach TCB Rating -.219 .214 -.172
Helping (Self) -1.758 .783 -.681*
Civic Virtue (Self) .052 .926 .014
Sportsmanship (Self) .358 1.010 .083
Sport*Coach TCB Rating .926 .423 .387*
Sport*Helping 2.968 1.150 .841*
Sport*Civic Virtue -.660 1.688 -.113
Sport*Sportsmanship 1.547 1.310 .281
Model 3 .746 .556 .099 2.002 (3, 27)Sport .270 .264 .141
Coach TCB Rating -.232 .206 -.182
Helping (Self) -2.053 .765 -.795*
Civic Virtue (Self) .099 .889 .027
Sportsmanship (Self) -.122 1.00 -.028
Sport*Coach TCB Rating 1.013 .405 .424*
Sport*Helping 3.178 1.149 .901*
Sport*Civic Virtue -1.022 1.707 -.175
Sport*Sportsmanship 2.206 1.299 .401
GEQ .203 .308 .135
MLQ .887 .563 .292
ASQ -.101 .370 -.049Note. †p< .10 *p <.05 **p<.01 ***p<.001
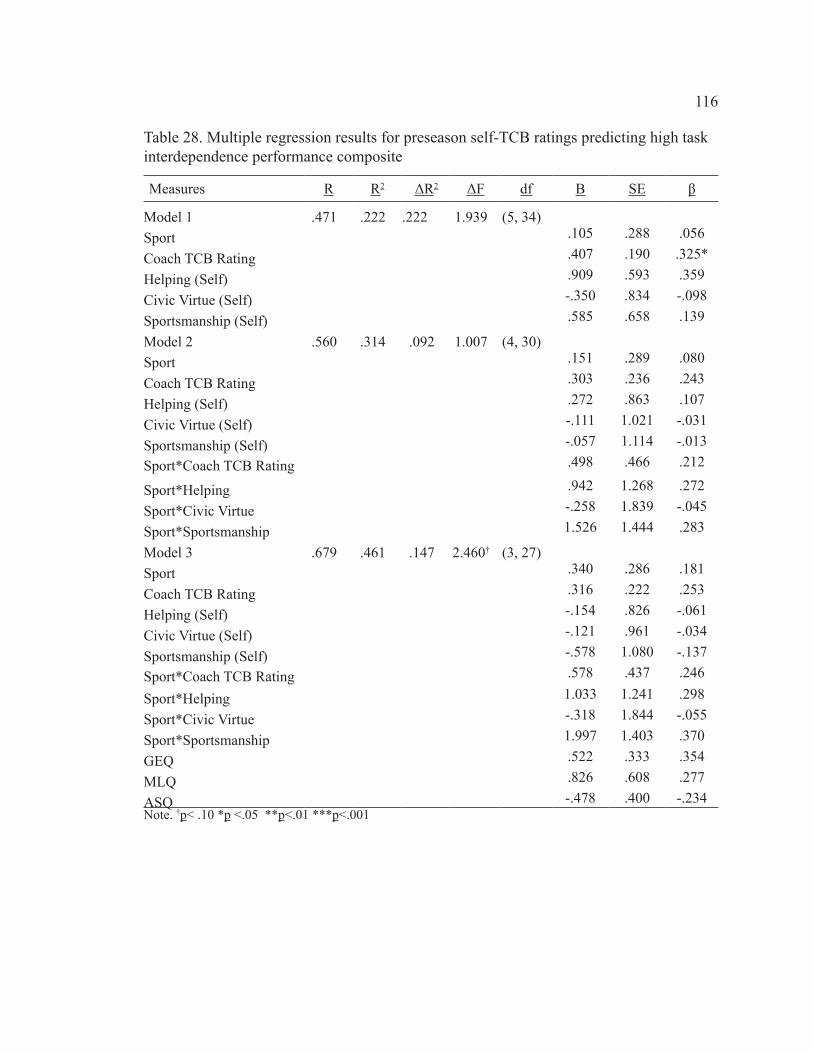
116
Table 28. Multiple regression results for preseason self-TCB ratings predicting high task interdependence performance composite
Measures R R2 ΔR2 ΔF df B SE β
Model 1 .471 .222 .222 1.939 (5, 34)Sport .105 .288 .056
Coach TCB Rating .407 .190 .325*
Helping (Self) .909 .593 .359
Civic Virtue (Self) -.350 .834 -.098
Sportsmanship (Self) .585 .658 .139
Model 2 .560 .314 .092 1.007 (4, 30)Sport .151 .289 .080
Coach TCB Rating .303 .236 .243
Helping (Self) .272 .863 .107
Civic Virtue (Self) -.111 1.021 -.031
Sportsmanship (Self) -.057 1.114 -.013
Sport*Coach TCB Rating .498 .466 .212
Sport*Helping .942 1.268 .272
Sport*Civic Virtue -.258 1.839 -.045
Sport*Sportsmanship 1.526 1.444 .283
Model 3 .679 .461 .147 2.460† (3, 27)Sport .340 .286 .181
Coach TCB Rating .316 .222 .253
Helping (Self) -.154 .826 -.061
Civic Virtue (Self) -.121 .961 -.034
Sportsmanship (Self) -.578 1.080 -.137
Sport*Coach TCB Rating .578 .437 .246
Sport*Helping 1.033 1.241 .298
Sport*Civic Virtue -.318 1.844 -.055
Sport*Sportsmanship 1.997 1.403 .370
GEQ .522 .333 .354
MLQ .826 .608 .277
ASQ -.478 .400 -.234Note. †p< .10 *p <.05 **p<.01 ***p<.001

117
APPENDIX K
MULTILEVEL REGRESSION ANALYSES

118
Table 29. Multilevel regression analyses for all athletes with postseason self-TCB pre-dicting individual performance
Individual Performance (DV)b SE
Intercept .022 .138Sport -.025 .161Coach TCB Rating .019 .050Helping (Self) -.014 .164Civic Virtue (Self) .004 .185Sportsmanship (Self) .103 .133Sport x Helping -.083 .187Sport x Civic Virtue .077 .205Sport x Sportsmanship -.028 .148MLQ -.139† .082ASQ .249*** .046
Note. †p< .10 *p <.05 **p<.01 ***p<.001

119
Table 30. Multilevel regression analyses for all athletes with postseason team-TCB pre-dicting individual performance
Individual Performance (DV)b SE
Intercept .033 .127Sport -.037 .147Coach TCB Rating .040 .049Helping (Team) -.408 .255Civic Virtue (Team) .435† .252Sportsmanship (Team) .363** .133Sport x Helping .484† .272Sport x Civic Virtue -.601* .269Sport x Sportsmanship -.381* .150MLQ -.052 .080ASQ .225*** .043
Note. †p< .10 *p <.05 **p<.01 ***p<.001
Table 31. Multilevel regression analyses with postseason team-TCB predicting individual performance
Individual PerformanceSoftball Tennis
b SE b SEIntercept -.001 .067 -.013 .184Coach TCB Rating .047 .054 -.001 .100Helping (Team) .070 .098 -.114 .211Civic Virtue (Team) -.161 .097 .238 .216Sportsmanship (Team) -.021 .072 .199† .107MLQ -.046 .088 -.129 .155ASQ .223*** .047 .217* .095
Note. †p< .10 *p <.05 **p<.01 ***p<.001
120
REFERENCE LIST
Aoyagi, M. W., Cox, R. H., & McGuire, R. T. (2008). Organizational citizenship behavior in sports: Relationships with leadership, team cohesion, and athlete satisfaction. Jour-nal of Applied Sport Psychology, 20, 25–41.
Bachrach, D. G., Powell, B. C., Bendoly, E., & Richey, R. G. (2006). Organizational citizenship behavior and performance evaluations: Exploring the impact of task inter-dependence. Journal of Applied Psychology, 91, 193–201.
Bachrach, D. G., Powell, B. C., Collins, B. J., & Richey, R. G. (2006). Effects of task interdependence on the relationship between helping behavior and group performance. Journal of Applied Psychology, 91, 1396–1405.
Barnard, C. I. (1938). The functions of the executive. Cambridge, Mass.: Harvard Univer-sity Press.
Bateman, T. S., & Organ, D. W. (1983). Job satisfaction and the good soldier: The rela-tionship between affect and employee “citizenship.” Academy of Management Journal, 26, 587–595.
Blanchard, C., Poon, P., Rodgers, W., & Pinel, B. (2000). Group environment question-naire and its applicability in an exercise setting. Small Group Research, 31, 210–224.
Blau, P. (1964). Exchange and power in social life. New York: Wiley. Bommer, W. H., Dierdorff, E. C., & Rubin, R. S. (2007). Does prevalence mitigate rel-
evance? The moderating effect of group-level OCB on employee performance. Acad-emy of Management Journal, 50, 1481–1494.
Borman, W. C., & Motowidlo, S. J. (1997). Task performance and contextual perfor-mance: The meaning for personnel selection research. Human Performance, 10, 99–109.
Borman, W. C., White, L. A., & Dorsey, D. W. (1995). Effects of ratee task performance and interpersonal factors on supervisor and peer performance ratings. Journal of Ap-plied Psychology, 80, 168–177.

121
Brass, D. J. (1985). Technology and the structuring of jobs: Employee, satisfaction, per-formance, and influence. Organizational Behavior and Human Decision Processes, 35, 216–240.
Campion, M. A., Medsker, G. J., & Higgs, A. C. (1993). Relations between work group characteristics and effectiveness: Implications for designing effective work groups. Personnel Psychology, 46, 823–847.
Campion, M. A., Papper, E. M., & Medsker, G. J. (1996). Relations between work team-characteristics and effectiveness: A replication and extension. Personnel Psychology, 49, 429–452.
Carless, S. A., & De Paola, C. D. (2000). The measurement of cohesion in work teams. Small Group Research, 31, 71–88.
Carron, A. V. (1982). Cohesiveness in sport groups: Interpretations and considerations. Journal of Sport Psychology, 4, 123–138.
Carron, A. V., Brawley, L. R., & Widmeyer, W. N. (1998). The measurement of cohesive-ness in sport groups. In J. L. Duda (Ed.), Advances in Sport and Psychology Measure-ment (pp. 213–226). Morgantown, WV: Fitness Information Technology.
Carron, A. V., Brawley, L. R., & Widmeyer, W. N. (2002). The Group Environment Ques-tionnaire test manual. Morgantown, WV: Fitness Information Technology.
Chen, C. V., Tang, Y., & Wang, S. (2009). Interdependence and organizational citizenship behavior: Exploring the mediating effect of group cohesion in multilevel analysis. The Journal of Psychology, 143, 625–640.
Ehrhart, M. G., Bliese, P. D., & Thomas, J. L. (2006). Unit-level OCB and unit effective-ness: Examining the incremental effect of helping behavior. Human Performance, 19, 159–173.
Estabrooks, P. A., & Carron, A. V. (2000). The physical activity group environmentques-tionnaire: An instrument for the assessment of cohesion in exercise classes. Group Dynamics: Theory, Research, and Practice, 4, 230–243.
Eys, M. A., Carron, A. V., Bray, S. R., & Brawley, L. R. (2007). Item wording and in-ternal consistency of a measure of cohesion: The group environment questionnaire. Journal of Sport & Exercise Psychology, 29, 395–402.
122
George, J. M., & Brief, A. P. (1992). Feeling good-doing good: A Conceptual analysis of the mood at work-organizational spontaneity relationship. Psychological Bulletin, 112, 310–329.
Gouldner, A. W. (1960). The norm of reciprocity. American Sociological Review, 25, 165–167.
Gross, N. (1954). Primary functions of the small group. American Journal of Sociology, 60, 24–29.
Isen, A. M., & Baron, R. A. (1991). Positive affect as a factor in organizational behavior. In L. L. Cummings & B. Staw (Eds.), Research in organizational behavior (Vol. 13, pp. 1–53). Greenwich, CT: JAI Press.
Johnson, D. W., & Johnson, R. T. (1989). Cooperation and competition: Theory and re-search. Edina, MN: Interaction.
Jöreskog, K.G. & Sörbom, D. (2006). LISREL 8.80 for Windows [Computer Software]. Lincolnwood, IL: Scientific Software International, Inc.
Katz, D., & Kahn, R. L. (1966, 1978). The social psychology of organizations. New York: Wiley.
Keller, R. T. (2006). Transformational leadership, initiating structure, and substitutes for leadership: A longitudinal study of research and development project team perfor-mance. Journal of Applied Social Psychology, 91, 202–210.
Kidwell, R. E., Jr., Mossholder, K. W., & Bennett, N. (1997). Cohesiveness and organiza-tional citizenship behavior: A multilevel analysis using work groups and individuals. Journal of Management, 23, 775–793.
Kiggundu, M. N. (1983). Task interdependence and job design: Test of a theory. Organi-zational and Human Performance, 31, 145–172.
Lefkowitz, J. (2000). The role of interpersonal affective regard in supervisory perfor-mance ratings: A literature review and proposed causal model. Journal of Occupation-al and Organizational Psychology, 7, 67–85.
McCann, J. E., & Ferry, D. L. (1979). An approach for assessing and managing inter-unit interdependence. Academy of Management Review, 4, 113–119.
Mehra, A., Smith, B. R., Dixon, A. L., & Robertson, B. (2006). Distributed leadership in teams: The network of leadership perceptions and team performance. Leadership Quarterly, 17, 232–245.

123
Mitchell, T. R., & Silver, W. S. (1990). Individual and group goals when workers are in-terdependent: Effects on task strategies and performance. Journal of Applied Psychol-ogy, 75, 185–193.
Naumann, S. E., & Bennett, N. (2002). The effects of procedural justice climate on work group performance. Small Group Research, 33, 361–377.
Nielsen, T. M., Hrivnak, G. A., Shaw, M. (2009). Organizational citizenship behavior and performance: A meta-analysis of group-level research. Small Group Research, 40, 555–577.
Organ, D. W. (1988). Organizational citizenship behavior: The Good Soldier Syndrome.Lexington, MA: Lexington Books.
Organ, D. W., Podsakoff, P. M., & MacKenzie, S. B. (2006). Organizational citizenship behavior: Its nature, antecedents, and consequences. Beverly Hills, CA: Sage.
Organ, D. W., & Ryan, K. (1995). A meta-analytic review of attitudinal and dispositional predictors of organizational citizenship behavior. Personnel Psychology, 48, 775–802.
Pearce, J. L., & Gregersen, H. B. (1991). Task interdependence and extrarole behavior: A test of the mediating effects of felt responsibility. Journal of Applied Psychology, 76, 838–844.
Podsakoff, P. M., Ahearne, M., & MacKenzie, S. B. (1997). Organizational citizenship behavior and the quantity and quality of work group performance. Journal of Applied Psychology, 82, 262–270.
Podsakoff, P. M., & MacKenzie, S. B. (1994). Organizational citizenship behavior and sales unit effectiveness. Journal of Marketing Research, 31, 351–363.
Podsakoff, P. M., MacKenzie, S. B., Paine, J. B., & Bachrach, D. G. (2000). Organiza-tional citizenship behaviors: A critical review of the theoretical and empirical literature and suggestions for future research. Journal of Management, 26, 513–563.
Podsakoff, N. P., Whiting, S. W., Podsakoff, P. M., & Blume, B. D. (2009). Individual- and organizational-level consequences of organizational citizenship behaviors: A meta-analysis. Journal of Applied Psychology, 94, 122–141.
SAS Institute Inc., SAS 9.1.3, Cary, NC: SAS Institute Inc., 2002.

124
Schaubroeck, J., Lam, S. S. K., & Cha, S. E. (2007). Embracing transformational leader-ship: Team values and the impact of leader behavior on team performance. Journal of Applied Psychology, 92, 1020–1030.
Schriescheim, J. F. (1980). The social context of leader-subordinate relations: An investi-gation of the effects of group cohesion. Journal of Applied Psychology, 65, 183–194.
Shore, L. M., Barksdale, K., & Shore, T. H. (1995). Managerial perceptions of employee commitment to the organization. Academy of Management Journal, 38, 1593–1615.
Smith, C. A., Organ, D. W., & Near, J. P. (1983). Organizational citizenship behavior: Its nature and antecedents. Journal of Applied Psychology, 68, 653–663.
Stewart, G. L. (2006). A meta-analytic review of relationships between team design fea-tures and team performance. Journal of Management, 32, 29–54.
SPSS Inc., PASW Statistics 18.0. IBM Corporation, 2009.
Stokes, J. P. (1983). Toward an understanding of cohesion in personal change group. International Journal of Group Psychotherapy, 33, 449–467.
Thompson, J. D. (1967). Organizations in action. New York: McGraw-Hill.
Turner, J. C., Hogg, M. A., Oakes, P. J., Reicher, S. D., & Wetherell, M. S. (1987). Redis-covering the social group: A self-categorization theory. New York: Blackwell.
Van der Vegt, G. S., & Janssen, O. (2003). Joint impact of interdependence and group diversity on innovation. Journal of Management, 29, 729–751.
Weinberg, R., & McDermott, M. (2002). A comparative analysis of sport and business organizations: Factors perceived critical for organizational success. Journal of Applied Sport Psychology, 14, 282–298.
Zaccaro, S. J., Heinen, B., & Shuffler, M. (2009). Team leadership and team effective-ness. In S. Eduardo, G. F. Goodwin, C. S. Burke (Eds.), Team effectiveness in complex organizations: cross-disciplinary perspectives and approaches (pp. 83–88). New York, NY: Psychology Press.
125
VITA
Rachael Martínez was born and raised in Cincinnati, OH. Before attending Loyola
University Chicago for her Ph.D. in Applied Social Psychology, she attended the Univer-
sity of Michigan, Ann Arbor, where she earned a Bachelor of Arts in Psychology in 2008.
In 2010, Rachael received a Master of Arts in Social Psychology from Loyola University
Chicago.
While at Loyola, Rachael was awarded a Graduate Research Assistantship from
2008 to 2012. Rachael also won the James E. Johnson Graduate-Student Award for
Teaching Excellence in Psychology in 2012.
Currently, Rachael is working as a Social Science Analyst at the US Department
of Veterans Affairs in Hines, Illinois, where she provides statistical analysis expertise and
qualitative data coding for research projects.