Embed Size (px)
Citation preview

Quarterly Journal of the Royal Meteorological Society Q. J. R. Meteorol. Soc. (2014) DOI:10.1002/qj.2416
Impact of sub-pixel rainfall variability on spaceborne precipitationestimation: evaluating the TRMM 2A25 product
Pierre-Emmanuel Kirstetter,a,b,c Y. Hong,a,c* J. J. Gourley,b M. Schwaller,d
W. Petersene and Qing Caoc
aSchool of Civil Engineering and Environmental Sciences, University of Oklahoma, OK, USAbNOAA/National Severe Storms Laboratory, Norman, OK, USA
cAdvanced Radar Research Center, National Weather Center, Norman, OK, USAdNASA Goddard Space Flight Center, Greenbelt, MD, USA
eNASA Wallops Flight Facility, Wallops Island, VA, USA
*Correspondence to: Y. Hong, National Weather Center Advanced Radar Research Center 4610, 120 David L. Boren Blvd, Norman,OK 73072-7303, USA. E-mail: [email protected]
Rain intensity spectra as seen by space sensors feed numerous applications at global scalesranging from water budget studies to forecasting natural hazards related to extreme rainfallevents. Rainfall variability at scales finer than what is resolved by current space sensors affectstheir detection capabilities, the characterization of rainfall types, as well as the quantificationof rainfall rates. A high-resolution surface rainfall product is used to evaluate the impactof rainfall variability within the field of view (FOV) of the Tropical Rainfall MeasurementMission (TRMM) Precipitation Radar (PR) quantitative precipitation estimation (QPE) atground. The primary contribution of this study is to assess the impact of rainfall variabilityin terms of occurrence, types and rate at PR’s pixel resolution on PR precipitation detection,classification and quantification. Several aspects of PR errors are revealed and quantifiedincluding sensitivity to non-uniform beam filling. While the error structure of the PR iscomplicated because of the interaction of these factors, simple error models are developed todescribe the PR performances. The methodology and framework developed herein appliesmore generally to rainfall rate estimates from other sensors on board low Earth-orbitingsatellites such as microwave imagers and dual-frequency radars such as with the GlobalPrecipitation Measurement (GPM) mission.
Key Words: satellite-based rain estimation; radar; QPE; conditional bias; random error
Received 23 May 2013; Revised 19 March 2014; Accepted 1 July 2014; Published online in Wiley Online Library
1. Introduction
In the context of changing climate, rainfall occurrence, types andintensity are becoming widely evaluated because of their impacton the energy budget and the hydrological cycle. At the globalscale, only meteorological satellites provide remote-sensingobservations of rainfall, essential for hydrologic and climaticapplications, which range from climatic analysis (Stephens andKummerow, 2007), budgeting water resources over land (Grimesand Diop, 2003; Lebel et al., 2009), real-time flood forecasting(Hong et al., 2007) to data assimilation and evaluation ofregional and global atmospheric model simulations (Stephensand Kummerow, 2007). Rainfall fields have variability across avariety of spatial and temporal scales. Regarding measurementfrom remote-sensing platforms, it is important to quantitativelyevaluate the following characteristics of the rainfall rate distribu-tion at the instruments’ pixel scale: occurrence and proportion ofpositive values, mean value, variability and types (Figure 1). Thespatial heterogeneity of the rain fields within a single instrumental
field of view (e.g. beam filling, coexistence of convective andstratiform precipitation, and vertical heterogeneity of rainfall)interact with the sensitivity of the instrument itself, the indirectnature of the measurement, the spatial resolution and theretrieval algorithm used. As a consequence, satellite surface rainrate retrievals are not a simple convolution of the fine-scalerain rate distribution within the field of view of the instrument.Characterizing the error structure of satellite rainfall productsis recognized as a major issue for the usefulness of the estimates(Yang et al., 2006; Turk et al., 2008; Sapiano and Arkin, 2009;Wolff and Fisher, 2009). We address these questions by evaluatinghow satellite surface rainfall characteristics, i.e. occurrence, typeand rate, differ from a reference rainfall within the field of view.These questions address the detection, classification and quan-tification capabilities of such a radar sensor on board a satellite.In fact, rainfall variability at scales finer than the typical field ofview of the sensors is recognized as a major source of uncertaintyfor rainfall estimation from space (e.g. Iguchi et al., 2009). As anexample regarding rainfall detection, Lin and Hou (2012) showed
c© 2014 Royal Meteorological Society

P.-E. Kirstetter et al.
Figure 1. (a) Overpass of TRMM-PR over the conterminous U.S. at 0725 UTC on 11 April 2011. NMQ/Q2 instantaneous precipitation rates are shown; (b) zoomedarea showing the variability and spatial distribution of precipitation within TRMM-PR footprints figured with circles; (c) schematic showing the variability can beaddressed with the higher horizontal resolution of NMQ.
how the varying detection capabilities of space-based active andpassive sensors can impact the contribution of different rainintensity categories to the total rain incidence and rain volume.
We focus primarily on the Tropical Rainfall MeasurementMission (TRMM) Precipitation Radar (PR) quantitativeprecipitation estimation (QPE) at ground. Iguchi et al. (2009)mentioned how difficult the non-uniform beam-filling issue isto handle in converting the PR signal into a rain rate. Whilethe methodology presented herein would apply to all satelliteprecipitation products, the TRMM PR is often considered as acalibrator for other space-based passive microwave sensors suchas the TRMM Microwave Imager (e.g. Yang et al., 2006; Wolffand Fisher, 2008, 2009). The combination of these sensors ina constellation collectively enables the creation of global-scaleprecipitation products (Ushio et al., 2006; Ebert et al., 2007;Huffman et al., 2007) and constitutes the backbone of the futureGlobal Precipitation Measurement (GPM) mission. A number ofstudies have investigated the quality of PR estimates in variousregions of the world (e.g. Adeyewa and Nakamura, 2003; Lin andHou, 2008; Michaelides, 2008; Wolff and Fisher, 2008, 2009).Over the USA, Amitai et al. (2009, 2012) have compared thePR with the National Oceanic and Atmospheric Administra-tion/National Severe Storms Laboratory (NOAA/NSSL) groundradar-based National Mosaic and QPE system (NMQ/Q2), whichoffers a robust set of resources for validation.
In this study, the PR QPE product is assessed over thesouthern conterminous USA (CONUS) with respect to thehigh-resolution, independent NMQ/Q2 rainfall dataset (Zhanget al., 2011a) following the methodology and framework forevaluating PR 2A25 products described in Kirstetter et al. (2012,2013). This study is part of an effort to perform a systematicand comprehensive evaluation of PR errors by matching quasi-instantaneous data from Q2 to the∼5 km pixel measurement scaleof PR in order to minimize uncertainties caused by resampling.Here, the finer spatial resolution of NMQ (∼1 km) is specificallyused to characterize the rainfall sensed by the PR in termsof occurrence, type and rate. By doing so, we will also assessthe impact of the small-scale variability of rainfall on the PRestimates. We evaluate the distribution or spectrum of rainfalloccurrence, typology and quantity within the PR field of view(FOV) and relate these characteristics to PR rain estimates. Thisstudy used seven months (March–October 2011) of satellite
overpasses over the lower CONUS (up to latitude 36◦N). Despitethe seemingly short period for evaluation, the use of gridded Q2data for reference provided a large sample size totalling 1 625 942non-zero PR–reference pairs.
The PR data and steps required to refine the Q2 ground-basedrainfall to arrive at the reference rainfall used for comparisonsare presented in section 2. Section 3 assesses the ability of PR rainretrievals to detect rainfall. Section 4 details the impact of thebeam filling and rain typology on the PR rainfall classification.Section 5 addresses the aspect of rainfall quantification. The articleis closed with concluding remarks in section 6.
2. Data sources
2.1. Q2-based reference rainfall and derived products
All rain fields observed coincidentally by TRMM overpassesand the Next-Generation Weather Doppler Radar (NEXRAD)radar network from March to October 2011 are collected. TheNMQ-Q2 products closest in time to the TRMM satellite localoverpass schedule time are used. The NOAA/NSSL NationalMosaic and Quantitative Precipitation Estimation system (NMQ:http://nmq.ou.edu; Zhang et al., 2011a) is a set of experimentalradar products including high-resolution (0.01◦, 5 min) instan-taneous rainfall-rate mosaics available over the CONUS. TheNMQ system gathers information from all ground-based radarscomprising the Weather Surveillance Radar–1988 Doppler(WSR-88D) network, mosaics reflectivity data onto a commonthree-dimensional (3D) grid, and estimates surface rainfall accu-mulations and types to deliver accurate ground-based estimatesof rainfall (Zhang et al., 2005; Vasiloff et al., 2007). At hourlytime steps, Q2 adjusts radar estimates with automated rain-gaugenetworks using a spatially variable bias multiplicative factor. Aradar quality index (RQI) is produced to represent the radar QPEuncertainty associated with reflectivity changes with height andnear the melting layer (Zhang et al., 2011b). One should notethat it is not possible to ‘validate’ the PR estimates in a strictsense because independent rainfall estimates with no uncertaintydo not exist. A number of complicating factors impact the radarQPE uncertainty, such as measurement errors, non-precipitationechoes, uncertainties in Z –R relationships, and variability in the
c© 2014 Royal Meteorological Society Q. J. R. Meteorol. Soc. (2014)
Impact of Sub-Pixel Rainfall Variability on TRMM 2A25
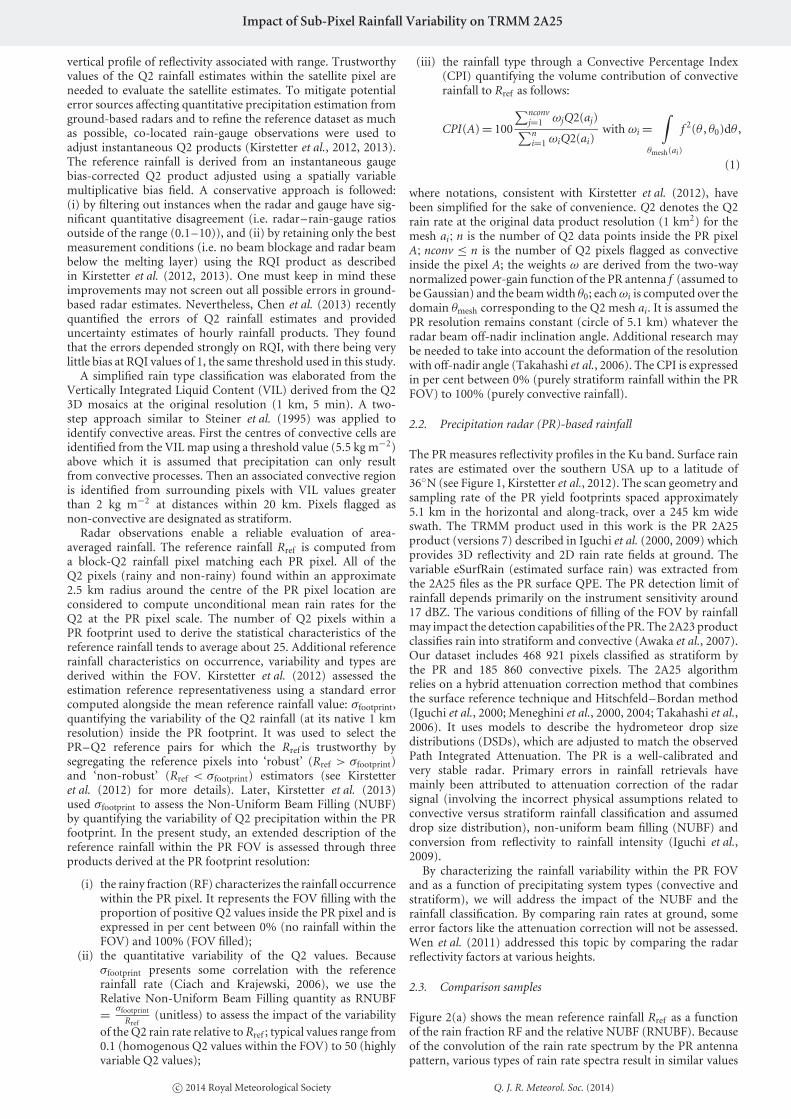
vertical profile of reflectivity associated with range. Trustworthyvalues of the Q2 rainfall estimates within the satellite pixel areneeded to evaluate the satellite estimates. To mitigate potentialerror sources affecting quantitative precipitation estimation fromground-based radars and to refine the reference dataset as muchas possible, co-located rain-gauge observations were used toadjust instantaneous Q2 products (Kirstetter et al., 2012, 2013).The reference rainfall is derived from an instantaneous gaugebias-corrected Q2 product adjusted using a spatially variablemultiplicative bias field. A conservative approach is followed:(i) by filtering out instances when the radar and gauge have sig-nificant quantitative disagreement (i.e. radar–rain-gauge ratiosoutside of the range (0.1–10)), and (ii) by retaining only the bestmeasurement conditions (i.e. no beam blockage and radar beambelow the melting layer) using the RQI product as describedin Kirstetter et al. (2012, 2013). One must keep in mind theseimprovements may not screen out all possible errors in ground-based radar estimates. Nevertheless, Chen et al. (2013) recentlyquantified the errors of Q2 rainfall estimates and provideduncertainty estimates of hourly rainfall products. They foundthat the errors depended strongly on RQI, with there being verylittle bias at RQI values of 1, the same threshold used in this study.
A simplified rain type classification was elaborated from theVertically Integrated Liquid Content (VIL) derived from the Q23D mosaics at the original resolution (1 km, 5 min). A two-step approach similar to Steiner et al. (1995) was applied toidentify convective areas. First the centres of convective cells areidentified from the VIL map using a threshold value (5.5 kg m−2)above which it is assumed that precipitation can only resultfrom convective processes. Then an associated convective regionis identified from surrounding pixels with VIL values greaterthan 2 kg m−2 at distances within 20 km. Pixels flagged asnon-convective are designated as stratiform.
Radar observations enable a reliable evaluation of area-averaged rainfall. The reference rainfall Rref is computed froma block-Q2 rainfall pixel matching each PR pixel. All of theQ2 pixels (rainy and non-rainy) found within an approximate2.5 km radius around the centre of the PR pixel location areconsidered to compute unconditional mean rain rates for theQ2 at the PR pixel scale. The number of Q2 pixels within aPR footprint used to derive the statistical characteristics of thereference rainfall tends to average about 25. Additional referencerainfall characteristics on occurrence, variability and types arederived within the FOV. Kirstetter et al. (2012) assessed theestimation reference representativeness using a standard errorcomputed alongside the mean reference rainfall value: σfootprint,quantifying the variability of the Q2 rainfall (at its native 1 kmresolution) inside the PR footprint. It was used to select thePR–Q2 reference pairs for which the Rref is trustworthy bysegregating the reference pixels into ‘robust’ (Rref > σfootprint)and ‘non-robust’ (Rref < σfootprint) estimators (see Kirstetteret al. (2012) for more details). Later, Kirstetter et al. (2013)used σfootprint to assess the Non-Uniform Beam Filling (NUBF)by quantifying the variability of Q2 precipitation within the PRfootprint. In the present study, an extended description of thereference rainfall within the PR FOV is assessed through threeproducts derived at the PR footprint resolution:
(i) the rainy fraction (RF) characterizes the rainfall occurrencewithin the PR pixel. It represents the FOV filling with theproportion of positive Q2 values inside the PR pixel and isexpressed in per cent between 0% (no rainfall within theFOV) and 100% (FOV filled);
(ii) the quantitative variability of the Q2 values. Becauseσfootprint presents some correlation with the referencerainfall rate (Ciach and Krajewski, 2006), we use theRelative Non-Uniform Beam Filling quantity as RNUBF= σfootprint
Rref(unitless) to assess the impact of the variability
of the Q2 rain rate relative to Rref ; typical values range from0.1 (homogenous Q2 values within the FOV) to 50 (highlyvariable Q2 values);
(iii) the rainfall type through a Convective Percentage Index(CPI) quantifying the volume contribution of convectiverainfall to Rref as follows:
CPI(A) = 100
∑nconvj=1 ωjQ2(aj)∑ni=1 ωiQ2(ai)
with ωi =∫
θmesh(ai)
f 2(θ , θ0)dθ ,
(1)
where notations, consistent with Kirstetter et al. (2012), havebeen simplified for the sake of convenience. Q2 denotes the Q2rain rate at the original data product resolution (1 km2) for themesh ai; n is the number of Q2 data points inside the PR pixelA; nconv ≤ n is the number of Q2 pixels flagged as convectiveinside the pixel A; the weights ω are derived from the two-waynormalized power-gain function of the PR antenna f (assumed tobe Gaussian) and the beam width θ0; each ωi is computed over thedomain θmesh corresponding to the Q2 mesh ai. It is assumed thePR resolution remains constant (circle of 5.1 km) whatever theradar beam off-nadir inclination angle. Additional research maybe needed to take into account the deformation of the resolutionwith off-nadir angle (Takahashi et al., 2006). The CPI is expressedin per cent between 0% (purely stratiform rainfall within the PRFOV) to 100% (purely convective rainfall).
2.2. Precipitation radar (PR)-based rainfall
The PR measures reflectivity profiles in the Ku band. Surface rainrates are estimated over the southern USA up to a latitude of36◦N (see Figure 1, Kirstetter et al., 2012). The scan geometry andsampling rate of the PR yield footprints spaced approximately5.1 km in the horizontal and along-track, over a 245 km wideswath. The TRMM product used in this work is the PR 2A25product (versions 7) described in Iguchi et al. (2000, 2009) whichprovides 3D reflectivity and 2D rain rate fields at ground. Thevariable eSurfRain (estimated surface rain) was extracted fromthe 2A25 files as the PR surface QPE. The PR detection limit ofrainfall depends primarily on the instrument sensitivity around17 dBZ. The various conditions of filling of the FOV by rainfallmay impact the detection capabilities of the PR. The 2A23 productclassifies rain into stratiform and convective (Awaka et al., 2007).Our dataset includes 468 921 pixels classified as stratiform bythe PR and 185 860 convective pixels. The 2A25 algorithmrelies on a hybrid attenuation correction method that combinesthe surface reference technique and Hitschfeld–Bordan method(Iguchi et al., 2000; Meneghini et al., 2000, 2004; Takahashi et al.,2006). It uses models to describe the hydrometeor drop sizedistributions (DSDs), which are adjusted to match the observedPath Integrated Attenuation. The PR is a well-calibrated andvery stable radar. Primary errors in rainfall retrievals havemainly been attributed to attenuation correction of the radarsignal (involving the incorrect physical assumptions related toconvective versus stratiform rainfall classification and assumeddrop size distribution), non-uniform beam filling (NUBF) andconversion from reflectivity to rainfall intensity (Iguchi et al.,2009).
By characterizing the rainfall variability within the PR FOVand as a function of precipitating system types (convective andstratiform), we will address the impact of the NUBF and therainfall classification. By comparing rain rates at ground, someerror factors like the attenuation correction will not be assessed.Wen et al. (2011) addressed this topic by comparing the radarreflectivity factors at various heights.
2.3. Comparison samples
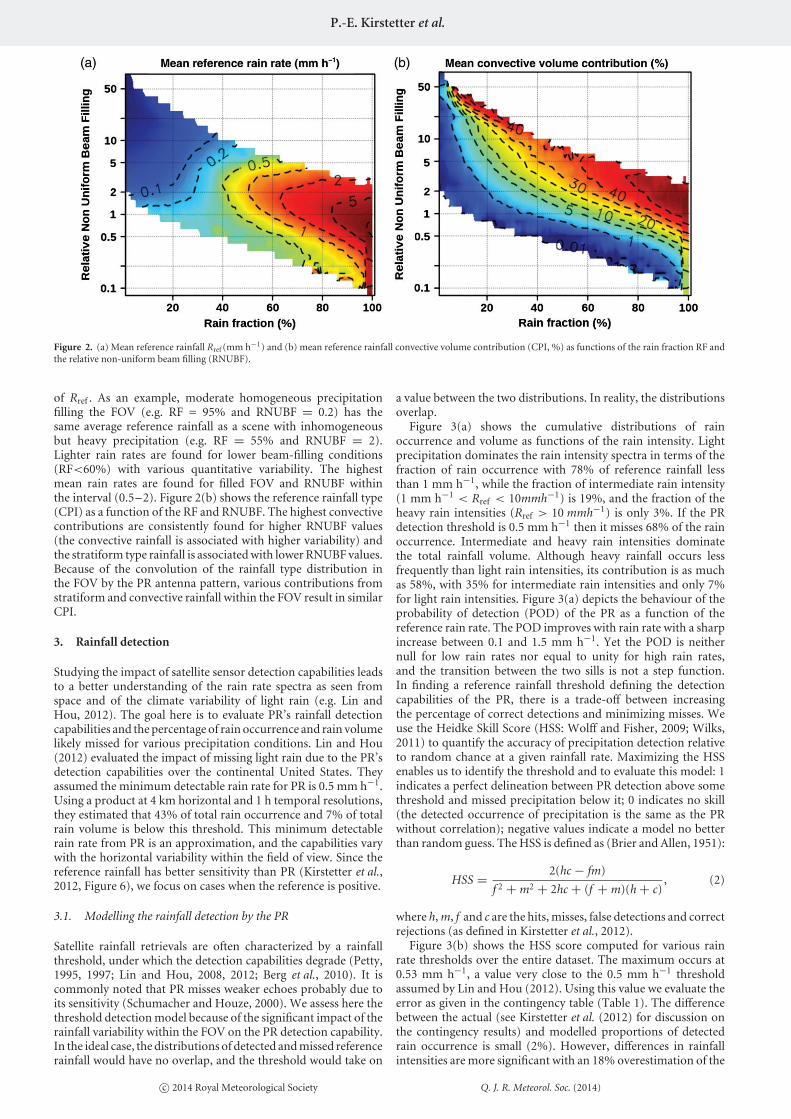
Figure 2(a) shows the mean reference rainfall Rref as a functionof the rain fraction RF and the relative NUBF (RNUBF). Becauseof the convolution of the rain rate spectrum by the PR antennapattern, various types of rain rate spectra result in similar values
c© 2014 Royal Meteorological Society Q. J. R. Meteorol. Soc. (2014)
P.-E. Kirstetter et al.
Figure 2. (a) Mean reference rainfall Rref (mm h−1) and (b) mean reference rainfall convective volume contribution (CPI, %) as functions of the rain fraction RF andthe relative non-uniform beam filling (RNUBF).
of Rref . As an example, moderate homogeneous precipitationfilling the FOV (e.g. RF = 95% and RNUBF = 0.2) has thesame average reference rainfall as a scene with inhomogeneousbut heavy precipitation (e.g. RF = 55% and RNUBF = 2).Lighter rain rates are found for lower beam-filling conditions(RF<60%) with various quantitative variability. The highestmean rain rates are found for filled FOV and RNUBF withinthe interval (0.5–2). Figure 2(b) shows the reference rainfall type(CPI) as a function of the RF and RNUBF. The highest convectivecontributions are consistently found for higher RNUBF values(the convective rainfall is associated with higher variability) andthe stratiform type rainfall is associated with lower RNUBF values.Because of the convolution of the rainfall type distribution inthe FOV by the PR antenna pattern, various contributions fromstratiform and convective rainfall within the FOV result in similarCPI.
3. Rainfall detection
Studying the impact of satellite sensor detection capabilities leadsto a better understanding of the rain rate spectra as seen fromspace and of the climate variability of light rain (e.g. Lin andHou, 2012). The goal here is to evaluate PR’s rainfall detectioncapabilities and the percentage of rain occurrence and rain volumelikely missed for various precipitation conditions. Lin and Hou(2012) evaluated the impact of missing light rain due to the PR’sdetection capabilities over the continental United States. Theyassumed the minimum detectable rain rate for PR is 0.5 mm h−1.Using a product at 4 km horizontal and 1 h temporal resolutions,they estimated that 43% of total rain occurrence and 7% of totalrain volume is below this threshold. This minimum detectablerain rate from PR is an approximation, and the capabilities varywith the horizontal variability within the field of view. Since thereference rainfall has better sensitivity than PR (Kirstetter et al.,2012, Figure 6), we focus on cases when the reference is positive.
3.1. Modelling the rainfall detection by the PR
Satellite rainfall retrievals are often characterized by a rainfallthreshold, under which the detection capabilities degrade (Petty,1995, 1997; Lin and Hou, 2008, 2012; Berg et al., 2010). It iscommonly noted that PR misses weaker echoes probably due toits sensitivity (Schumacher and Houze, 2000). We assess here thethreshold detection model because of the significant impact of therainfall variability within the FOV on the PR detection capability.In the ideal case, the distributions of detected and missed referencerainfall would have no overlap, and the threshold would take on
a value between the two distributions. In reality, the distributionsoverlap.
Figure 3(a) shows the cumulative distributions of rainoccurrence and volume as functions of the rain intensity. Lightprecipitation dominates the rain intensity spectra in terms of thefraction of rain occurrence with 78% of reference rainfall lessthan 1 mm h−1, while the fraction of intermediate rain intensity(1 mm h−1 < Rref < 10mmh−1) is 19%, and the fraction of theheavy rain intensities (Rref > 10 mmh−1) is only 3%. If the PRdetection threshold is 0.5 mm h−1 then it misses 68% of the rainoccurrence. Intermediate and heavy rain intensities dominatethe total rainfall volume. Although heavy rainfall occurs lessfrequently than light rain intensities, its contribution is as muchas 58%, with 35% for intermediate rain intensities and only 7%for light rain intensities. Figure 3(a) depicts the behaviour of theprobability of detection (POD) of the PR as a function of thereference rain rate. The POD improves with rain rate with a sharpincrease between 0.1 and 1.5 mm h−1. Yet the POD is neithernull for low rain rates nor equal to unity for high rain rates,and the transition between the two sills is not a step function.In finding a reference rainfall threshold defining the detectioncapabilities of the PR, there is a trade-off between increasingthe percentage of correct detections and minimizing misses. Weuse the Heidke Skill Score (HSS: Wolff and Fisher, 2009; Wilks,2011) to quantify the accuracy of precipitation detection relativeto random chance at a given rainfall rate. Maximizing the HSSenables us to identify the threshold and to evaluate this model: 1indicates a perfect delineation between PR detection above somethreshold and missed precipitation below it; 0 indicates no skill(the detected occurrence of precipitation is the same as the PRwithout correlation); negative values indicate a model no betterthan random guess. The HSS is defined as (Brier and Allen, 1951):
HSS = 2(hc − fm)
f 2 + m2 + 2hc + (f + m)(h + c), (2)
where h, m, f and c are the hits, misses, false detections and correctrejections (as defined in Kirstetter et al., 2012).
Figure 3(b) shows the HSS score computed for various rainrate thresholds over the entire dataset. The maximum occurs at0.53 mm h−1, a value very close to the 0.5 mm h−1 thresholdassumed by Lin and Hou (2012). Using this value we evaluate theerror as given in the contingency table (Table 1). The differencebetween the actual (see Kirstetter et al. (2012) for discussion onthe contingency results) and modelled proportions of detectedrain occurrence is small (2%). However, differences in rainfallintensities are more significant with an 18% overestimation of the
c© 2014 Royal Meteorological Society Q. J. R. Meteorol. Soc. (2014)

Impact of Sub-Pixel Rainfall Variability on TRMM 2A25
Figure 3. (a) Probability of detection of the reference rainfall by the PR ( ) as a function of the reference rain intensity (mm h−1). The accumulated fractions ofrain occurrence ( ) and volume ( ) are plotted in grey. (b) Heidke Skill Score for the PR as a function of the reference rain intensity. The dashed line marks thethreshold (0.53 mm h−1) identified by the maximum of the HSS score.
Table 1. Contingency table for PR detection of rainfall relative to the reference.
PR Number of Percentage Mean rainfall Missedestimates data samples (%) value volume (%)
>0. Actual 530 261 33 4.33/4.61 –Model 486 524 31 – /5.43
=0. Actual 1 059 111 67 0.0/0.29 11.4Model 1 102 848 69 – /0.10 4.1
The results are provided for the actual and modelled (section 3) contingencyvalues. Mean rainfall values associated to the contingency for PR/reference areprovided as well as the proportion of missed volume of rainfall by PR relative tothe reference.
mean reference rainfall value and 65% underestimation of meanmissed reference rainfall. Because the PR consistently detectshigher rain rate and misses lighter rain intensities relative tothe reference (Kirstetter et al., 2012), these discrepancies aremitigated in terms of total missed volume. Yet, the thresholdmodel underestimates the missed rainfall volume by 7.3%. Thesefindings are consistent with those of Lin and Hou (2012), but themissed occurrence and volume of rainfall are greater here.
The difference between the actual and modelled detectedrainfall suggests that the rain intensity is not the only factor drivingthe detection capabilities of PR. The same reference rain rate canbe characterized by various conditions of rain occurrence andquantitative variability (cf. Figure 2). Hereafter, we quantitativelyexamine the characteristics of the reference rainfall at fine spatialscale within the PR FOV and evaluate how they impact the PRdetection performance.
3.2. Impact of rainfall variability at fine spatial scale on detection
The impact of rainfall variability within the PR field of view isassessed with the rain fraction (occurrence variability of rainfall)and the RNUBF (quantitative variability of rainfall). Kirstetteret al. (2012) characterized the PR detection performances by usingcontingency tables and by simply separating the reference datasetinto ‘robust’ (Rref>σfootprint, i.e. RNUBF<1) and ‘non-robust’(Rref<σfootprint, i.e. RNUBF>1). We extend this analysis byseparating the reference data into various sub-samples accordingto the rain fraction and RNUBF in order to provide in-depthinsight into the PR detection capabilities for various conditions.All coincident and collocated satellite values are considered andsorted according to the reference samples. PR sampled robustrainfall only 33% of the time (80% of total volume of rainfall).The PR FOV is 80% filled only 26% of the time (84% of total
volume of rainfall). Situations where the FOV filling is lowand/or the variability of the rainfall is high occur frequentlyand require a detailed assessment. Figure 4 shows the behaviourof the probability of detection (POD) (Figure 4(b)), the meanmissed reference rainfall (Figure 4(c)) and the missed volumeof rainfall (Figure 4(d)) by the PR relative to the reference as afunction of the RF and the RNUBF. Various conditions lead toequivalent detection performances by the PR. The POD increases:(i) with higher RNUBF values, and (ii) with high rainfall fillingof the PR pixel. More specifically, the highest POD (>90%) arefound for the conditions (RNUBF>1, RF>90%), and 90% ofrainfall is properly detected for RF>95%. A significant fillingof the FOV (70%) is required to detect rainfall and a highquantitative variability (RNUBF>1) has a positive impact fromthe PR perspective. The detection capabilities degrade significantly(i.e. POD<50%) for RF<40%. Misses are associated with highinhomogeneity and/or the ‘rain/no rain’ limits of rain fields.There are two regimes describing the dependency of the POD onrainfall variability:
(i) For a given rain filling condition of the FOV, the POD ismainly driven by the RNUBF for RNUBF values lower than∼2. As an example with a FOV filled at 70%, only 20%of the reference rainfall is properly classified for RNUBF= 0.3 whereas 80% is detected for RNUBF = 2. This rateremains roughly constant for RNUBF>2, which coincideswith decreasing Rref as functions of RNUBF (see Figure 2)and does not support the threshold model for detection.
(ii) For RNUBF values greater than ∼2, the POD is mainlydriven by the RF. For such conditions the filling of the FOVis a significant driver for the detection performances of thePR.
The missed volume of rainfall is closely related to the POD.Higher proportions of missed rainfall are noted at lower RNUBFand RF values, ranging from 10% (RF>80%, RNUBF>0.5) to70% (RF<20%). The two regimes already noticed for the PODare more clearly separated for the missed volume of rainfall. TheRNUBF influence is strongly mitigated when values exceed 1. Bycomparison, the missed volume passes from 80 to 20% for RNUBFincreasing from 0.2 to 1, respectively. One should note that for allconditions of RNUBF and RF, the mean reference values are lowerwhen PR missed them than when they were detected (compareFigures 2(a) and 4(c)). Both present the same patterns accordingto the RF and the RNUBF with higher values for higher rainfraction and present a maximum around RNUBF = 1.
To evaluate the threshold model (section 3.1), Figure 4(e)shows the plots of the identified (maximum) HSS values and the
c© 2014 Royal Meteorological Society Q. J. R. Meteorol. Soc. (2014)

P.-E. Kirstetter et al.
Figure 4. (a) Number of data samples, (b) probability (%) of rain detection by the PR, (c) mean missed reference rainfall (mm h−1), (d) missed volume of rainfall(%), (e) Heidke Skill Score and (f) corresponding detection threshold of the PR (mm h−1) as functions of the rain fraction RF (%) and the RNUBF.
corresponding reference rainfall threshold value as functions ofthe RF and the RNUBF. The HSS values are generally greater than0, showing the threshold model is better than simple randomguess. Yet the accuracy of the threshold model seems to vary withthe rainfall variability characteristics within the FOV. The highestscores are found for RF values close to the maximum and for lowerRNUBF values; the threshold model is consistent when the PR
FOV is uniformly filled by rainfall (both according to occurrenceand quantitative aspects). The lowest scores are found when theFOV is nearly empty and the quantitative variability is high. It isworth noticing that accuracy of the threshold model quickly dropsfor higher RNUBF whatever the RF value. This is particularly truearound RF = 100% and RNUBF = 1, which corresponds tothe highest mean reference rainfall values (see Figure 2). The
c© 2014 Royal Meteorological Society Q. J. R. Meteorol. Soc. (2014)

Impact of Sub-Pixel Rainfall Variability on TRMM 2A25
identified detection thresholds are also structured according tothe RF and RNUBF. For RF<60%, detection threshold valuesrange from 0.2 to 0.6 mm h−1. These low values are expectedconsidering the smoothing effect of the antenna pattern on anFOV partially filled. For RF>60%, detection threshold valuesrange from 0.5 to 0.8 mm h−1. These detection thresholdsare higher than the average value 0.53 mm h−1 for conditionsassociated with significant contribution to the total volume ofrainfall. This explains why the unique threshold model discussedin the previous section underestimates the missed rainfall volume.The rainfall variability at fine spatial scale within the PR FOVimpacts the PR detection performance.
4. Rainfall classification
Precipitation classifications from satellite algorithms haveprofound impacts on the accuracy of the quantitative retrievals.Stratiform and convective clouds have significantly differentvertical heating and moistening profiles. The classification drivesthe vertical model of rainfall used to correct for the attenuationof the radar signal, to estimate the vertical profile of reflectivity,and the rainfall rate at ground (Iguchi et al., 2009). Classificationof precipitation type from non-polarimetric active remote sensingrelies partly on subjective analysis based on interpretation ofprecipitation spatial variability. We investigate relevant factors(occurrence, type and rate of rain within the PR FOV) driving theconvergence or divergence of the PR classification relative to thereference. PR’s rainfall classification capabilities, the conditionsdriving potential misclassification, and the proportion of rainlikely to be misclassified have been largely unknown. We addressthese questions focusing on cases when both the PR and thereference rainfall are positive, so that precipitation detectability isnot a factor.
4.1. Convective detection
The PR classification is a binary decision (i.e. either convectiveor stratiform), while the ground reference provides a volumecontribution of convective rainfall varying continuously from 0%(purely stratiform reference rainfall) to 100% (purely convectivereference rainfall). In a similar way to the rainfall detection, weseparated the reference rainfall into purely stratiform (59% ofthe data sample) and convective when the convective volumecontribution is positive. Table 2 shows the contingency table forthe PR classification relative to the reference with percentile ofhits (h: both reference and PR detect convective activity), misses(m: 2A25 classifies as stratiform while the reference classifies asconvective), false alarms (f : 2A25 classifies as convective whilethe reference does not), and correct rejection (c: both 2A25 andthe reference classifies as stratiform). Again, all coincident andcollocated PR values are considered and sorted according to thereference sample. As the false detections (m + f ) have a rateof 24%, it can be concluded that the PR classification generallyagrees with the reference. The misses are the main contributors tothis population (i.e. 70% of this population). Table 3 provides themean rainfall values and the classified rainfall volumes accordingto the same contingency tables with PR on the left-hand side of the‘/’ sign and the reference on the right-hand side. As we expect, theconvective rain rates are higher than the stratiform ones for bothPR and reference. The convective rainfall missed by PR relativeto the reference is consistently associated with lower PR (andreference) rain rates than when properly classified. Regarding therain volumes in question, one can say that PR and the referenceconjointly detect convective rainfall volume (90% for PR, 80%for the reference). The largest discrepancies are noted for theconjoint stratiform detection with the PR properly classifyingechoes nearly 90% of the stratiform reference rainfall volume, butunderestimating the volume in question by ∼26%. Nearly 40%of PR’s stratiform rainfall volume is classified as convective bythe reference. The discrepancies in rainfall volume are much less
Table 2. Contingency table for PR rainfall classification relative to the reference.
PR estimates Reference
Number of dataConvective Stratiform samples
Convective 24% 7.2% 164 960Stratiform 16.8% 52% 363 435Number of data samples 215 494 312 901 528 395
Table 3. Contingency table for PR classification of rainfall relative to the reference.
PR classification/ Number of Percentage Mean rainfall (Mis)classifiedreference data samples (%) value (mm h−1) volume (%)
C/C Actual 126 886 24 10.8/12.1 90/80Model 175 394 33.2 10.6/10.6 100/96.1
S/C Actual 88 608 16.8 3.4/4.4 39/20Model 40 100 7.6 1.9/1.9 12.9/3.9
C/S Actual 38 074 7.2 4.1/1.8 10/13Model 0 0 – –
S/S Actual 274 827 52 1.7/1.6 61/87Model 312 901 59.2 1.6/1.6 86.9/100
The results are provided for the actual and modelled (section 4) classificationcontingency. Mean rainfall values associated to the contingency for PR/referenceare provided as well as the proportion of classified volume of rainfall by PR relativeto the reference.
significant regarding convective reference classified as stratiformby the PR.
Figure 5 provides an in-depth view of the 2A25 classification byshowing the proportion of convective classification as a functionof the variability within the PR field of view (rain fraction andRNUBF) for both sensors. The reference classification is regularlydistributed and depends primarily on the RNUBF with valuesranging from ∼3% to more than 95%. This is expected sincethe convective rainfall involves more quantitative variability thanthe stratiform rainfall. The 2A25 classification shows differentpatterns than the reference. There is less dependence on RNUBF,and the proportion of convective detection does not exceed 85%.While the classification dependence on the RNUBF shows thesame trend as the reference for RF>50%, the 2A25 classificationshows two detection maxima for extreme RNUBF values in thedomain RF<50%. More investigation is necessary to identify thereason why the PR is prone to detect convective activity underthese last conditions.
Hits, misses, false alarms and correct rejection for PR’sdetection of convective rainfall are computed and plotted asfunctions of the rainfall variability within the PR field of view inFigure 5. Both products classify convective rainfall consistentlyat higher RNUBF values; stratiform classification by both sensorstypically occurs at lower RNUBF values. Misses are not asprevalent but tend to occur at higher RNUBF values. Falsealarms are mainly associated with low filling of the FOV andlow RNUBF values. To summarize, the 2A25 classification differsfrom the reference mainly for extreme rainfall variability (i.e. lowfilling of the FOV and high quantitative variability). Because the2A23 classification algorithm is based on a characterization ofhorizontal and vertical variability of reflectivity, these cases arecertainly difficult to resolve from the PR perspective.
Grey lines in Figure 6(a) show the cumulative distributions ofCPI occurrence and according convective volume contributionas functions of the CPI. The CPI is quite evenly distributedwith light convective contribution (CPI<25%) representing30% of the population, the fraction of intermediate convectivecontribution (25%<CPI<75%) being ∼30%, and the fractionof the significantly convective reference rainfall (CPI>75%)is 40%. The last class dominates the total convective rainfallvolume with a contribution of more than 90%. Figure 6(a)also depicts the probability of detection (POD) of the PR as a
c© 2014 Royal Meteorological Society Q. J. R. Meteorol. Soc. (2014)

P.-E. Kirstetter et al.
Figure 5. (a) Proportion (%) of convective detection by the reference and (b) by the PR, (c) proportion of conjoint convective classification by the PR andreference, (d) PR-convective and reference-stratiform classification, (e) PR-stratiform and reference-convective classification and (f) conjoint stratiform classificationas functions of the rain fraction RF (%) and the RNUBF. The colour table is the same for (a,b) and for (c–f).
function of the convective volume contribution to the referencerainfall. The POD improves with CPI with a sharp increasefrom 13% to nearly 40% at light CPI values, then increasesmore slowly yet regularly with the convective contributionto reach ∼80% for a purely convective reference rainfall.The PR shows consistent classification performances relativeto the reference. Yet the POD is neither null for light CPInor equal to unity for high CPI values, and the transition
between the two sills is not a step function as would bethe case for a perfect classification of rainfall relative to thereference. In finding a reference rainfall threshold definingthe classification capabilities of the PR, there is a trade-offbetween increasing the percentage of convective and stratiformclassification. Similarly with the detection aspect, we evaluatehereafter the convective contribution threshold describing thestratiform/convective separation by the PR.
c© 2014 Royal Meteorological Society Q. J. R. Meteorol. Soc. (2014)

Impact of Sub-Pixel Rainfall Variability on TRMM 2A25
Figure 6. (a) Proportion (%) of convective detection by the PR as a function of the reference rainfall convective volume contribution (%). The proportion ofconvective contribution by occurrence ( ) and volume ( ) are figured in grey. (b) Heidke Skill Score and (c) corresponding classification threshold (%) ofthe PR as functions of the rain fraction RF (%) and the relative non-uniform beam filling RNUBF.
4.2. Modelling the rainfall classification by the PR
We use the Heidke Skill Score to quantify the accuracy ofprecipitation classification (stratiform vs. convective) relativeto random chance at a given reference convective contribution.By computing the HSS score for various CPI thresholds over theentire dataset, a maximum value (HSS = 0.56) is found for CPI= 6%; this indicates the 2A25 product presents overall agreementwith the independent classification provided by the reference.Assuming this value, we evaluate the discrepancies with the actualclassification as given in Table 3. The difference between the actualand modelled proportions of classified rainfall underestimatesthe wrong classifications (m + f ) by 16.4%, especially the misses.While presenting overall similar features, differences in rainfallintensities are also significant especially in case of misses (1.9 mmh−1 for the modelled convective reference rate misclassified asstratiform by the PR while 4.4 mm h−1 is the actual value).The model is close to the actual values when it comes to theconjoint stratiform classification with values close to 1.6 mm h−1.The model overestimates the conjoint convective and stratiformclassification volumes and underestimates the rainfall volumesimplied in misses.
The difference between the actual and modelled classifiedrainfall suggests that the CPI is not the only factor driv-ing the detection capabilities of the PR. Hereafter we quan-titatively examine the characteristics of the reference rain-fall at fine space scale within the PR FOV (cf. Figures 2
and 3) and evaluate how they impact the PR classificationperformances.
Figure 6(b,c) show plots of the maximum HSS and of thecorresponding optimum CPI threshold value as functions ofthe RF and the RNUBF. The positive HSS values indicate thatthe threshold model is better than random guess, but its accuracyvaries with the rainfall variability characteristics within the FOV.The highest scores are found for the highest RF and lowest RNUBFvalues: this model is consistently all the more accurate when thePR FOV is uniformly filled by rainfall (both occurrence andquantitative aspects), which are better conditions for applying thePR classification algorithm. The model accuracy quickly dropsfor higher quantitative variability and RF>50%. This confirmsthat the characterization of horizontal variability of reflectivityis difficult at scales finer than the FOV. The lowest scores arefound when the FOV is nearly empty. That is consistent withthe convective false alarms noticed previously. It seems the limitsof the classification capabilities of the PR are reached for theseconditions.
The identified classification thresholds are structured accordingto the RF and RNUBF. Lower threshold values (<10%) arecoincident with RF<80% and higher values ranging from 20 to90% are found for RF>80%. It is probably easier to detectconvective activity in case of isolated convective cells. Thecontribution is more difficult to distinguish when embeddedinto stratiform rainfall type. This is confirmed when consideringthe dependence of the threshold on the RNUBF. For RF>80%
c© 2014 Royal Meteorological Society Q. J. R. Meteorol. Soc. (2014)

P.-E. Kirstetter et al.
Figure 7. (a–d) Reference (left) and PR (right) rainfall rate distributions (mm h−1) as functions of the reference rainfall volume convective contribution (%) for thePR stratiform (top) and convective (second row) classifications. The thick black line represents the median (50% quantile), the dark grey-shaded region representsthe area between the 25 and 75% quantiles, the light grey-shaded region represents the area between the 10 and 90% quantiles. (e,f) Conditional bias of the PR relativeto the reference as a function of the reference rainfall volume convective contribution for the PR (e) stratiform and (f) convective classifications. The grey lines figurethe conditional mean reference (plain) and PR (dotted) rainfall.
(<80%), the threshold values are higher for lower (higher)RNUBF.
5. Rainfall quantification
The last section addresses the dependencies of the PR rainfallrates on rainfall variability and classification. We address thesequestions focusing on cases when both the PR and the reference
rainfall are positive, so as to remove any discrepancies related todetectability.
5.1. Influence of the rainfall classification
The 2A25 algorithm uses different Z –R relationships in theconvective/stratiform profiling components. Figure 7 showsthe reference and PR rainfall rate distributions as functions
c© 2014 Royal Meteorological Society Q. J. R. Meteorol. Soc. (2014)

Impact of Sub-Pixel Rainfall Variability on TRMM 2A25
Figure 8. (a) Mean reference, (b) PR rainfalls (mm h−1) and (c) bias (%) of the PR relative to the reference as functions of the rain fraction RF (%) and the RNUBF.The colour table is the same for (a,b).
of the convective contribution, CPI. All coincident and collocatedPR values are considered and sorted according to the referencesample. The dataset is also separated according to the PR rain typeclassification. Figure 7(a–d) show a shift toward higher rainfallrates as CPI increases, as we would expect. This shift is mostpronounced for PR and reference rain rates with PR-indicatedconvective echoes (Figure 7(c,d)). Despite these consistencies, wenote rain rate distributions indicating higher rainfall rates for thereference compared to those of PR (i.e. Figure 7(a) comparedto (b), and (c) compared to (d)). The dynamic ranges of rainrate distribution are greater for the reference than for the PR,especially for the PR convective type (see Figure 7(c)). Suchdifferences, which will undoubtedly result in some bias, could berelated to the 2A25 Z –R relationships. It is worth noting that thespread of the PR convective rain rate distribution in Figure 7(d) isgreater than for the stratiform PR rainfall whatever the convectivecontribution. Such a feature does not apply to the referencerainfall, and potentially indicates uncertainties in quantifying the2A25 convective rainfall.
The rain type impacts the bias of the PR relative to thereference. Figure 7(e,f) show the mean rainfall rates and the PRbiases as a function of the CPI. The conditional biases are verydistinct according to the PR rainfall types. The PR convectivesystematic biases present a shift towards higher values comparedto stratiform biases. Biases cover a much broader range for thePR convective type (from −50 to 200%) than for the stratiformtype (from −50 to 10%). They are both decreasing functions of
the convective contribution CPI, with overestimation at values<20% and underestimation for convective contribution >90%.Apparently, both stratiform and convective profiling algorithmsin 2A25 lack sufficient dynamics to deal with extreme rainfallamounts. However, the behaviour of the bias for convective andstratiform PR types decreases at a quasi-linear rate with increasingCPI, and thus provides opportunities for correction using theground reference. Biases are consistently distributed with the PRclassification, with the stratiform algorithm presenting relativelylimited biases for light CPI values (biases within 10% forCPI<40%) and the convective algorithm having limited biasesfor high CPI values (biases within 50% for CPI>70%).
5.2. Influence of the rainfall variability at fine scales
Figure 8 provides an in-depth view of the 2A25 rainfall ratequantification relative to the reference. The mean rainfall valuesby both sensors are computed as a function of the variabilitywithin the PR field of view. The reference rain rates are regularlydistributed along the RNUBF and RF with values ranging from0.01 mm h−1 to more than 10 mm h−1 (Figure 8(a)). Maximumrainfall rates occur where RF ∼ 100% and RNUBF ∼ 0.5.The 2A25 rainfall rate quantification plot in Figure 8(b) showsdifferent patterns than the reference. Lower gradients are notedwith values ranging from 1 to 7 mm h−1. A maximum isfound for RF ∼ 100% and RNUBF ∼ 1. This shift of the2A25 maximum toward higher quantitative variability relative
c© 2014 Royal Meteorological Society Q. J. R. Meteorol. Soc. (2014)

P.-E. Kirstetter et al.
Figure 9. Bias (%) of the PR relative to the reference as a function of the rain fraction RF (%) and the relative non-uniform beam filling (RNUBF) for conjoint convectiveclassification by (a) PR and the reference, (b) PR-convective and reference-stratiform classifications, (c) PR-stratiform and reference-convective classifications, and(d) stratiform classifications by both PR and reference. The colour table is the same for all panels.
to the reference may result from the NUBF correction schemeapplied in version 7 of the 2A25 algorithm. The bias of the PRrelative to the reference in Figure 8(c) is organized with highestunderestimation (−30%) around RF ∼ 100% and RNUBF ∼ 0.5.More generally, the PR underestimates relative to the referencefor RF>80% and RNUBF<1. For lower FOV-filling conditionsand higher quantitative variability, 2A25 overestimates relativeto the reference with bias values exceeding 1000%. In theseconditions the rain rates are low and the NUBF correction isalmost non-existent in the 2A25 algorithm.
The bias plot in Figure 8(c) is broken down into contingencycategories for convective classification in Figure 9. When bothreference and PR detect convection, the bias primarily dependson the RNUBF as depicted with near-horizontal contour linesof the bias (Figure 9(a)). There is overestimation by PR relativeto the reference for RNUBF>1 and underestimation otherwise.This feature is more pronounced when PR misses convection, forwhich the RNUBF value separating over- and underestimation is∼2. The 2A25 product overestimates for nearly all conditions ofrainfall variability in cases of falsely detected convection relativeto the reference (Figure 9(b)). When both the reference andPR classify stratiform rainfall, PR underestimates rainfall ratesrelative to the reference only for high filling conditions of theFOV (RF>90%) (Figure 9(d)). The bias gradients are organizedalong the RNUBF axis for lower filling conditions of the FOVand along the RF axis for higher filling conditions. In convectiverainfall, the quantitative variability inside the PR FOV playsa significant role in addition to the Z –R relationship (section5.1).
6. Conclusions
Satellite surface rain rate estimates are affected by rainfallvariability at finer scales than those resolved by space sensorsand the retrieval algorithms in terms of detection capabilities,characterization of rainfall types, and quantification of rainfallrates. A 7-month data sample of TRMM-PR-based rainfallproducts was analysed using gauge-adjusted and quality-filteredsurface rainfall estimates derived from NMQ/Q2. Several high-resolution Q2 products were used to characterize the referencerainfall in terms of occurrence, types and rate at PR’s pixelresolution to evaluate the PR detection, classification andquantification performances. Primary errors due to incorrectphysical assumptions related to convective versus stratiformrainfall classification, non-uniform beam filling (NUBF) andconversion from reflectivity to rainfall intensity have beeninvestigated. While the error structure of the PR is complicatedbecause of the interaction of these factors, simple empiricalthreshold models regarding PR detection and rainfall classificationwere discussed.
Segregating rain from no-rain transition is a drivingcontributor to the PR rain rate errors, probably linked to thelack of sensitivity in the most inhomogeneous and light parts ofthe edges of rainy regions, although the PR captures the major partof the rainfall volume. Rainfall detection capabilities vary with thehorizontal variability within the field of view (non-uniform beamfilling). The PR detects rainfall when the rain amount is highenough (0.53 mm h−1) and the FOV is significantly filled withrainfall (at least 70%). By utilizing reference rainfall rates at scales
c© 2014 Royal Meteorological Society Q. J. R. Meteorol. Soc. (2014)

Impact of Sub-Pixel Rainfall Variability on TRMM 2A25
below the pixel resolution of PR, we have determined that simplerain rate threshold-based detection models are not accurate incase of high rainfall variability, and caution is recommended whenusing them for evaluating the PR detection performances. The PRclassification generally agrees with the reference. Misclassificationmay have a huge impact on the estimated rainfall volume,with nearly 40% of PR’s stratiform rainfall volume classifiedas convective by the reference. The PR classification is generallyconsistent with the rainfall quantitative variability within the FOV.However, misclassification is shown to occur with variability of therainfall within the FOV not resolved by the 2A23 algorithm, withfalse convective detection associated with low filling of the FOVand low RNUBF values. Regarding quantification, significanterror is most likely due to a combination of inaccurate Z –Rrelationship, non-uniform beam filling and/or attenuation ofthe PR radar signal. Both stratiform and convective profilingalgorithms in 2A25 seem to be lacking sufficient dynamics to dealwith extreme rainfall amounts. However, the bias for convectiveand stratiform PR types decreases at a quasi-linear rate withincreasing CPI, and thus provides opportunities for correctionusing the ground reference. For correcting PR stratiform andconvective rainfall rates, we suggest matching the PR PDFs inFigure 7(b,d) with those associated to the reference values inFigure 7(a,c), respectively. For lower FOV-filling conditions andhigher quantitative variability, 2A25 overestimates relative tothe reference and underestimates otherwise. Results from theconditioned error features presented herein provide insights intothe most significant characteristics of PR rainfall retrieval errorsthat need to be taken into account when such data are used inapplications.
Future works will address the relative contributions of errorslinked to off-nadir angle and the underlying terrain. The sameframework and reference rainfall datasets can be readily applied torainfall retrievals from other sensors on board low Earth-orbitingsatellites (i.e. TMI, AMSR-E, SSMI, MADRAS). This frameworkwill also be applied to GPM rainfall estimates following its launchin 2014. Another important issue to study is how the various errorsources in PR propagate in a number of satellite-based, high-resolution precipitation products when calibrating geostationaryinfrared-based precipitation estimates.
Acknowledgements
We are very much indebted to the team responsible for theNMQ/Q2 products, especially Carrie Langston. We want to thankthree anonymous reviewers, whose comments were very usefulin improving the manuscript. The 2A23 and 2A12 productswere obtained from the Goddard Earth Sciences Data andInformation Services Center. This work was funded by a post-doctoral grant from the NASA Global Precipitation Measurementmission Ground Validation Management.
References
Adeyewa ZD, Nakamura K. 2003. Validation of TRMM radar rainfall data overmajor climatic regions in Africa. J. Appl. Meteorol. 42: 331–347.
Amitai E, Llort X, Sempere-Torres D. 2009. Comparison of TRMM radarrainfall estimates with NOAA next-generation QPE. J. Meteorol. Soc. Jpn.87A: 109–118.
Amitai E, Petersen W, Llort X, Vasiloff S. 2012. Multi-platform comparisons ofrain intensity for extreme precipitation events. IEEE Trans. Geosci. RemoteSens. 50: 675–686.
Awaka J, Iguchi T, Okamoto K. 2007. Rain type classification algorithm. Adv.Global Change Res. 28: 213–224.
Berg W, L’Ecuyer T, Haynes JM. 2010. The distribution of rainfall over oceansfrom spaceborne radars. J. Appl. Meteorol. Clim. 49: 535–543.
Brier GW, Allen RA. 1951. Verification of weather forecasts. In Compendium ofMeteorology, Malone TF. (ed.): 841–848. American Meteorological Society:Boston, MA.
Chen S, Gourley JJ, Hong Y, Kirstetter PE, Zhang J, Howard KW, Flamig ZL,Hu J, Qi Y. 2013. Evaluation and uncertainty estimation of NOAA/NSSLnext-generation National Mosaic Quantitative Precipitation Estimation
product (Q2) over the continental United States. J. Hydrometeorol. 14:1308–1322, doi: 10.1175/JHM-D-12-0150.1.
Ciach GJ, Krajewski WF. 2006. Analysis and modeling of spatial correlationstructure of small-scale rainfall in Central Oklahoma. Adv. Water Resour.29: 1450–1463.
Ebert EE. 2007. Methods for verifying satellite precipitation estimates.In Measuring Precipitation from Space: EURAINSAT and the Future,Levizzani V, Bauer P, Turk FJ. (eds.): 345–356. Springer: Dordrecht,Netherlands.
Grimes DIF, Diop M. 2003. Satellite-based rainfall estimation for river flowforecasting in Africa. I: Rainfall estimates and hydrological forecasts. Hydrol.Sci. J. 48: 567–584.
Hong Y, Adler RF, Hossain F, Curtis S, Huffman GJ. 2007. A first approachto global runoff simulation using satellite rainfall estimation. Water Resour.Res. 43: W08502, doi: 10.1029/2006WR005739.
Huffman GJ, Adler RF, Bolvin DT, Gu G, Nelkin EJ, Bowman KP, Hong Y,Stocker EF, Wolff DB. 2007. The TRMM multi-satellite precipitationanalysis: Quasi-global, multi-year, combined-sensor precipitation estimatesat fine scale. J. Hydrometeorol. 8: 38–55.
Iguchi T, Kozu T, Meneghini R, Awaka J, Okamoto K. 2000. Rain-profilingalgorithm for the TRMM precipitation radar. J. Appl. Meteorol. 39:2038–2052.
Iguchi T, Kozu T, Kwiatkowski J, Meneghini R, Awaka J, Okamoto K. 2009.Uncertainties in the rain profiling algorithm for the TRMM precipitationradar. J. Meteorol. Soc. Jpn. 87A: 1–30.
Kirstetter PE, Hong Y, Gourley JJ, Chen S, Flamig Z, Zhang J, Schwaller M,Petersen W, Amitai E. 2012. Toward a framework for systematic errormodeling of spaceborne radar with NOAA/NSSL ground radar-basedNational Mosaic QPE. J. Hydrometeorol. 13: 1285–1300.
Kirstetter PE, Viltard N, Gosset M. 2013. An error model for instantaneoussatellite rainfall estimates: Evaluation of BRAIN-TMI over West Africa.Q. J. R. Meteorol. Soc. 139: 894–911, doi: 10.1002/qj.1964.
Lebel T, Cappelaere C, Galle S, Hanan N, Kergoat L, Levis S, Vieux B,Descroix L, Gosset M, Mougin E. 2009. AMMA-CATCH studies in theSahelian region of West-Africa: An overview. J. Hydrol. 375: 3–13, doi:10.1016/j.jhydrol.2009.03.020.
Lin X, Hou AY. 2008. Evaluation of coincident passive microwave rainfallestimates using TRMM PR and ground measurements as references. J. Appl.Meteorol. Clim. 47: 3170–3187.
Lin X, Hou AY. 2012. Estimation of rain intensity spectra over the continentalUnited States using ground radar–gauge measurements. J. Clim. 25:1901–1915.
Meneghini R, Iguchi T, Kozu T, Liao L, Okamoto K, Jones JA, KwiatkowskiJR. 2000. Use of the surface reference technique for path attenuationestimates from the TRMM precipitation radar. J. Atmos. Oceanic Technol.40: 2053–2070.
Meneghini R, Jones JA, Iguchi T, Okamoto K, Kwiatkowski JR. 2004. A hybridsurface reference technique and its application to the TRMM precipitationradar. J. Atmos. Oceanic Technol. 21: 1645–1658.
Michaelides SC. 2008. Precipitation: Advances in Measurement, Estimation andPrediction. Springer-Verlag: Berlin and Heidelberg, Germany.
Petty GW. 1995. Frequencies and characteristics of global oceanic precipitationfrom shipboard present-weather reports. Bull. Am. Meteorol. Soc. 76:1593–1616.
Petty GW. 1997. An intercomparison of oceanic precipitation frequencies from10 special sensor microwave/imager rain rate algorithms and shipboardpresent weather reports. J. Geophys. Res. 102: 1757–1777, doi: 10.1029/96JD03000.
Sapiano MRP, Arkin PA. 2009. An intercomparison and validation ofhigh-resolution satellite precipitation estimates with 3-hourly gauge data.J. Hydrometeorol. 10: 149–166.
Schumacher C, Houze RA Jr. 2000. Comparison of radar data from theTRMM satellite and Kwajalein oceanic validation site. J. Appl. Meteorol. 39:2151–2164.
Steiner M, Houze RA Jr, Yuter SE. 1995. Climatological characterization ofthree-dimensional storm structure from operational radar and rain gaugedata. J. Appl. Meteorol. 34: 1978–2007.
Stephens GL, Kummerow CD. 2007. The remote sensing of clouds andprecipitation from space: A review. J. Atmos. Sci. 64: 3742–3765.
Takahashi N, Hanado H, Iguchi T. 2006. Estimation of path-integratedattenuation and its nonuniformity from TRMM/PR range profile data.IEEE Trans. Geosci. Remote Sens. 44: 3276–3283.
Turk FJ, Arkin P, Ebert EE, Sapiano MRP. 2008. Evaluating high resolutionprecipitation products. Bull. Am. Meteorol. Soc. 89: 1911–1916.
Ushio T, Okamoto K, Kubota T, Hashizume H, Shige S, Noda S, Iida Y,Aonashi K, Inoue T, Oki R, Kachi M, Takahashi N, Iguchi T. 2006.‘A combined microwave and infrared radiometer approach for a highresolution global precipitation mapping in the GSMAP project Japan.’ In3rd International Precipitation Working Group Workshop on PrecipitationMeasurements, Melbourne, Australia.
Vasiloff SV, Howard KW, Rabin RM, Brooks HE, Seo D-J, Zhang J,Kitzmiller DH, Mullusky MG, Krajewski WF, Brandes EA, Brown BG,Berkowitz DS, McGinley JA, Kuligowski RJ. 2007. Improving QPE and veryshort term QPF: An initiative for a community-wide integrated approach.Bull. Am. Meteorol. Soc. 88: 1899–1911.
c© 2014 Royal Meteorological Society Q. J. R. Meteorol. Soc. (2014)

P.-E. Kirstetter et al.
Wen Y, Hong Y, Zhang G, Schuur TJ, Gourley JJ, Flamig ZL, Morris KR, Cao Q.2011. Cross validation of spaceborne radar and ground polarimetric radaraided by polarimetric echo classification of hydrometeor types. J. Appl.Meteorol. Clim. 50: 1389–1402.
Wilks DS. 2011.Statistical Methods in the Atmospheric Sciences. Elsevier: Oxford,UK.
Wolff DB, Fisher BL. 2008. Comparisons of instantaneous TRMM groundvalidation and satellite rain-rate estimates at different spatial scales. J. Appl.Meteorol. Clim. 47: 2215–2237.
Wolff DB, Fisher BL. 2009. Assessing the relative performance of microwave-based satellite rain-rate retrievals using TRMM ground validation data.J. Appl. Meteorol. Clim. 48: 1069–1099.
Yang S, Olson WS, Wang JJ, Bell TL, Smith EA, Kummerow CD. 2006.Precipitation and latent heating distributions from satellite passive
microwave radiometry. Part II: Evaluation of estimates using independentdata. J. Appl. Meteorol. Clim. 45: 721–739.
Zhang J, Howard K, Gourley JJ. 2005. Constructing three-dimensional multipleradar reflectivity mosaics: Examples of convective storms and stratiformrain echoes. J. Atmos. Oceanic Technol. 22: 30–42.
Zhang J, Howard K, Langston C, Vasiloff S, Kaney B, Arthur A, Van Cooten S,Kelleher K, Kitzmiller D, Ding F, Seo D-J, Wells E, Dempsey C. 2011a.National Mosaic and multi-sensor QPE (NMQ) system: Description, resultsand future plans. Bull. Am. Meteorol. Soc. 92: 1321–1338.
Zhang J, Qi YC, Howard K, Langston C, Kaney B. 2011b. ‘Radar QualityIndex (RQI) – A combined measure of beam blockage and VPR effectsin a national network.’ In Proceedings, International Symposium onWeather Radar and Hydrology, April 2011. IAHS Publication, Exeter, UK,351 pp.
c© 2014 Royal Meteorological Society Q. J. R. Meteorol. Soc. (2014)