Embed Size (px)
Citation preview

Impact of shape and land use on sedimentation in
green flood retention reservoirsDevelopment of an Integrated Management Strategy for Green Flood
Retention Reservoirs and Polders for Flood protection
Sven Wurms
5th International SedNet conference
Oslo, Norway, 27th – 29th May 2008
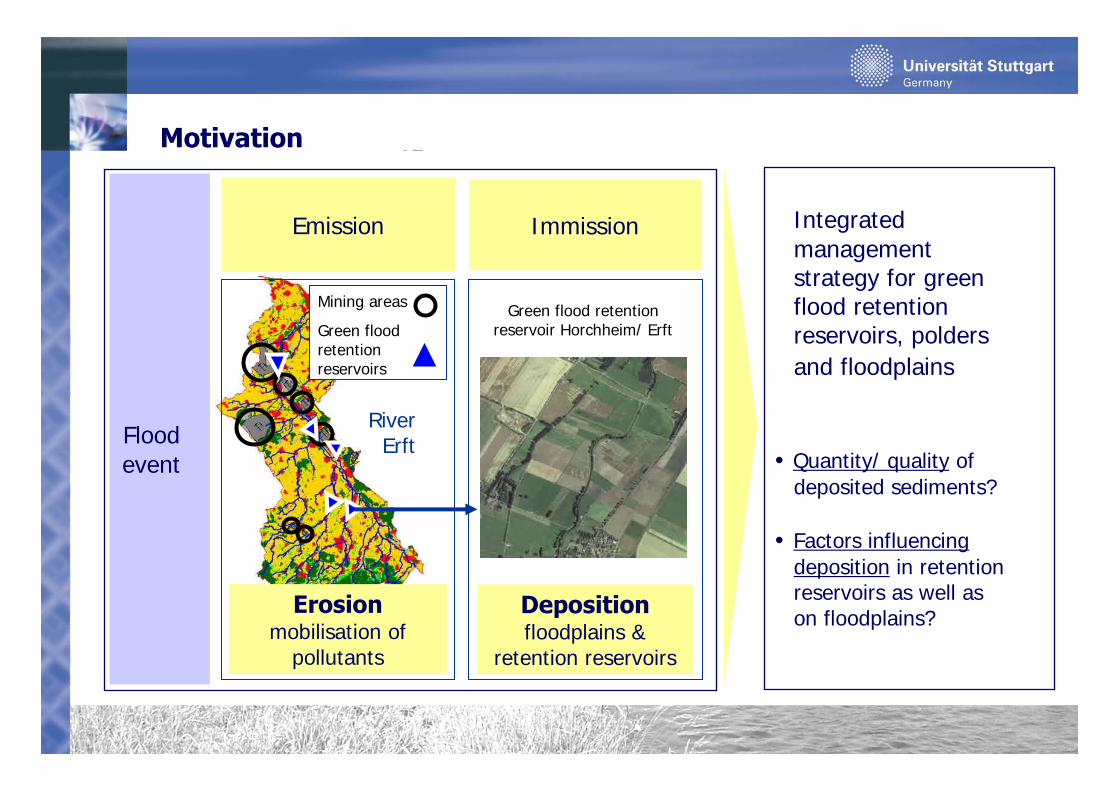
Motivation
Integratedmanagementstrategy for greenflood retentionreservoirs, poldersand floodplains
• Quantity/ quality of deposited sediments?
• Factors influencingdeposition in retentionreservoirs as well as on floodplains?
Floodevent
Emission
Depositionfloodplains &
retention reservoirs
Immission
Mining areas
Green floodretentionreservoirs
Green flood retentionreservoir Horchheim/ Erft
Erosionmobilisation of
pollutants
River Erft

Overview
1. Aim
2. Quantifying transport processes in green flood retention reservoirs
3. Impact of reservoir shapes on sedimentation
4. Detailed transport simulations
5. Impact of land use on sedimentation
6. Conclusions

Aim
Factors influencing sedimentation processes in green flood retention reservoirs
Susp. sedimentconcen-tration
Operation
Instream/bypass Shape
Land use
Grain size distribution
Flood event
Sedimen-tation
Background „Integrated management strategy“
Enhancement of the environmentby targeted retention of flood induced,
released contaminated sedimentsin green flood retention reservoirs?
Knowledge of effectiveness of factors influencing sedimentation and
their interaction is essential!
Investigation of the impact of shape and land use on sedimentation in
green flood retention reservoirs

Quantification of deposition in green flood retention reservoirs
• Q(t) (in, out)• c(t)• cross sections• geo data• land use data• sediment specific parameters
• (measured events)
• advection• dispersion• sedimentation• (erosion)• (sorption)• (degradation)
filling and emptying phases unsteady
modelling
• 2d-hn-modelling• physical modelling
processes databasequantification
time- and resource-intensive complex often not available
large scope of investigations (TELEMAC-2D, SUBIEF-2D) concerning factors influencing sedimentation simplifications necessary:• sediment is considered to be medium of conservative contaminant transport (no desorption/
degradation)• basic reservoir shapes, simplified concentration graphs as well as hydrographs • no erosion (small flow velocities, vegetation)

Impact of reservoir shapes on sedimentation
Objects under investigation: Rectangular instream green flood retention reservoirs, body of water = 106 m³ in each case, kstr,river = 30 m1/3/s, kstr,floodplain = 20 m1/3/s
Sediment properties (Sedimentation flux )
1000
m
500 m
245 m
1000
m
1500 m
745 m
1000
m
500 m
120 m
1000
m
500 m
490 m
1500
m
250 m
120 m
0.279.9 *10-22.7*10-26.7*10-3critical shear velocityfor deposition [m/s]
1.29*10-24.21*10-31.13*10-32.75*10-4settling velocity [m/s]
150804020Grain fraction [µm]

Flow BC: idealised inflow hydrograph Qin(t), Qout = const. in each case
Transport BC for suspended sediments
0
10
20
30
40
0 40000 80000 120000 1600000
300000
600000
900000
1200000
[m³]
[s]
[m³/ s
]
0
10
20
30
40
0 40000 80000 120000 1600000
0.1
0.2
0.3
0.4
0.5Q_in
Q_out
c_in
[m³/
s ]
[g/l]
[s]
Q_in
Q_out_14
volume 14

48.9 %56.3 %60.4 %58.2 %70.6 %80 µm
44.3 %43.1 %42.5 %42.1 %38.7 %20 µm
46.6 % 49.0 % 50.4 %49.0 %56.4 %40 µm
51.8 %64.9 % 69.3 % 66.5 %78.3 %150 µm
grainfraction 10
00 m
500 m
245 m
1000
m
1500 m
745 m
1000
m
500 m
120 m
1000
m
500 m
490 m
1500
m
250 m
120 m
Deposited sediment (percentage of total incoming sediment); Qout = 14 m³/s

Deposition pattern; Qout = 14 m³/s
Deposition height [m] Deposition height [m]
d = 20 µm d = 150 µm

0
10
20
30
40
0 40000 80000 120000 1600000
0.1
0.2
0.3
0.4
0.5Q_in
Q_out
c_in
[ m³ /
s]
[g/l]
[s]
- 5 h + 5 h
40.9 %41.4 %+5 h
36.4 %41.4 %-5 h38.7 % 42.1 %0 h
1000
m
500 m
1500
m
250 m
Time dependency of sedimentation processes
Transport BC
temporal shift of concen-tration
0 h

time [s]
Detailed transport simulations
Input of several portions of suspended sediment at different levels of filling into the reservoir instead of continous sediment input 1 simulation per input portion (d=20 µm, Qout=14 m³/s)
0
200000
400000
600000
800000
1000000
0 40000 80000 120000 160000
volu
me
[ m³]
0
0.05
0.1
0.15
0.2
0.25
0.3
0.35
0.4
0.45
0.5
con
cen
trat
ion
[g
/l]
c_inportionsvolume
0 h
3 h
6 h
9 h
12 h
18 h
24 h 30 h 36 h 42 h 48 h

0
10
20
30
40
50
60
70
0 40000 80000 120000 160000
time of sediment input [s]
sedi
men
tati
on [
%]
Qmax Vmax
Result: Deposition (percentage of total incoming sediment); f (time of sediment input)
d = 20 µm, Qout = 14m³/s

0
10
20
30
40
50
60
70
80
90
100
0 40000 80000 120000 160000
Qmax Vmax
time of sediment input [s]
shor
t ci
rcu
it [
%]
time of sediment input: 9h
0
0,1
0,2
0,3
0,4
0,5
30000 80000 130000 180000
time [s]
conc
entr
atio
n [g
/l]
20 µm input
20µm_output
short circuit
input
Result: Short circuit (percentage of total incoming sediment); f (time of sediment input)

Example of deposition pattern f (time of sediment input)

Impact of land use on sedimentation
• Impact of seasonal changes/ different types of land use on sedimentation?
• Degree of uncertainties concerning calculated deposition masses due to estimation of roughness parameters?
Simulations with varying roughness distributions within green flood retention reservoir
Range of amount and pattern of deposited sediments

kstr=10–25 m1/³/srandom 1
kstr=10–25 m1/³/srandom 2
kstr=10 m1/³/s kstr=20 m1/³/s kstr=35 m1/³/s
Deposition:46.0 %
Deposition:45.6 %
Deposition:43.5 %
Deposition:45.3 %
Deposition:46.0 %
grain fraction d = 20 µmSimulations with varying roughness distributions

kstr=10–25 m1/³/srandom 1
kstr=10–25 m1/³/srandom 2
kstr=10 m1/³/s kstr=20 m1/³/s kstr=35 m1/³/s
Deposition:63.0 %
Deposition:63.4 %
Deposition:57.2 %
Deposition:58.1 %
Deposition:63.4 %
grain fraction d = 150 µm

Conclusions
• Effectiveness of sediment retention in green flood retention reservoirs strongly depends on the combination of grain size and reservoir shape
• The bigger the grain size, the smaller the area of deposition and the smaller the impact of shape and land use on sedimentation pattern and masses
• One mean value is not suitable for the description for the effectiveness of sediment retention for a given reservoir due to the strong dependence on time of sediment input
• Different shaped reservoirs have their maximum effectiveness of sediment retention at different stages of filling (knowledge is important for an adaptive reservoir operation)
• The short circuit of suspended sediment flow reduces the effectiveness of sediment retention enormously, this can be influenced by modified operation or reservoir design
• Land use has only a small influence on sedimentation, modelling errors due to rough estimation of parameters are small

Thank you very much for your attention!