Embed Size (px)
Citation preview
Impact of renewable energies on markets and future design of
electricity markets
Dogan Keles, Andreas Bublitz, Wolf Fichtner
JRC- Smart Energy Regions
Prof. Fichtner, Lehrstuhl für Energiewirtschaft, IIP 2 Dogan Keles, 29.10.2013 2 Dogan Keles, JRC – Smart Energy Regions, 04/07/2016 Prof. Fichtner, Lehrstuhl für Energiewirtschaft, www.kit.edu
Agenda
Discussion about renewables and market design
Model overview
Input data and evaluation criterion
Results on investments, prices and load serving
Conclusions

Prof. Fichtner, Lehrstuhl für Energiewirtschaft, IIP 3 Dogan Keles, 29.10.2013 3 Dogan Keles, JRC – Smart Energy Regions, 04/07/2016 Prof. Fichtner, Lehrstuhl für Energiewirtschaft, www.kit.edu
Impact of renewables and other price drivers
Strong decline of wholesale electricity prices mainly driven by decreasing
coal and carbon price
Renewables have a growing price effect, reducing the earnings of power plants
Contribution to the price drop of wholesale electricity prices in 2011 - 2015:
Prof. Fichtner, Lehrstuhl für Energiewirtschaft, IIP 4 Dogan Keles, 29.10.2013 4 Dogan Keles, JRC – Smart Energy Regions, 04/07/2016 Prof. Fichtner, Lehrstuhl für Energiewirtschaft, www.kit.edu
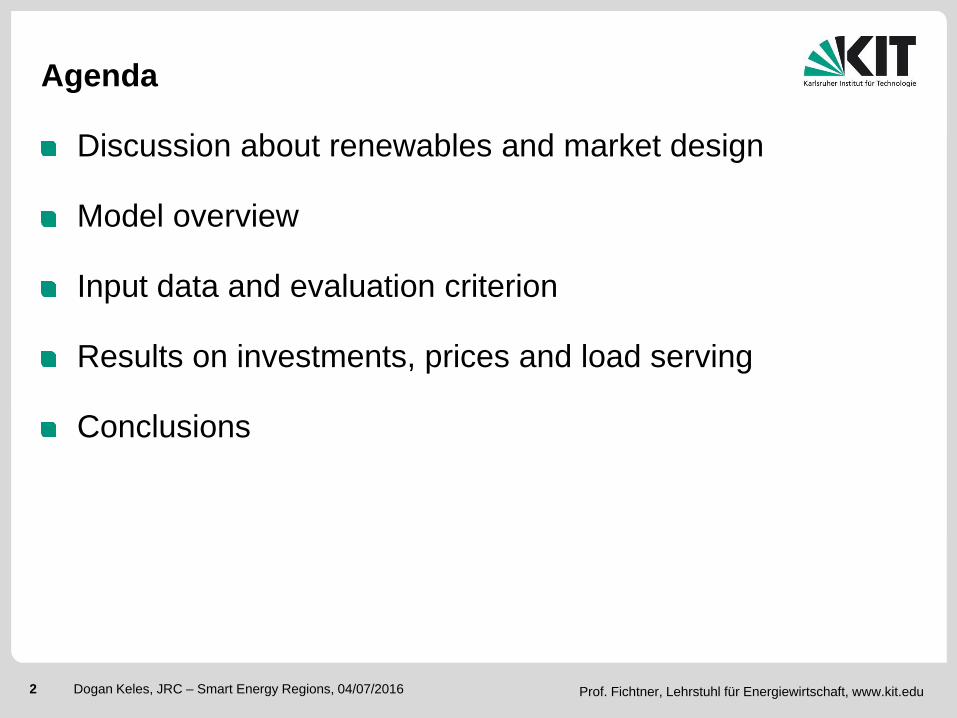
Current market design: Energy-only market (EOM) (day-ahead market, ...) only
short-term reserve power market
Price settlement at the day-ahead spot market and merit order effect
0 20 40 60 80 100
20
40
60
80
100
Angebot [GW]
Gre
nzko
ste
n [€
/MW
h]
0 20 40 60 80 100
20
40
60
80
100
Angebot [GW]
Gre
nzko
ste
n [€
/MW
h]
Merit order effect of renewable energies
Can the EOM incentivize new investments or is a capacity remuneration
mechanism necessary to ensure investments and thus to provide
generation adequacy
nuclear
lignite
coal
CCGT
gas
wind+PV
p1*
p2*
demand
supply
Marg
inal costs
[€
/MW
h]
Volume [GW]

Prof. Fichtner, Lehrstuhl für Energiewirtschaft, IIP 5 Dogan Keles, 29.10.2013 5 Dogan Keles, JRC – Smart Energy Regions, 04/07/2016 Prof. Fichtner, Lehrstuhl für Energiewirtschaft, www.kit.edu
Overview of discussed capacity mechanisms
Proposal
Strategic Reserve
(“Sicherheitsbereitschaft”)
(BMWi)
Centralized purchase of a strategic reserve (about
5% of peak load), e.g.by TSO
Dispatch, only of all other capacity is used, price
equal to pmax
No-way-back rule
Climate reserve (2.7GW of old lignite capacity)
Centralized capacity
market
(applied in New England,
PJM)
Comprehensive capacity market, open for all
technologies
Central purchaser (regulator, TSO)
Generators get capacity certificates according to
their secured capacity
Fluctuant RES have low capacity credits
Decentralized capacity
market
(VKU, BDEW -energy
suppliers)
Decentralized purchase of certificates by LSEs
and industry
Scarcity event leads to proof of certificates
Penalty for lack of certificates (3-4 times higher
than certificate prices)

Prof. Fichtner, Lehrstuhl für Energiewirtschaft, IIP 6 Dogan Keles, 29.10.2013 6 Dogan Keles, JRC – Smart Energy Regions, 04/07/2016 Prof. Fichtner, Lehrstuhl für Energiewirtschaft, www.kit.edu
Electric
utilities
Electricity
sellers Power plants
Investment
planer
Load profile
TSO
Renewable
load profiles
Bids
Results
Supply
Demand
/Supply
Electricity
buyers
Day-ahead market
Future market
Reserve markets
Supply
Capacity market
Sales
Demand
Demand
Electricity
buyers
Regulator
Bids
New power plants
Capacity payments
Demand
Market simulation model: PowerACE
Prof. Fichtner, Lehrstuhl für Energiewirtschaft, IIP 7 Dogan Keles, 29.10.2013 7 Dogan Keles, JRC – Smart Energy Regions, 04/07/2016 Prof. Fichtner, Lehrstuhl für Energiewirtschaft, www.kit.edu
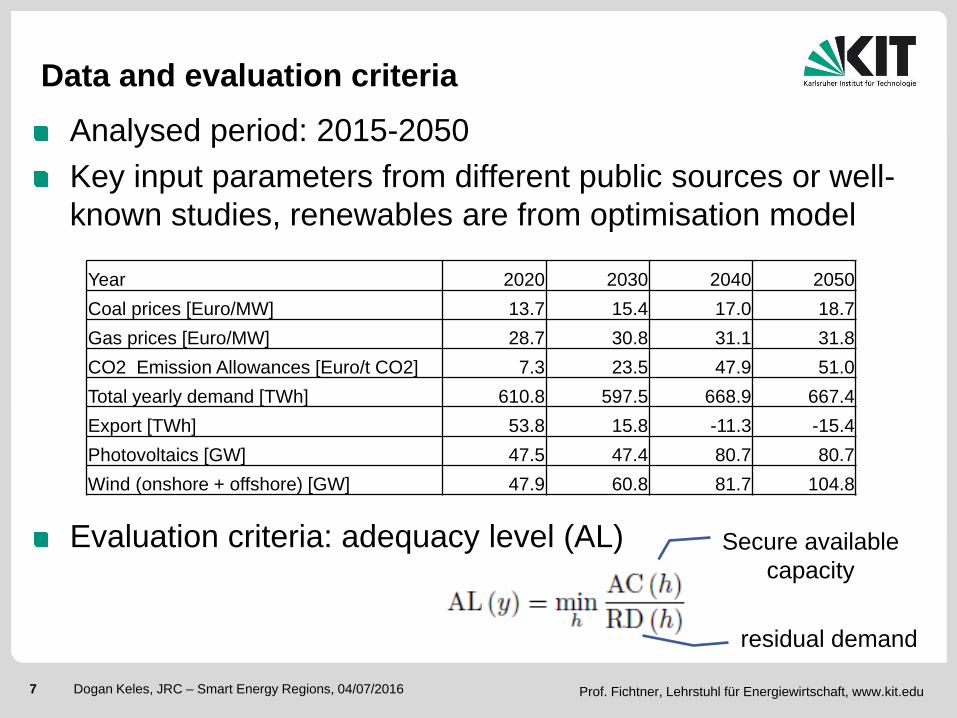
Data and evaluation criteria
Analysed period: 2015-2050
Key input parameters from different public sources or well-
known studies, renewables are from optimisation model
Evaluation criteria: adequacy level (AL)
Year 2020 2030 2040 2050
Coal prices [Euro/MW] 13.7 15.4 17.0 18.7
Gas prices [Euro/MW] 28.7 30.8 31.1 31.8
CO2 Emission Allowances [Euro/t CO2] 7.3 23.5 47.9 51.0
Total yearly demand [TWh] 610.8 597.5 668.9 667.4
Export [TWh] 53.8 15.8 -11.3 -15.4
Photovoltaics [GW] 47.5 47.4 80.7 80.7
Wind (onshore + offshore) [GW] 47.9 60.8 81.7 104.8
Secure available
capacity
residual demand

Prof. Fichtner, Lehrstuhl für Energiewirtschaft, IIP 8 Dogan Keles, 29.10.2013 8 Dogan Keles, JRC – Smart Energy Regions, 04/07/2016 Prof. Fichtner, Lehrstuhl für Energiewirtschaft, www.kit.edu
Selected results (Adequacy level)
After 2030 not all mechanism are able to satisfy the demand at all time
Influence of high price interruptible loads in EOM With 2.1 GW cannot be satisfied at all times, but with 8 GW interruptible loads
EOM is only with a strategic reserve of 5 GW delivering generation adequacy
0,95
1
1,05
1,1
1,15
1,2
1,25
1,3
2015 2020 2025 2030 2035 2040 2045 2050
Min
ima
l S
up
ply
Su
rplu
s r
ati
o
EOM, DSM-Konservativ
EOM, Flexibilitätsszenario
EOM, DSM-Konservativ + Strategische Reserve (5 GW)
Zentraler Kapazitätsmarkt
Dezentraler Kapazitätsmarkt
EOM, DSM low
EOM, DSM high
EOM, DSM low + SR
Central capacity market
Decentralized capacity Market
Prof. Fichtner, Lehrstuhl für Energiewirtschaft, IIP 9 Dogan Keles, 29.10.2013 9 Dogan Keles, JRC – Smart Energy Regions, 04/07/2016 Prof. Fichtner, Lehrstuhl für Energiewirtschaft, www.kit.edu
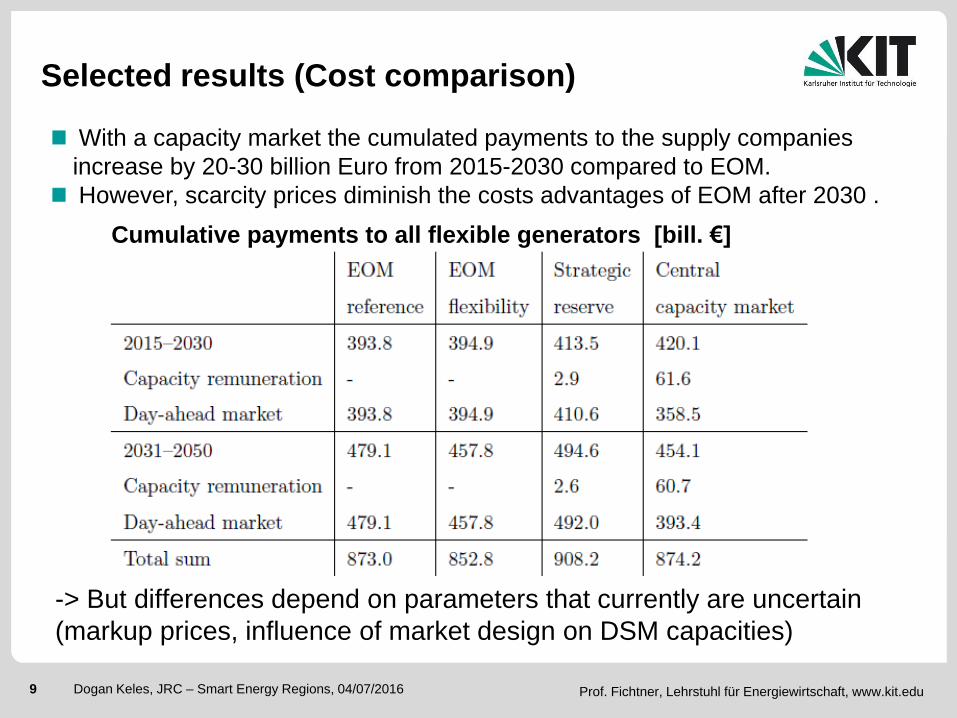
Selected results (Cost comparison)
With a capacity market the cumulated payments to the supply companies
increase by 20-30 billion Euro from 2015-2030 compared to EOM.
However, scarcity prices diminish the costs advantages of EOM after 2030 .
Cumulative payments to all flexible generators [bill. €]
-> But differences depend on parameters that currently are uncertain
(markup prices, influence of market design on DSM capacities)
Prof. Fichtner, Lehrstuhl für Energiewirtschaft, IIP 10 Dogan Keles, 29.10.2013 10 Dogan Keles, JRC – Smart Energy Regions, 04/07/2016 Prof. Fichtner, Lehrstuhl für Energiewirtschaft, www.kit.edu
Conclusions
Differences between EOM and capacity market in the investments in
conventional power plant capacity
EOM cannot guarantee the generation adequacy in several hours in
the long-term, only if interruptible loads or strategic reserve are
available
Capacity market will meet requirements with adequate
parameterization, mainly due to additional gas-fired power plants
but: surplus capacities possible
Recommendation:
EOM with strategic reserve in the short-term
Capacity market in the long-term
Prof. Fichtner, Lehrstuhl für Energiewirtschaft, IIP 11 Dogan Keles, 29.10.2013 11 Dogan Keles, JRC – Smart Energy Regions, 04/07/2016 Prof. Fichtner, Lehrstuhl für Energiewirtschaft, www.kit.edu
Thank you…
Contact: [email protected]
Prof. Fichtner, Lehrstuhl für Energiewirtschaft, IIP 12 Dogan Keles, 29.10.2013 12 Dogan Keles, JRC – Smart Energy Regions, 04/07/2016 Prof. Fichtner, Lehrstuhl für Energiewirtschaft, www.kit.edu
Backup

Prof. Fichtner, Lehrstuhl für Energiewirtschaft, IIP 13 Dogan Keles, 29.10.2013 13 Dogan Keles, JRC – Smart Energy Regions, 04/07/2016 Prof. Fichtner, Lehrstuhl für Energiewirtschaft, www.kit.edu
Discussion about the German market design
Reason: concern about security of supply, currently increased number of
decommissions of thermal capacities, yet only few new investments
Concern that the energy-only-market will not provide insufficient investment
incentives
Uncertainty regarding the design of a capacity mechanism in detail
objective
Elimination of local bottlenecks
Providing sufficient capacity
at peak load times
conversion of the energy system towards more
flexibility
Analysis of market design options to ensure security of supply
Prof. Fichtner, Lehrstuhl für Energiewirtschaft, IIP 14 Dogan Keles, 29.10.2013 14 Dogan Keles, JRC – Smart Energy Regions, 04/07/2016 Prof. Fichtner, Lehrstuhl für Energiewirtschaft, www.kit.edu
Methodological approach
Identification of market design options that are relevant for the German
electricity market
Implementation and simulation of the different design options with the agent-
based simulation model PowerACE
Impact analysis of the capacity mechanism on the development of production
capacities, electricity prices until 2050
Comparison with EOM
Analysis of the question: Is Interruption of load serving or market failure
possible due to lack of capacities?
Prof. Fichtner, Lehrstuhl für Energiewirtschaft, IIP 15 Dogan Keles, 29.10.2013 15 Dogan Keles, JRC – Smart Energy Regions, 04/07/2016 Prof. Fichtner, Lehrstuhl für Energiewirtschaft, www.kit.edu
Strategic Reserve
Auction
Yearly auction for upcoming year
Volume 5 GW
(about 5% of the total thermal capacities in Germany)
Single-price auction, selection of bids via capacity price
Maximum price equals CONE
Usage
If day-ahead market cannot be cleared, full capacity of strategic reserve is
offered at maximum market price (3000 Euro/MWh)
Variable costs are reimbursed to power plant owners, profits remain with
regulator
Participating power plants
Technical requirements: Power plants need to be available 10 h after
request
Power plants once in the strategic reserve are not allowed to participate in
other markets (no-way-back)
Prof. Fichtner, Lehrstuhl für Energiewirtschaft, IIP 16 Dogan Keles, 29.10.2013 16 Dogan Keles, JRC – Smart Energy Regions, 04/07/2016 Prof. Fichtner, Lehrstuhl für Energiewirtschaft, www.kit.edu
Decentralized capacity mechanism
Auction
Price and volume determined by market players
Willing to pay for certificates depends on expected penalty and scarcity
expectation
In case of surplus capacities, price can drop to zero
Regulator
Issue certificates to power plant owners
Check if consumers have enough certificates, in case of trigger event e.g.
price or market scarcity reaches a certain predetermined level
If customers require more electricity than their certificates allow them to do,
they have to pay a penalty (a multiple of the certificate price)
Prof. Fichtner, Lehrstuhl für Energiewirtschaft, IIP 17 Dogan Keles, 29.10.2013 17 Dogan Keles, JRC – Smart Energy Regions, 04/07/2016 Prof. Fichtner, Lehrstuhl für Energiewirtschaft, www.kit.edu
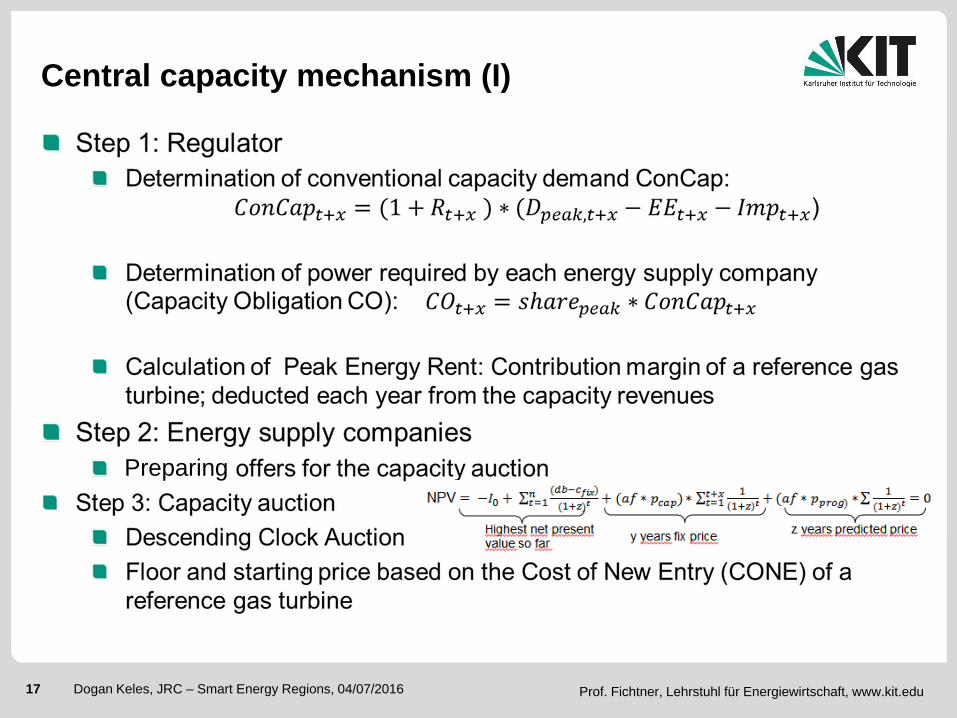
Central capacity mechanism (I)
Preparing

Prof. Fichtner, Lehrstuhl für Energiewirtschaft, IIP 18 Dogan Keles, 29.10.2013 18 Dogan Keles, JRC – Smart Energy Regions, 04/07/2016 Prof. Fichtner, Lehrstuhl für Energiewirtschaft, www.kit.edu
Descending Clock Auction
Surplus
Start price
P1
P2
P3
P4
P5
P6
P7 MCP
Round 1
Volume (MW)
Price (€/MW)
Round 2
Round 3
Starting price = 2 * CONE
MCP: Market clearing price
Central capacity mechanism (II)
Prof. Fichtner, Lehrstuhl für Energiewirtschaft, IIP 19 Dogan Keles, 29.10.2013 19 Dogan Keles, JRC – Smart Energy Regions, 04/07/2016 Prof. Fichtner, Lehrstuhl für Energiewirtschaft, www.kit.edu
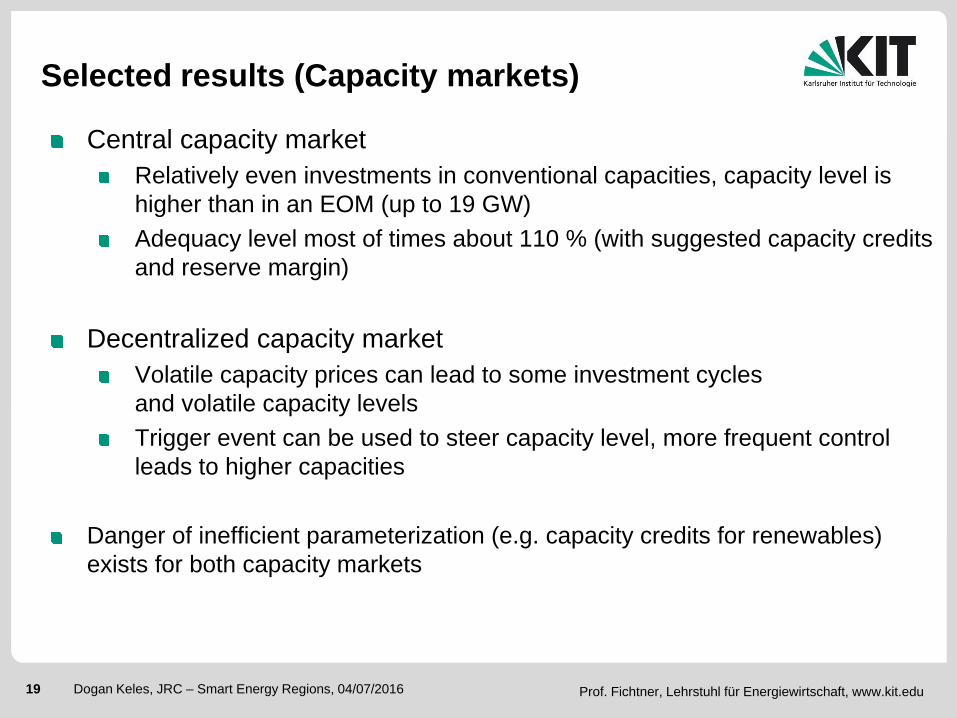
Selected results (Capacity markets)
Central capacity market
Relatively even investments in conventional capacities, capacity level is
higher than in an EOM (up to 19 GW)
Adequacy level most of times about 110 % (with suggested capacity credits
and reserve margin)
Decentralized capacity market
Volatile capacity prices can lead to some investment cycles
and volatile capacity levels
Trigger event can be used to steer capacity level, more frequent control
leads to higher capacities
Danger of inefficient parameterization (e.g. capacity credits for renewables)
exists for both capacity markets
Prof. Fichtner, Lehrstuhl für Energiewirtschaft, IIP 20 Dogan Keles, 29.10.2013 20 Dogan Keles, JRC – Smart Energy Regions, 04/07/2016 Prof. Fichtner, Lehrstuhl für Energiewirtschaft, www.kit.edu
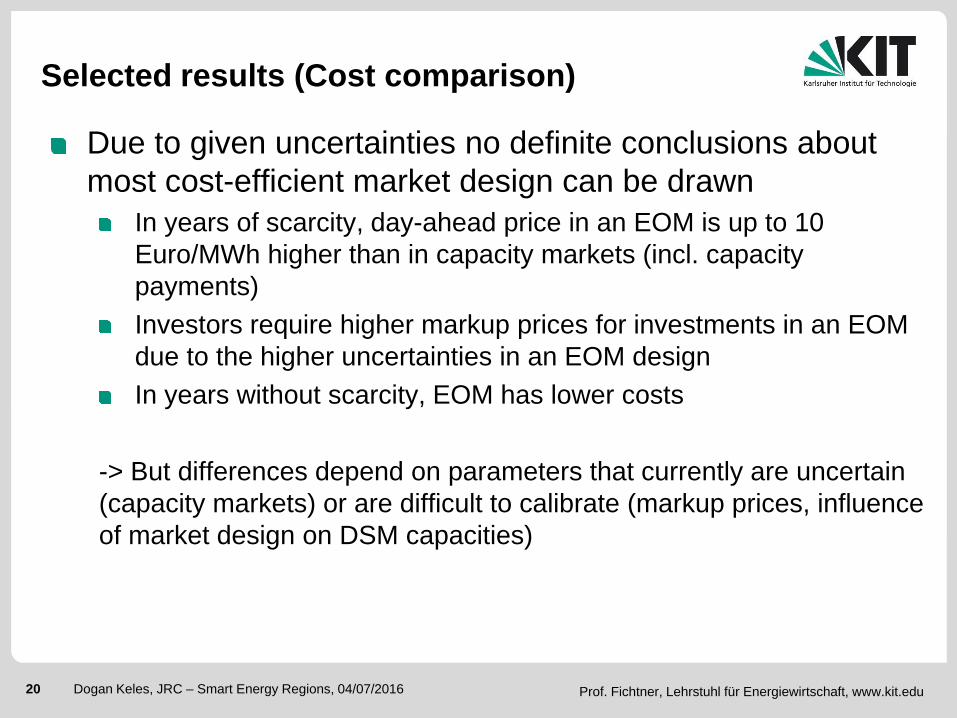
Selected results (Cost comparison)
Due to given uncertainties no definite conclusions about
most cost-efficient market design can be drawn
In years of scarcity, day-ahead price in an EOM is up to 10
Euro/MWh higher than in capacity markets (incl. capacity
payments)
Investors require higher markup prices for investments in an EOM
due to the higher uncertainties in an EOM design
In years without scarcity, EOM has lower costs
-> But differences depend on parameters that currently are uncertain
(capacity markets) or are difficult to calibrate (markup prices, influence
of market design on DSM capacities)

Prof. Fichtner, Lehrstuhl für Energiewirtschaft, IIP 21 Dogan Keles, 29.10.2013 21 Dogan Keles, JRC – Smart Energy Regions, 04/07/2016 Prof. Fichtner, Lehrstuhl für Energiewirtschaft, www.kit.edu
Outlook
Integration of the European perspective
e.g. influence of French capacity market on the German market
Influence of extreme weather conditions
Consideration of grid restrictions and regional security of supply
Adapt capacity mechanism to real world developments e.g. strategic
reserve that is to be implemented
Prof. Fichtner, Lehrstuhl für Energiewirtschaft, IIP 22 Dogan Keles, 29.10.2013 22 Dogan Keles, JRC – Smart Energy Regions, 04/07/2016 Prof. Fichtner, Lehrstuhl für Energiewirtschaft, www.kit.edu
Energy-Only-Markt (EOM)
Prof. Fichtner, Lehrstuhl für Energiewirtschaft, IIP 23 Dogan Keles, 29.10.2013 23 Dogan Keles, JRC – Smart Energy Regions, 04/07/2016 Prof. Fichtner, Lehrstuhl für Energiewirtschaft, www.kit.edu
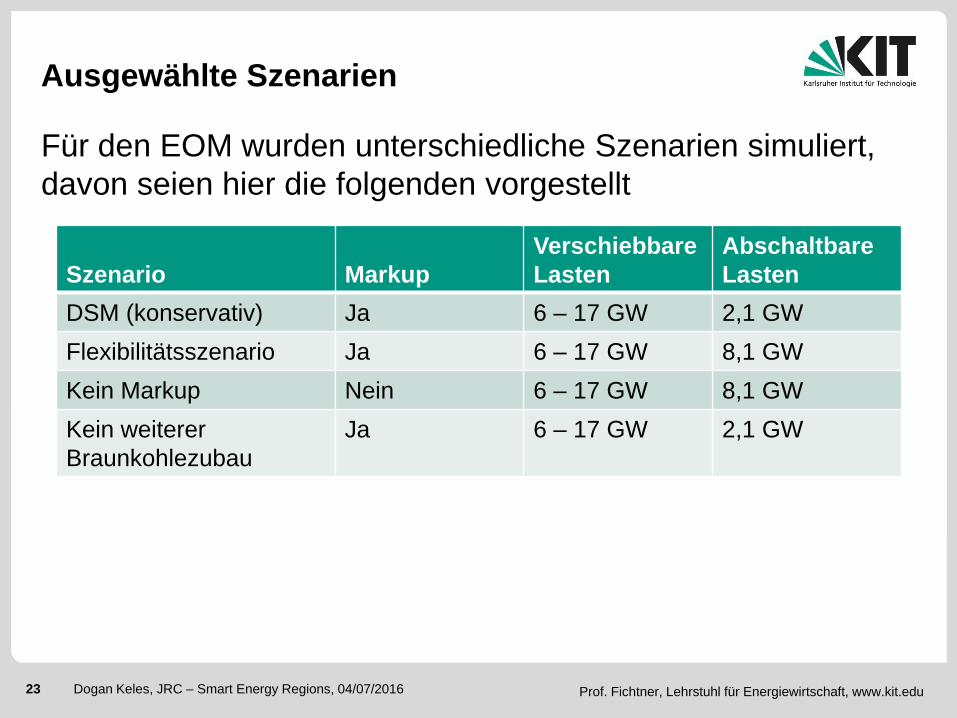
Ausgewählte Szenarien
Für den EOM wurden unterschiedliche Szenarien simuliert,
davon seien hier die folgenden vorgestellt
Szenario Markup
Verschiebbare
Lasten
Abschaltbare
Lasten
DSM (konservativ) Ja 6 – 17 GW 2,1 GW
Flexibilitätsszenario Ja 6 – 17 GW 8,1 GW
Kein Markup Nein 6 – 17 GW 8,1 GW
Kein weiterer
Braunkohlezubau
Ja 6 – 17 GW 2,1 GW
Prof. Fichtner, Lehrstuhl für Energiewirtschaft, IIP 24 Dogan Keles, 29.10.2013 24 Dogan Keles, JRC – Smart Energy Regions, 04/07/2016 Prof. Fichtner, Lehrstuhl für Energiewirtschaft, www.kit.edu
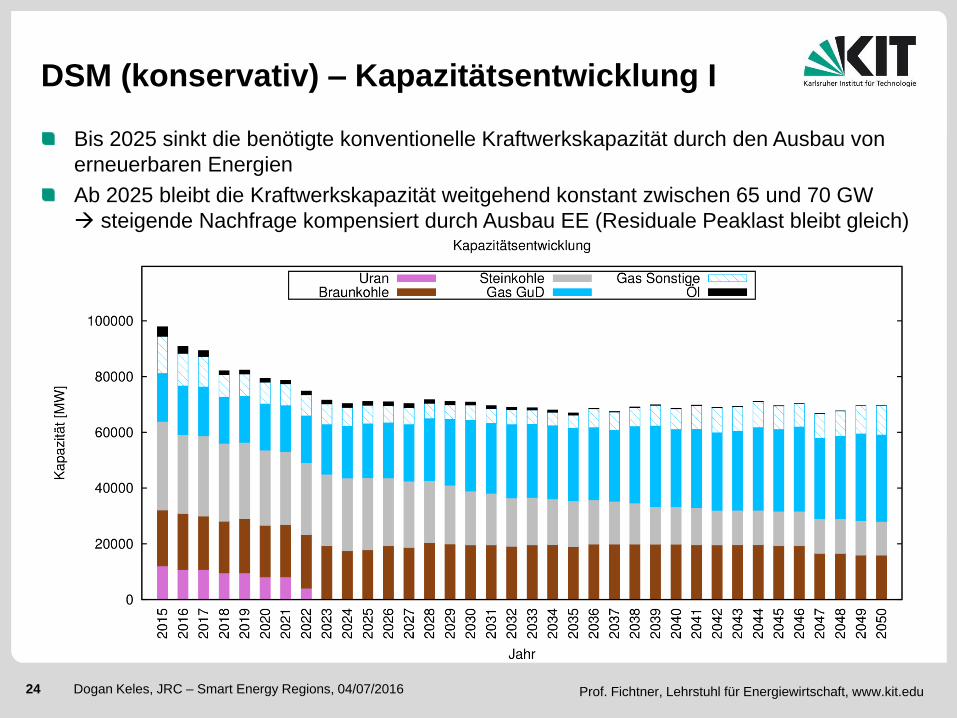
Bis 2025 sinkt die benötigte konventionelle Kraftwerkskapazität durch den Ausbau von
erneuerbaren Energien
Ab 2025 bleibt die Kraftwerkskapazität weitgehend konstant zwischen 65 und 70 GW
steigende Nachfrage kompensiert durch Ausbau EE (Residuale Peaklast bleibt gleich)
DSM (konservativ) – Kapazitätsentwicklung I
Prof. Fichtner, Lehrstuhl für Energiewirtschaft, IIP 25 Dogan Keles, 29.10.2013 25 Dogan Keles, JRC – Smart Energy Regions, 04/07/2016 Prof. Fichtner, Lehrstuhl für Energiewirtschaft, www.kit.edu
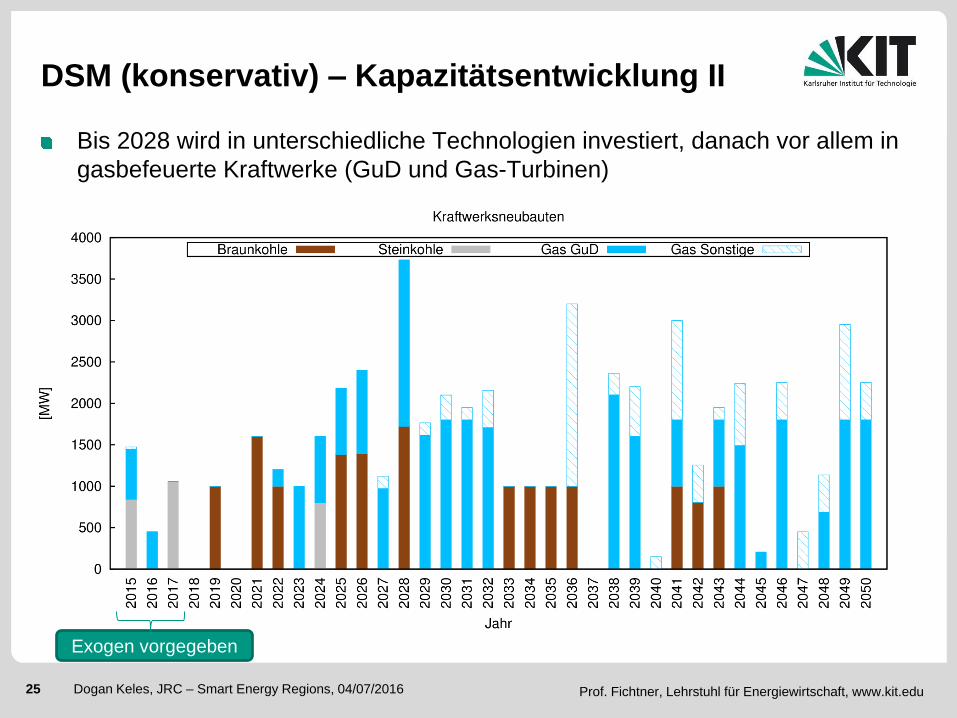
DSM (konservativ) – Kapazitätsentwicklung II
Bis 2028 wird in unterschiedliche Technologien investiert, danach vor allem in
gasbefeuerte Kraftwerke (GuD und Gas-Turbinen)
Exogen vorgegeben
Prof. Fichtner, Lehrstuhl für Energiewirtschaft, IIP 26 Dogan Keles, 29.10.2013 26 Dogan Keles, JRC – Smart Energy Regions, 04/07/2016 Prof. Fichtner, Lehrstuhl für Energiewirtschaft, www.kit.edu
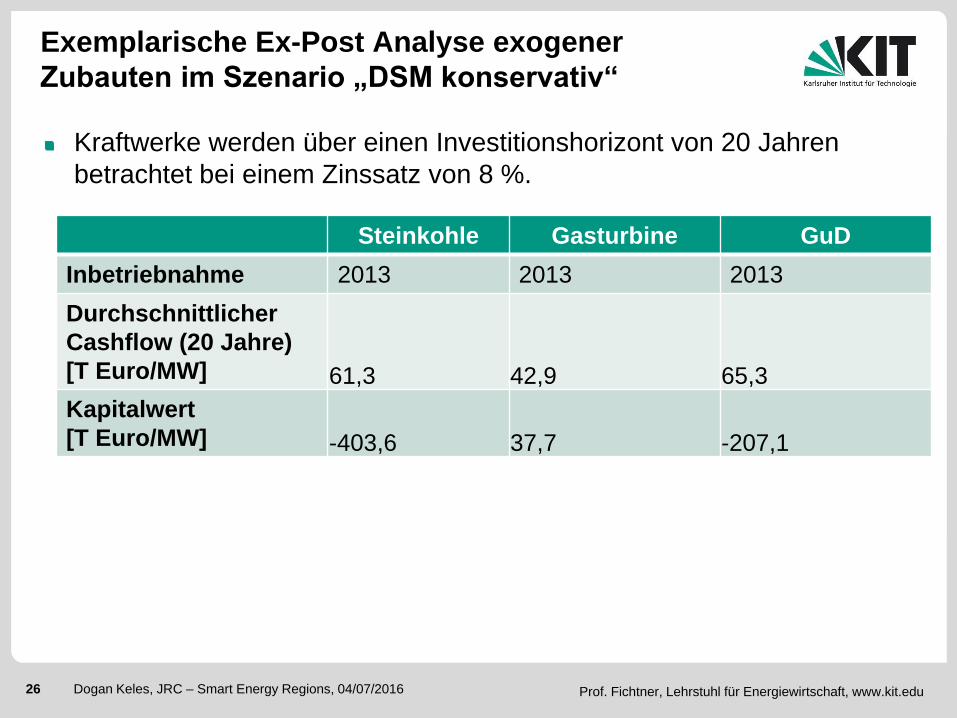
Exemplarische Ex-Post Analyse exogener
Zubauten im Szenario „DSM konservativ“
Kraftwerke werden über einen Investitionshorizont von 20 Jahren
betrachtet bei einem Zinssatz von 8 %.
Steinkohle Gasturbine GuD
Inbetriebnahme 2013 2013 2013
Durchschnittlicher
Cashflow (20 Jahre)
[T Euro/MW] 61,3 42,9 65,3
Kapitalwert
[T Euro/MW] -403,6 37,7 -207,1
Prof. Fichtner, Lehrstuhl für Energiewirtschaft, IIP 27 Dogan Keles, 29.10.2013 27 Dogan Keles, JRC – Smart Energy Regions, 04/07/2016 Prof. Fichtner, Lehrstuhl für Energiewirtschaft, www.kit.edu
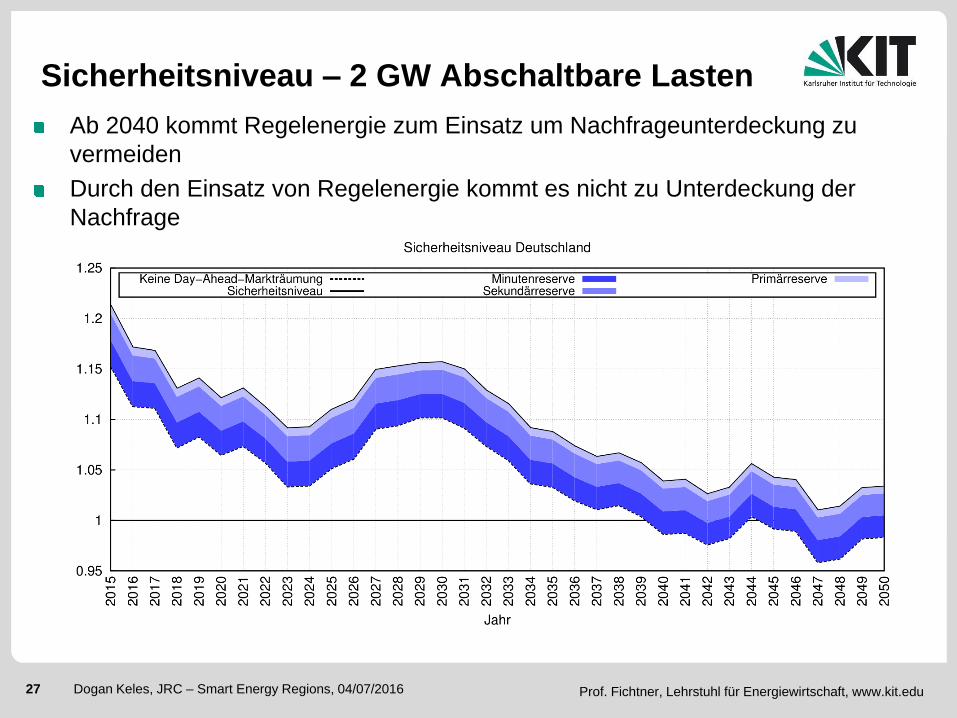
Sicherheitsniveau – 2 GW Abschaltbare Lasten
Ab 2040 kommt Regelenergie zum Einsatz um Nachfrageunterdeckung zu
vermeiden
Durch den Einsatz von Regelenergie kommt es nicht zu Unterdeckung der
Nachfrage

Prof. Fichtner, Lehrstuhl für Energiewirtschaft, IIP 28 Dogan Keles, 29.10.2013 28 Dogan Keles, JRC – Smart Energy Regions, 04/07/2016 Prof. Fichtner, Lehrstuhl für Energiewirtschaft, www.kit.edu
Sicherheitsniveau – 8 GW Abschaltbare Lasten
Nur 2047 kommt Regelenergie zum Einsatz um Nachfrageunterdeckung zu
vermeiden
Mit Einsatz von Regelenergie kommt es nicht zu Unterdeckung der Nachfrage
Prof. Fichtner, Lehrstuhl für Energiewirtschaft, IIP 29 Dogan Keles, 29.10.2013 29 Dogan Keles, JRC – Smart Energy Regions, 04/07/2016 Prof. Fichtner, Lehrstuhl für Energiewirtschaft, www.kit.edu
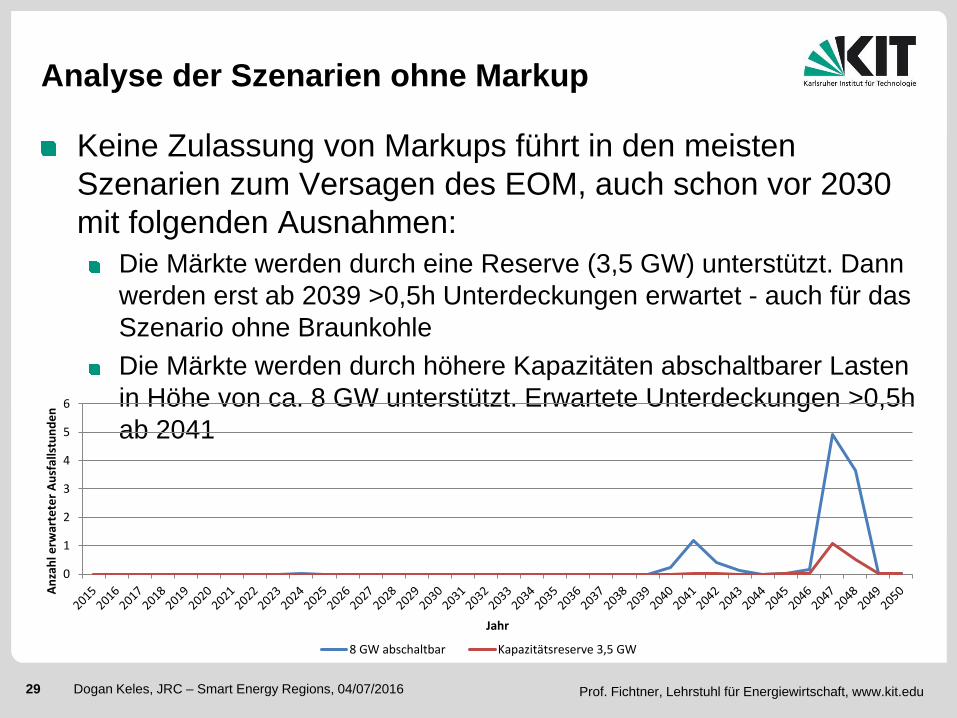
Analyse der Szenarien ohne Markup
Keine Zulassung von Markups führt in den meisten
Szenarien zum Versagen des EOM, auch schon vor 2030
mit folgenden Ausnahmen:
Die Märkte werden durch eine Reserve (3,5 GW) unterstützt. Dann
werden erst ab 2039 >0,5h Unterdeckungen erwartet - auch für das
Szenario ohne Braunkohle
Die Märkte werden durch höhere Kapazitäten abschaltbarer Lasten
in Höhe von ca. 8 GW unterstützt. Erwartete Unterdeckungen >0,5h
ab 2041
0
1
2
3
4
5
6
An
zah
l erw
arte
ter
Au
sfal
lstu
nd
en
Jahr
8 GW abschaltbar Kapazitätsreserve 3,5 GW

Prof. Fichtner, Lehrstuhl für Energiewirtschaft, IIP 30 Dogan Keles, 29.10.2013 30 Dogan Keles, JRC – Smart Energy Regions, 04/07/2016 Prof. Fichtner, Lehrstuhl für Energiewirtschaft, www.kit.edu
Kapazitätsentwicklung ohne Braunkohlezubau
Mit 2 GW abschaltbaren Lasten
Neuinvestitionen erfolgen nur in gas-befeuerte Kraftwerke
Prof. Fichtner, Lehrstuhl für Energiewirtschaft, IIP 31 Dogan Keles, 29.10.2013 31 Dogan Keles, JRC – Smart Energy Regions, 04/07/2016 Prof. Fichtner, Lehrstuhl für Energiewirtschaft, www.kit.edu
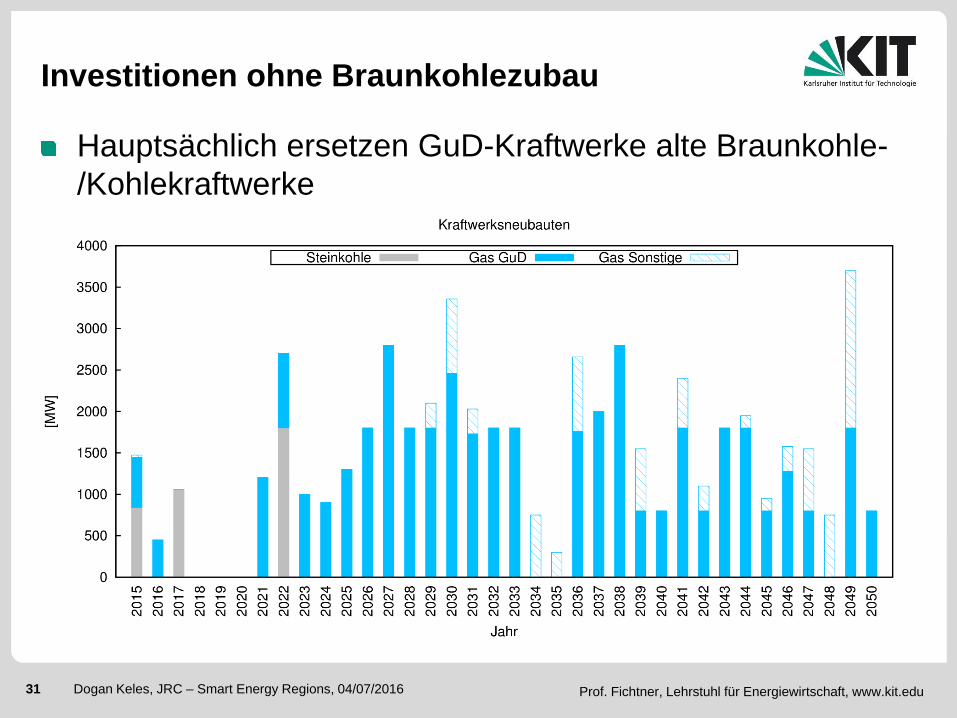
Investitionen ohne Braunkohlezubau
Hauptsächlich ersetzen GuD-Kraftwerke alte Braunkohle-
/Kohlekraftwerke
Prof. Fichtner, Lehrstuhl für Energiewirtschaft, IIP 32 Dogan Keles, 29.10.2013 32 Dogan Keles, JRC – Smart Energy Regions, 04/07/2016 Prof. Fichtner, Lehrstuhl für Energiewirtschaft, www.kit.edu
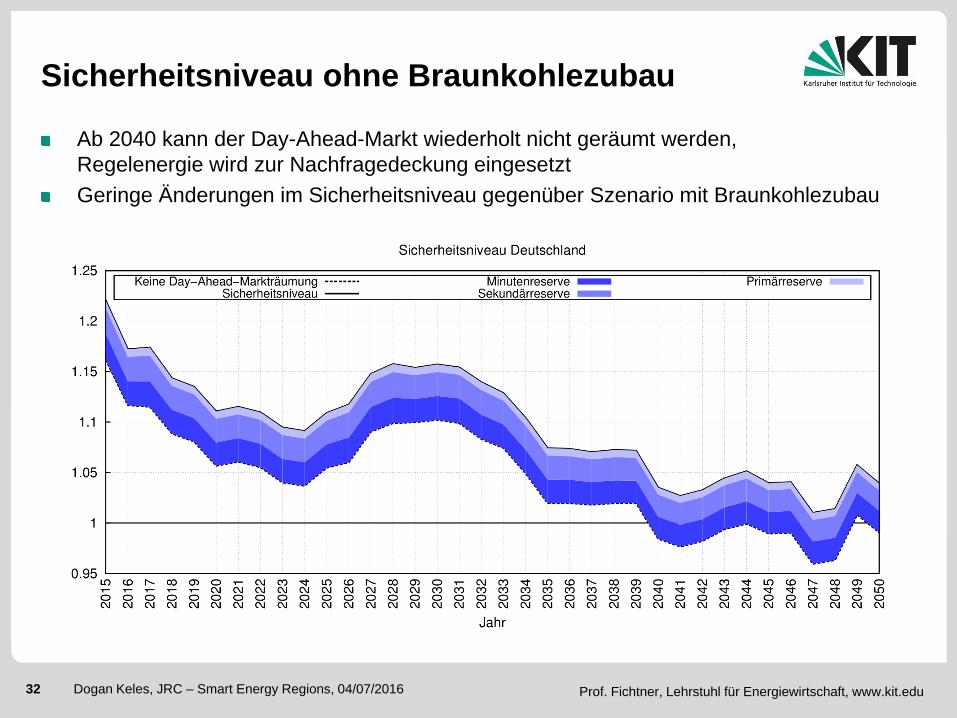
Sicherheitsniveau ohne Braunkohlezubau
Ab 2040 kann der Day-Ahead-Markt wiederholt nicht geräumt werden,
Regelenergie wird zur Nachfragedeckung eingesetzt
Geringe Änderungen im Sicherheitsniveau gegenüber Szenario mit Braunkohlezubau
Prof. Fichtner, Lehrstuhl für Energiewirtschaft, IIP 33 Dogan Keles, 29.10.2013 33 Dogan Keles, JRC – Smart Energy Regions, 04/07/2016 Prof. Fichtner, Lehrstuhl für Energiewirtschaft, www.kit.edu
Kapazitätsmechanismen

Prof. Fichtner, Lehrstuhl für Energiewirtschaft, IIP 34 Dogan Keles, 29.10.2013 34 Dogan Keles, JRC – Smart Energy Regions, 04/07/2016 Prof. Fichtner, Lehrstuhl für Energiewirtschaft, www.kit.edu
Es gehen hauptsächlich Öl- und Gaskraftwerke mit niedrigen Volllaststunden in die
Reserve (später auch Steinkohle)
Hauptsächlich Bestandskraftwerke und vereinzelt Neubauten
Reserve – Kapazitäten
Prof. Fichtner, Lehrstuhl für Energiewirtschaft, IIP 35 Dogan Keles, 29.10.2013 35 Dogan Keles, JRC – Smart Energy Regions, 04/07/2016 Prof. Fichtner, Lehrstuhl für Energiewirtschaft, www.kit.edu
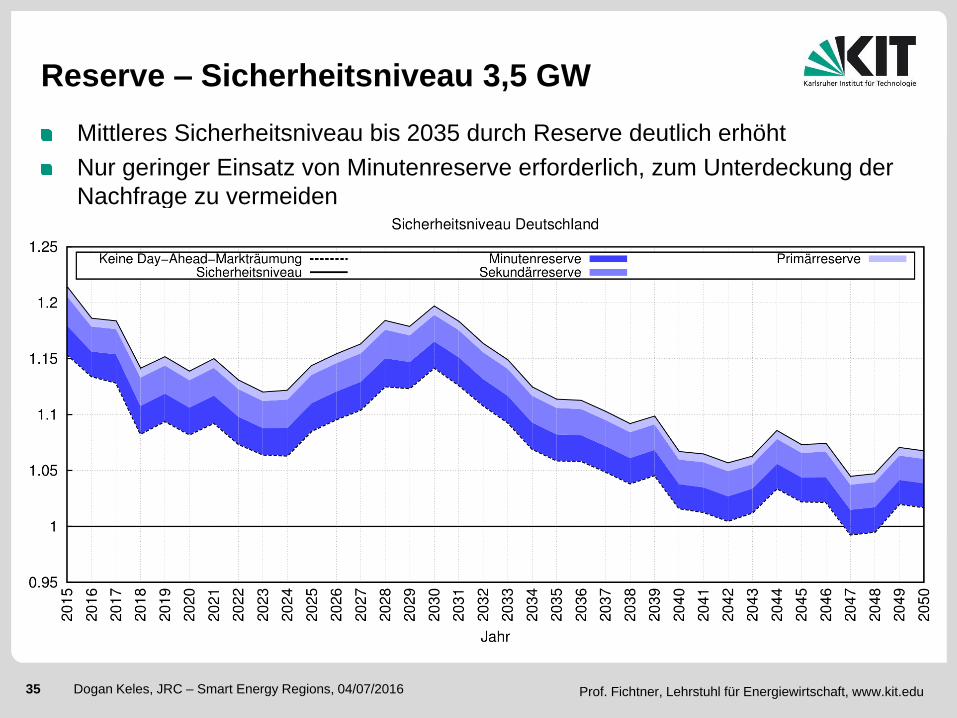
Reserve – Sicherheitsniveau 3,5 GW
Mittleres Sicherheitsniveau bis 2035 durch Reserve deutlich erhöht
Nur geringer Einsatz von Minutenreserve erforderlich, zum Unterdeckung der
Nachfrage zu vermeiden
Prof. Fichtner, Lehrstuhl für Energiewirtschaft, IIP 36 Dogan Keles, 29.10.2013 36 Dogan Keles, JRC – Smart Energy Regions, 04/07/2016 Prof. Fichtner, Lehrstuhl für Energiewirtschaft, www.kit.edu
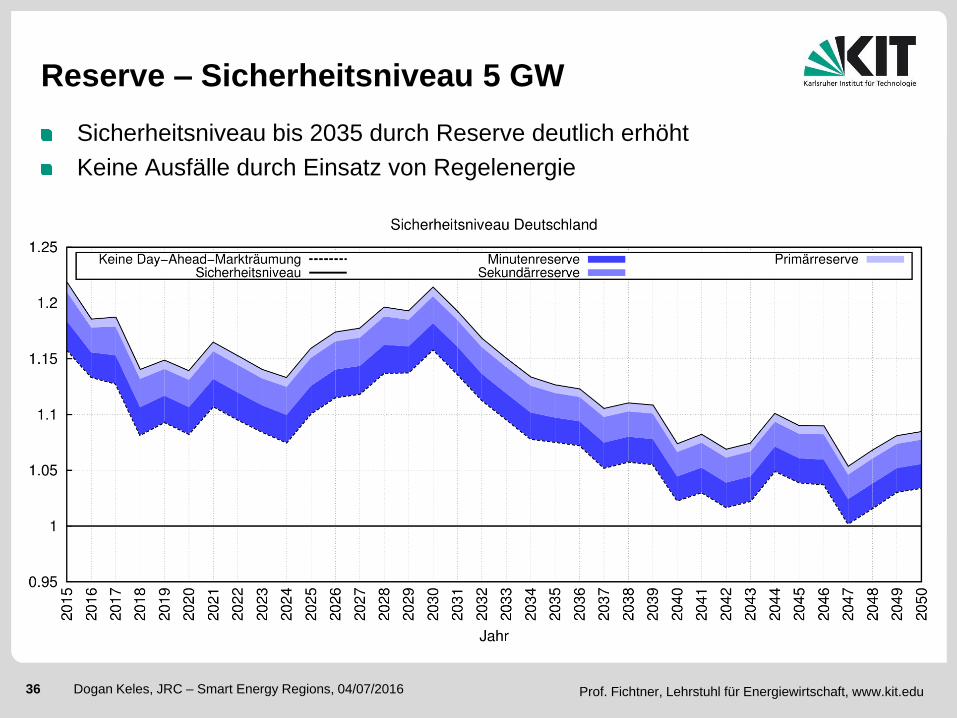
Reserve – Sicherheitsniveau 5 GW
Sicherheitsniveau bis 2035 durch Reserve deutlich erhöht
Keine Ausfälle durch Einsatz von Regelenergie
Prof. Fichtner, Lehrstuhl für Energiewirtschaft, IIP 37 Dogan Keles, 29.10.2013 37 Dogan Keles, JRC – Smart Energy Regions, 04/07/2016 Prof. Fichtner, Lehrstuhl für Energiewirtschaft, www.kit.edu
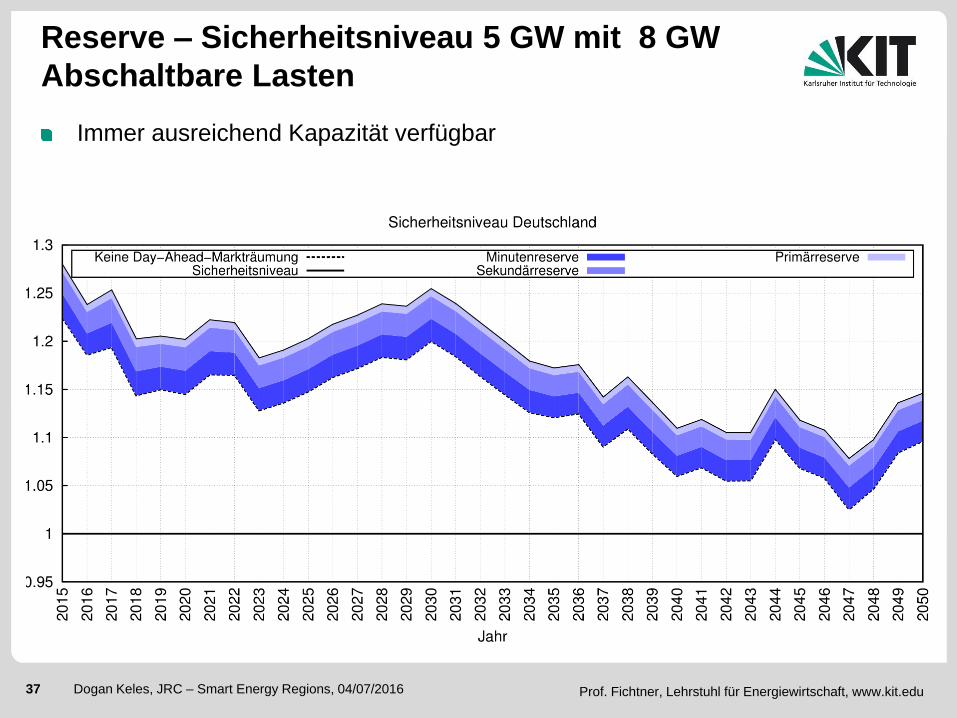
Reserve – Sicherheitsniveau 5 GW mit 8 GW
Abschaltbare Lasten
Immer ausreichend Kapazität verfügbar

Prof. Fichtner, Lehrstuhl für Energiewirtschaft, IIP 38 Dogan Keles, 29.10.2013 38 Dogan Keles, JRC – Smart Energy Regions, 04/07/2016 Prof. Fichtner, Lehrstuhl für Energiewirtschaft, www.kit.edu
Zentraler Kapazitätsmarkt

Prof. Fichtner, Lehrstuhl für Energiewirtschaft, IIP 39 Dogan Keles, 29.10.2013 39 Dogan Keles, JRC – Smart Energy Regions, 04/07/2016 Prof. Fichtner, Lehrstuhl für Energiewirtschaft, www.kit.edu
Kapazitätsentwicklung – LK niedrig
Reservemarge 5% EE-Leistungskredite: 1%PV, 6%Wind
Gleichmäßige Kapazitätsentwicklung in allen Szenarien mit zentralen Kapazitätsmarkt
Höheres Kapazitätsniveau im Vergleich zum EOM
Prof. Fichtner, Lehrstuhl für Energiewirtschaft, IIP 40 Dogan Keles, 29.10.2013 40 Dogan Keles, JRC – Smart Energy Regions, 04/07/2016 Prof. Fichtner, Lehrstuhl für Energiewirtschaft, www.kit.edu
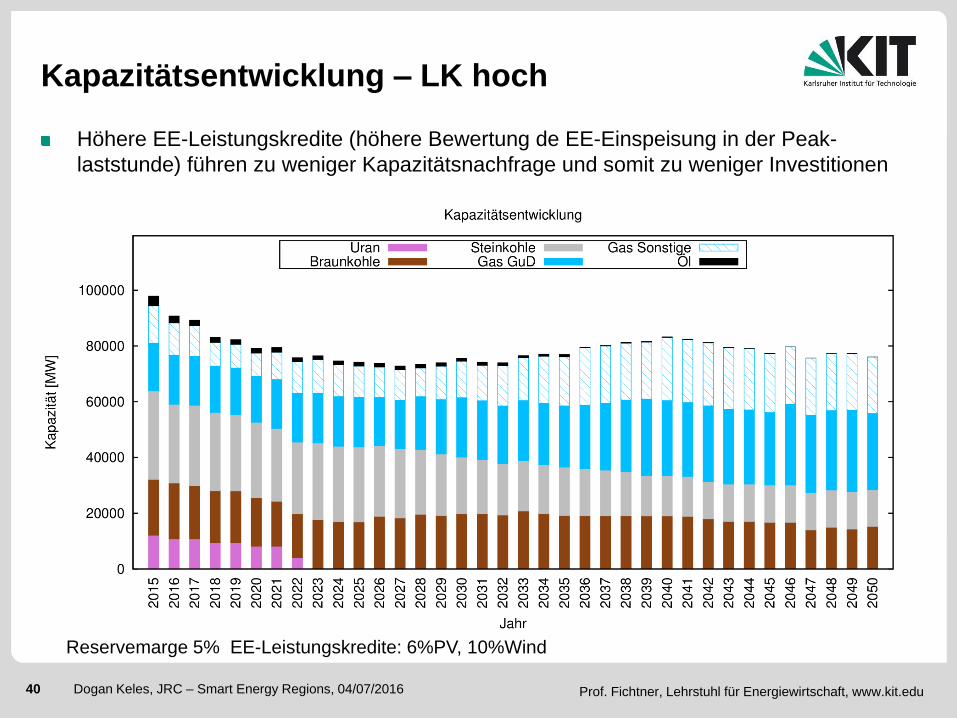
Kapazitätsentwicklung – LK hoch
Höhere EE-Leistungskredite (höhere Bewertung de EE-Einspeisung in der Peak-
laststunde) führen zu weniger Kapazitätsnachfrage und somit zu weniger Investitionen
Reservemarge 5% EE-Leistungskredite: 6%PV, 10%Wind
Prof. Fichtner, Lehrstuhl für Energiewirtschaft, IIP 41 Dogan Keles, 29.10.2013 41 Dogan Keles, JRC – Smart Energy Regions, 04/07/2016 Prof. Fichtner, Lehrstuhl für Energiewirtschaft, www.kit.edu
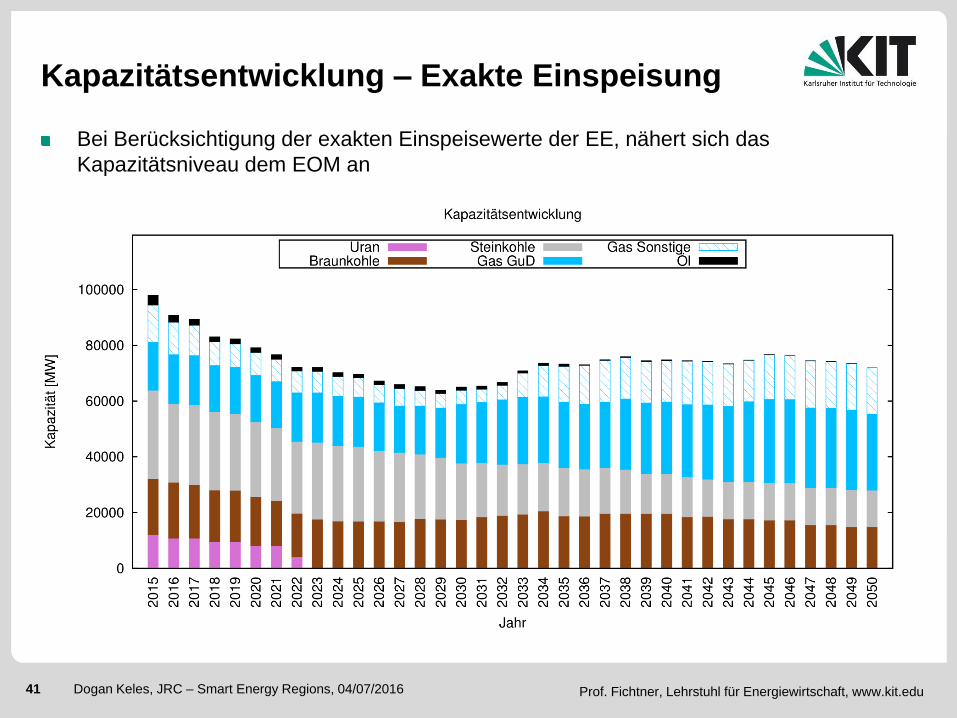
Kapazitätsentwicklung – Exakte Einspeisung
Bei Berücksichtigung der exakten Einspeisewerte der EE, nähert sich das
Kapazitätsniveau dem EOM an
Prof. Fichtner, Lehrstuhl für Energiewirtschaft, IIP 42 Dogan Keles, 29.10.2013 42 Dogan Keles, JRC – Smart Energy Regions, 04/07/2016 Prof. Fichtner, Lehrstuhl für Energiewirtschaft, www.kit.edu
Dezentraler Kapazitätsmarkt

Prof. Fichtner, Lehrstuhl für Energiewirtschaft, IIP 43 Dogan Keles, 29.10.2013 43 Dogan Keles, JRC – Smart Energy Regions, 04/07/2016 Prof. Fichtner, Lehrstuhl für Energiewirtschaft, www.kit.edu
Dezentraler Kapazitätsmarkt
Aufteilung der Nachfrageagenten in 3 Gruppen (risikoavers, -neutral, -freudig)
Gebotserstellung der Nachfrageagenten und Lerneffekte:
Prognosepreis entspricht dem CONE einer Gasturbine
Jeder Nachfrageagent hat einen persönlichen Risikofaktor, der die
Risikoeinstellung ausdrückt
Überwiegender Teil der Nachfrage ist risikoneutral
Anzahl der Jahre ohne Triggerereignis (Knappheit) wirkt sich auf die
Bereitschaft aus, Zertifikate zu beschaffen und damit auf den Gebotspreis
)*( rohneTriggeJahreLernfaktororRisikofakteisPrognoseprsGebotsprei
Prof. Fichtner, Lehrstuhl für Energiewirtschaft, IIP 44 Dogan Keles, 29.10.2013 44 Dogan Keles, JRC – Smart Energy Regions, 04/07/2016 Prof. Fichtner, Lehrstuhl für Energiewirtschaft, www.kit.edu
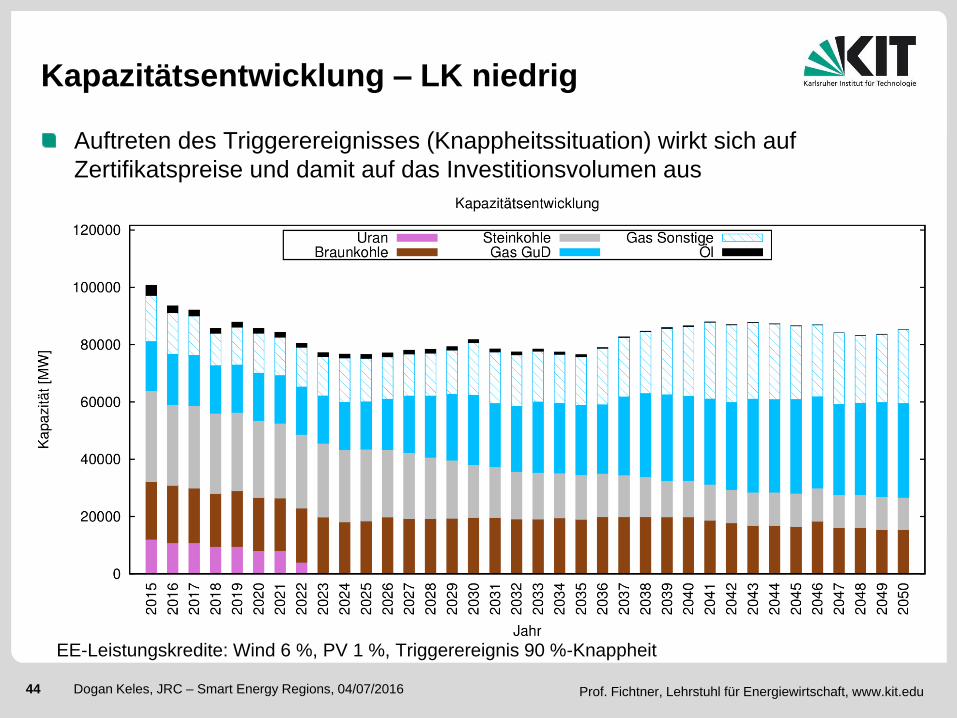
Auftreten des Triggerereignisses (Knappheitssituation) wirkt sich auf
Zertifikatspreise und damit auf das Investitionsvolumen aus
Kapazitätsentwicklung – LK niedrig
EE-Leistungskredite: Wind 6 %, PV 1 %, Triggerereignis 90 %-Knappheit