Embed Size (px)
Citation preview
2/22/2012
1
Impact of Processing and Genetics on Starch Digestibility
2012 VSFA / Cow College
Ralph Ward, President Cumberland Valley Analytical Services
Hagerstown, Maryland
Factors Affecting Starch Digestion In Cattle
•Endosperm/Genetics - How “vitreous” •Harvest and storage
- Maturity - Moisture - Particle size - Heat (interaction with moisture) - Enzyme use
•Processing
- Particle size
Starch availability in corn silage (Hoffman, 2008)
Factor Correlation with starch availability
Particle size -0.70
Moisture -0.53
Endosperm type -0.46
Grain particle size > Grain/silage moisture > Endosperm type
2/22/2012
2
The Problem
• How to characterize starch particle size
• How to characterize starch digestibility
• How to bring digestibility and particle size relationships together
• How to turn lab assays into routine commercial evaluations
• How to interpret results
The Problem
• To test it by invitro, we generally must process it, so: – Remove some but not all of the particle size
effects from the original sample
– We are attempting to look at vitreous characteristics
– But vitreousness will impact how it grinds and the resulting particle size
– So, we can’t really standardize particle size when grinding…
5
The Problem
• When we test for Starch Digestibility by in vitro, it is on sample milled to a certain size
• Particle size differences impact the digestibility results
• When attempting to establish an NIR equation for starch digestibility, you end up calibrating more on particle size than vitreousness.
• NIR evaluations of unknown samples are impacted by the grind of the sample presented to the NIR…
6

2/22/2012
3
The Problem
• We need a reliable surrogate measurement of starch degradability in the rumen
• There are different approaches
– In situ
– In vitro
– Gas production
– Enzymatic
7
8
Lutz, 2007
Corn Prolamin Content Classifications
9

2/22/2012
4
Relationship between Crude Protein and Prolamin in Corn Grain CVAS, 2011
y = 0.5041x - 0.3362 R² = 0.8787
N=40
3.0
3.5
4.0
4.5
5.0
5.5
6.0
7 7.5 8 8.5 9 9.5 10 10.5 11 11.5 12 12.5
Pro
lam
in
Crude Protein, %DM
Dry Ground Dry Rolled HMC Ground HMC Rolled
DM % 85 85 70 70
MPS microns 618 1725 489 1789
Ruminal Starch D, % 61 69 87 81
TT Starch D, % 89 76 98 96
Starch Digestibility of Corn Knowlton et al., JDS, 1998
Published Digestibility Coefficients for Starch Huntington, 1997
12

2/22/2012
5
In Vitro Starch Disappearance
• Corn grain IVSD kd varied from .09% to .16%/h
Corn Grain
0
10
20
30
40
50
60
70
80
90
100
0 12 24 36 48 60 72
Time (h)
IV S
tarc
h D
isa
pp
ea
ran
ce
(%
)
Average
Predicted
2SD High
2SD Low
In Vitro Starch Disappearance
• Corn silage IVSD varied from .16% to .37%/hr
Corn Silage
0
10
20
30
40
50
60
70
80
90
100
0 12 24 36 48 60 72
Time (h)
IV S
tarc
h D
isa
pp
ea
ran
ce
(%
)
Average
Predicted
2SD High
2SD Low
7 Hour In Vitro Starch Digestibility of Corn Silage, CVAS 2010-2011
0%
2%
4%
6%
8%
10%
12%
52
54
56
58
60
62
64
66
68
70
72
74
76
78
80
82
84
86
88
90
92
94
>94
% o
f Sa
mp
les
7hr Invitro Starch digestibility
N=2816 Ave. = 77.13
St. Dev. = 7.77

2/22/2012
6
7 Hour In Vitro Starch Digestibility for HM Corn Grain (CVAS, 2011)
0%
2%
4%
6%
8%
10%
12%
14%
16%
<46 50 54 58 62 66 70 74 78 82 86 90 94 >94
% o
f Sa
mp
les
7Hr. Starch Digestibility
N = 332 Ave. = 71.19
St. Dev. = 10.25
7 Hour In Vitro Starch Digestibility for Dry Corn CVAS, 2011
0%
2%
4%
6%
8%
10%
12%
<48 50 52 54 56 58 60 62 64 66 68 70 72 74 76 78 80 82 >84
% o
f Sa
mp
les
7Hr. Starch Digestibility
N = 394 Ave. = 64.77
St. Dev. = 9.11
Dry Corn Starch KD%/Hour CVAS, 2011
0%
2%
4%
6%
8%
10%
12%
<10 11 12 13 14 15 16 17 18 19 20 21 22 23 24 25 26 >27
% o
f Sa
mp
les
KD%/Hr
N = 394 Ave. = 16.58
St. Dev. = 4.14

2/22/2012
7
Corn Grain Starch KD%/Hour CVAS, 2011
0%
2%
4%
6%
8%
10%
12%
14%
16%
<10 12 14 16 18 20 22 24 26 28 30 32 34 >36
% o
f Sa
mp
les
KD%/Hr
N = 332 Ave. = 20.40
St. Dev. = 7.01
Corn Silage Starch KD%/Hour
0%
2%
4%
6%
8%
10%
12%
14%
16%
<12 14 16 18 20 22 24 26 28 30 32 34 36 38 40 42 44 >46
% o
f Sa
mp
les
KD%/Hr
N=2812 Ave. = 23.62
St. Dev. = 5.54
Ruminal Digestibility of Starch [kd/(kd+kp)]
Kd %hr
Kp %hr 0.05 0.10 0.15 0.20 0.25 0.3 0.35
0.02 0.714 0.833 0.882 0.909 0.926 0.938 0.946
0.04 0.556 0.714 0.789 0.833 0.862 0.882 0.897
0.06 0.455 0.625 0.714 0.769 0.806 0.833 0.854
0.08 0.385 0.556 0.652 0.714 0.758 0.789 0.814
0.10 0.333 0.500 0.600 0.667 0.714 0.750 0.778
0.12 0.294 0.455 0.556 0.625 0.676 0.714 0.745
0.14 0.263 0417 0.517 0.588 0.641 0.682 0.714
0.16 0.238 0.385 0.484 0.556 0.610 0.652 0.686
0.18 0.217 0357 0.455 0526 0.581 0.625 0.660
0.20 0.200 0.333 0.429 0.500 0.556 0.600 0.636
2/22/2012
8
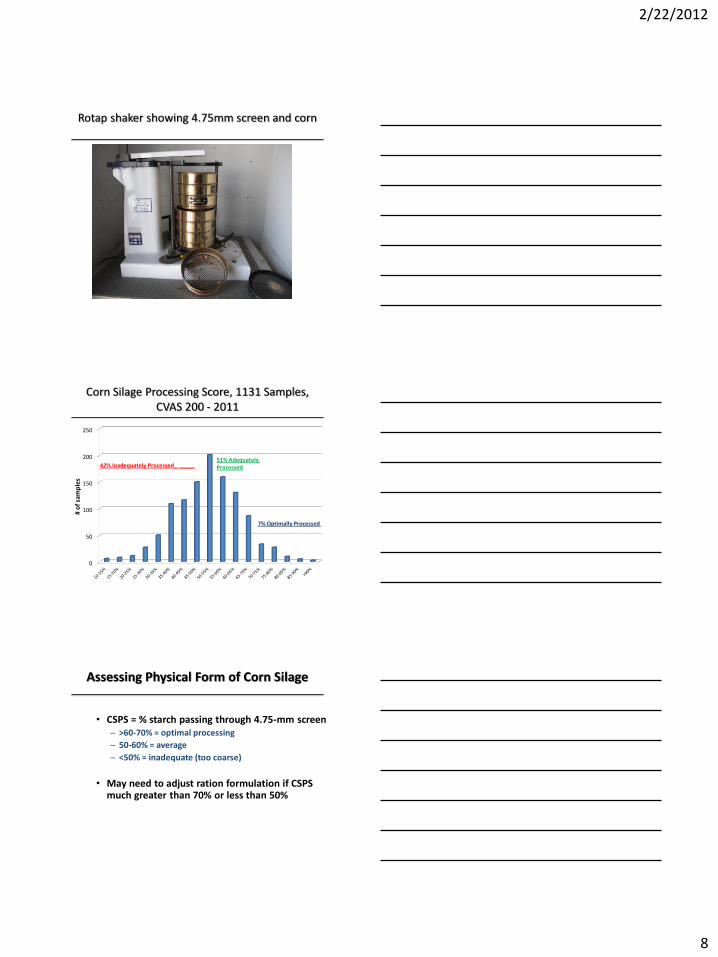
Rotap shaker showing 4.75mm screen and corn
0
50
100
150
200
250
# o
f sa
mp
les
51% Adequately Processed
42% Inadequately Processed_ _____
7% Optimally Processed
Corn Silage Processing Score, 1131 Samples, CVAS 200 - 2011
Assessing Physical Form of Corn Silage
• CSPS = % starch passing through 4.75-mm screen – >60-70% = optimal processing
– 50-60% = average
– <50% = inadequate (too coarse)
• May need to adjust ration formulation if CSPS much greater than 70% or less than 50%
2/22/2012
9
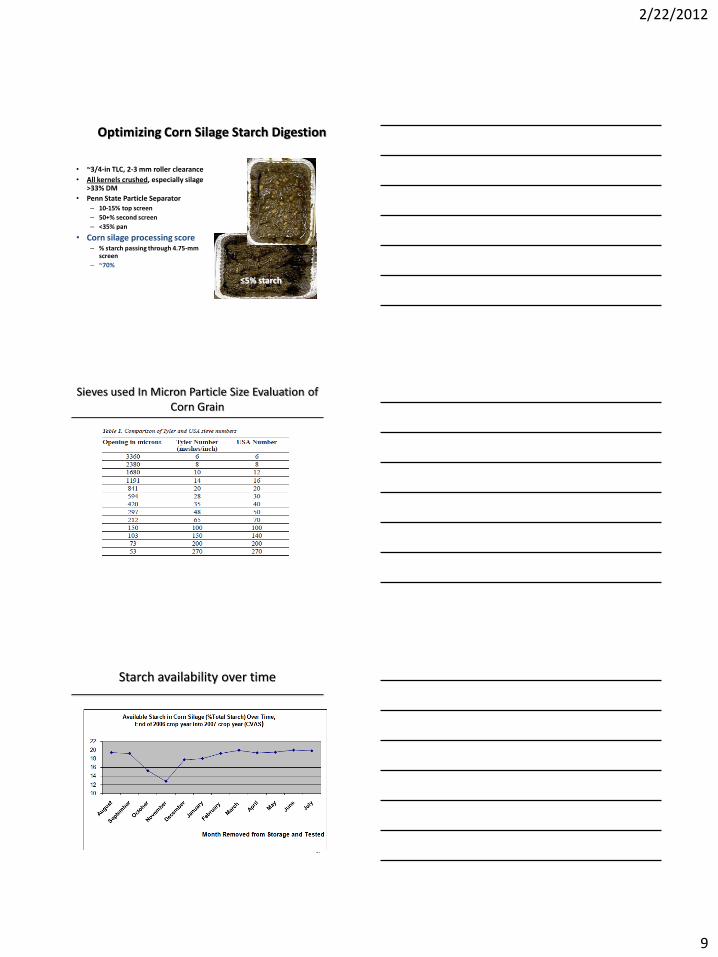
Optimizing Corn Silage Starch Digestion
• ~3/4-in TLC, 2-3 mm roller clearance
• All kernels crushed, especially silage >33% DM
• Penn State Particle Separator – 10-15% top screen
– 50+% second screen
– <35% pan
• Corn silage processing score – % starch passing through 4.75-mm
screen
– ~70%
≤5% starch
Sieves used In Micron Particle Size Evaluation of Corn Grain
Starch availability over time
27
2/22/2012
10
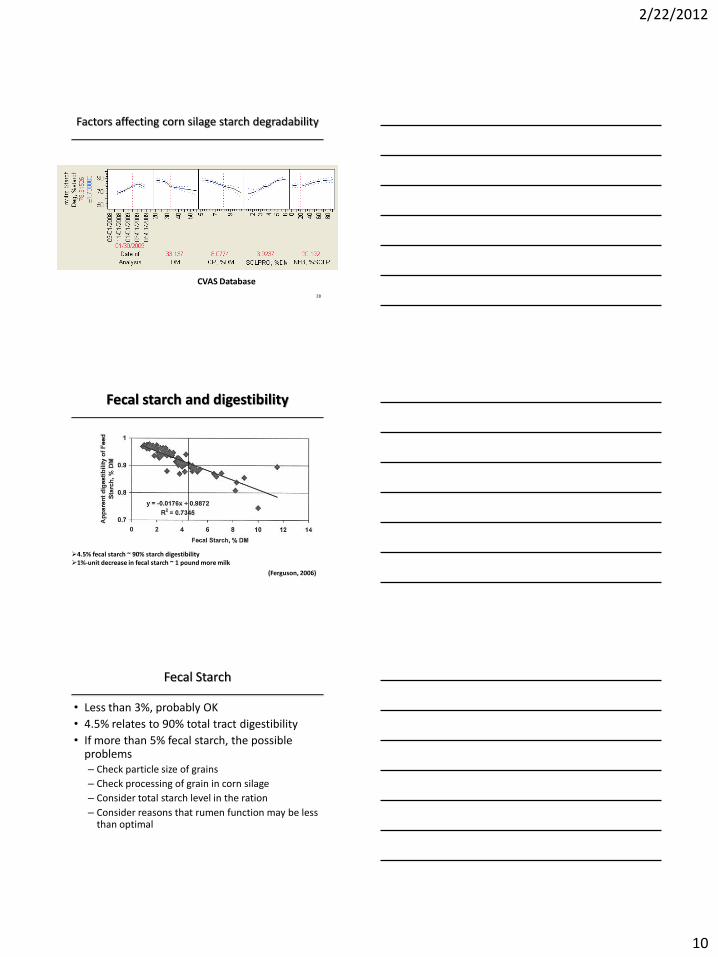
Factors affecting corn silage starch degradability
CVAS Database
28
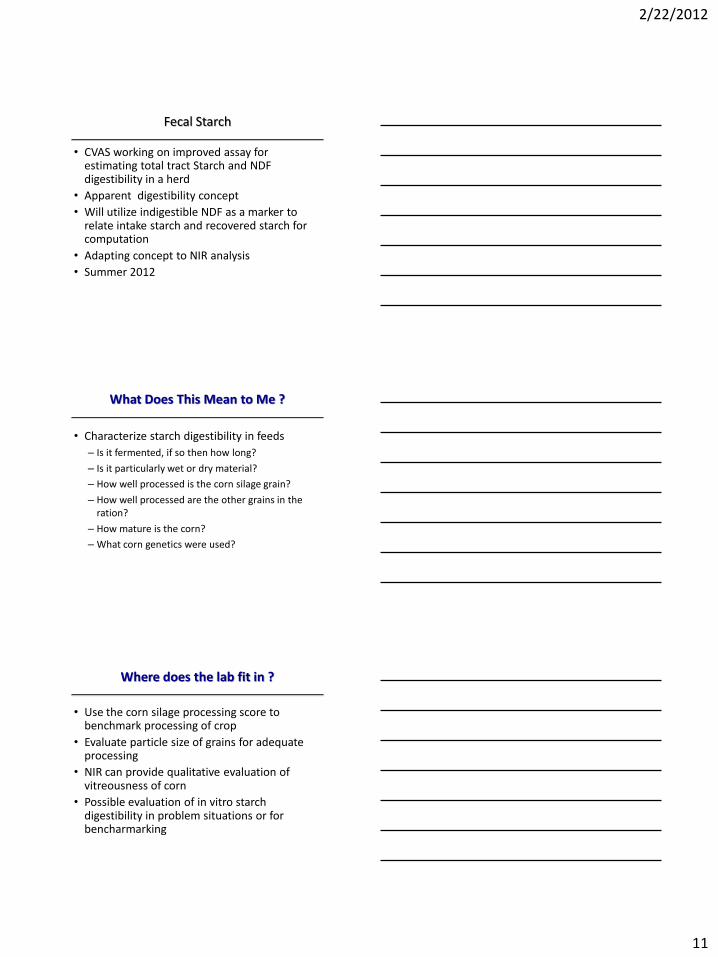
Fecal starch and digestibility
(Ferguson, 2006)
4.5% fecal starch ~ 90% starch digestibility 1%-unit decrease in fecal starch ~ 1 pound more milk
Fecal Starch
• Less than 3%, probably OK
• 4.5% relates to 90% total tract digestibility
• If more than 5% fecal starch, the possible problems – Check particle size of grains
– Check processing of grain in corn silage
– Consider total starch level in the ration
– Consider reasons that rumen function may be less than optimal
2/22/2012
11
Fecal Starch
• CVAS working on improved assay for estimating total tract Starch and NDF digestibility in a herd
• Apparent digestibility concept
• Will utilize indigestible NDF as a marker to relate intake starch and recovered starch for computation
• Adapting concept to NIR analysis
• Summer 2012
What Does This Mean to Me ?
• Characterize starch digestibility in feeds
– Is it fermented, if so then how long?
– Is it particularly wet or dry material?
– How well processed is the corn silage grain?
– How well processed are the other grains in the ration?
– How mature is the corn?
– What corn genetics were used?
Where does the lab fit in ?
• Use the corn silage processing score to benchmark processing of crop
• Evaluate particle size of grains for adequate processing
• NIR can provide qualitative evaluation of vitreousness of corn
• Possible evaluation of in vitro starch digestibility in problem situations or for bencharmarking
2/22/2012
12
Where does the lab fit in ?
• Watch for new approach to characterizing starch digestibility:
– Invitro is difficult to run and standardize
– Prolamin may relate to dry corn digestibility
– Ammonia level may relate to high moisture corn digestibility
• Will this be adaptable to corn silage?
Impact of Processing and Genetics on Starch Digestibility
2012 VSFA / Cow College
Ralph Ward, President Cumberland Valley Analytical Services
Hagerstown, Maryland