Embed Size (px)
Citation preview

Impact of PMWS on pork production and options for control
Dr. med. vet. Barbara Wieland, PhD
Chengdu, China, October 2011

Livestock production – where are we heading to?
- Growing world population
- Increased demand for meat
- Intensification of livestock production over the last
decades, in particular monogastric animals (poultry
and pig sectors)
- Effective use of input an important requirement to
ensure sustainability
objective of this talk: discuss role of ‘production
diseases’ and how they affect output using PMWS
as an example

Pigs in China
• China is the biggest pork producing country in the
world
• 50% of the world pig population
• Domestic consumption mainly
• 33.8kg per capita consumption for China
• Increased 20% from 2002-2006 and since then has
been increasing by about 5% per year
• Trend from small scale (70% in 2005) to large scale
production
Source: the pigsite, Boal et al.

Pigs in China

Pig pathogens resulting in reduced performance
Influenza viruses
Mycoplasma hyopneumoniae (Enzootic Pneumonia)
Actinobacillus Pleuropneumoniae
Porcine Reproductive & Respiratory Syndrome virus
Porcine circovirus 2
Lawsonia intracellularis
...
Vaccines available, however often not fully protective
Impact also depends on adequate nutrition, housing
systems, and stress (social or environmental)

Post-weaning Multi-systemic Wasting Syndrome (PMWS)
• Multi-factorial disease with Porcine Circovirus
type-2 (PCV-2) as necessary agent (also in
PDNS)
• Affects pigs between 8 to 15 weeks old
• Clinical signs: wasting and growth retardation,
pallor of the skin, respiratory signs,
occasionally jaundice and intermittent
diarrhoea
• Post mortem: interstitial pneumonia,
secondary bacterial infection, enlarged lymph
nodes, oedema and intra cytoplasmic
inclusions

PMWS in China
• Ongoing outbreaks since 2001
• Up to 20-30% mortality in
affected herds
• Example of PCV-2 prevalence
studies
• Zhejiang province 47.5% (Zhang et
al)
• Gansu and Qinghai provinces
58.5% (Song et al)

Clinical picture of PMWS has changed
• ~10 years ago: high mortality in affected farms
• Decrease in mortality over time, more farms affected
• Importance of sub-clinical cases unknown
Source: GB Surveillance Quarterly report VLA (VIDA)

Severity of PMWS observed in different age groups from 2001 to 2008
0
10
20
30
40
50
60
01 02 03 04 05 06 07 08
% o
f p
rod
ucers
Not affected Slightly affected Moderately affected Severely affected

Aims and Objectives
Identify the most effective, profitable and acceptable options to
control PMWS at the farm level
• Understand severity of PMWS observed in infected farms
• Identify risk factors for PMWS severity options for control
• Assess economic impact at farm and national level

Cross-sectional study:
149 farm visits carried out
3182 pigs sampled before PCV2 vaccination
Representing 65’000 sows (17% of pig herd)
Locations of all farms included in the study, overlaid on a map of total pig numbers throughout England, aggregated into 10km squares (pig density data taken from the 2004 UK agricultural census).
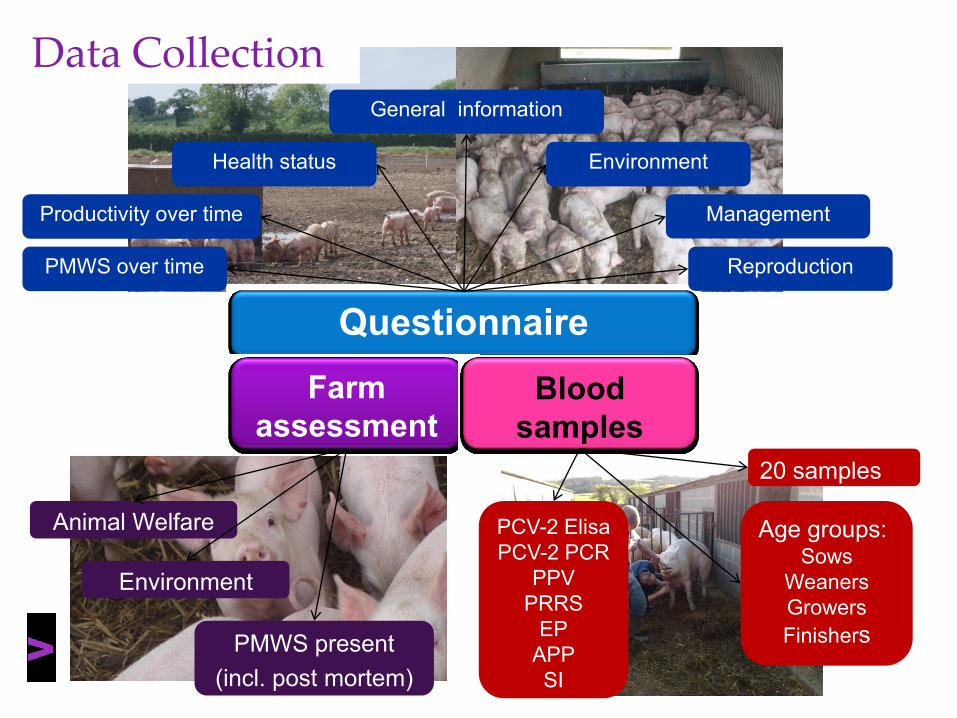
Questionnaire
Farm
assessment
Data Collection General information
Productivity over time
Environment
Management
Reproduction PMWS over time
Health status
Animal Welfare
Environment
PMWS present
(incl. post mortem)
Blood
samples
Age groups: Sows
Weaners
Growers
Finishers
PCV-2 Elisa
PCV-2 PCR
PPV
PRRS
EP
APP
SI
20 samples

Results of cross-sectional study
• PCV2 present on all farms
• 88.4% PCR positive
• 98.6% antibody postive
• Severity of PMWS seen on farms very variable

Combine morbidity, production and serological variables
6 serological
variables
3 production
performance variables
Principal component analysis
PCA
Morbidity in weaners,
growers and finishers (quantitative and qualitative)
Morbidity
factor 1 & 2
factor analysis
PMWS severity score

PMWS severity score
Non/Slightly affected farms PMWS scores<4
Moderately affected farms PMWS scores 4 - 6.5
Highly affected farms PMWS scores >6.5
Alarcon, P., et al., Assessment and quantification of post-weaning multi-systemic
wasting syndrome severity at farm level. PVM 2010

PMWS severity calculator available online www.bpex.org

PMWS on a farm

Risk factors associated with PMWS severity Multivariable ordinal logistic regression
Multi-factorial characteristic of the syndrome confirmed
Variables OR 95% CI
Rearing growers indoor only 23.66 4.09-136.84 Risk
Low stocking density 0.07 0.02-0.30 Protective
>2 diet adjustment up to the age of 14 weeks 0.12 0.02-0.72 Protective
Sick pen drains to other areas 6.40 2.30-17.82 Risk
Visitors must be pig free 0.14 0.04-0.49 Protective
Buying in boars 4.81 1.70-13.61 Risk
M. hyo positive 4.29 1.37-13.49 Risk
>3 vet visits/year required 9.60 1.57-58.62 Risk
Farm level risk factors associated with severity of Post-weaning multi-systemic wasting syndrome.
P Alarcon, M Velasova, A Mastin, A Nevel, K Stärk, B Wieland, (2011), Prev Vet Med,101(3-4)

Options for control
• Improve husbandry and animal welfare
• Raising growers outdoor and low stocking density were found
protective, avoid stress
• Potential importance of diet (age adjusted)
• Improve biosecurity
• Avoid infection with other diseases
• Vaccine

Outline cohort-study
1st visit (2008-2009)
Questionnaire: general
farm information,
management practices,
production parameters,
genetics, health status
Samples – 20 per farm
Pathogens tested
PCV2 Ab, PCV2 PCR, EP,
APP, PPV, PRRS
2nd visit (2009-2010)
min 6 months later
Questionnaire: general
farm information,
management practices,
production parameters,
genetics, health status
Samples – 32 per farm
Pathogens tested
PCV2 Ab, PCV2 PCR, EP,
APP, PPV, PRRS
PMWS severity: calculated difference between 1st
and 2nd visit

Preliminary results
What are the changes in PMWS severity? Before and after PCV2 vaccination
Vaccinated vs. unvaccinated farms
Vs.
Vaccinated (n=34) Before After
Mean Mean Difference (95%CI)
P-value
PMWS severity score
5.63 2.79 -2.84 (-3.60; -2.07) <0.01
Non vaccinated (n=10)
Before After
Mean Mean Difference (95%CI)
P-value
PMWS severity score 3.01 3.67 0.66 (-0.37; 1.69) 0.181

Changes in PMWS severity
Unpublished data, contact author for more information

Summary vaccination study
PCV2 vaccination successful in reducing PMWS
severity- moderately and highly affected farms
Piglet vaccine seems to be more effective
Reduction in mortality in PCV2 vaccinated farms
PCV2 still present in vaccinated farms
Take home message:
Vaccination is effective but not enough to
eliminate impact of PCV2
Vaccination is not substitute for good animal
husbandry

Economics
Economic model
(farm and
national level)
PMWS severity
measure
Morbidity details
(subclinical pigs) Risk factors for
severity
Efficacy of vaccines
to reduce severity
Clinical and post-mortem data
collected during a trial in
2000/2001 during a PMWS
outbreak
ADG for normal, PCV2 infected
and PMWS pigs
Various sources to
estimate costs

PMWS on a farm

PMWS disease model
Unpublished data, contact author for more information

Partial Budget analysis Figure 7. Illustration of how costs have been calculated to disease pig
Healthy pig Disease pig
DISEASE
Benchmarking data
used as reference
Data from longitudinal study:
↓ADG, Appetite loss, extra
days in feed, etc.
PMWS-D, PMWS-S,
PCV2-S & PCV2-D
Figu
re 7. Illustration of how costs have been calculated to disease pig
Health
y pig
D
isease pig
DISEA
SE
Benchmarking data
used as reference Data from
longitudinal study:
↓AD
G, Appetite loss, extra
days in feed, etc.
PMW
S-D, PM
WS-S,
PCV2-S & PCV2-D
Diseased pig

Partial Budget Analysis
Value (£) Value (£)
New costs:
Extra veterinary cost
Cost of carcass disposal
-
Cost saved:
Pig Feed saved
Electricity saved
Water saved
Straw & bedding saved
Transport saved
Revenue forgone
Total DWt1 sold
New revenue:
None
Total costs Total benefits
Cost of PMWS-D =
Example: PMWS-D

PMWS Economic model
Unpublished data, contact author for more information

Outlook: Economic Decision tree model
Slightly
affected
Moderately
affected
Highly
affected
Best
control
options
Best
control
options
Best
control
options
Input parameters
based on:
Risk factors identified
Vaccination efficacy
Other strategies?
(literature review)
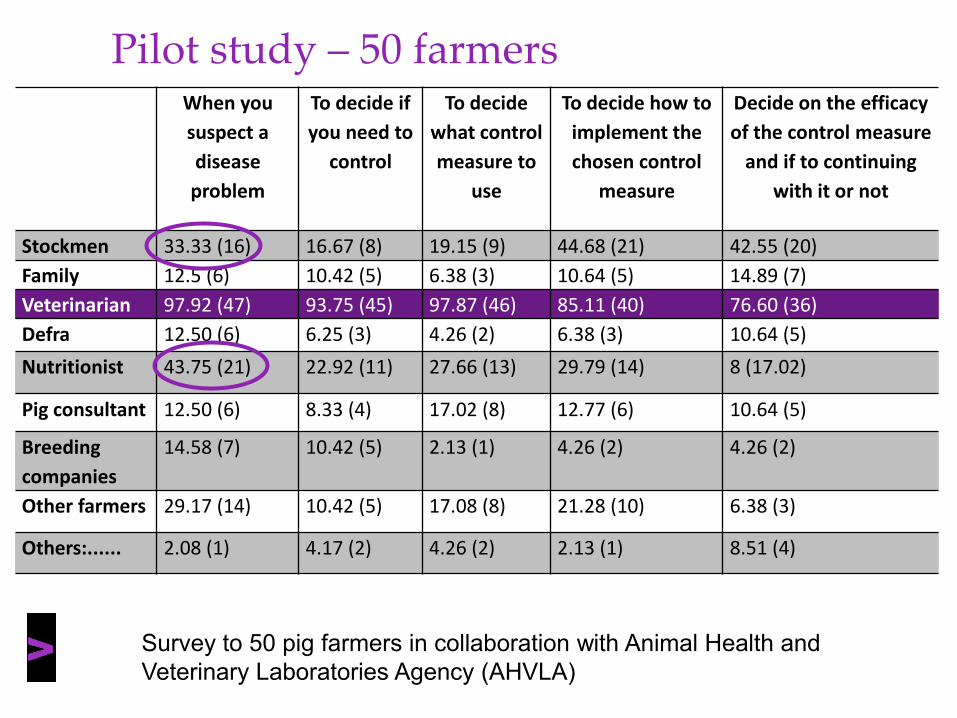
Pilot study – 50 farmers When you
suspect a
disease
problem
To decide if
you need to
control
To decide
what control
measure to
use
To decide how to
implement the
chosen control
measure
Decide on the efficacy
of the control measure
and if to continuing
with it or not
Stockmen 33.33 (16) 16.67 (8) 19.15 (9) 44.68 (21) 42.55 (20)
Family 12.5 (6) 10.42 (5) 6.38 (3) 10.64 (5) 14.89 (7)
Veterinarian 97.92 (47) 93.75 (45) 97.87 (46) 85.11 (40) 76.60 (36)
Defra 12.50 (6) 6.25 (3) 4.26 (2) 6.38 (3) 10.64 (5)
Nutritionist 43.75 (21) 22.92 (11) 27.66 (13) 29.79 (14) 8 (17.02)
Pig consultant 12.50 (6) 8.33 (4) 17.02 (8) 12.77 (6) 10.64 (5)
Breeding
companies
14.58 (7) 10.42 (5) 2.13 (1) 4.26 (2) 4.26 (2)
Other farmers 29.17 (14) 10.42 (5) 17.08 (8) 21.28 (10) 6.38 (3)
Others:...... 2.08 (1) 4.17 (2) 4.26 (2) 2.13 (1) 8.51 (4)
Survey to 50 pig farmers in collaboration with Animal Health and
Veterinary Laboratories Agency (AHVLA)

Conclusions
Production diseases:
• Impact on food security, and therewith on society
• Result in inefficient use of resources
• Are often trying to be controlled with vaccines,
however that is most of the time not enough
If we want to improve productivity, producers need to
be involved in the discussion

Pablo Alarcon
Martina Velasova
Mandy Nevel
Dirk Pfeiffer
Katharina Staerk
Christopher Wathes
Dirk Werling


![Pandering and pork-barrel politics · pork / =∗ >/ (∗)+ >(=∗ ∗= =, ()= < ≥ ()+≥(. / /. / ∗ ∗ ()= ⎧ ⎪⎨ ⎪⎩ ()>) ()∈ ) (∗,)> . ≡ /)]](https://img.dokumen.tips/doc/110x75/5f953f35c33d70257c62d34e/pandering-and-pork-barrel-politics-pork-a-a-a-a-.jpg)