Embed Size (px)
Citation preview

Swedish University of Agricultural Sciences Department of Soil and Environment
Impact of N fertilization on subsoil properties – Soil organic matter and aggregate stability Martina Schön
Master’s Thesis in Environmental Science Environmental Science in Europe – Master’s Programme Institutionen för mark och miljö, SLU Uppsala 2011 Examensarbeten 2011:18


SLU, Swedish University of Agricultural Sciences Faculty of Natural Resources and Agricultural Sciences Department of Soil and Environment Martina Schön Impact of N fertilization on subsoil properties – Soil organic matter and aggregate stability Supervisor: Holger Kirchmann, Department of Soil and Environment, SLU Assistant supervisor: Walter W. Wenzel, Department of Forest- and Soil Sciences, Institute of Soil Science, University of Natural Resources and Life Sciences, Vienna Examiner: Thomas Kätterer, Department of Soil and Environment, SLU EX0431, Independent Project in Environmental Science - Master´s thesis, 30 credits, A2E Environmental Science in Europe – Master’s Programme 120 credits Institutionen för mark och miljö, SLU, Examensarbeten 2011:18 Uppsala 2011 Keywords: Soil organic carbon, Aggregate stability, Subsoil, Nitrogen fertilization Online publication: http://stud.epsilon.slu.se Cover: Winter wheat at Fors, 2010, photo by author.


Abstract
During the last century mankind has been able to boost food production with fertilization
and improved cultivation techniques. Crop biomass production has been increased both,
above and below ground. Due to this fact it is expected that highly yielding crops may also
influence the soil organic carbon pool in the subsoil through increasing root production.
The goal of this thesis was to investigate the impact of low and high yields (no N vs high N
fertilization) on (1) the soil organic matter pool (2) soil stability and (3) related chemical and
physical interactions.
Soils of three Swedish long-term field experiments (Fors, Kungsängen and Örja) were
sampled to a depth of 0.40 m and analyzed. The organic carbon content decreased with
depth at all three sites. Nitrogen addition through organic manure and inorganic fertilizer
slightly increased the soil organic carbon content (SOC) in the topsoil, but in the subsoil
(0.30-0.40 m) only the soil from Fors showed higher SOC contents in N fertilized
treatments. Nitrogen fertilization (organic and inorganic) resulted in lower pH values
compared to control without fertilization at all three experimental sites. Manure had an
important influence on aggregate stability at the site Fors. The soil treated with manure
showed a higher soil aggregate stability (SAS) and a lower amount of readily dispersible clay
(RDC) than no manure treatment. At Kungsängen, the soil stability was governed by the
high clay content of 56%. No stabilizing effect of fertilization was detected. The acidifying
effect of biological N fixation was observed in Örja soil. Samples with lower pH showed
lower stability. Inorganic N fertilizer significantly stabilized the Örja surface soil layer (0-
0.20 m). Multiple regressions revealed that the factor clay seems to have the most impact
on soil stability.
In conclusion, it has been shown that small differences in soil management practices
(organic and/or inorganic fertilization, cultivation of N fixing plants) have an impact on soil
properties in the long-term with a much greater degree in the topsoil than in the subsoil.


Table of contents
1. Introduction ................................................................................................................................1
1.1. Nitrogen - elixir of life ..........................................................................................................1
1.2. Importance of long-term field experiments..........................................................................2
1.3. Fertilizer impacts .................................................................................................................2
1.4. SOM –as carbon sink or source? ..........................................................................................3
1.5. Soil aggregate stability .........................................................................................................3
1.5.1. Physical and chemical aggregate formation ..................................................................3
1.5.2. Biological aggregate formation.....................................................................................4
1.5.3. Soil stability measurements .........................................................................................4
1.6. Aim of the study ..................................................................................................................5
2. Material and Methods .................................................................................................................6
2.1. Experimental sites ...............................................................................................................6
2.2. Experimental design ............................................................................................................6
2.3. Sampling..............................................................................................................................7
2.4. Soil chemical analysis ...........................................................................................................8
2.4.1. Soil organic carbon and total Nitrogen .........................................................................8
2.4.2. Soil pH .........................................................................................................................8
2.5. Soil physical analysis ............................................................................................................8
2.5.1. Stability analysis ...........................................................................................................8
2.5.2. Soil texture ................................................................................................................11
2.6. Statistical analysis ..............................................................................................................12
3. Results ......................................................................................................................................13
3.1. Soil chemical properties .....................................................................................................13
3.1.1. Soil organic carbon .....................................................................................................15
3.1.2. Soil pH .......................................................................................................................16
3.1.3. Regression analysis ....................................................................................................17
3.2. Soil physical properties ......................................................................................................18
3.2.1. Soil aggregate stability ...............................................................................................20
3.2.2. Readily dispersible clay ..............................................................................................22
3.2.3. Soil texture ................................................................................................................23
3.3. Multiple regression analysis ...............................................................................................23
3.4. Homogeneity within the field ............................................................................................25

4. Discussion .................................................................................................................................27
4.1. Fors ...................................................................................................................................27
4.2. Kungsängen .......................................................................................................................27
4.3. Örja ...................................................................................................................................28
4.4. General observations .........................................................................................................28
5. Conclusion ................................................................................................................................30
6. References ................................................................................................................................32

Preface
Air, water and soil are the bases of life. However, our soils are in danger. Land
degradation is a big problem worldwide. Erosion, pollution, sealing and loss of
organic matter pose a threat to agronomic productivity and the environment. An
understanding of soil functions is of high relevance at present as well as in future
research to apply sustainable soil management which is necessary to secure food
supply and quality of life (Eswaran et al., 2001).


1
Fig. 1. World population, fertilizer input and meat production – a trend throughout the 20th century (Erisman et al., 2008)
1. Introduction
1.1. Nitrogen - elixir of life
Nitrogen (N) is a substantial element for all life on Earth. Many vital substances like amino acids,
nucleic acids, ATP etc. contain nitrogen. Therefore, also, plant growth is dependent on an adequate
nitrogen supply. Gaseous nitrogen is the most common element in the earth’s atmosphere (78%) but
it must be transformed into a more active form to be plant available. This takes place either through
biological nitrogen fixation by bacteria or by chemical synthesis (Erisman et al., 2008).
The German chemist Fritz Haber invented the chemical synthesis of ammonia in 1908. Ten years
later, he got awarded with the Nobel Prize in Chemistry. Hundred years later the worldwide food
production is highly dependent on Haber-Bosch nitrogen (Erisman et al., 2008) and more than 50% of
food production is based on fertilizer application (Smil, 2002). Inorganic nitrogen is applied to feed
the crop with sufficient nutrients in order to produce high yields. The current worldwide nitrogen
fertilizer use amounts to 100 Tg N per year and supports nearly 40% of the current world population
(UNEP and WHRC, 2007). Erisman et.al (2008) estimated that mainly due to Haber-Bosch nitrogen the
number of humans supported per hectare of arable land more than doubled from 1.9 humans in
1908 to 4.3 humans in 2008. Figure 1 shows the trend of fertilizer input throughout the 20th century.
The world population is projected to grow from 6.1 billion in 2000 to 8.9 billion in 2050, which is an
increase of 47% (UN, 2004). Food demand is increasing constantly with human population. This
requires a high demand on future crop production and food management. Hence, a healthy and
efficient management of agricultural ecosystems is essential to supply human livelihood. This
management also includes efficient use of fertilizers. Therefore it is indispensable to understand the
impact of fertilizers on soils – not only on topsoil but also on subsoil properties.

2
1.2. Importance of long-term field experiments
The role of N fertilizer to increase crop yields has been experimentally proven in numerous field trials
around the world (Carlgren and Mattson, 2001; Kismányoky and Tóth, 2010). Especially long-term
field trials are of great interest as many changes in soil characteristics can be only detected after
several years. Many soil and crop models are based on data from long-term field sites taking into
account the impact of different soil and climatic conditions (Kunzová and Hejman, 2008; Kismányoky
and Tóth, 2010). Worldwide about 600 long-term field experiments exist with a duration of more
than 20 years (Koerschens, 2010). Each single experiment is unique considering the different soil
properties, climate diversity, fertilizer and crop management which all depend on the local soil
conditions (Carlgren and Mattsson, 2001; Koerschens, 2006).
In Sweden, the soil fertility experiments were started in the fifties and sixties with 12 soil fertility
trials throughout the country analyzing the effect of various fertilizers on soil fertility (Carlgren and
Mattson, 2001). Carlgren and Mattsson (2001) summarized the yield of these experiments: inorganic
N fertilization had the strongest influence on crop yield in south as well as in central Sweden, more
pronounced than the effect of phosphorus and potassium (PK) fertilization. In addition, N fertilization
positively affected the carbon content in the topsoil. Persson and Kirchmann (1994) focused on the
effect of N fertilizers and organic manures on carbon and nitrogen content on a Swedish long-term
experimental plot. They found out that after 45 years of organic farmyard manure application, the
soil carbon content increased by 40% whereas a 45 year long application of inorganic calcium nitrate
fertilizers resulted in a decrease in soil organic carbon (SOC) by 20%.
1.3. Fertilizer impacts
The effect of fertilizers on soil organic matter (SOM) and crop growth and yield has been discussed in
numerous papers. For example Liu et al. (2010) investigated the effect of long-term fertilizer and
manure treatments on soil properties in a Regosol in China. He reported a significant higher effect of
inorganic N fertilizer on topsoil organic matter content in combination with manure as applied alone.
This finding is consistent with results of Gollany et al. (2006) and Masto et al. (2006). Gollany et al.
(2006) reported a greater impact of organic soil amendments than inorganic N fertilization on soils in
the Walla-Walla silt loam (Washington). Masto et al. (2006) evaluated long-term field experiment (31
years) on Cambisol in India. They found a significant higher organic carbon content in the topsoil
which was treated with manure and NPK fertilizer than in the soil treated only with NPK fertilizer.
Raun et.al. (1998) observed the importance of the amount of N fertilization applied on long-term
winter wheat experiments in Oklahoma. Their study showed an increasing SOC and Ntot pool with
increasing levels of inorganic N fertilizer application. SOC was increased when N was applied in
excess of what is required for maximum yields. Varvel (1994) showed that N fertilization as well as
crop rotation had significant positive effects on Ntot and SOC in a silty clay loam soil in Nebraska,
especially in the upper topsoil 0-7.5 cm. A less positive effect was detected at deeper soil levels.
Shallow tillage was practiced at the investigated field plots.
All previous mentioned results show that fertilization (inorganic and organic) increases the SOM pool.
Dead roots and above-ground harvest residues play an important role in the formation of SOM.
Harvesting the above ground biomass means removal of nutrients. In order to maintain soil fertility

3
over the long-term, it is important to compensate the removal of nutrients with adequate addition
and also to apply nutrients in a plant-available form.
1.4. SOM –as carbon sink or source?
Soil organic matter consists mainly of carbon (SOC) and organic N (Ntot) and is constantly created and
decomposed by soil microorganisms. This balance can be influenced by a number of factors such as
e.g. soil management, monoculture or crop rotations (Hao et al., 2008).
Stocks of SOM are an important storage pool of carbon. Agricultural systems and grassland store
most of their carbon below ground in form of SOM, whereas forests store significant amounts in
form of wood above ground. Microorganisms produce CO2 through respiration while degrading dead
organic matter and crops can bind CO2 adding organic matter to the soil. Therefore soils can serve
both as a sink and a source of atmospheric CO2. Land use change of grassland to agricultural land was
a major source of CO2 in the past 200 years. Knowledge how terrestrial carbon pools can be increased
is therefore of high relevance for the climate in future (IPCC, 2000).
Changes in soil carbon pools have been investigated in many long-term field experiments (Körschens,
2006). Net carbon sequestration can be reached if plant biomass production is increased which
means a high application of crop residues to soil. However, changes in soil organic carbon are slow. It
can take up to 70 years to reach an equilibrium between formation and decomposition. This requires
that research in the field of carbon sequestration is done over relatively long periods of time. Studies
from German long term field experiments show that only 10% of the added organic matter will be
accumulated as SOM and most of the organic matter input is released as CO2 (Körschens, 2006 and
2010).
Beside carbon sequestration, organic matter plays an important role as plant nutrient stock, in cation
exchange mechanism, metal complexation and also in the stabilization of soil aggregates (Hao et al.,
2008).
1.5. Soil aggregate stability
Soil aggregate stability is important for several ecosystem functions, such as water infiltration,
reduction of erodibility and runoff, aeration for plant growth (Kemper and Rosenau, 1986), physical
protection of soil organic matter (Tisdall and Oades, 1982). In general small aggregates are more
stable than big aggregates. The more unstable macroaggregates are vulnerable to wetting or low
energy agitation whereas more energetic treatment is required for complete dispersion of
microagggregates (Brady and Weil, 2002; Golchin et al., 1994). Thus the stability of soil aggregates is
dependent on the size of the aggregates.
1.5.1. Physical and chemical aggregate formation
Small aggregates (<0.03 mm) are formed by physically and chemically processes. If clay platelets
approach each other closely, flocculation occurs. Calcium favors flocculation as its two charges can
bind clay with clay but also clay with humus and thereby create and stabilize the microaggregates.
Hence, liming also stabilizes the soil structure. In addition, changes in the water status contribute to
aggregate formation. Drying and freezing press the soil particles closer together and generate
aggregates (Oades, 1993). This aggregation is important in soils containing large amounts of swelling

4
clay minerals like smectite. Clay is controlling the expansion and hence structural changes are
maximal in clay rich soils and minimal in sandy soils (Golchin et al., 1994; Oades, 1993).
1.5.2. Biological aggregate formation
The networks of fine plant roots and fungal hyphae are important for the stabilization of larger
aggregates. Plant roots and fungal hyphae can enmesh soil particles to clods (Oades, 1993). The plant
releases sticky organic compounds through the root system (=rhizodeposition) to attract soil
microorganisms. Fungi, bacteria and soil animals decompose these substances as well as dead root
material and produce viscous products “humic cements” (polysaccharides, hemicelluloses or
uronides, levans). Such materials can chemically interact with particles of silicate clays and Fe and Al
oxides and form stable complexes. In this way decomposed residues get encrusted with clay packets
and form organomineral complexes (Brady and Weil, 2002). Golchin et al. (1994) found that
complexed organic matter had a narrow C/N ratio which shows that clay minerals are able to adsorb
and protect organic matter rich in N. Some of these organic materials are or become hydrophobic
upon complexation and reduce the affinity for water that can be destabilizing (Brady and Weil, 2002).
Plant debris and persistent organic binding agents help microaggregates to be water-stable (Tisdall
and Oades, 1982). Organic carbon is protected from rapid degradation when it is incorporated into
soil aggregates. Golchin et al. (1994) disrupted soil aggregates and found that many have a nucleus of
plant debris (occluded particulate matter). The macrofauna in soil like earthworms and termites can
influence soil structure as they ingest soil and produce excreta in the form of casts or pellets (Oades,
1993). Wright et al. (1999) elucidated the influence of the arbuscular mycorrhizal (AM) product
glomalin on soil aggregate stability. A high correlation between glomalin and soil aggregate stability
(SAS) was revealed. Glomalin is regarded to act as insoluble glue between soil particles. As AM prefer
colonization of specific host plants (herbaceous plants, shrubs, deciduous plants), one can influence
the degree of colonization with the choice of plants in crop rotation. Furthermore, Wright indicated
the positive effect of no-tillage on glomalin concentration.
Biological stabilization is the most important stabilizing mechanism in soils with low shrink-swell
capacity and minimal in self-mulching clays. Sandy and loamy soils are therefore dependent on
stabilizing properties of their biological population (Oades, 1993). Physical and chemical stabilization
is more persistent compared to biological stabilization. Roots, hyphae etc. are constantly
decomposed by microorganisms and have only a short-term stabilizing effect. Hence it is important
to maintain soil stability through continuous replenishment with new organic matter (Hillel, 2004).
1.5.3. Soil stability measurements
Soil stability of the soil is usually measured with artificially induced forces which simulate disrupting
processes that are likely to occur in the field. Rainfall is the most important disrupting force that can
break down aggregates. It is therefore common to use wet sieving as a method to determine soil
aggregate stability (SAS). This process simulates water erosion in fields (Hillel, 2004).
Another method to analyze soil stability is the determination of readily dispersible clay (RDC). This
procedure was developed by Dexter and Czyz (2000) in order to analyze the stability of sandy soils in
Poland. A high amount of dispersed clay indicates unstable soil structure in wet conditions or in
water. The amount of RDC depends on the mechanically force applied, as well as the sodicity of the
clay fraction. A negative correlation with organic matter was observed. In addition calcium bridges

5
can lower clay dispersibility. Readily dispersible clay may influence water movement in soil by
blocking pores and reducing the water infiltration rate (Tisdall and Oades, 1982). Also, low soil
aeration, soil crusting and poor crop emergence can be the result of high RDC. Furthermore, RDC can
contribute to a loss of soil nutrients adsorbed to the clay particles which can lead to pollution of
water storages e.g. eutrophication of lakes (Dexter and Czyz, 2000).
1.6. Aim of the study
The goal of this work was to determine the effect of long-term inorganic N fertilization and organic
manure addition on soil carbon contents in top- and upper subsoil. As much research has been done
on topsoils, this work focused on the upper subsoil i.e. the layers below the topsoil. In addition
physical analyses regarding soil stability were performed to find out if possible soil organic matter
changes are followed by changes in soil stability even at deeper soil layers.
To this end, mineral soils obtained from three Swedish long-term experiments were analyzed at five
different depths (down to 0.40 m) for their
- soil organic matter content (SOC and Ntot)
- Soil stability indicators (SAS and RDC), and
- pH and soil texture.
It was hypothesized that with increased crop production due to N fertilization, soil organic carbon
content and aggregate stability is raised, especially in the subsoil.

6
Fig. 2. Location of long-term field experiments 1: Fors, 2: Kungsängen, 3: Örja
2. Material and Methods
2.1. Experimental sites
In this work soil samples from three different locations of the
Swedish long-term soil fertility experiments were
investigated.
Two experimental sites are located in central Sweden in the
province of Uppland (Fig. 2). The experiments at Fors and
Kungsängen were started in 1963.
The soil at Fors (60°20’ N, 17°29’ E, altitude 25 m, 720 mm
annual precipitation, 5.4 °C mean annual temperature1)
consists of glacial deposits together with calcium carbonate.
The soil is classified as Calcaric Phaozem. The topsoil consists
mainly of silt. The clay mineral fraction consist mainly of illite
(68%), kaolinite (7%), chlorite (6%) and 19% mixed layer
(different vermiculite-smectite species). The carbonate
content increases with soil depth (Kirchmann, 1991).
The soil at Kungsängen (59°50’ N, 17°40’ E, altitude 4 m,
660 mm annual precipitation, 5.4 °C mean annual
temperature) is classified as a Gleyic Cambisol (FAO). Illite is
also dominant in the clay mineral with 55%, followed by
kaolinite (6%), chlorite (7%), vermiculite (4%) and mixed layer (32%). The special characteristic of this
soil is the very low pH at lower profile depths. This pH is caused by acid sulphate clay, known as
‘gyttja clay’ (Kirchmann, 1991).
The third site was located in the South of Sweden in Örja (55°53’ N, 12°52’ E, altitude 10 m, 730 mm
annual precipitation, 7.9 °C mean annual temperature). This experimental site started in 1957. The
Örja soil was classified as Eutric Cambisol (FAO soil classification).The profile consists of a sandy clay
loam with small content of calcium carbonate throughout the profile. Illite amounts to 51% of the
clay fraction, followed by smectite (19%) and kaolinite (9%). These data were taken from Kirchmann
and Eriksson (1993).
2.2. Experimental design
The experimental field at each location is about 0.7 ha and is divided in several subplots (6 x 8 m)
with different NPK fertilizer and manure treatments. Each field consists of two blocks with the same
fertilizer/manure treatment scheme (Fig. 3).
1 Average values from meteorological data collected 1951-1980
7
Fig. 3. Scheme of experimental field; the tagged areas are the sampled subplots with different fertilization scheme.
For this project soil samples from treatments with the maximal amount of N fertilization (lime-
ammonium nitrate, 150 kg ha-1) with and without manure application and control (no fertilization)
were considered. All sampled subplots were treated with the same amount of P and K mineral
fertilizer. When manure had been applied the N and K fertilization levels were adjusted. In this way
this work focuses only on the input factors N-fertilizer and farmyard manure on soil properties. The
effect of N fertilization and manure application were compared with corresponding control
treatments (no fertilization). Furthermore the variability within the field was examined.
The crop rotations differ between the fields. A detailed description is shown below in Tab. 1.
Tab. 1. Crop rotation, adjusted from Carlgren and Mattsson, 2001
Crop rotation with livestock Crop rotation without livestock Kungsängen and Fors Örja Kungsängen and Fors Örja
1963-1987 1988-2010 1963-1987 1988-2010
Barley Ley 1 (2 cut) Ley 2 (1 cut) Oilseed crop Winter wheat Oats
Barley Ley 1 (2 cut) Ley 2 (1 cut) Winter wheat Oats Winter wheat
Barley Ley 1 (1 cut) Winter wheat Sugar beet
Barley Spring wheat Fallow Oilseed crop Winter wheat Oats
Barley Oats Oil seed Winter wheat Oats Winter wheat
Barley Oil seed Winter wheat Sugar beet
In rotations with livestock, 20 t ha-1 farmyard manure is applied every 4th year after winter wheat at Örja. At the other two sites 30 t ha-1 are applied every 6 years after ley 2. Leys are grass/clover leys. The rotations at Kungsängen and Fors were slightly different before 1988.
2.3. Sampling
Soil samples were taken with soil augers (2.3 cm diameter) from the subplots (Fig. 3), at Örja in Mai
2010, at the other two sites in October 2010. The auger was carefully pushed into the soil to a depth
of 0.40 m in two steps (0-0.20 m and 0.20-0.40 m). The soil was separately collected in different PVC
buckets depending on the depth. Five depth levels were distinguished: 0-0.20 m, 0.20-0.25 m, 0.25-
0.30 m, 0.30-0.35 m and 0.35-0.40 m. From each subplot five cores were taken and pooled as
composite sample. In order to check the variability within one field soil samples of five drillings from
one subplot were separately collected and analyzed according to their SOC. The soil samples were
kept in plastic bags under field water content at 4 °C before analysis.
Treatments:
N fertilization and manure
Manure
N fertilization
Control, no fertilization

8
Fig. 4. Soil samples taken at Kungsängen
2.4. Soil chemical analysis
2.4.1. Soil organic carbon and total Nitrogen
Soil organic carbon (SOC) and total nitrogen (Ntot) were determined on air-dried soil samples, one
analysis per subplot. The soil was incinerated in the macro-analyzer Leco CN-2000 at 1300 °C. The soil
at Fors and Örja is rich in carbonate and therefore the data were analyzed both for carbonate and
organic carbon. First, the soil samples were incinerated at 550 °C to remove the organic carbon and
thereafter analyzed for the carbonate carbon in the macro-analyser. In a second step, the soil was
analyzed without pre-treatment. The difference between measurements revealed the organic carbon
content.
2.4.2. Soil pH
Soil pH (1:2.5 soil:deionized water) was determined with a glass electrode (MeterLab, PHM210
Standard pH Meter). Soil samples of each subplot and depth level were measured.
2.5. Soil physical analysis
2.5.1. Stability analysis
For each depth level and treatment, four replicate measurements were performed (3 sites, 4
subplots and 5 depths, in total 480 measurements). The field wet soil from Kungsängen and Örja was
gently broken into small aggregates (Fig. 5a) by hand and sieved to a size fraction of 0.6 - 0.2 cm
before analysis. The Fors soil was analyzed without pretreatment since the soil was loose and dry.
Four grams (±0.02 g) of soil were weighed (scale “Precisa 500M-2000C”) and transferred into one
sieve. Each soil sample was submerged in 75 ml of deionized water (temperature about 20 °C) for six
minutes. This was performed with the wet sieving apparatus “Eijkelkamp Art.no.: 0813” (sieves
35 mm depth and 35 mm inner diameter, mesh screen 0.250 mm, stroke = 13 mm, about 34
times/min, Fig. 5b). Eight sievings could be performed at once. The stable aggregates retained

9
in the sieve (Fig. 5c). The unstable soil particles were dispersed in the water.
Readily dispersible clay (RDC)
The dispersed clay solution was transferred into a 250 ml PVC bottle and filled up with deionized
water. The bottle was shaken by hand, unscrewed and put away for resting. After 3 h 52 min a
pipette was immersed into the solution and 30 ml of dispersed suspension were soaked up from a
depth of 5 cm. The solution was then transferred to a sample cell. The cell was closed with a lid and
put into the turbidimeter “Hach 2100N” compartment. For all measurements the same sample cell
was used. The turbidity was measured in NTU (Nephelometric Turbidity Units). After about 30
measurements the cell was coated with a thin layer of silicone oil to avoid scratches from friction.
In addition a calibration was performed for each experimental site. Standard solutions of different
turbidity values were created and measured. Twenty milliliter of the measured solutions were
transferred to crucibles and dried at 105 °C. After weighing, calibration curves from each soil were
created (Fig. 6). The NTU values were related to the total clay amount in 4 g which were used for wet
sieving.
Fig. 5 a. Soil aggregates before sieving b. Sieving apparatus c. Stable aggregates after sieving

10
y = 11867x2 + 5769.9x - 2.4932R² = 0.9982
0
200
400
600
800
1000
1200
1400
1600
1800
0 0,05 0,1 0,15 0,2 0,25
NTU
g RDC of 4 g soil
Fors
y = 9541.8x2 + 5197.3x - 0.3939R² = 1
0
500
1000
1500
2000
2500
3000
3500
0 0,1 0,2 0,3 0,4
NTU
g RDC of 4 g soil
Kungsängen
y = -1897.2x2 + 4567.3x + 38.286R² = 0.9953
0
500
1000
1500
2000
2500
3000
0 0,2 0,4 0,6 0,8 1
NTU
g RDC per 4 g soil
Örja
Fig. 6. RDC calibration curves. The dots are showing the measured turbidity values of the standards.

11
Soil aggregate stability (SAS)
The stable aggregates which remain in the sieve after submergence were transferred to crucibles and
dried in the oven over night. After weighing (“Precisa 202A” 4 fractional digits) the aggregates were
covered with dispersion detergent (0.1M sodium pyrophosphate Na4P2O7 x 10 H2O: MW: 446.06 g
mol-1solution; 89.22 g dissolved in 2 L of deionized water). About two hours later the dispersed
aggregates were again sieved for six minutes so that only the stone fraction remained in the sieve.
The stones were dried and weighed. The calculation of soil aggregate stability was corrected with the
measured stone weight.
The soil aggregate stability was calculated with the Formula 1.
SAS % = mass stable aggregates+sand -mass(sand)
mass soil sample -mass(sand)
Formula 1. Soil aggregate stability
2.5.2. Soil texture
The soil texture of the first (0-0.20 m) and last soil layer (0.35-0.40 m) of the sites Fors and Örja was
determined. The analysis was basically performed according to the procedure described by Ljung
(1987).
The soil was dried at room temperature and sieved for aggregates <2 mm. Ten grams of this soil were
further dried at 105 °C and weighed. Afterwards the samples were incinerated at 550 °C in a furnace
in order to remove the organic material. This value was used to determine the exact soil texture.
Twenty grams of the room dried soil samples were used to determine soil texture. First 10 ml of H2O2
were added to remove the organic material. The samples were heated to 90 °C in order to foster the
reactions. In case of high and long lasting activity another 10 ml were added.
The solutions were sieved (0.2 mm mesh) in order to get the coarse sand fraction. Afterwards, 25 ml
of dispersion detergent (sodiumpolyphosphate 3.3%, sodiumcarbonate 0.7%) were added. The
dispersed particles were transferred into a cylinder-shaped long plastic column (Fig. 7) and filled up
with deionized water. Then the dispersion was mixed by hand with a beater. Samples of 10 ml were
taken with a pipette according to the following time table: 32 sec after stopping of beating, 4 min
48 sec, 53 min 30 sec (all at depth of 10 cm). The last samples were taken after 6 h from a higher
depth of 8 cm. The samples were dried and weighed.

12
Fig. 7. Sedimentation of fine soil particles, samples were taken with a pipette at a determined time interval (left). The samples were transferred to crucibles for drying (right).
2.6. Statistical analysis
For each variable the treatment mean was based on two field replicates (two blocks) and for SAS and
RDC measurements also on fourfold determination in the laboratory. The statistical analysis was
done with Minitab 16.1.0. Multiple comparisons of means were performed to examine which means
are different. The pairwise difference was analyzed with the Tukey method (p<0.05).
A correlation analysis to determine possible linear relationships between different variables was
done. Here the two blocks were independently treated. In addition, multiple regressions were
performed for testing the influencing factors on SAS and RDC.

13
3. Results
3.1. Soil chemical properties
Soil organic C and total N values, pH and C/N ratios are presented in tables 2-4. The values are means
of the two subplots with the same treatment ± standard error. Results of the multiple comparison
analysis are depicted with letters next to the means.
Tab. 2. Chemical properties of the Fors soil including standard error (±). Capital letters indicate the difference related to soil depth. Lower case letters show the influence of the treatments for the same depth level. Levels that share a letter are not significantly different.
Treat-ment
Depth (m)
SOC (g kg
-1)
Total N (g kg
-1)
pH SOC/N
Crop rotation with manure 0 kg N
ha-1
yr-1
0.00-0.20 1.65 ± 0.01 A a 0.133 ± 0.002 A a 8.28 ± 0.08 B a 12.4
0.20-0.25 1.66 ± 0.13 A a 0.133 ± 0.011 A a 8.42 ± 0.10 AB a 12.5
0.25-0.30 1.42 ± 0.14 AB a 0.111 ± 0.014 AB a 8.54 ± 0.15 AB a 12.9
0.30-0.35 0.96 ± 0.02 AB a 0.078 ± 0.002 AB a 8.71 ± 0.01 AB a 12.4
0.35-0.40 0.80 ± 0.20 B a 0.063 ± 0.019 B a 8.86 ± 0.11 A a 12.8
150 kg N ha
-1yr
-1
0.00-0.20 1.71 ± 0.11 AB a 0.142 ± 0.005 A a 8.38 ± 0.10 A a 12.1 0.20-0.25 1.85 ± 0.12 A a 0.153 ± 0.003 A a 8.58 ± 0.09 A a 12.1
0.25-0.30 1.70 ± 0.24 AB a 0.141 ± 0.018 A a 8.63 ± 0.08 A a 12.1
0.30-0.35 0.99 ± 0.04 BC a 0.078 ± 0.010 B a 8.67 ± 0.11 A a 12.8
0.35-0.40 0.55 ± 0.17 C a 0.035 ± 0.005 B a 8.76 ± 0.06 A a 15.2
Crop rotation without manure 0 kg N
ha-1
yr-1
0.00-0.20 1.39 ± 0.01 A a 0.119 ± 0.018 A a 8.52 ± 0.03 A a 118 0.20-0.25 1.46 ± 0.08 A a 0.126 ± 0.016 A a 8.63 ± 0.03 A a 11.7
0.25-0.30 1.18 ± 0.35 AB a 0.106 ± 0.011 AB a 8.71 ± 0.15 A a 11.0
0.30-0.35 0.62 ± 0.03 BC b 0.060 ± 0.010 BC a 8.72 ± 0.03 A a 10.4
0.35-0.40 0.35 ± 0.13 C a 0.027 ± 0.000 C a 8.85 ± 0.02 A a 13.2
150 kg N ha
-1yr
-1
0.00-0.20 1.61 ± 0.18 A a 0.134 ± 0.016 A a 8.30 ± 0.10 B a 12.0 0.20-0.25 1.65 ± 0.16 A a 0.137 ± 0.013 A a 8.54 ± 0.12 AB a 12.1
0.25-0.30 1.55 ± 0.15 A a 0.125 ± 0.010 A a 8.56 ± 0.13 AB a 12.4
0.30-0.35 1.10 ± 0.18 A a 0.086 ± 0.014 AB a 8.74 ± 0.10 AB a 12.8
0.35-0.40 0.71 ± 0.21 A a 0.046 ± 0.007 B a 8.91 ± 0.06 A a 15.1

14
Tab. 3. Chemical properties of the Kungsängen soil - as above
Treat- ment
Depth (m)
SOC (g kg
-1)
Total N (g kg
-1)
pH SOC/N
Crop rotation with manure 0 kg N
ha-1
yr-1
0.00-0.20 2.38 ± 0.06 A a 0.218 ± 0.004 A a 6.50 ± 0.02 B b 11.0
0.20-0.25 2.45 ± 0.01 A a 0.218 ± 0.000 A ab 6.36 ± 0.04 B a 11.3 0.25-0.30 1.85 ± 0.28 A a 0.167 ± 0.021 A a 6.40 ± 0.06 B a 11.1 0.30-0.35 0.91 ± 0.14 B a 0.087 ± 0.010 B a 6.91 ± 0.01 A ab 10.4 0.35-0.40 1.00 ± 0.02 B a 0.094 ± 0.001 B a 6.96 ± 0.02 A a 10.7
150 kg N ha
-1yr
-1
0.00-0.20 2.31 ± 0.14 A a 0.211 ± 0.011 A a 6.48 ± 0.06 C b 10.9 0.20-0.25 2.41 ± 0.13 A ab 0.225 ± 0.011 A a 6.20 ± 0.02 D a 10.7
0.25-0.30 1.90 ± 0.15 A a 0.176 ± 0.015 A a 6.39 ± 0.04 CD a 10.8
0.30-0.35 1.08 ± 0.12 B a 0.103 ± 0.010 B a 6.76 ± 0.05 B b 10.5
0.35-0.40 0.95 ± 0.03 B a 0.091 ± 0.006 B a 7.03 ± 0.00 A a 10.4
Crop rotation without manure 0 kg N
ha-1
yr-1
0.00-0.20 1.92 ± 0.07 A a 0.166 ± 0.003 A b 6.77 ± 0.03 AB a 11.6
0.20-0.25 1.98 ± 0.07 A b 0.172 ± 0.000 A b 6.53 ± 0.13 B a 11.5 0.25-0.30 1.57 ± 0.18 AB a 0.134 ± 0.008 B a 6.64 ± 0.08 AB a 11.8
0.30-0.35 1.27 ± 0.07 BC a 0.111 ± 0.000 C a 7.03 ± 0.06 A a 11.5 0.35-0.40 0.90 ± 0.01 C a 0.088 ± 0.002 D a 7.06 ± 0.06 A a 10.1
150 kg N ha
-1yr
-1
0.00-0.20 2.16 ± 0.07 A a 0.189 ± 0.004 A ab 6.75 ± 0.06 BC a 11.4
0.20-0.25 2.22 ± 0.07 A ab 0.200 ± 0.013 A ab 6.53 ± 0.03 C a 11.1
0.25-0.30 1.97 ± 0.26 A a 0.173 ± 0.018 A a 6.57 ± 0.07 C a 11.4
0.30-0.35 1.04 ± 0.18 B a 0.096 ± 0.015 B a 6.96 ± 0.04 AB ab 10.8
0.35-0.40 0.93 ± 0.01 B a 0.090 ± 0.001 B a 7.12 ± 0.04 A a 10.3
Tab. 4. Chemical properties of the Örja soil - as above
Treat- ment
Depth (m)
SOC (g kg
-1)
Total N (g kg
-1)
pH SOC/N
Crop rotation with manure 0 kg N
ha-1
yr-1
0.00-0.20 1.00 ± 0.01 A ab 0.083 ± 0.0020 A ab 6.19 ± 0.01 A a 12.1 0.20-0.25 0.94 ± 0.04 AB a 0.078 ± 0.0046 A ab 6.24 ± 0.04 A a 12.1
0.25-0.30 0.99 ± 0.01 A a 0.081 ± 0.0026 A ab 6.29 ± 0.04 A a 12.2
0.30-0.35 0.83 ± 0.12 AB a 0.068 ± 0.0047 AB a 6.42 ± 0.10 A a 12.2
0.35-0.40 0.59 ± 0.06 B a 0.051 ± 0.0028 B a 6.53 ± 0.13 A a 11.6
150 kg N ha
-1yr
-1
0.00-0.20 1.13 ± 0.03 A a 0.096 ± 0.0051 A a 6.38 ± 0.13 A a 11.9
0.20-0.25 1.12 ± 0.05 A a 0.096 ± 0.0031 A a 6.40 ± 0.16 A a 11.7
0.25-0.30 1.06 ± 0.01 A a 0.093 ± 0.0034 A a 6.47 ± 0.20 A a 11.3
0.30-0.35 0.70 ± 0.04 B a 0.062 ± 0.0056 B a 6.68 ± 0.11 A a 11.3
0.35-0.40 0.52 ± 0.09 B a 0.047 ± 0.0078 B a 6.77 ± 0.14 A a 10.9
Crop rotation without manure 0 kg N
ha-1
yr-1
0.00-0.20 0.85 ± 0.05 A b 0.069 ± 0.0063 A b 6.53 ± 0.08 A a 12.2 0.20-0.25 0.87 ± 0.03 A a 0.072 ± 0.0036 A b 6.56 ± 0.04 A a 12.0
0.25-0.30 0.84 ± 0.03 A b 0.069 ± 0.0017 A b 6.59 ± 0.08 A a 12.1
0.30-0.35 0.70 ± 0.02 AB a 0.059 ± 0.0020 AB a 6.72 ± 0.08 A a 11.7
0.35-0.40 0.54 ± 0.02 B a 0.045 ± 0.0009 B a 6.79 ± 0.13 A a 12.0
150 kg N ha
-1yr
-1
0.00-0.20 1.07 ± 0.03 A a 0.087 ± 0.0035 A ab 6.44 ± 0.07 A a 12.3 0.20-0.25 0.99 ± 0.08 A a 0.089 ± 0.0023 A ab 6.51 ± 0.07 A a 11.1
0.25-0.30 1.00 ± 0.01 A a 0.086 ± 0.0008 A a 6.56 ± 0.10 A a 11.7
0.30-0.35 0.74 ± 0.01 B a 0.067 ± 0.0006 B a 6.69 ± 0.08 A a 11.0
0.35-0.40 0.51 ± 0.02 B a 0.048 ± 0.0002 C a 6.82 ± 0.10 A a 10.7

15
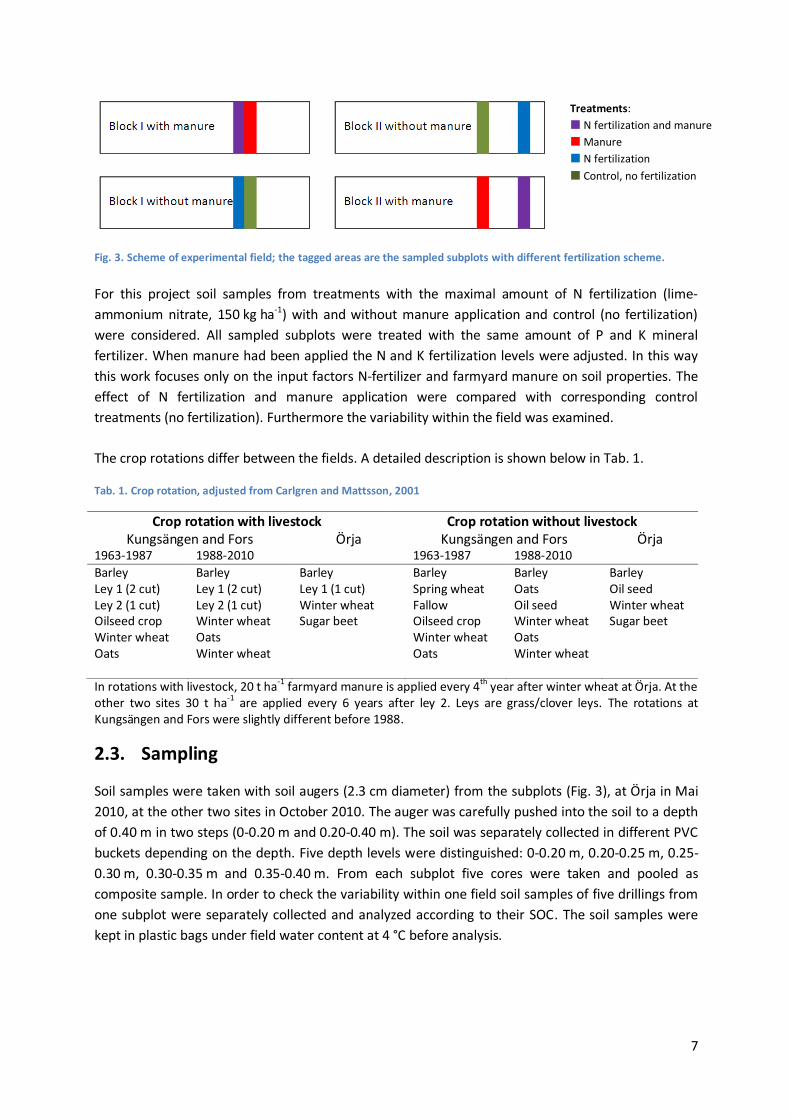
Fig. 8: Vertical distribution of soil carbon and soil pH of the four treatments in the three soils
3.1.1. Soil organic carbon
The soil organic carbon content decreased with depth at all three sites. The largest decrease was
observed at Fors as for example the carbon content decreased from 1.7 g kg-1 in the topsoil to
0.55 g kg-1 at 0.40 m depth with N fertilization and manure. The soil from Kungsängen showed the
highest level of organic carbon in both top and subsoil with 2.5 g kg-1 and 1 g kg-1, respectively.
16
Kungsängen is an acid sulfate soil containing a high content of marine deposited organic matter with
a C-content of 1.26 g kg-1 below 0.30 m (Kirchmann, 1991). The topsoil from Örja contained the
lowest carbon level compared with the other sites. The values in the subsoil are at the same level as
those at Fors. Organic C content decreased from 1 g kg-1 in topsoil to about 0.5 g kg-1 at 0.40 m
depth.
The graphs above show that SOC was always lower in the control with the other treatments including
fertilizers. This observation was not completely corroborated with statistical analysis. Significant
lower values of SOC in the control treatment are just found at Fors 0.30-0.35 m, Kungsängen 0.20-
0.25 m and Örja 0-0.20 and 0.25-0.30 m depth. Due to the low number of measurements (one
measurement of each block, N=2) with high variability, a significant difference between the
treatments was only found at few levels. Nevertheless, it seems that inorganic N fertilizer application
resulted in slightly higher SOC content and the positive effect can be ameliorated together with
manure application, especially in the topsoil.
3.1.2. Soil pH
Figure 8 shows also the soil pH which increases with depth at all three sites. This is a reverse trend
compared with the soil carbon content, as SOC is decreasing with depth while pH is increasing. The
Fors soil showed the highest values among all sites in the range 8.3-8.9. The sites Kungsängen and
Örja showed the same pattern with depth. Treatments with manure had lower pH values compared
to treatments without manure application, particularly in the topsoil.
The control showed the highest pH values throughout the profile but overall almost no significant
difference between the treatments was found. In general, it seems that the treatments have less
influence on the subsoil than on the topsoil as the values are within a smaller range.
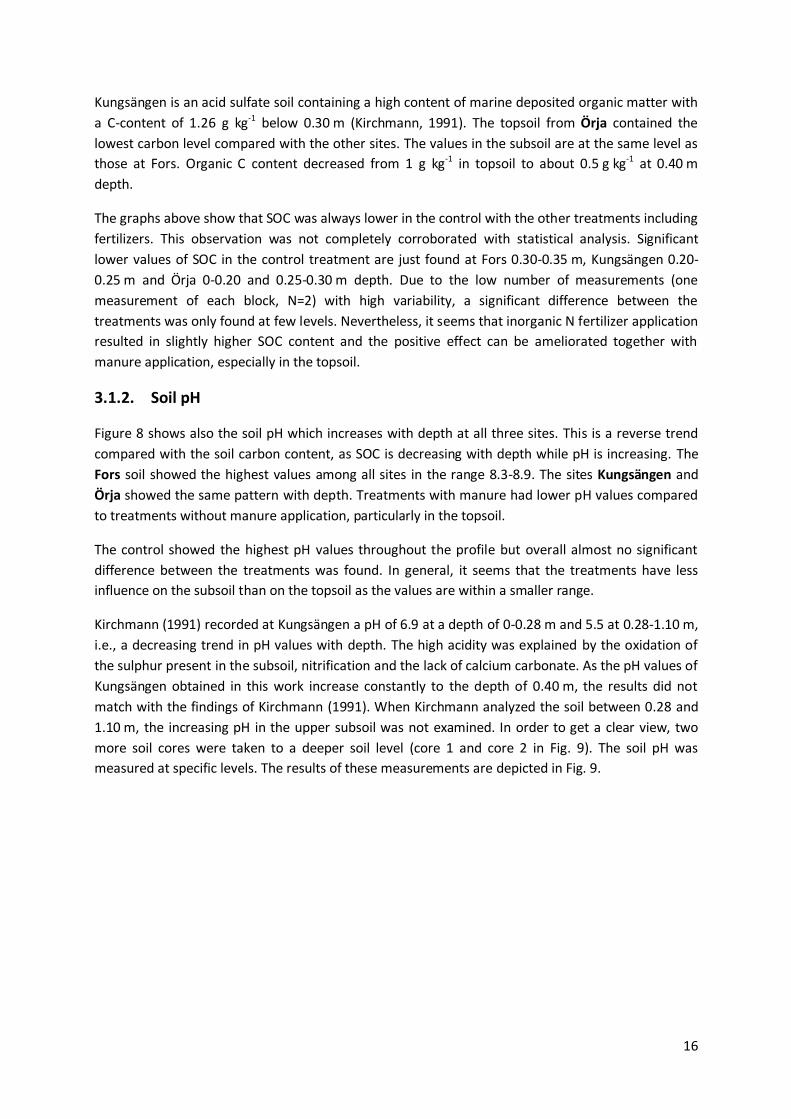
Kirchmann (1991) recorded at Kungsängen a pH of 6.9 at a depth of 0-0.28 m and 5.5 at 0.28-1.10 m,
i.e., a decreasing trend in pH values with depth. The high acidity was explained by the oxidation of
the sulphur present in the subsoil, nitrification and the lack of calcium carbonate. As the pH values of
Kungsängen obtained in this work increase constantly to the depth of 0.40 m, the results did not
match with the findings of Kirchmann (1991). When Kirchmann analyzed the soil between 0.28 and
1.10 m, the increasing pH in the upper subsoil was not examined. In order to get a clear view, two
more soil cores were taken to a deeper soil level (core 1 and core 2 in Fig. 9). The soil pH was
measured at specific levels. The results of these measurements are depicted in Fig. 9.

17
Soil pH increased in the upper subsoil to a depth of about 0.50 m. The reason for the increase is the
redistribution of lime which was applied in the sixties before the experiments were started. The low
pH below 0.50 m was probably the result of the acidifying processes mentioned above. However, the
variability of the pH values measured in this study is similar to the soil organic matter measurement.
Thus liming may have caused a variation in subsoil pH.
3.1.3. Regression analysis
Figure 10 shows the significant negative correlation of pH and organic carbon content at all three
investigated sites (N=40). This illustrates the acid properties of soil organic matter. With
decomposition of organic matter, humic substances are produced e.g. organic acids, amino acids
(Paul, 2007). Dissociation of the functional COOH-groups results in a decreasing pH values. This
explains the decreasing pH with increasing SOC content.
Fig. 10. Negative correlation of pH vs. SOC – all sites
* significant at 0.05 probability level
Fig. 9: Kungsängen pH measurements. The pH of core 1 and core 2 was measured to prove the low pH values in the subsoil observed by Kirchmann (1991). The graph also includes the average pH of all treatment plots analyzed in this work.

18
3.2. Soil physical properties
The physical properties of each soil are given in tables 5-7. The stability parameters SAS and RDC are
shown as average value of 8 measurements (4 of each block).
Treat- ment
Depth (m)
SAS (%)
RDC (% of total clay)
Clay (%)
Water content
(%)
Crop rotation with manure 0 kg N
ha-1
yr-1
0.00-0.20 41.2 ± 1.8 AB ab 11.6 ± 0.5 A a 16 23 0.20-0.25 47.6 ± 2.0 A a 7.6 ± 0.4 B ab 16 18
0.25-0.30 36.8 ± 1.7 B ab 7.8 ± 0.5 B b 15 16
0.30-0.35 24.7 ± 2.5 C a 13.9 ± 0.8 A a 14 14
0.35-0.40 20.1 ± 1.5 C ab 13.3 ± 0.6 A a 13 14
150 kg N ha
-1yr
-1
0.00-0.20 44.7 ± 2.0 A a 10.4 ± 0.5 B a 16 23 0.20-0.25 43.0 ± 2.3 A ab 5.1 ± 0.4 C b 16 18
0.25-0.30 44.7 ± 3.0 A a 4.7 ± 0.4 C b 15 16
0.30-0.35 22.8 ± 0.8 B a 11.5 ± 0.8 B ab 14 14
0.35-0.40 24.2 ± 3.2 B a 14.1 ± 0.8 A a 13 14
Crop rotation without manure 0 kg N
ha-1
yr-1
0.00-0.20 35.9 ± 0.3 A b 17.1 ± 2.0 A a 16 23 0.20-0.25 36.2 ± 2.2 A bc 12.0 ± 2.4 A a 16 18
0.25-0.30 34.2 ± 1.7 A bc 13.6 ± 2.7 A a 15 16
0.30-0.35 20.7 ± 2.1 B a 15.6 ± 2.2 A a 14 14
0.35-0.40 13.1 ± 1.1 C c 16.2 ± 1.7 A a 13 14
150 kg N ha
-1yr
-1
0.00-0.20 34.5 ± 2.6 A b 15.0 ± 2.2 A a 16 23 0.20-0.25 28.2 ± 2.4 AB c 10.2 ± 1.3 B a 16 18
0.25-0.30 28.1 ± 1.5 AB c 7.6 ± 0.6 B b 15 16
0.30-0.35 21.7 ± 2.2 BC a 9.1 ± 1.6 B b 14 14
0.35-0.40 15.9 ± 0.6 C bc 9.2 ± 0.3 B b 13 14
Tab. 6. Physical properties of the Kungsängen soil – as above
Treat- ment
Depth (cm)
SAS (%)
RDC (% of total clay)
Clay (%)
Water content
(%)
Crop rotation with manure 0 kg N
ha-1
yr-1
0.00-0.20 66.5 ± 0.5 A ab 6.0 ± 0.48 B a 56 31 0.20-0.25 60.9 ± 1.0 A a 9.6 ± 1.04 A a 56 29
0.25-0.30 61.7 ± 2.7 A a 8.4 ± 1.79 A a 57 34
0.30-0.35 66.9 ± 1.8 A a 6.9 ± 0.66 A ab 58 30
0.35-0.40 63.4 ± 2.2 A b 10.0 ± 1.34 A a 58 28
150 kg N ha
-1yr
-1
0.00-0.20 66.9 ± 0.6 A a 5.17 ± 0.32 B a 56 31 0.20-0.25 61.5 ± 1.5 AB a 8.48 ± 1.39 A a 56 29
0.25-0.30 57.2 ± 4.0 ABC a 8.33 ± 1.84 A a 57 34
0.30-0.35 54.2 ± 3.7 BC b 10.45 ± 1.51 AB ab 58 30
0.35-0.40 69.9 ± 0.8 C a 7.05 ± 0.50 A a 58 28
Tab. 6 continues
Tab. 5. Physical properties of the Fors soil (follow the same pattern of table 2-4). Values changing with depth are indicated with capital letters. The same letter indicates no significant difference. The influence of the treatment on the same depth level is indicated with lower case letters.

19
Treat- ment
Depth (m)
SAS (%)
RDC (% of total clay)
Clay (%)
Water content
(%)
Crop rotation without manure 0 kg N
ha-1
yr-1
0.00-0.20 63.8 ± 0.9 A b 10.1 ± 1.32 A a 56 31
0.20-0.25 65.1 ± 1.3 A a 9.9 ± 1.02 A a 56 29
0.25-0.30 63.6 ± 0.9 A a 9.4 ± 0.61 A a 57 34
0.30-0.35 63.5 ± 1.6 A a 8.6 ± 1.09 A b 58 30
0.35-0.40 62.8 ± 0.9 A b 9.9 ± 0.63 A a 58 28
150 kg N ha
-1yr
-1
0.00-0.20 66.0 ± 0.8 A ab 7.3 ± 0.89 B b 56 31
0.20-0.25 60.3 ± 1.9 A a 11.2 ± 1.58 A a 56 29
0.25-0.30 64.3 ± 1.1 A a 8.7 ± 1.04 AB a 57 34
0.30-0.35 62.8 ± 1.6 A ab 8.8 ± 1.23 AB a 58 30
0.35-0.40 61.1 ± 1.7 A b 10.1 ± 0.99 B b 58 28
Tab. 7. Physical properties of the Örja soil – as above
Treat- ment
Depth (m)
SAS (%)
RDC (% of total clay)
Clay (%)
Water content
(%)
Crop rotation with manure 0 kg N
ha-1
yr-1
0.00-0.20 31.6 ± 1.5 A c 34.2 ± 1.6 B a 20 12 0.20-0.25 18.5 ± 2.6 B c 57.5 ± 2.8 A a 21 14
0.25-0.30 32.6 ± 3.0 A a 31.9 ± 2.2 B ab 23 11
0.30-0.35 25.7 ± 2.9 AB b 42.6 ± 3.3 AB a 25 14
0.35-0.40 24.4 ± 5.2 AB a 34.0 ± 4.7 AB a 27 19
150 kg N ha
-1yr
-1
0.00-0.20 36.7 ± 1.4 A b 37.2 ± 1.3 A a 20 12
0.20-0.25 30.8 ± 2.5 A b 50.1 ± 2.4 A a 21 14
0.25-0.30 31.8 ± 4.6 A a 42.4 ± 4.6 A a 23 11
0.30-0.35 33.3 ± 4.5 A ab 46.7 ± 5.8 A a 25 14
0.35-0.40 39.8 ± 7.0 A a 30.2 ± 7.5 A a 27 19
Crop rotation without manure 0 kg N
ha-1
yr-1
0.00-0.20 38.8 ± 1.4 A b 24.5 ± 1.2 AB b 20 12 0.20-0.25 52.2 ± 4.0 A a 27.0 ± 2.8 AB b 21 14
0.25-0.30 44.2 ± 7.7 A a 34.6 ± 2.6 A ab 23 11
0.30-0.35 48.3 ± 5.5 A a 28.6 ± 4.3 AB ab 25 14
0.35-0.40 38.0 ± 3.5 A a 15.8 ± 1.9 B a 27 19
150 kg N ha
-1yr
-1
0.00-0.20 45.1 ± 0.9 A a 22.1 ± 1.7 A b 20 12 0.20-0.25 52.8 ± 3.8 A a 20.9 ± 2.4 A b 21 14
0.25-0.30 50.3 ± 4.6 A a 22.1 ± 2.1 A b 23 11
0.30-0.35 43.2 ± 6.5 A ab 16.1 ± 1.5 A b 25 14
0.35-0.40 41.8 ± 3.4 A a 17.8 ± 4.5 A a 27 19

20
Fig. 11. Aggregate stability (SAS) and readily dispersible clay (RDC) of the four treatments in the three soils
3.2.1. Soil aggregate stability
The Fors soil showed a stability of about 40% in the topsoil decreasing to about 15% in the subsoil.
The aggregate stability was highest in Kungsängen soil with about 65% throughout the profile. The
stability was constant with depth. The Örja soil had variable stability in the range of 18% to 48%.
Depth had almost no impact on the stability. Significant differences with depth were only observed
with manure treatment. Soil aggregate stability increased at 0.25 m depth and decreased afterwards
again.

21
At Fors manure seems to be the important stabilizing factor in this soil. In the topsoil, both
treatments including manure additions resulted in significant higher values than treatments without
addition of manure. As SOC was not significantly higher in manure treated soil, other mechanisms
are stabilizing this soil. Inorganic fertilizer alone had no significant effect on SAS at Fors. At
Kungsängen the treatment effect followed no distinct trend. In general, Örja soil treated without
manure resulted in higher stability than with manure. Inorganic N fertilizer seemed to have
important stabilizing effects in the topsoil. Örja soil treated with inorganic N fertilizer showed a
significant higher stability than the control in the first soil layer (0-0.20 m).
Figure 12 shows scatterplots of SAS vs SOC, pH and clay content. All measurements including depth
levels and treatments were included. In this work only Fors soil showed significant positive
correlation of SAS and SOC. A positive correlation of SOC and SAS was also observed by Kemper and
Koch (1966). Kungsängen and Örja soil did not show any significant correlation neither with SOC nor
with pH or clay content. A significant correlation of SAS at Fors was also found with pH (negative) and
with clay content (positive).
Fig. 12. Regression analysis of SAS vs. SOC, pH and clay content, respectively * significant at 0.05 probability level

22
3.2.2. Readily dispersible clay
Readily dispersible clay in the Fors soil showed uniform values throughout the profile. RDC increased
from top to about 0.25 m and decreased afterwards again. The highest values were obtained in the
top layer (0-0.20 m) and at the lowest level (0.35-0.40 m). The control showed the highest values at
all levels. The Kungsängen soil featured a complete uniform picture and RDC amounted to about 8%
throughout all levels. The difference between the treatments is varying, an observation which is in
consistence with the SAS values that have also not followed a systematic order. The RDC values of
Örja deviated from the others as there was much more variation between the treatments and
between the soil levels.
Fors soil treated with manure showed a higher SAS and a lower RDC than treatments without
manure (Fig. 11). This indicates a higher stability. Manure seems to be an important stabilizing factor.
Inorganic N fertilizer treated soil showed significant higher stability in the subsoil compared with the
control. At Kungsängen no significant improving effect of N fertilizer was observed. As the variability
of the single RDC measurements was very high, only few significant differences of RDC were
determined at the Örja site in spite of a broad range of means. Generally, there were significant
higher values of RDC with treatments including manure compared to treatments without manure
addition. This is in accordance with the SAS analysis where manure-treated soil also showed lower
stability.
Dexter and Czyz (2000) found a
negative correlation between RDC
and organic carbon content of the
soil. This relationship was not
significant in this experiment (Fig.
13) but a negative trend of the
relationship is apparent. With
increasing H+ content in soil water
more clay is dispersible.
Fig. 13: RDC vs. SOC and pH

23
Figure 14 shows the negative correlation between RDC and SAS. The same type of negative
relationship was also found by Dexter and Czyz (2000). They found a negative correlation with R-Sq
0.89 (RDC in NTU/g) in a sandy Luvisol (71% sand, 25% silt, 4% clay). The correlation found in this
work was much lower indicating other soil processes influencing soil stability e.g. pH. High SAS and
low RDC indicate both good soil stability.
3.2.3. Soil texture
Table 8 shows the results of the soil texture analysis from the sites Fors and Örja. The clay content
was further used for statistical analysis. The texture of the soil levels 0.20-0.35 m was interpolated.
The values are presented in tables 5-7. For Kungsängen, values for soil texture were taken from
Kirchmann (1991).
Tab. 8. Results of soil texture analysis
Depth
(m)
clay fine silt middle silt corse silt fine sand coarse sand
d<0.002 mm d<0.0063 mm d<0.02 mm d<0.06 mm 0.06-0.2 mm 0.2-2.0 mm
Fors 0.00-0.20 16% 9% 19% 26% 23% 7%
0.35-0.40 13% 11% 22% 29% 20% 5%
Örja 0.00-0.20 20% 7% 10% 13% 28% 22%
0.35-0.40 27% 6% 11% 13% 24% 19%
The clay content in the Fors soil is decreasing with depth, whereas it is increasing in Örja. Fors has a
much higher amount of silt compared to Örja, which contains half of sand in the topsoil.
3.3. Multiple regression analysis
Table 9 shows the prediction of SAS with the influencing variables organic carbon, pH and clay
content. The clay content was corrected with the water content of each soil level before analysis. The
smaller the p-value, the higher is the influence on the regression equation and therefore on the
Fig. 14. Relating aggregate stability to readily dispersible clay including all data from each soil. Scatterplot of SAS vs RDC
* significant at 0.05 probability level

24
prediction model. The regression at Fors accounted for 66.1% of the total variance in aggregate
stability. The regression at Kungsängen and Örja accounted only for 3.6% and 2.5% of the total SAS
variability and was therefore not significant. At Fors and Örja organic carbon showed the lowest p-
value in the topsoil, and clay the lowest in the subsoil. The regression of the three variables (sum of
all sites) accounted for 67.1% of the total variance in aggregate stability. Here, the p-value of SOC is
lower in the subsoil in comparison with the topsoil.
Tab. 9. Test of the influence of different factors on SAS using multiple regression analysis
p-value
R-Sq (%) Regression equation
SOC pH clay
Fors
0-0.40 m 0.034* 0.088 0.156 66.1* SAS = 0.817 + 0.0940 SOC - 0.130 pH + 0.000403 clay topsoil 0.-0.30 m 0.220 0.398 0.777 13.7 SAS = 0.841 + 0.0839 SOC - 0.091 pH + 0.000144 clay
subsoil 0.25-0.40 m 0.276 0.881 0.063 57.6 SAS = - 1.05 + 0.0584 SOC + 0.020 pH + 0.000902 clay
Kungsängen
0-0.40 m 0.479 0.262 0.713 3.6 SAS = 0.231 + 0.0215 SOC + 0.0732 pH - 0.000031 clay
topsoil 0.-0.30 m 0.603 0.173 0.917 9.4 SAS = 0.004 + 0.0231 SOC + 0.0975 pH - 0.000014 clay subsoil 0.25-0.40 m 0.439 0.593 0.412 8.3 SAS = 0.946 - 0.0585 SOC + 0.075 pH - 0.000188 clay
Örja
0-0.40 m 0.788 0.521 0.457 2.5 SAS = 0.05 - 0.051 SOC + 0.100 pH - 0.000143 clay
topsoil 0.-0.30 m 0.341 0.375 0.920 10.6 SAS = - 0.35 - 0.269 SOC + 0.164 pH - 0.000023 clay subsoil 0.25-0.40 m 0.199 0.459 0.193 9.1 SAS = 5.21 - 0.574 SOC - 0.174 pH - 0.00152 clay
Sum of all sites
0-0.40 m 0.001* 0.543 0.000* 67.1* SAS = 0.170 + 0.0648 SOC - 0.0076 pH + 0.000102 clay
topsoil 0.-0.30 m 0.952 0.195 0.000* 63.2* SAS = - 0.023 + 0.0026 SOC + 0.0295 pH + 0.000118 clay subsoil 0.25-0.40 m 0.055 0.533 1.000 70.0* SAS = 0.150 + 0.0602 SOC - 0.0109 pH + 0.000118 clay
*significant at 0.05 probability level
Table 10 shows the response of organic carbon and pH on RDC. Here the clay content was not
regarded as it was already considered in the calculation of RDC (% of total clay). Fors soil showed the
highest coefficient of determination with 33.3 % in the RDC modeling. The factor organic carbon
seemed to have a higher effect on RDC than the factor pH.
Tab. 10. Test of the influence of different factors on RDC using multiple regression analysis
p-value R-Sq (%)
Regression equation
SOC pH
Fors 0-0.40 m 0.000* 0.014* 33.3* RDC = 1.14 - 0.0751 SOC - 0.109 pH
topsoil 0.-0.30 m 0.039* 0.077 25.3 RDC = 1.15 - 0.0853 SOC - 0.108 pH subsoil 0.25-0.40 m 0.000* 0.444 29.0 RDC = 0.461 - 0.0857 SOC - 0.0298 pH
Kungsängen
0-0.40 m 0.800 0.980 0.6 RDC = 0.094 - 0.0028 SOC - 0.0006 pH
topsoil 0.-0.30 m 0.679 0.926 0.9 RDC = 0.122 - 0.0079 SOC - 0.0032 pH subsoil 0.25-0.40 m 0.309 0.300 5.3 RDC = - 0.171 + 0.0197 SOC + 0.0340 pH 0-0.40 m
Örja
0-0.40 m 0.947 0.615 1.6 RDC = 3031 + 38 SOC - 287 pH
topsoil 0.-0.30 m 0.212 0.686 9.6 RDC = 1518 + 1037 SOC - 212 pH subsoil 0.25-0.40 m 0.794 0.941 0.9 RDC = 1473 + 232 SOC - 65 pH
Sum of all sites
0-0.40 m 0.000* 0.000* 32.1* RDC = 0.768 - 0.119 SOC - 0.0610 pH topsoil 0.-0.30 m 0.000* 0.002* 37.4 RDC = 0.860 - 0.184 SOC - 0.0558 pH
subsoil 0.25-0.40 m 0.000* 0.001* 25.7 RDC = 0.722 - 0.136 SOC - 0.0561 p * significant at 0.05 probability level

25
The results of the multiple regressions indicate that aggregate stabilities of all three soils are affected
in different manners by the factors studied or are a function of other variables not considered in the
regression (e.g. microbial activity, clay mineral composition, exchangeable K and Na for RDC).
3.4. Homogeneity within the field
As mentioned above (chapter 2.3.), five soil core samples were analyzed separately from one subplot
of the experimental site. The average value of these measurements is shown in Fig. 15 (bars). The
error bars indicate the standard error. The dot shows the single measurement of the other block with
the same treatment. A possible block effect was investigated.

26
Fig. 15. Variability within the field exemplified by organic C measurements
At Fors (first graph of Fig. 15) all mean values of block II were outside the 95% confidence interval of
mean values throughout the profile. This shows that the field at Fors is very heterogeneous. As all
values in block I were lower than those in block II, a block effect in the Fors field exist. The
Kungsängen field is more homogenous. At the first two depths (0-0.25 m), the SOC values are within
the confidence interval. At a depth of 0.25-0.35 m it seems that the field is more variable. The field in
Örja is uniform at 0-0.20 and at 0.25-0.30 m. The depth of 0.20-0.25 m and the subsoil are variable.

27
4. Discussion
The drivers for the results observed at the three sites were different. Therefore all three sites will be
discussed separately.
4.1. Fors
Soil organic carbon, clay and aggregate stability are decreasing and pH is increasing with depth at this
site. Readily dispersible clay is rather stable throughout the profile. Manure had an essential
stabilizing effect in this soil through the carbon added. A further possible explanation would be that
earthworms use the manure directly as feeding sources and also contribute to a higher soil stability.
It was shown by Edwards and Lofty (1982) that earthworms were more numerous in soil treated with
organic fertilizer than in non-amended soil. The SOC pool in the soil is regulated by organic matter
inputs and by organic carbon decay rates. The balance between these two factors determines the
quantity of SOC storage. As fertilizers promote biomass production, consequently a higher amount of
plant residues, roots and also root exudates contribute to the SOC pool (Russel et al, 2009). This
explains the higher SOC content with fertilizer use. Inorganic N fertilizer alone had no significant
impact on the SOC pool at Fors. These results are not consistent with work by Raun (1998) and Varvel
(1994) who observed such an impact.
The high pH value of Fors soil is due to its high calcium carbonate content which is naturally present
in this soil. The Fors soil has a calcium carbonate content of 3.5 g kg-1 at 0-0.42 m depth (Kirchmann,
1991). In two of the four investigated treatments the pH was significantly higher at lower depth.
Kirchmann also measured increasing pH values with depth, which was explained by the high calcium
content in Fors at deeper horizons. The very high values obtained in this work (up to 8.9) require
other factors to be involved as carbonate has its equilibrium pH at 8.3 (Lide, 2002). The high pH could
be caused by high potassium contents in the subsoil or by measurement errors.
Aggregate stability was mostly influenced by SOC in the topsoil and by clay content in the subsoil.
This observation is not consistent with the findings of Kemper and Koch (1966) as they found a higher
influence of organic matter on the subsoil compared to the topsoil.
4.2. Kungsängen
SOC decreased, pH and clay increased with depth at Kungsängen. Soil stability was uniform
throughout the profile. As the soil is very homogenous almost no changes in SAS with depth or with
treatments were detected. Compared to Fors and Örja, SOC content and SAS were highest in topsoil
as well as in subsoil. Kirchmann (1991) ascribed the values in the subsoil to plankton and sedimented
detritus from plants and animals. The relative high stability can be explained by the very high clay
content in the soil throughout the profile. Biological aggregate formation is negligible in this type of
soil. Clay acts as one of the most determining factor of soil stability (Golchin et al., 1994; Kemper and
Rosenau, 1986).

28
4.3. Örja
Soil organic carbon and clay were decreasing with depth, pH was increasing. A notable characteristic
of the Örja site was the lower pH value of manure treated plots. The difference can be explained with
the different crop management. As depicted in Tab. 1 the crop rotation with livestock (manure
application) differed from that without. The crop rotation with farmyard manure includes cultivation
of ley for 2 years. Grass and N fixing clover are cultivated. N fixation is a pH decreasing process
(varying from 0.2 to 0.7 mol H+ per mol fixed N). Legume plants take up more cations than anions.
The reason is the import of basic cations during carbon assimilation and the coherent export of H+
from the plant roots into the soil in order to maintain the electrochemical balance within the plant
tissue. The rate of acidification depends on the form and amount of amino acids and organic acids
produced within the plant (Bolan et al., 1991). Increased soil acidity reduces the microbial activity
(Kemmitt et al, 2005) and thereby influences the stability of the soil. This explains the less stable soil
with manure treatment caused by less biological aggregate stabilization and less chemical
stabilization due to lack of calcium bridges at low pH level.
Soil stability at Örja is of the same magnitude in the topsoil and subsoil. As the organic carbon
content decreases with depth but SAS does not, one can assume that organic carbon may not be the
determining stabilizing factor. However, clay content and pH increased with depth. All three factors
are influencing the stability of aggregates. In fact, higher clay content and higher pH values seem to
counteract the effect of lower SOC in the subsoil and improve soil stability. Unfortunately this
observation could not be corroborated by the multiple regression analysis. This might be due to the
high negative correlation between SOC and pH (shown in Fig. 10) which makes it impossible to
separate their exclusive effect on the variable SAS in a multiple regression.
Örja and Fors had the same SAS of about 30%. Örja and Fors are in the same texture range whereas
Kungsängen is a heavy clay soil. Örja has lower pH values and lower SOC contents, but both soils
show a similar aggregate stability. A reason for this might be the higher amount of 2:1 smectite
mineral content in the Örja soil. Smectites have a higher binding potential compared to 1:1 clay (Six
et al., 2002). Another influence could be the five months longer storage time of Örja compared to
Fors soil before soil analysis. Soil stability is increasing with time of storage as precipitation of
inorganic binding agents is favored with time (Kemper and Rosenau, 1986).
4.4. General observations
At all three sites SOC and pH in topsoil were lowest in the control treatment compared with all other
treatments. Fertilization leads to acidification of the soil. Most nitrogen sources (organic and
inorganic) contain ammonium fertilizer. As the ammonium is mostly not completely absorbed by the
plant, nitrification takes place and H+ ions are released. N fixation, leaching of nitrate and removal of
organic products with crop harvesting are effecting cation and anion removal. All three processes are
responsible for accelerated soil acidification (Bolan et al., 1991). As plant roots are mainly
concentrated in the topsoil, topsoil is more affected by acidification as the subsoil.
A negative correlation of SOC and pH was also observed by Kemmitt et al. (2005). They found no
direct effect of pH on SOC and Ntot, but an indirect influence through soil microorganisms.
Acidification reduces plant production and the amount of substrate entering the soil. As microbial
activity is reduced the turnover of SOC is also lowered.

29
The multiple regression analysis including data of all sites showed that clay is the most determining
factor for soil stabilization. SOC seems to be more important in stabilization processes in subsoil than
in topsoil. The subsoil stabilization might be ascribed to organomineral complexes which are
described by Brady and Weil (2002). The lower SOC/N ratios in the subsoil in Kungsängen and Örja
(Tab. 3 and 4) are also indicating the presence of such complexes (see chapter 1.5.2).
The analyses of aggregate stability varied in some cases a lot. Auger taken soil samples show high
variation (Kemper and Koch, 1966). Improvements in soil sampling would maybe help reduce
variability. Petroleum jelly is often used for sampling with soil augers to avoid compression of the
soil. This could not be used in these experiments as the total carbon values would be raised. Another
more gentle method would be to take soil samples with a sharp shovel. This was also not feasible as
the harvest of the long-term field experiments is documented each year. At the time of sampling, the
winter wheat was already cultivated, so the disturbed area had to be minimized as possible.
30
5. Conclusion
Soil properties are affected by various processes. Any soil management alters soil properties,
including fertilization. This thesis focused on the impact of N fertilization on subsoil properties.
Inorganic N fertilizer as single factor had no significant effect on organic matter or on SAS, neither on
the subsurface soil nor on the topsoil. All three investigated sites showed a different behavior in soil
stability due to their difference in soil characteristics. At Fors, manure was an important stabilizing
factor. The Kungsängen soil was very uniform and the results followed no systematic pattern. Örja
had lower stabilities in treatments with manure additions. The lower pH in manure-treated soil is
assumed to be the causing factor for the lower stability.
Overall, clay was found to be the determining factor of soil stability. The amount and the type of clay
mineral determine the amount of active surface available for chemical reactions promoting soil
aggregation. Furthermore, soil pH and SOC content had an effect on soil stability. Soil pH regulates
many chemical and biological processes in the soil. Soil pH determines the community structure and
quantity of microorganisms (bacterial or fungal community) which in turn affects the decay rate of
organic matter. Organic matter input is often higher in fertilized systems, as biomass production is
increased. More organic matter input leads to a higher microbial activity and more intensive
decomposition. This in turn results in more microbial by-products being released which are stabilizing
the soil structure. Soil aggregates in turn can physically protect organic matter from degradation
which leads to a higher SOC content in the soil (Six et al., 2002).
In this study, a negative correlation between SOC and pH was observed. An increase in SOC implies a
decrease in soil pH, which in turn decreases the microbial decay rate following less aggregation. This
system continues until a balanced dynamic equilibrium is reached. Any change of soil management
practices e.g. change of vegetation, change of fertilizer input, change of tillage practices will affect
the system and a new equilibrium is reached.
Additional work is needed to understand the mechanisms and turnover of soil organic carbon in the
subsoil. More soils with different soil textures need to be analyzed to get a broader picture of the
SOC interactions. Further studies on long-term field experiments are indispensable to get more
knowledge about the effect of soil and crop management practices such as fertilization, crop rotation
and land use change on soil properties.

31
Acknowledgement
I am grateful to Holger Kirchmann, my main supervisor who helped me with soil sampling one week
before advent of the Swedish winter. Thanks for the guidance and support to understand the subject
of my work. I thank him and my co-supervisor Walter Wenzel for valuable comments on earlier
versions of this report. Thanks also to Christina Öhman who helped me finding my way in the
laboratory. Furthermore I offer my regards to my friends and family who supported me during my
years of study.
Martina Schön

32
6. References
BOLAN, N. S., HEDLEY, M. J. & WHITE, R. E. 1991. Process of soil acidification during nitrogen cycling
with emphasis on legume based pastures. Plant and Soil, 134, 53-63.
CARLGREN, K. & MATTSSON, L. 2001. Swedish soil fertility experiments. Acta Agriculturae
Scandinavica Section B-Soil and Plant Science, 51, 49-78.
DEXTER, A. R. & CZYZ, E. A. 2000. Effects of soil management on the dispersibility of clay in a sandy
soil. International Agrophysics, 14, 269-272.
EDWARDS, C. A. & LOFTY, J. R. 1982. Nitrogenous fertilizers and earthworm populations in
agricultural soils. Soil Biology and Biochemistry, 14, 515-521.
ERISMAN, J. W., SUTTON, M. A., GALLOWAY, J., KLIMONT, Z. & WINIWARTER, W. 2008. How a
century of ammonia synthesis changed the world. Nature Geoscience, 1, 636-639.
ESWARAN, H., LAL, R. & REICH,. P. F. 2001. Land degradation: an overview. In: Bridges, E.M., I.D.
Hannam, L.R. Oldeman, F.W.T. Pening de Vries, S.J. Scherr, and S. Sompatpanit (eds.).
Responses to Land Degradation. Proc. 2nd. International Conference on Land Degradation and
Desertification, Khon Kaen, Thailand. Oxford Press, New Delhi, India
GOLCHIN, A., OADES, J. M., SKJEMSTAD, J. O. & CLARKE, P. 1994. Soil structure and carbon cycling.
Australian Journal of Soil Research, 32, 1043-1068.
HAO, X. H., LIU, S. L., WU, J. S., HU, R. G., TONG, C. L. & SU, Y. Y. 2008. Effect of long-term application
of inorganic fertilizer and organic amendments on soil organic matter and microbial biomass in
three subtropical paddy soils. Nutrient Cycling in Agroecosystems, 81, 17-24.
HILLEL, D. 2004. Introduction to Environmental Soil Physics. Academic Press. Elsevier Science USA
494p
KEMPER, W.D. & KOCH, E.J. Aggregate stability of soils from western United States and Canada.
Agricultural Research Service. United States Department of Agriculture. 52p.
KEMPER, W.D. & ROSENAU, R.C. 1986. Aggregate Stability and Size Distribution. In: Methods of Soil
Analysis, Part 1. Physical and Mineralogical Methods (2nd Edition). Agronomy Monograph, No.
9. pp. 425-442.
KEMMITT, S. J., WRIGHT, D., GOULDING, K. W. T. & JONES, D. L. 2006. pH regulation of carbon and
nitrogen dynamics in two agricultural soils. Soil Biology & Biochemistry, 38, 898-911.
KIRCHMANN, H. & ERIKSSON, J. 1993. Properties and Classification of Soils of the Swedish Long-Term
Fertility Experiments: II. Sites at Örja and Orup. Acta Agriculturae Scandinavica, Section B -
Plant Soil Science, 43(4), 193-205.
KIRCHMANN, H. 1991. Properties and classification of soils in the Swedish long-term fertility
experiments .1. Sites at Fors and Kungsängen. Acta Agriculturae Scandinavica, 41, 227-242.

33
KOERSCHENS, M. 2006. The importance of long-term field experiments for soil science and
environmental research – a review. Plant, Soil amd Environment, 52,1-8.
KOERSCHENS, M. 2010. Soil organic carbon (C-org) - importance, determination, evaluation. Archives
of Agronomy and Soil Science, 56, 375-392.
KUNZOVA, E. & HEJCMAN, M. 2009. Yield development of winter wheat over 50 years of FYM, N, P
and K fertilizer application on black earth soil in the Czech Republic. Field Crops Research, 111,
226-234.
LIDE, D.R. 2002. CRC handbook of chemistry and physics: a ready-reference book of chemical and
physical data Boca Raton, Florida: CRC Press, cop. 2002
LIU, E. K., YAN, C. R., MEI, X. R., HE, W. Q., BING, S. H., DING, L. P., LIU, Q., LIU, S. A. & FAN, T. L. 2010.
Long-term effect of chemical fertilizer, straw, and manure on soil chemical and biological
properties in northwest China. Geoderma, 158, 173-180.
LJUNG G. 1987. Mekanisk analys : beskrivning av en rationell metod för jordartsbestämning.
Avdelningsmeddelande / Sveriges lantbruksuniversitet, Institutionen för markvetenskap,
Avdelningen för lantbrukets hydroteknik. 87:2
MASTO, R. E., CHHONKAR, P. K., SINGH, D. & PATRA, A. K. 2006. Changes in soil biological and
biochemical characteristics in a long-term field trial on a sub-tropical inceptisol. Soil Biology &
Biochemistry, 38, 1577-1582.
OADES, J. M. 1993. The role of biology in the formation, stabilization and degradation of soil
structure. Geoderma, 56, 377-400.
PAUL, E. A. 2007. Soil microbiology, ecology, and biochemistry. Academic Press. Elsevier. 532p.
PERSSON, J. & KIRCHMANN, H. 1994. Carbon and Nitrogen in arable soils as affected by supply of N
fertilizers and organic manures. Agriculture Ecosystems & Environment, 51, 249-255.
RUSSELL, A.E., CAMBARDELLA, C.A., LAIRD, D.A., JAYNES, D.B. & MEEK, D.W. 2009. Nitrogen fertilizer
effects on soil carbon balances in Midwestern U.S. agricultural systems. Ecological
Application,s 19:1102–1113
SIX, J., CONANT, R. T., PAUL, E. A. & PAUSTIAN, K. 2002. Stabilization mechanisms of soil organic
matter: Implications for C-saturation of soils. Plant and Soil, 241, 155-176.
SMIL, V. 2002. Nitrogen and Food Production: Proteins for Human Diets. AMBIO: A Journal of the
Human Environment, 31 (2), 126-131
TISDALL, J. M. & OADES, J. M. 1982. Organic matter and water-stable aggregates in soils. Journal of
Soil Science, 33, 141-163.
UN. 2004. World Population to 2300. Department of Economic and SOcial Affairs. Population
Division. New York. 254p.
UNEP & WHRC. 2007. Reactive Nitrogen in the Environment: Too Much or Too Little of a Good Thing.
United Nations Environment Programme, Paris.

34
WRIGHT, S. F., STARR, J. L. & PALTINEANU, I. C. 1999. Changes in aggregate stability and
concentration of glomalin during tillage management transition. Soil Science Society of
America Journal, 63, 1825-1829.