Embed Size (px)
Citation preview

University of Massachusetts AmherstScholarWorks@UMass Amherst
Masters Theses 1911 - February 2014
2012
Impact of Mental Toughness Training onPsychological and Physical Predictors of Illness andInjuryAisha VisramUniversity of Massachusetts Amherst
Follow this and additional works at: https://scholarworks.umass.edu/theses
Part of the Kinesiology Commons, and the Psychology Commons
This thesis is brought to you for free and open access by ScholarWorks@UMass Amherst. It has been accepted for inclusion in Masters Theses 1911 -February 2014 by an authorized administrator of ScholarWorks@UMass Amherst. For more information, please [email protected].
Visram, Aisha, "Impact of Mental Toughness Training on Psychological and Physical Predictors of Illness and Injury" (2012). MastersTheses 1911 - February 2014. 825.Retrieved from https://scholarworks.umass.edu/theses/825

IMPACT OF MENTAL TOUGHNESS TRAINING ON PSYCHOLOGICAL AND PHYSICAL PREDICTORS OF ILLNESS AND INJURY
A Thesis Presented
by
AISHA VISRAM
Submitted to the Graduate School of the University of Massachusetts, Amherst in partial fulfillment of the requirement for the degree of
MASTER OF SCIENCE
May 2012
Department of Kinesiology
IMPACT OF MENTAL TOUGHNESS TRAINING ON PSYCHOLOGICAL AND
PHYSICAL PREDICTORS OF ILLNESS AND INJURY
A Thesis Presented
by
AISHA VISRAM
Approved as to style and content by:
___________________________________ Erin Snook, Chair ____________________________________ Brian Umberger, Member ____________________________________ Patty Freedson, Member
_____________________________________ Patty Freedson, Department Head
Department of Kinesiology

ii
ABSTRACT
IMPACT OF MENTAL TOUGHNESS TRAINING ON PSYCHOLOGICAL AND
PHYSICAL PREDICTORS OF ILLNESS AND INJURY
MASTER OF SCIENCE
MAY 2012
AISHA VISRAM, BScH, UNIVERSITY OF GUELPH
M.S., UNIVERSITY OF MASSACHUSETTS AMHERST
UNIVERSITY OF MASSACHUSETTS AMHERST
Directed by: Professor Erin M. Snook
Intense training for prolonged periods of time without adequate recovery can result in
psychological problems and increased susceptibility to illness and injury in collegiate
athletes. The Cognitive-Affective Model of Athletic Burnout (Smith, 1986), a framework
for understanding the relationships among stressors, identifies cognitive appraisal as the
mediating factor between negative or positive health outcomes, and therefore could be a
target of interventions to reduce overtraining, burnout, injury, and illness. Mental
toughness, the ability to perform at one’s best regardless of the circumstances, is a
modifiable psychological construct that may influence cognitive appraisal. Altering an
athlete’s interpretation of stressful situations through mental toughness training could
change how the athlete evaluates his/her ability to handle the stressors of training and
competition, and may attenuate negative psychological outcomes associated with
increased illness and injury risk. The purpose of this study was to establish cross-
sectional relationships among mental toughness and psychological and physical variables,

iii
implement an online Mental Toughness Training Program, and evaluate the impact of the
training on changes in mental toughness, mood disturbances, athlete burnout, coping
ability, depression, physical symptoms, and perceived stress before, during, and after the
intervention program. Female student athletes from a private Division III institution on
the varsity Field Hockey (N=19) and Soccer (N=28) teams participated in this study. All
participants (N=47) provided cross-sectional data demonstrating that mental toughness
was significantly correlated with total mood disturbance (ρ=-0.51, p≤.01), depression
(ρ=-0.49, p≤.01), perceived stress (ρ=-0.53, p≤.01), and athlete burnout (ρ=-.46, p≤.01).
Thirty-seven athletes (N= 16 Field Hockey, N=21 Soccer) were randomly assigned by
team to the six-week Mental Toughness Training Program, involving psychological skills
training, or control condition, and had longitudinal data available for analysis. Mental
toughness levels were significantly increased in the intervention group from pre- to post-
training. The training led to significant attenuations in levels of athlete burnout,
depression, physical symptoms, and perceived stress. These findings show that mental
toughness is associated with psychological variables, and mental toughness training had a
positive impact on variables that have been associated with increased risk of injury in
collegiate athletes.
iv
TABLE OF CONTENTS
Page
ABSTRACT....................................................................................................................... ii
LIST OF TABLES ............................................................................................................. x
LIST OF FIGURES ......................................................................................................... xii
CHAPTER
1. INTRODUCTION......................................................................................................... 1
1.1 Purpose ............................................................................................................ 5
1.2 Specific Aims .................................................................................................. 6
1.3 Hypotheses ...................................................................................................... 6
2. LITERATURE REVIEW.............................................................................................. 7
2.1 Sport Injury ..................................................................................................... 7
2.2 Predictors of Injury/Illness .............................................................................. 8
2.2.1 Overtraining Syndrome .................................................................... 8
2.2.1.1 The Effects of Training and Overtraining ......................... 9
2.2.1.2 Treatment of Overtraining Syndrome ............................. 10
2.2.1.3 Prevalence of Overtraining Syndrome ............................ 11
2.2.1.4 Monitoring Overtraining ................................................. 11
2.2.1.4.1 Signs and Symptoms of Overtraining .............. 11
2.2.1.4.2 Physiological Markers of Overtraining ............ 12
2.2.1.4.3 Psychological Markers of Overtraining ........... 12

v
2.2.1.4.4 Measuring Mood States ................................... 13
2.3 Athlete Burnout .............................................................................................. 15
2.3.1 Definition of Athlete Burnout ........................................................ 15
2.3.2 Athlete Burnout vs Overtraining Syndrome .................................. 16
2.3.3 Process of Burning Out .................................................................. 16
2.3.4 Symptoms of Athlete Burnout ....................................................... 17
2.3.5 Treatment for Athlete Burnout ....................................................... 17
2.3.6 Impact of Overtraining and Burnout on Illness and Injury Risk ... 18
2.4 Cognitive-Affective Model of Athletic Burnout .......................................... 18
2.5 Stress and Coping Ability ............................................................................. 20
2.5.1 Stress and Injury ............................................................................ 20
2.5.2 Stress and Illness ............................................................................ 21
2.5.3 Moderating Stress .......................................................................... 22
2.5.4 Coping Ability ............................................................................... 22
2.5.5 Coping Ability, Stress, and Burnout .............................................. 23
2.6 Mental Toughness ......................................................................................... 24
2.6.1 Definition of Mental Toughness .................................................... 25
2.6.2 Assessment of Mental Toughness .................................................. 26
2.6.2.1 Sport Performance Inventory .......................................... 26
2.6.2.2 Mental Toughness 48 ...................................................... 26
2.6.2.3 Sport Mental Toughness Questionnaire .......................... 27
2.6.2.4 Mental, Emotional, and Bodily Toughness Inventory .... 27
2.6.3 Mental Toughness and Injury ........................................................ 29
vi
2.6.4 Association of Mental Toughness with Coping Ability ................ 29
2.6.5 Association of Mental Toughness with Mood State and Burnout .......................................................................................... 29
2.6.6 Mental Toughness and Cognitive Appraisal .................................. 32
2.6.7 Mental Toughness Training ........................................................... 33
2.7 Summary ....................................................................................................... 37
3. METHODOLOGY ..................................................................................................... 39
3.1 Design and Setting ........................................................................................ 39
3.2 Participants .................................................................................................... 39
3.2.1 Recruitment and Eligibility ............................................................. 39
3.2.2 Power Analysis and Sample Size .................................................... 40
3.3 Measures ....................................................................................................... 41
3.3.1 Demographics Questionnaire ......................................................... 41
3.3.2 Mental, Emotional, and Bodily Toughness Inventory ................... 41
3.3.3 Profile of Mood States-30 .............................................................. 42
3.3.4 Athlete Burnout Questionnaire ...................................................... 42
3.3.5 BriefCOPE ..................................................................................... 43
3.3.6 Beck Depression Inventory ............................................................ 43
3.3.7 Cohen-Hoberman Inventory of Physical Symptoms ..................... 44
3.3.8 Perceived Stress Scale .................................................................... 44
3.3.9 Illness and Injury Reports .............................................................. 45
3.4 Protocol .......................................................................................................... 45
3.4.1 Study Orientation and Informed Consent ...................................... 45
3.4.2 Baseline Testing ............................................................................. 46

vii
3.4.3 Implementation of the Mental Toughness Training Program ........ 46
3.4.4 Testing during the Intervention Program ....................................... 47
3.4.5 Post-Testing ................................................................................... 47
3.4.6 Follow-Up Testing ......................................................................... 47
3.5 Data Analysis ................................................................................................ 48
3.5.1 Data Analysis Hypothesis #1 ......................................................... 48
3.5.2 Data Analysis Hypothesis #2 ......................................................... 48
3.5.3 Data Analysis Hypothesis #3 ......................................................... 48
3.6 Human Hazards Precautions ......................................................................... 49
3.7 Study Timelines ............................................................................................ 49
4. RESULTS ................................................................................................................... 52
4.1 Hypothesis #1 Results: Cross-Sectional Relationships .................................. 52
4.1.1 Participant Characteristics ............................................................. 52
4.1.2 Descriptive Statistics ...................................................................... 54
4.1.3 Correlation Analyses ....................................................................... 54
4.2 Hypothesis #2 Results: Changes in Mental Toughness ................................. 57
4.2.1 Participant Characteristics ............................................................. 57
4.2.2 Descriptive Statistics ...................................................................... 57
4.2.3 Repeated Measures ANOVA ......................................................... 59
4.3 Hypothesis #3 Results: Changes in Psychological and Physical Variables ... 62
4.3.1 Participant Characteristics ............................................................. 62
4.3.2 Descriptive Statistics ...................................................................... 62
4.3.3 Repeated Measures ANOVA ......................................................... 65

viii
4.3.3.1 2 (Sport) X 2 (Time) Repeated Measures ANOVA: ABQ ................................................................................. 65
4.3.3.2 2 (Sport) X 4 (Time) Repeated Measures ANOVA: POMS ............................................................................... 66
4.3.3.3 2 (Sport) X 4 (Time) Repeated Measures ANOVA: BDI ................................................................................... 67
4.3.3.4 2 (Sport) X 4 (Time) Repeated Measures ANOVA: CHIPS .............................................................................. 67
4.3.3.5 2 (Sport) X 4 (Time) Repeated Measures ANOVA: PSS ................................................................................... 69
4.4 Injury and Illness Data .................................................................................. 70
4.5 Additional Analyses ...................................................................................... 70
5. DISCUSSION ............................................................................................................. 73
5.1 Hypothesis #1 Discussion ............................................................................. 74
5.1.1 Variables Correlated with Mental Toughness ................................ 75
5.1.2 Variables Not Correlated with Mental Toughness ......................... 77
5.1.3 Relationships Among Psychological Variables ............................. 78
5.1.4 Variables Correlated with Physical Symptoms .............................. 79
5.1.5 Hypothesis #1 Discussion Summary ............................................. 80
5.2 Hypothesis #2 Discussion ............................................................................. 81
5.2.1 Effectiveness of the Mental Toughness Training Program ............ 81
5.2.2 Challenges Associated with Intervention Implementation ............ 82
5.2.2.1 Participant Compliance ................................................... 83
5.2.2.2 Problems with Tracking Compliance .............................. 83
5.2.2.3 Format ............................................................................. 85
5.2.3 Mental Toughness Training Program Feedback ............................ 85
ix
5.2.3.1 General Feedback ............................................................ 85
5.2.3.2 Length ............................................................................. 86
5.2.3.3 Format ............................................................................. 86
5.2.4 Hypothesis #2 Discussion Summary .............................................. 87
5.3 Hypothesis #3 Discussion ............................................................................. 88
5.3.1 Variables Attenuated by Mental Toughness Training ................... 89
5.3.2 Variables Not Attenuated by Mental Toughness Training ............ 89
5.3.3 Hypothesis #3 Discussion Summary ............................................. 90
5.4 Injury and Illness Rates ................................................................................. 90
5.5 Mental Toughness Levels and Mood State ................................................... 91
5.6 Implications ................................................................................................... 93
5.7 Study Limitations .......................................................................................... 94
5.8 Future Directions .......................................................................................... 95
5.9 Conclusions ................................................................................................... 97
APPENDICES ................................................................................................................. 99
A. Informed Consent Document ....................................................................... 100
B. Study Instruments ........................................................................................ 110
BIBLIOGRAPHY .......................................................................................................... 131

x
LIST OF TABLES
Table Page
1. Study Timelines ........................................................................................................ 50
2. Data Collection Timeline .......................................................................................... 51
3. Participant Demographic Information for Hypothesis #1 (N=47) ............................ 53
4. A. Descriptive Statistics for the Total Scores of MeBTough, ABQ, BDI, CHIPS, and PSS (N=47) at Baseline ....................................................................................... 54 B. Descriptive Statistics for the Total Score and Subscales of POMS (N=47) at Baseline ...................................................................................................................... 55 C. Descriptive Statistics for the Subscales of BriefCOPE (N=47) at Baseline ........ 55
5. Spearman Rho Correlations Among the Total Scores of MeBTough, POMS, ABQ, BDI, CHIPS, and PSS ................................................................................................ 56
6. Participant Demographic Information for Hypothesis #2 (N=37) ............................. 58
7. Descriptive Statistics for the Total Score of MeBTough at Baseline, Post-Intervention, and at Follow-Up (N=37) ..................................................................... 59
8. 2 (Sport) X 3 (Time) Repeated Measures ANOVA Comparing Pre- and Post-Intervention MeBTough Scores (N=37) .................................................................... 60
9. Sessions Completed in the Training Intervention, Pre-Intervention Scores, Post-
Intervention Scores, and Difference Between Pre- and Post-Intervention Scores (N=16) ........................................................................................................................ 61
10. Descriptive Statistics for the Total Scores of POMS, ABQ, BDI, CHIPS, and
PSS at Baseline, After Week 2, After Week 4, and Post-Intervention (N=35) ......... 63 11. Reliability Coefficients for POMS, BDI, CHIPS, ABQ, PSS, and BriefCOPE ........ 64 12. 2 (Sport) X 2 (Time) Repeated Measures ANOVA Comparing Baseline and Post-
Intervention Total Scores for ABQ (N=35) ............................................................... 65 13. 2 (Sport) X 4 (Time) Repeated Measures ANOVA Comparing POMS Total Mood
Disturbance Scores at Baseline, After 2 and 4 Weeks into the Intervention, and Post-Intervention (N=33) ........................................................................................... 66

xi
14. 2 (Sport) X 4 (Time) Repeated Measures ANOVA Comparing BDI Scores at Baseline, After 2 and 4 Weeks into the Intervention, and Post-Intervention (N=33) ........................................................................................................................ 68
15. 2 (Sport) X 4 (Time) Repeated Measures ANOVA Comparing CHIPS Scores at Baseline, After 2 and 4 Weeks into the Intervention, and Post-Intervention (N=33) ........................................................................................................................ 68
16. 2 (Sport) X 4 (Time) Repeated Measures ANOVA Comparing PSS Scores at Baseline, After 2 and 4 Weeks into the Intervention, and Post-Intervention (N=33) ........................................................................................................................ 69
17. Occurrences of Injury and Illness and Number of Days Missed for each
Occurrence in the Intervention and Control Group (N=37) ...................................... 71

xii
LIST OF FIGURES
Figure Page
1. POMS subscale profile representing optimal mood state, or the “iceberg profile”.... 14
2. POMS subscale profile in an overtrained athlete, or the inverted “iceberg profile” ....................................................................................................................... 15
3. Smith’s (1986) Cognitive-Affective Model of Athletic Burnout .............................. 19
4. Average mood disturbance based on mental toughness levels .................................. 30
5. Mental toughness scores and their impact on POMS profiles ................................... 31
6. Mental toughness and the Cognitive-Affective Model of Athletic Burnout (Smith, 1986) .......................................................................................................................... 32
7. Actual mental toughness component scores for an athlete compared to expected scores .......................................................................................................................... 33
8. Mental toughness profile of two athletes with the same total score but differing
strengths and weaknesses ........................................................................................... 34 9. Mental toughness profiles for two athletes with differing total scores but the same
weakness (coping) ...................................................................................................... 35 10. Comparison of team winning percentage before and after the training program ..... 36
11. Intervention timelines for the study .......................................................................... 50
12. Mean mental toughness scores at baseline, post-intervention, and at follow-up ...... 60
13. Athlete Burnout Questionnaire (ABQ) scores at baseline and post-intervention ..... 66
14. Total Mood Disturbance scores from the Profile of Mood States (POMS) at baseline, after week 2 and 4, and post-intervention ................................................... 67
15. Beck Depression Inventory (BDI) scores at baseline, after week 2, after week 4, and post-intervention ................................................................................................. 68
16. Cohen-Hoberman Inventory of Physical Symptoms (CHIPS) scores at baseline,
after week 2 and 4, and post-intervention .................................................................. 69 17. Perceived Stress Scale (PSS) scores at baseline, after week 2 and 4, and post-
intervention ................................................................................................................ 70

xiii
18. POMS profile plots for mental toughness scores in intervals in the intervention group post-intervention .............................................................................................. 72
19. POMS profile plots for mental toughness scores in intervals in the control group post-intervention ........................................................................................................ 72
20. Modifying cognitive appraisal through mental toughness training in Smith’s
(1986) Cognitive-Affective Model of Athletic Burnout ............................................ 74 21. Depression and perceived stress in Smith’s (1986) Cognitive-Affective Model of
Athletic Burnout ......................................................................................................... 76 22. Comparing POMS profile plots for mental toughness scores in intervals from the
literature (Welch, 2010) to the intervention group post-intervention ........................ 92 23. Comparing POMS profile plots for mental toughness scores in intervals from the
literature (Welch, 2010) to the control group post-intervention ................................ 92

1
CHAPTER 1
INTRODUCTION
The benefits of sport participation are numerous and well discussed in the
literature. Sport participation can contribute to the development of social skills and self-
esteem, emotional well-being, social connectedness, and lead to a reduction in stress and
improved mental health (Steptoe & Butler, 1996; Bailey, 2006; Asztalos et al., 2008;
Armstrong & Oomen-Early, 2009). However, at higher levels of athletics, and in
collegiate settings where pressures placed on the athlete are not just sport-related, athletes
may be at risk for developing emotional and psychological problems. In 2007, there were
370,470 college students participating in NCAA sports in all divisions (United States
Government Accountability Office, 2007), and from 1988 to 2004, NCAA varsity sport
participation increased in both sexes (Hootman, Dick, & Agel, 2007).
Athletes must be exposed to high levels of physical training in order to elicit
training adaptations and improve performance (Bompa, 1983). Inadequate recovery time
combined with increased physical and psychological stressors can result in overtraining
and burnout. Overtraining occurs when a cycle of high intensity, high volume training
continues over weeks or months without enough time for the athlete to recover (Kraemer
& Nindl, 1998). High levels of intense training for prolonged periods can predispose
athletes to physical and psychological problems, illnesses, and injuries (Kuipers &
Keizer, 1988). Symptoms of overtraining include mood changes, depression, an
increased risk for developing infections, and increased susceptibility to injuries (Budgett,
1990; Kellmann, 2010).

2
Athletes subjected to high training loads may also experience burnout. Athlete
burnout is a psychological syndrome characterized by emotional and physical exhaustion,
reduced sense of accomplishment, and sport devaluation, and can be associated with the
intense demands of training (Raedeke, 1997). Athletes suffering from burnout may have
feelings of entrapment, lack of interest in training, and may withdraw from sport (Smith,
1986; Goodger, Gorely, Lavallee, & Harwood, 2007). Symptoms of athlete burnout
include lack of enthusiasm and depression (Smith, 1986; Raedeke, 1997).
Strong connections have been documented between overtraining and various
psychological variables, including coping ability and mood states. The Profile of Mood
States (POMS; McNair, Lorr, & Droppleman, 1971) is used to monitor mood
disturbances associated with overtraining because increases in training levels are
associated with corresponding increases in mood disturbances (Morgan, Brown, Raglin,
O’Connor, & Ellickson, 1987). Research has shown that individuals experiencing lower
amounts of mood disturbances in response to high training loads have more adaptive
coping skills than those with greater disturbances in mood states (Goss, 1994). Main and
colleagues (2010) reported that across a 45-week triathlete training season, psychological
stressors had greater associations with signs and symptoms of illness and injury than
physical training stressors. Ford, Eklund, and Gordon (2000) reported that a greater
ability to handle psychological stressors, due to better coping ability, was associated with
reduced injury vulnerability and faster recovery rates in athletes. Overall, the research
suggests that psychological, physical, and environmental stressors combined with
prolonged training periods and inadequate recovery can lead to adverse psychological
changes and increased susceptibility to physical symptoms, illness, and injury.

3
Smith’s Cognitive-Affective Model of Athletic Burnout (1986) provides a
framework for understanding the relationships among stressors, cognitive appraisal,
behavior, and burnout. A key component of the model is cognitive appraisal, which
refers to how a person interprets stressful situations. Cognitive appraisals are influenced
by personal factors such as emotional status, coping ability, and physical strength.
Modifying a person’s interpretation of stressful situations could potentially change how
the person evaluates his/her ability to handle the physical and psychological stressors of
training and competition. Because these stressors are often associated with overtraining
syndrome and burnout, modifying the interpretation of the stressor could affect the stress
response, and possibly result in decreased susceptibility to physical symptoms, illnesses,
and injury. In a previous study, athletes completing a Cognitive-Behavioral Stress
Management Program, which included cognitive restructuring exercises, had a reduction
of the number of illness and injury days compared to a control group (Perna, Antoni,
Bum, Gordon, & Schneiderman, 2003). This study provides initial evidence suggesting
intervention programs focused on modifying variables that are associated with cognitive
appraisal could positively affect the stress response and risk of injury and illness. A
potential variable that might influence cognitive appraisals made by athletes is mental
toughness.
Mental toughness is the ability to perform at the upper range of one’s ability
regardless of the circumstances, and is one of the most important characteristics that an
athlete can possess (Loehr, 1986). Because of the importance of the mental aspect to
successful athletic performance, focus has been directed at measuring and improving
mental toughness. The Mental, Emotional, and Bodily Toughness Inventory

4
(MeBTough; Mack & Ragan, 2008) was developed to assess mental toughness in athletes
based on Loehr’s views of mental toughness consisting of 3 areas: physical (assessed
with two components: Being Well Prepared and Acting Tough), emotional (four
components: Emotional Flexibility, Emotional Resiliency, Emotional Strength, and
Emotional Responsiveness), and mental (three components: Coping, Creating an Optimal
Performance State, and Accessing Empowering Emotions). This is a valid and reliable
measure of mental toughness in collegiate athletes (Mack & Ragan, 2008).
A recent cross-sectional pilot study (Welch, 2010) of 145 NCAA Division I
athletes assessed the relationships among mental toughness, mood disturbances, and
burnout. Athletes with higher levels of mental toughness reported lower levels of
burnout (ρ=-0.65, p ≤.01) and fewer mood disturbances ( ρ=-0.46, p ≤.01). These results
indicate that the MeBTough effectively assesses the emotional aspect of mental
toughness, and that burnout and mood disturbances are inversely associated with mental
toughness. These relationships suggest that mental toughness may be a key
psychological variable that could be targeted in an attempt to attenuate mood
disturbances and burnout.
Based on Smith’s Cognitive-Affective Model of Athletic Burnout (Smith, 1986),
modifying psychological variables that influence cognitive appraisals associated with
overtraining and burnout will positively influence physical and psychological responses
to training stress, and reduce overtraining and burnout. A mental toughness training
intervention focusing on improving an athlete’s ability to handle mental, emotional, and
bodily stress should increase the physical and psychological resources of that athlete.
This increase in resources should positively influence cognitive appraisals made about

5
stressful situations by increasing the athletes’ confidence in their ability to deal with any
physical or psychological stressors encountered. Improved ability to handle stressors
should reduce overtraining, resulting in a lower incidence of mood disturbances, physical
symptoms, illnesses, and injuries in collegiate athletes.
A six-week Mental Toughness Training Program has been developed and is based
on Loehr’s definition of mental toughness and the results from the MeBTough (see
Literature Review for more information about the program). This training program is
individualized and provides psychological and physical skills training based on the each
athlete’s MeBTough score. The Mental Toughness Training Program has been shown to
increase collegiate athletes’ mental toughness levels and improve athletic performance
(Measuremental LLC, 2010). The Mental Toughness Training Program was being tested
in Division I Track and Field athletes, as well as the military, but had yet to be used in a
research study and had not been tested in a Division III population.
1.1 Purpose
The purpose of this study was to a) evaluate the cross-sectional associations
between mood disturbances, athlete burnout, coping ability, depression, physical
symptoms, perceived stress, and mental toughness in Division III athletes, b) implement
the Mental Toughness Training Program, and c) evaluate the impact of the mental
toughness training on changes in mood disturbances, athlete burnout, coping ability,
depression, physical symptoms, perceived stress, and mental toughness before, during,
and after the intervention program.
6
1.2 Specific Aims
1. Examine the baseline relationships among mood disturbances, athlete burnout,
coping ability, depression, physical symptoms, perceived stress, and mental
toughness in Division III athletes.
2. Determine if the Mental Toughness Training Program increases mental toughness
in Division III athletes.
3. Measure and compare the impact of mental toughness training, versus no training,
on levels of mood disturbance, athlete burnout, coping ability, depression,
physical symptoms, and perceived stress before, during, and after the training
program.
1.3 Hypotheses
1. Consistent with the literature, baseline mental toughness will be negatively
correlated with mood disturbances, athlete burnout, depression, physical
symptoms, and perceived stress, and positively correlated with coping ability.
2. The Mental Toughness Training Program will result in increased levels of mental
toughness as compared to the control group where no changes in mental
toughness levels are expected.
3. Improved mental toughness resulting from the training will attenuate levels of
mood disturbances, athlete burnout, depression, physical symptoms, and
perceived stress in the training group as compared to the control group.

7
CHAPTER 2
LITERATURE REVIEW
Chapter 2 provides a review of the literature that supports the rationale for
conducting this research study. The chapter focuses on the primary topics of relevance
for this research including: (1) sport injury, (2) overtraining syndrome and burnout, (3)
the Cognitive-Affective Model of Athletic Burnout, (4) stress and coping, and (5) mental
toughness. After reviewing these topics, the chapter concludes with a brief summary of
important concepts and hypotheses for this research study.
2.1 Sport Injury
In 2007, a total of 370,470 college students participated in NCAA sports in all
divisions (United States Government Accountability Office, 2007). From 1988 to 2004,
NCAA varsity sport participation increased in both sexes, with an 80% increase in
participation in women and 20% increase in men (Hootman et al., 2007). With such high
numbers of individuals participating in collegiate sports, and the added trend of these
numbers increasing over time, it is reasonable to be concerned that an increase in the
number of injuries may occur.
Injuries are a significant problem facing collegiate athletes, and are one of the
principle health hazards of sport (Requa, DeAvilla, & Garrick, 1993). From 1988 to
2004, in all divisions in the NCAA, there were 72,316 injuries during games and 109,160
injuries during practices reported to the Injury Surveillance System (Hootman et al.,
2007). However, not all schools participate in contributing data to the Injury

8
Surveillance System, and not all schools report data for all their varsity teams, so this
may be an underestimation. Although prevention programs for specific injuries and
joints have been designed (Mandelbaum et al., 2005; Niederbracht, Shim, Sloniger,
Paternostro-Bayles, & Short, 2008), injury continues to be a concern in athletics.
There are outcomes to being injured as an athlete other than inability to compete
and disruption of training schedules. Because there are many negative health
consequences associated with being injured, utilizing strategies, both physical and
psychological in nature, to attenuate injury risk could be beneficial for the athletic
population. Research suggests that psychological and physical variables associated with
overtraining syndrome and burnout are predictors of injury and illness. These predictors
of injury and illness will be discussed in this literature review and mental toughness, a
modifiable construct, will be presented as a potential mediator of these variables.
2.2 Predictors of Injury/Illness
2.2.1 Overtraining Syndrome
There is currently much confusion in the literature regarding the definition of
overtraining and related conditions (Kuipers & Keizer, 1988; Budgett, 1990), and
uniform terminology has not been established (Fry, Morton, & Keast, 1991). In the
current study, the following definitions will be used. Overreaching is the process of
subjecting an athlete to heightened training loads and under-recovery in the short-term.
Overreaching is a deliberate part of the training cycle that results in better athletic
performance, provided that there is adequate recovery time after this process (Kuipers &
Keizer, 1988). Overtraining occurs when the cycle of high intensity, high volume

9
training continues over weeks or months without enough time for the athlete to recover,
and is the process that can lead to the development of the overtraining syndrome.
Overtraining syndrome is the maladaptive response to prolonged and excessive training
without appropriate recovery that persists for weeks to months (Kraemer & Nindl, 1998).
2.2.1.1 The Effects of Training and Overtraining
Athletes must be exposed to high levels of physical training in order to elicit
training adaptations and improve performance (Bompa, 1983). Training to improve
performance is based on the principle of progressive loading, or overload, which states
that a system can adapt when subjected to loads that exceed the system’s current capacity
(Bompa, 1983), or that disturbs homeostasis (Fry et al., 1991). With adequate rest, the
same load in the future will not exceed the body’s capacity. During any type of training,
responses occur at the cellular and tissue levels in the body in effort to adapt. For
example, there is an upregulation of enzymes and increased protein synthesis in response
to training stimuli (Booth, Tseng, Fluck, & Carson, 1998). Well-designed training cycles
include sufficient time for the normal healing processes in the body to occur to maximize
training gains.
While overload is necessary for adaptation to occur, without adequate time
between training sessions, the regeneration process becomes dysfunctional. The body is
unable to keep up with the amount of breakdown occurring from physical stress due to
high training loads, and adaptation fails. Excessive training can therefore affect the
musculoskeletal system, leading to changes in strength, range of motion, and stress
reactions in bones. Over time, this can lead to injury from chronic tissue disruption
(Kibler & Chandler, 1998). When this occurs, the system is placed in a state of

10
mechanical disadvantage.
Overtraining, in terms of its physiological effects on the body, is a series of
biomechanical, anatomical, and physiological stresses that eventually lead to overload on
the weakened and compromised musculoskeletal system (Kibler, Chandler, & Stracener,
1992). It has been suggested that the above changes may predispose the musculoskeletal
system to injury with continued use (Kibler & Chandler, 1998). For example, stress
fractures can occur from inappropriate and repetitive loading to the musculoskeletal
system, and therefore may result from overtraining. High levels of intense training for
prolonged periods without adequate recovery can negatively affect performance (Kibler
& Chandler, 1998) and predispose athletes to psychological problems, illnesses, and
injuries (Kuipers & Keizer, 1988).
2.2.1.2 Treatment of Overtraining Syndrome
The current treatment for overtrained athletes is rest to allow the body time to heal
and regenerate (MacKinnon, 2000; Purvis, Gonsalves, & Deuster, 2010), and
participation in stress management activities that may include relaxation therapy and
counseling (Budgett, 1990). The amount of rest needed to reverse overtraining can vary
from weeks to months (Kuipers & Keizer, 1988). One suggestion in the literature states
that overtrained athletes should rest for one month, and training can resume in short, low
intensity bouts as the athlete starts to recover (Budgett, 1990). Training can gradually
increase as tolerated, building up to full training in a progressive manner that could take
up to three months (Budgett, 1990). Other literature suggests that complete cessation of
activity is not necessary, and light aerobic activity can continue, with a slow increase in
intensity over 6-12 weeks (Budgett, 1998). Sport-specific recommendations have not yet
11
been developed. The majority of the literature discussing treatment strategies for
overtrained athletes emphasizes preventing the onset of the syndrome in the first place
(Budgett, 1990; Eichner, 1995; Budgett, 1998; MacKinnon, 2000).
2.2.1.3 Prevalence of Overtraining Syndrome
The exact prevalence of overtraining syndrome is difficult to estimate. The
amount of high-intensity training that results in overtraining differs between individuals,
and symptoms experienced by overtrained athletes very (MacKinnon, 2000). It has been
estimated that the career prevalence of overtraining syndrome in elite female long
distance runners is 60% (Morgan, O’Connor, Sparkling, & Pate, 1987). It has also been
reported that the percentage of long distance swimmers completing more than 14000m
per day suffering from overtraining syndrome per season is, on average, 10% (Morgan,
Brown, et al., 1987). Using data collected from previously published research,
MacKinnon (2000) estimated that between 7 and 20% of athletes at any time in their
training cycles may be exhibiting the signs and symptoms of overtraining.
2.2.1.4 Monitoring Overtraining
Given that the main treatment strategy for the overtraining syndrome is rest and
time off from training (Budgett, 1990; MacKinnon, 2000; Purvis et al., 2010), preventing
the athlete from reaching this point is imperative to avoid disruptions in their training
plan, competitive schedule, athletic careers, and well-being. Markers of overtraining
include the typical signs and symptoms experienced by overtrained athletes,
physiological markers, and psychological variables.
2.2.1.4.1 Signs and Symptoms of Overtraining
The signs and symptoms of overtraining syndrome vary from person to person.

12
Some common signs and symptoms include mood changes, depression, increased resting
heart rate, increased risk for developing infections, increased susceptibility to injuries
(Budgett, 1990; Kellman, 2010), and decreased athletic performance (Budgett, 1998).
Fry and colleagues (1991) cited 85 sign and symptoms that have been documented in
overtrained athletes. Because of the variety of ways the syndrome may present, it is
difficult to diagnose athletes with overtraining syndrome.
2.2.1.4.2 Physiological Markers of Overtraining
When the body is in an overtrained state, physiological processes, as discussed
previously, become affected. It has been suggested that monitoring the alterations in
levels of certain biomarkers, for example hormones, can be used to diagnose overtrained
athletes. Mucosal immune responses (MacKinnon & Hooper, 1994), glutamine levels
(Walsh, Blannin, Robson, & Gleeson, 1998), creatine kinase levels (Flynn et al., 1994),
cytokine production (Main, Dawson, Grover, Landers, & Goodman, 2009), and altered
neuroendocrine levels (Urhausen, Gabriel, & Kindermann, 1995) have been investigated
as potential indicators of overtraining. However, the duration and intensity of training in
these studies varies and may be more indicative of overreaching than overtraining. There
are also inconsistencies in the effectiveness of the above-mentioned markers in the
literature (MacKinnon, 2000).
2.2.1.4.3 Psychological Markers of Overtraining
As physiological measures of monitoring overtraining require further
investigation and thus far have demonstrated unclear relationships, it is more common to
use psychological markers to track an athlete’s responses to training. Strong connections
have been documented between overtraining and mood state.

13
Morgan, Brown, and colleagues (1987) found that there was a dose-response
relationship between mood state disturbances and increased training load in 400
collegiate-level competitive swimmers over the course of a season. As the training load
increased, mood state disturbances increased as well, and mood disturbances returned to
baseline levels when training was reduced. In a study by Raglin, Morgan, and O’Connor
(1991), 186 female and male swimmers were followed for 4 years with mood states being
evaluated at regular intervals. Findings from this study were similar to those obtained by
Morgan, Brown, and colleagues (1987), and mood disturbances increased in response to
increases in training. There is support for tracking mood changes to monitor reactions to
increases in training volume in the short-term as well. In 12 male college-aged
swimmers, 10 days of increased training significantly increased mood disturbance scores
(Morgan, Costill, Flynn, Raglin, & O’Connor, 1988). Because negative mood states have
consistently been shown to be inversely associated with training volume, tracking mood
over time may be the most effective way to identify athletes that may be overtrained.
2.2.1.4.4 Measuring Mood States
Studies that evaluate mood states in order to monitor adaptation to heavy training
loads and identify athletes experiencing overtraining commonly use the Profile of Mood
States questionnaire (POMS; McNair et al., 1971). The shortened version of the POMS
(POMS-30) contains 30 items in 6 subscales (containing 5 items each): Tension,
Depression, Anger, Fatigue, Confusion, and Vigor. The individual is asked to rate a
series of adjectives based on the way he/she feels at that moment. The subscales are
scored by summing the items and a Total Mood Disturbance (TMD) score is calculated
by summing the negative mood subscale scores and subtracting the positive mood

14
(Vigor) subscale score. A major strength of using the POMS for evaluating mood state is
the ability to plot the subscale scores in order to evaluate the shape, or POMS profile,
resulting from the plotted scores.
The subscale scores are often standardized into t-scores and then plotted on a
graph. The mean t-score for each of the POMS subscales in the general population is
approximately 50. In contrast to the general population, elite athletes have a ”better”
POMS score profile, often referred to as the “iceberg profile” (Morgan, 1985) because
the subscales representing negative constructs, such as Depression and Tension, have
scores lower than the population average, and the score on the Vigor subscale is greater
than the general population (see Figure 1).
Figure 1: POMS subscale profile representing optimal mood state, or the “iceberg profile” (adapted from Morgan, Brown, et al. (1987))
The iceberg profile is considered the ideal or optimal mood profile and is
commonly seen in elite athletes (primarily at the start and the end of competitive
! "#!
$%&!'()*!+,&-./0112/3&!%2-!4&&1!,-&5!.0!2/5!/1!.%&!63&7&1./01!08!07&3.32/1/19!
/1! 2!1,:4&3! 08! 2.%;&.&-<! /1! 2! 1,:4&3! 08! -603./19! 5/-=/6;/1&-! >?/=%1&3<! #@@"AB!C!
=01-/-.&1.! 8/15/19!%2-!4&&1! .%&!63080,15!=%219&! /1! 9;042;D.0.2;!:005!2:019-.!
07&3.32/1&5!2.%;&.&-!>)03921!!"#$%&'##@EFA<!%0G&7&3!5,&! .0! /15/7/5,2;!5/88&3&1=&!
.%/-!62..&31!723/&-!=01-/5&324;H!830:!2.%;&.&!.0!2.%;&.&!>*:/.%<!IJJJAB!
!
()*+,!#-.#/0!#1)2!3!,*#4,56)%!7#56#$#185,9$%7#$"0%!"!#!!!!!>$2K&1!830:!)03921!!"#$%&'##@ELA!
MJ!
"J!
NJ!
$&1-/01! O&63&--/01! C19&3! P/903! Q2./9,&! R018,-/01!
$!*=03&! '06,;2./01!C7&329&!
!!

15
seasons). There is substantial research evidence showing that as training load increases,
the POMS profile changes with Vigor scores decreasing and the negative mood subscales
scores increasing. The change associated with increased training is even more
pronounced in athletes with overtraining syndrome and results in an inversion of the
“iceberg profile” (Morgan, Brown, et al., 1987; see Figure 2)
Figure 2: POMS subscale profile in an overtrained athlete, or the inverted “iceberg profile” (adapted from Morgan, Brown, et al. (1987))
2.3 Athlete Burnout
2.3.1 Definition of Athlete Burnout
Athlete burnout is a psychological syndrome of emotional and physical
exhaustion, reduced sense of accomplishment, and sport devaluation, and can be
associated with the intense demands of training (Raedeke, 1997). Burnout has also been
defined as the process of wearing out, failing, or becoming extremely fatigued, due to
! "#!
!
!"#$%&'()'*+&'",-&%.&/'0"1&2&%#'3%45"6&7'45'8,'4-&%9%8",&/'89+6&9&'!!!!!$%&'()!*+,-!.,+/&)!&9'86:;'01234!
!
56789,:,/;8&:! 6<+(66! +(:&<(=! <,! ,>(+<+&;);)/! 9&6! ?(()! *,@)=! <,! 8,)<+;?@<(! <,!
)(/&<;>(!&:<(+&<;,)6!;)!<9(!)(+>,@6!+(/@:&<;,)A!%9(6(!6<+(66(6!-&7!),<!,):7!?(!&!
+(6@:<!,*! <+&;);)/!&)=!8,-B(<;<;,)C!?@<!-&7!&:6,!?(! ;)*:@()8(=!?7!B((+!B+(66@+(!
&)=!,<9(+!@)+(:&<(=!:;*(!6<+(66(6!$D;+89!&)=!E(,+/(C!01114A!%9(!89&)/(6!;)!-,,=!
6<&<(!<9&<!,88@+6!=@(!<,!&!+(6@:<!,*!,>(+<+&;);)/!&+(!&66,8;&<(=!F;<9!&!)@-?(+!,*!
8&+=;,>&68@:&+C! ()G7-&<;8C! ()=,8+;)(C! 9,+-,)&:! &)=! 97B,<9&:&-;8! 89&)/(6C!
F9;89! F9()! ,?6(+>(=! ;)! 8,)H@)8<;,)! F;<9! &! +(=@8<;,)! ;)! *@)8<;,)&:! 8&B&8;<7!
$.,+/&)!&9'86:;'012I4A!!
JKLM%MNOPOPE!NPQ!JKLM%MNOPOPE!!
N<9:(<(6! /(<! 6;8'! *,+! &! )@-?(+! ,*! +(&6,)6R! <9(6(! +(&6,)6! &+(! +(:&<(=! <,! &)!
(SB,6@+(! <,! B&<9,/();8! ?&8<(+;&:! ,+! >;+&:! &/()<6! $T,6<(+C! 01124A! N)(8=,<&:!
(>;=()8(!9&6!6@//(6<(=!<9&<!<9(+(!;6!&!B+(>&:()8(!,*!;::)(66!&-,)/6<!,>(+<+&;)(=!
&<9:(<(6!$T+7!&9'86:;'0110R!U(9-&))!&9'86:;'011VR!W-;<9C!#XXX4C!<9(+(*,+(!+(6@:<;)/!
;)! &)! ;)8+(&6(=! 6@68(B<;?;:;<7! <,! 8,:=6C! ;)*:@()G&C! &::(+/;(6C! ;)8+(&6(=! 9(&:;)/!
IX!
"X!
YX!
%()6;,)! Q(B+(66;,)! N)/(+! K;/,+! T&<;/@(! Z,)*@6;,)!
%!W8,+(!
5,B@:&<;,)!N>(+&/(!
! !

16
excessive demands being placed on the individual’s energy, strength, or resources
(Freudenberger, 1974). Burnout results from chronic stress exposure, and is influenced
by motivation (Smith, 1986).
2.3.2 Athlete Burnout versus Overtraining Syndrome
There are similarities between athlete burnout and overtraining syndrome, but
these are two distinct conditions. Overtraining results primarily from excessive levels of
a physical stressor (training load). There are psychological attributes associated with this
condition as well, but the causes of overtraining are predominantly physical in nature,
and overtraining causes the observed changes in mood states. Athlete burnout results
mainly from chronic psychological stress. Additionally, overtrained athletes do not lose
motivation to train and participate in sport, which occurs in burnout (Smith, 1986).
Conversely, overtrained athletes who experience reductions in performance often do not
decrease their training and may actually increase training loads in an effort to compensate
for the performance decrements being experienced. Athletes who experience burnout
lose the motivation to maintain their training routines, and may only continue to
participate due to pressures from external sources (Peterson, 2005)
2.3.3 Process of Burning Out
Burnout is a potential outcome when an athlete is exposed to chronic stress,
physical or psychological in nature (Smith, 1986). Lack of control and feelings of
entrapment may put athletes at risk for developing burnout (Coakley, 1992; Schmidt &
Stein, 1991). Burnout is linked with high effort being put in to sport and training, but low
satisfaction being the outcome (Iacovides, Fountoulakis, S. Kaprinis, & G. Kaprinis,
2003). Motivation to train and continue sport participation decreases (Smith, 1986). The

17
end result of athletic burnout can be quitting the sport. Athletes discontinue sport
participation when the costs outweigh the benefits compared to other activities. Costs
include negative experiences, depression, and fear of failure (Smith, 1986). In athletes,
burnout has been correlated with perceived stress (Raedeke & Smith, 2001; Smith,
Gustafsson, & Hassmen, 2010). However, not every athlete subjected to chronic stress
burns out (Raedeke, 1997).
2.3.4 Symptoms of Athlete Burnout
Symptoms of athlete burnout vary on an individual basis. In a review of the
general burnout literature by Schaufeli and Buunk (2003), five categories of symptoms
were associated with the condition: affective (e.g. depressed mood), cognitive (e.g.
impaired memory and attentional deficits), physical (e.g. exhaustion), behavioral (e.g.
impaired performance), and motivational (e.g., lack of enthusiasm). These symptoms are
observed in athlete burnout as well (Goodger et al., 2007).
To an athlete experiencing burnout, both sport and performance may no longer be
of importance (Gould, Udry, Tuffey, & Loehr, 1996), and he/she may withdraw from
sport (Raedeke, 1997). Athletes suffering from burnout may also feel that their
expectations have not been met, and feel that they lack the ability to achieve the goals
they set for themselves (Gould et al., 1996). Professional male rugby players in Australia
displaying early signs of athlete burnout at the start of a season, such as viewing training
as a hassle, had a significantly higher chance of experiencing athlete burnout over the
course of a season (Cresswell, 2009).
2.3.5 Treatment for Athlete Burnout
Similar to overtraining, individuals suffering from burnout require rest

18
(Sonnenschein, Sorbi, van Doornan, Schaufeli, & Maas, 2007). In a study conducted by
Grylls and Spittle (2008), 264 competitive Australian athletes were studied, and it was
found that athletes currently injured had lower levels of burnout as a group than uninjured
athletes. This was attributed to having time off from competition to rest and a necessary
reduction in training in response to injury.
2.3.6 Impact of Overtraining and Burnout on Illness and Injury Risk
There is evidence in the literature to support that overtraining and burnout, and
the psychological and physical stressors associated with them, can result in an increased
susceptibility to illness and injury. Main and colleagues (2010) followed 30 well-trained
triathletes across a 45-week triathlete training season, and found that psychological
stressors had greater associations with signs and symptoms of illness and injury than
physical training stressors. Ford and colleagues (2000) reported that a greater ability to
handle psychological stressors, due to better coping ability, was associated with reduced
injury vulnerability and faster recovery rates in athletes. Overtraining and burnout may
lead to an increased risk of illness and injury, and the Cognitive-Affective Model of
Athletic Burnout (Smith, 1986) will be used to outline the relationships between variables
contributing to this.
2.4 Cognitive-Affective Model of Athletic Burnout
The Cognitive-Affective Model of Athletic Burnout (Smith, 1986; see Figure 3)
provides a framework for understanding the many variables, both physical and
psychological, that influence an individual’s response to stress. This model breaks the
stress response into four components: the situation, cognitive appraisal, the physiologic

19
response, and associated behavior.
Figure 3: Smith’s (1986) Cognitive-Affective Model of Athletic Burnout
The situational component, the first stage, includes the interactions that take place
between an athlete’s physical and psychological resources and the demand from the
environment, either internal or external. The second component is cognitive appraisal of
the situation. If the result of the appraisal is the perception of a threat, a physiological
stress response (component three) occurs. Then coping behaviors (fourth stage) are
initiated in an attempt to deal with the stress responses that have occurred. In addition,
each of these four components can be influenced by personality and motivational factors.
The component of cognitive appraisal plays a central role in this framework.
Cognitive appraisal includes the perception of four elements: demands, resources
available to deal with those demands, nature and likelihood of consequences of demands
not being met, and the importance of those demands to the individual. Cognitive

20
appraisal is what leads to the physiological and attentional responses. Excessive stress
responses are the result of the perception that demands exceed the resources available to
deal with the situation. Burnout represents the consequences of the four components of
stress. If there is a longstanding imbalance between demands and resources, the result is
the perceived overload of stress, which can increase levels of psychological variables that
are predictors of injury and illness.
It is the appraisal of the situation and the athlete’s perception of their ability to
cope with that situation that determines the stress response. Based on this framework
(Smith, 1986), modifying cognitive appraisal could change an athlete’s interpretation of
potentially stressful situations. Therefore, modifying psychological variables that
influence cognitive appraisal could lead to a reduction in the stress response. This might
ultimately lead to a reduction in overtraining, burnout, and injury and illness in athletes.
2.5 Stress and Coping Ability
College athletes, when compared to their non-athlete counterparts, experience
stressors that are not associated with academics and are not part of general life stressors.
Athletes experience stress in response situations such as competition, athletic injuries,
and competing for starting positions that non-athlete students do not face. This can lead
to higher stress levels in athletes (Ntoumanis, Biddle, & Haddock, 1999).
2.5.1 Stress and Injury
Stressful situations in sport, such as an important game or psychologically
demanding practice, can contribute to the potential for sustaining an injury if the athlete
perceives these situations as threats. When a situation is perceived as threatening,
21
anxiety levels are increased, changing muscle tension or causing a distraction.
Attentional disruptions can increase the risk for injury. For example, if an athlete is
distracted, they may not notice a hole on the field, step into it, and injure their ankle
(Williams, Tonymon, & Andersen, 1991). Stress can also lead to increased muscle
tension, which can interfere with normal coordination and increase the chance of injury
(Nideffer, 1983).
Research supports the notion that a higher level of stress in an athlete leads to a
greater risk of being injured. Smith, Smoll, and Ptacek (1990) showed that athletes
experienced more injuries when they had high stress levels combined with low levels of
coping ability and low social support. Thus, physical stress from training is not the only
cause of negative outcomes for athletes. Ford and colleagues (2000) studied 121 athletes
in varying sports and competitive levels. The researchers reported that a greater ability to
handle psychological stressors was associated with reduced injury vulnerability and faster
recovery rates in athletes. One of the reasons for the reduced risk of injury was due to
better abilities to cope with life stressors. Main and colleagues (2010) followed 30 well-
trained triathletes across a 45-week triathlete training season. They reported that
psychological stressors had greater associations with signs and symptoms of illness and
injury than physical training stressors.
2.5.2 Stress and Illness
The relationship between stress and illness in athletes is less clear. While there is
evidence in the literature that does not demonstrate a relationship between higher levels
of stress and increased risk for illness (Cohen & Williamson, 1991), there is also
evidence to support the notion that higher levels of stress result in increased risk for

22
illness. A recent study (Moreira et al., 2011) examined the relationship between stress,
training load, and upper respiratory illness in 15 basketball players across four weeks.
Increased training load and stress were associated with an increase in upper respiratory
track infections. A study by Brink and colleagues (2010) involved tracking training load,
perceived stress, and injuries of 53 elite soccer players across two years. Physical stress
(i.e. training load) was related to illness and injury rates, and psychological stress was
associated with illnesses.
2.5.3 Moderating Stress
There have been studies examining ways to moderate the effect of stressors that
athletes experience, both in training and in their everyday lives. Athletes receiving a
Cognitive-Behavioral Stress Management Program, which included cognitive
restructuring exercises, experienced reductions in the number of injury and illness days
compared to a control group (Perna et al., 2003). In a study conducted by Maddison and
Prapavessis (2005), a stress management program during the pre-season caused a
reduction in time-lost due to injury in the intervention group during the season when
compared to the control group. These researchers included somatic and cognitive-based
relaxation strategies, such as progressive relaxation and imagery, in this stress
management program. Also included were goal setting tasks, planning, and activities for
home completion. This evidence suggests that providing strategies for athletes to deal
with stress more effectively would result in decreased risk of injury and illness.
2.5.4 Coping Ability
Coping refers to a process of constantly changing cognitive and behavioral efforts
to manage specific external or internal demands or conflicts appraised as distressing or

23
exceeding one’s resources. Coping strategies are dynamic, conscious efforts on the part
of the individual to eliminate or manage situations that are perceived as stressful (Lazarus
& Folkman, 1984). Athletes with effective coping strategies will be better able to
manage the stress and demands of athletic pursuits.
The coping strategy used by an athlete depends on individual and situational
factors (Bouffard & Crocker, 1992). Coping strategies may be divided into two
categories: problem-focused and emotion-focused coping. In problem-focused coping,
the individual tries to alter or manage the problem that is causing the stress. This could
include information gathering, time-management, or goal setting. Emotion-focused
coping involves changing emotions evoked by the problem that is causing the stress for
the individual. Examples of this include meditation and cognitive effort to change the
meaning of the situation to that individual (Lazarus & Folkman, 1984). A third category,
avoidance coping, was created in which the individual does not confront the stressor
directly, but focuses on something else (Endler & Parker, 1994). In previous studies, it
was shown that athletes use a variety of coping strategies in both competitive and
everyday situations (Nicholls & Polman, 2007).
2.5.5 Coping Ability, Stress, and Burnout
A study conducted by Hanson, McCullagh, and Tonymon (1992) compared
coping abilities to injury risk in 181 Division I Track and Field athletes. Athletes who
had more coping strategies to deal with stress did not experience injuries during their
seasons. Raedeke and Smith (2004) conducted a study in athletes 14-19 years of age to
determine the effects of perceived stress, coping, and social support on the incidence of
burnout. Higher burnout scores were significantly correlated with higher levels of stress

24
and lower levels of coping ability. They concluded that, in regards to stress and coping
abilities, high stress and low ability to cope made athletes susceptible to burnout.
Hill, Hall, and Appleton (2010) found that the type of coping strategy used
influenced the relationship between coping and athlete burnout in junior athletes.
Athletes using problem-focused coping strategies had lower levels of athlete burnout,
while the use of avoidance-focused coping was related to higher levels of athlete burnout.
This study suggested that athletes using problem-focused coping strategies had lower
risks of burning out. Research has also shown that individuals with more adaptive coping
skills experience lower amounts of mood disturbances in response to high training loads
than those with greater disturbances in mood states (Goss, 1994).
It is clear that there are associations between injury and illness risk and
psychological variables based on the evidence from the literature. Overtraining and
athlete burnout may also increase the potential for experiencing an injury. The
framework of the Cognitive-Affective Model of Athletic Burnout (Smith, 1986) suggests
that interventions aimed at modifying the stress response can reduce the potential for
experiencing an injury. Modifying psychological constructs that affect cognitive
appraisal may attenuate the stress response. One such construct is mental toughness.
2.6 Mental Toughness
Mental toughness is a concept commonly referred to in the sporting world. Coaches
and athletes indicate that 50% of performance is mental, and that the concept of being
mentally-tough is one of the most important characteristics that an athlete can possess
(Loehr, 1986). At elite levels of athletics, differences in physical ability between athletes

25
are minimal (Moran, 2004). Psychological attributes play a key role, regardless of the
sport, in linking athletes with success (Williams & Krane, 2001).
Much of the initial research done in the area of mental toughness involved
interviewing athletes and coaches on their opinions of the characteristics of mentally-
tough performers. These individuals often cited similar qualities, and these were
compiled to create profiles of mentally-tough performers (Jones, Hanton, &
Connaughton, 2002; Bull, Shambrook, James, & Brooks, 2005). In the literature, mental
toughness has been used interchangeably with other concepts in some instances, for
example, with the concepts of resiliency and determination (Moran, 2004). However,
mental toughness is a distinct construct.
2.6.1 Definition of Mental Toughness
Mental toughness is the ability to perform at the upper range of one’s ability
regardless of the circumstances (Loehr, 1986). Loehr’s (1986) framework for mental
toughness consisted of self-confidence, negative energy control, attention control,
visualization and imagery control, motivation, positive energy, and attitude control.
Loehr later added that mental toughness depended on mental, physical, and emotional
attributes (Loehr, 1994). Other researchers have expanded on Loehr’s framework, and
have added that athletes that are mentally-tough have the ability to cope better than their
opponents with the demands of sport, and remain determined, focused, confident, and in
control under pressure (Jones et al., 2002). A mentally-tough individual has the capacity
to deal effectively with stressors, pressures, and challenges (Clough, Earle, & Sewell,
2002). Fletcher (2005) added that mental toughness can be viewed as a moderator of
stress, helping an individual to manage the demands of stressors in his/her environment.
26
The effect of environmental stressors is mediated by cognitive appraisal and perception
of those stressors, and the coping ability that the individual possesses. Fletcher (2005)
suggested that the mental toughness level of an athlete would influence how that athlete
responds behaviorally, emotionally, and cognitively to stressors. Therefore, mentally-
tough individuals would be less affected by stressors in their environment.
2.6.2 Assessment of Mental Toughness
Because of the large impact of the mental aspect on performance, focus has been
directed at measuring and improving mental toughness. Many tools exist to measure the
construct of mental toughness. Several attempts have been made to develop a
psychometrically sound and theoretically relevant measure but most have been
unsuccessful. A recently developed measure, the MeBTough (Mack & Ragan, 2008),
which has good psychometric properties and is grounded in relevant theoretical
framework, will be discussed.
2.6.2.1 Sport Performance Inventory
The Sport Performance Inventory (SPI; Jones, Neuman, Altmann, & Dreschler,
2001) is an 83-item measure of sport specific attitudes with 6 subscales: Competitiveness,
Team Orientation, Emotional Control, Positive Attitude, Safety Consciousness, and
Mental Toughness. The 17-item Mental Toughness subscale assesses components of
Loehr’s mental toughness framework, however it is does not provide a comprehensive
evaluation of mental toughness. An initial study provided evidence of reliability (Jones
et al., 2001), but further evidence for its validity and reliability is needed (Sheard, 2010).
2.6.2.2 Mental Toughness 48
The Mental Toughness 48 (MT48; Clough et al., 2002) consists of 48 items, and has

27
six subscales: Challenge, Commitment, Interpersonal Confidence, Confidence in Own
Abilities, Emotional Control, and Life Control. The theoretical framework for this
questionnaire is based on Kobasa’s (1979) model of hardiness. This measure has an
overall Cronbach’s alpha of 0.87 and test-retest coefficient of 0.90 (Clough et al., 2002).
However, there is limited data on its psychometric properties, and little explanation of the
association between mental toughness and hardiness, on which the scale is based (Sheard,
2010), and thus lacks relevance to the construct of mental toughness (Connaughton,
Wadey, Hanton, & Jones, 2008).
2.6.2.3 Sport Mental Toughness Questionnaire
The Sport Mental Toughness Questionnaire (SMTQ; Sheard, Golby, & van Wersh,
2009) is a 14-item measure of mental toughness and includes the subscales of
Confidence, Constancy, and Control. This scale was developed by pooling common
themes from the literature on mental toughness. Through validation studies, the measure
showed good construct validity and internal reliability, with one study providing
reliability coefficients for the subscales of 0.71 or higher (Sheard et al., 2009). However,
the scale lacks grounding in a theoretical framework.
2.6.2.4 Mental, Emotional, and Bodily Toughness Inventory
Because existing inventories for mental toughness had poor psychometric properties,
the Mental, Emotional, and Bodily Toughness Inventory (MeBTough) was developed
(Mack & Ragan, 2008). The MeBTough is a unidimensional measure that assesses
mental toughness in athletes based on Loehr’s (1994) views of mental toughness
consisting of 3 areas: physical, emotional, and mental. Physical toughness is assessed
through two components: Being Well Prepared and Acting Tough. Emotional toughness
28
is assessed through four components: Emotional Flexibility, Emotional Resiliency,
Emotional Strength, and Emotional Responsiveness. Mental toughness is assessed
through three components: Coping, Creating an Optimal Performance State, and
Accessing Empowering Emotions.
Undergraduate students at a Midwestern university (N=261) participated in the study
leading to the development of this measurement tool. In the initial questionnaire, five
questions in each the nine components were included. The items were rated on a seven-
point Likert scale, ranging from 1= almost never, 4 = sometimes, and 7 = almost always.
Through Rasch analysis, 43 of the items had good fit, and thus comprised the final
version of the MeBTough. The Rasch method, part of modern measurement theory, was
selected in this study because it does not have the same limitations as exploratory and
confirmatory analysis techniques (Zhu Timm, & Ainsworth, 2001). There are several
advantages to using the Rasch model over more traditional forms of analysis. Using the
Rasch model leads to more precise measurement, and ordinal data can be converted into a
linear scale. Comparisons can be made across studies, and as a result, groups tested at
different times can be compared. Items can be examined for spread, redundancy, and
gapping, and it can be used to uncover components of the measurement scale that are
insufficient (Mack & Ragan, 2008).
Based on the results of the Rasch analysis, the MeBTough is a valid and reliable
measure in collegiate athletes. It had an item separation index of 6.31, showing that it
has six levels of item difficulty, and separation reliability statistic of 0.98 (Mack &
Ragan, 2008). These results indicate that this measure has good psychometric properties.
The rating scale for the MeBTough was changed to a four-point Likert scale, with

29
response options ranging from 1= almost never and 4 = almost always.
2.6.3 Mental Toughness and Injury
Mental toughness has been associated with injury. Levy, Clough, Polman,
Marchant, and Earle (2005) evaluated mental toughness levels in 40 elite swimmers,
using the MT48 (Clough et al., 2002) and self-reported incidence of injury. Levy and
colleagues found that swimmers with higher levels of mental toughness reported fewer
injuries than their less mentally-tough counterparts.
2.6.4 Association of Mental Toughness with Coping Ability
In a study conducted by Nicholls, Polman, Levy, and Backhouse (2008),
significant associations were found between mental toughness levels and coping abilities
in 677 athletes of varying ages and sports. The Coping Inventory for Competitive Sports
(CISC; Gaudreau & Blondin, 2002) was used to measure coping skills, and the MT48
(Clough et al., 2002) was used to measure mental toughness. There were significant
correlation between mental toughness and eight out of 10 of the subscales in the CISC.
Stronger associations were found between mental toughness and problem-focused coping
when compared to emotion-focused coping (Nicholls et al., 2008).
Kaiseler, Polman, and Nicholls (2009) found that mental toughness levels, as
measured by the MT48, were associated with coping and coping effectiveness. All of the
subscales in the MT48 as well as total score were able to predict coping ability and
coping effectiveness in athletes. Higher levels of mental toughness were seen in
individuals who used more problem-focused coping strategies.
2.6.5 Association of Mental Toughness with Mood State and Burnout
A cross-sectional pilot study (Welch, 2010) of 145 NCAA Division I athletes

30
assessed the relationships among mental toughness, measured by the MeBTough, mood
disturbances, assessed by the POMS questionnaire, and burnout, measured by the Athlete
Burnout Questionnaire. Mental toughness was strongly negatively correlated with
burnout (r=-0.65, p≤.01), and had an inverse relationship with total mood disturbances
(r=-0.46, p≤.01). Mental toughness scores from the participants were separated into
intervals, and the average total mood disturbance scores for each interval was graphed
(see Figure 4).
Figure 4: Average mood disturbance based on mental toughness levels (from Measuremental, LLC (2010))
The impact of mental toughness on mood disturbances can also be demonstrated
by comparing the “iceberg profile” to mood state profiles associated with different levels
of mental toughness. Average POMS subscale scores for the mental toughness score
intervals demonstrated that as mental toughness scores decreased, the mood state profiles

31
deviated further from the optimal “iceberg profile” (see Figure 5). These data show that
athletes with higher levels of mental toughness were experiencing lower levels of mood
disturbances. This relationship suggests that increasing mental toughness levels could
have a positive impact on mood states.
Figure 5: Mental toughness scores and their impact on POMS profiles (from Measuremental LLC (2010))
These results also indicate that the MeBTough effectively assesses the emotional
aspect of mental toughness, and that burnout and mood disturbances are associated with
mental toughness. Another finding from this study was that higher levels of mood

32
disturbances was associated with higher levels of burnout (r=.64, p≤.01).
2.6.6 Mental Toughness and Cognitive Appraisal
Mental Toughness is a modifiable construct. Mental toughness can change the
way in which an individual perceives a situation, and therefore relates to cognitive
appraisal. Based on the discussion of the framework of the Cognitive-Affective Model of
Burnout (Smith, 1986), modifying cognitive appraisal would attenuate responses to
stressful situations. Interventions to modify the stress response, based on the model,
would lead to a reduction in the risk of injury and illness (see Figure 6). The Mental
Toughness Training Program, an intervention, may be able to moderate the stress
response in athletes. Improved ability to handle stressors could decrease the incidence of
injuries in collegiate athletes.
Figure 6: Mental toughness and the Cognitive-Affective Model of Athletic Burnout (Smith, 1986)

33
2.6.7 Mental Toughness Training
A Mental Toughness Training Program was developed by Measuremental, LLC
(2010) based on the framework used when creating the MeBTough assessment tool. The
Mental Toughness Training Program is unique because it provides a personalized training
program based on the athlete’s overall MeBTough score. Based on the overall score, a
complex statistical model predicts how the athlete should have performed on each of the
nine components of the measure. The athlete’s actual scores on the nine components are
then compared with the expected scores to identify strengths and weakness. A strength
indicates the athlete has a higher score on a component than expected, and a weakness is
a lower than expected score. A personalized training program is developed based on the
athlete’s overall mental toughness score, primary strength, and primary weakness (see
Figure 7).
Figure 7: Actual mental toughness component scores for an athlete compared to expected scores (from Measuremental LLC (2010))

34
Individuals can have the same score but have differing mental toughness profiles.
For example, two people may have a total score of 482, but one may be weaker in
Emotional Flexibility while the other is weaker in Emotional Responsiveness (see Figure
8).
Figure 8: Mental toughness profile of two athletes with the same total score but differing strengths and weaknesses (from Measuremental LLC (2010))

35
Conversely, two athletes may have the same weakness but have different total scores and
different profiles (see Figure 9).
Figure 9: Mental toughness profiles for two athletes with differing total scores but the same weakness (coping) (from Measuremental LLC (2010))
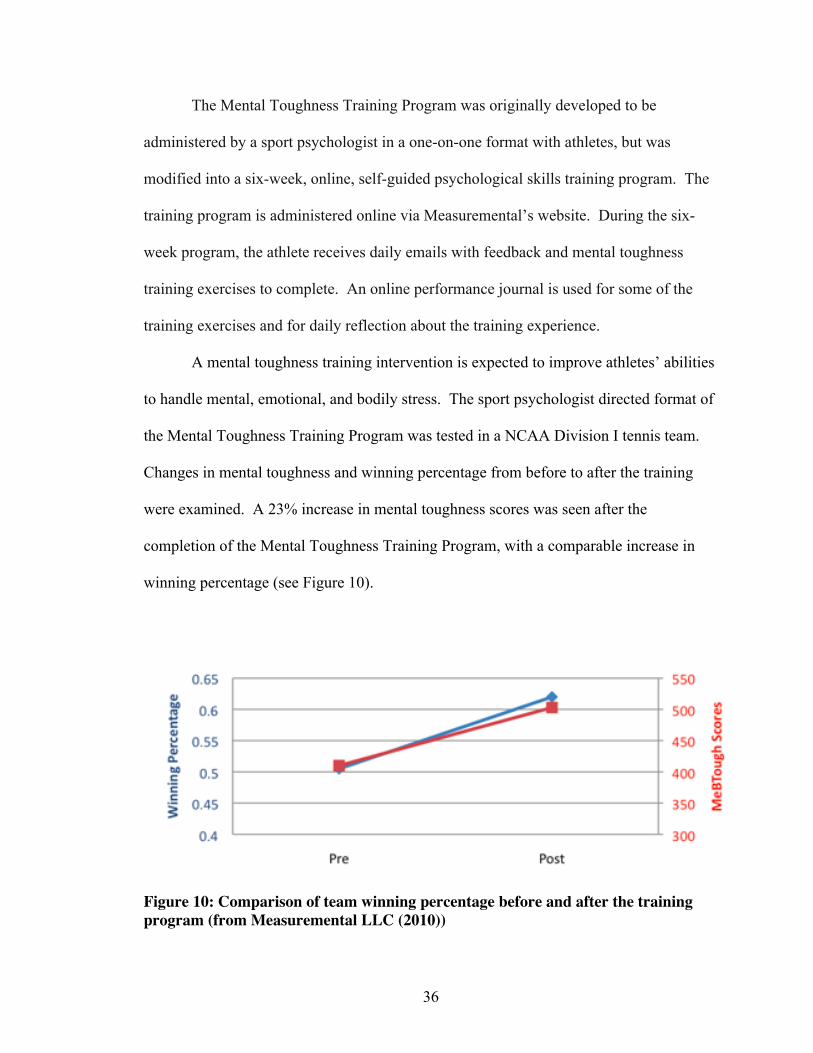
36
The Mental Toughness Training Program was originally developed to be
administered by a sport psychologist in a one-on-one format with athletes, but was
modified into a six-week, online, self-guided psychological skills training program. The
training program is administered online via Measuremental’s website. During the six-
week program, the athlete receives daily emails with feedback and mental toughness
training exercises to complete. An online performance journal is used for some of the
training exercises and for daily reflection about the training experience.
A mental toughness training intervention is expected to improve athletes’ abilities
to handle mental, emotional, and bodily stress. The sport psychologist directed format of
the Mental Toughness Training Program was tested in a NCAA Division I tennis team.
Changes in mental toughness and winning percentage from before to after the training
were examined. A 23% increase in mental toughness scores was seen after the
completion of the Mental Toughness Training Program, with a comparable increase in
winning percentage (see Figure 10).
Figure 10: Comparison of team winning percentage before and after the training program (from Measuremental LLC (2010))

37
The Mental Toughness Training Program had been used in other in other NCAA
Division I athletes, and was being tested Marine Corps Recruits. However, the Mental
Toughness Training Program had yet to be used in a research study, and had not been
tested in Division III athletes.
2.7 Summary
High numbers of college students are participating in NCAA sports (United States
Government Accountability Office, 2007). Collegiate athletes experience stressors that
non-athlete students do not, such as the physical and psychological stress that can be
associated with training and competition, and therefore may be at risk for developing
emotional and psychological problems. High levels of intense training for prolonged
periods without adequate rest can lead to the development of overtraining syndrome
(Kraemer & Nindl, 1988). Chronic stress, both psychological and physical in nature, can
lead to the development of athlete burnout (Raedeke, 1997). Psychological, physical, and
environmental stressors combined with prolonged training periods and inadequate
recovery can lead to adverse psychological changes and increased susceptibility to illness
and injury. The Cognitive-Affective Model of Athletic Burnout (Smith, 1986) provides a
framework for understanding the relationships among stressors, cognitive appraisal,
behavior, and negative health outcomes. Modifying a person’s interpretation of stressful
situations could potentially change how the person evaluates his/her ability to handle the
physical and psychological stressors of training and competition. Because these stressors
are associated with overtraining syndrome and burnout, modifying the interpretation of
them could lead to decreased susceptibility to illnesses and injury.

38
Mental toughness is the ability to perform at the upper range of one’s ability
regardless of the circumstances (Loehr, 1986), and may influence how that athlete
responds behaviorally, emotionally, and cognitively to stressors (Fletcher, 2005). The
Mental, Emotional, and Bodily Toughness Inventory (MeBTough; Mack & Ragan, 2008)
was developed to assess mental toughness, and a Mental Toughness Training Program,
designed to compliment this measure, was developed to increase mental toughness levels
in athletes. Based on Smith’s (1986) Cognitive-Affective Model of Athlete Burnout,
modifying psychological variables that influence cognitive appraisals should positively
influence physical and psychological responses to training stress. Mental toughness is a
modifier of cognitive appraisal, and therefore a mental toughness training intervention
should improve athletes’ abilities to handle mental, emotional, and bodily stress. This
should positively influence cognitive appraisals made about stressful situations by
increasing the athletes’ confidence in their ability to deal with any stressors encountered.
Improved ability to handle stressors could decrease the incidence of overtraining and
burnout, ultimately reducing the incidence of illnesses and injuries in collegiate athletes.

39
CHAPTER 3
METHODOLOGY
3.1 Design and Setting
This study used a randomized nested design with team being randomized for
treatment. The study was conducted in the Department of Kinesiology at the University
of Massachusetts Amherst. Data collection took place at an NCAA Division III private
institution. Study approval was obtained from the Institutional Review Board at both
institutions.
3.2 Participants
3.2.1 Recruitment and Eligibility
Participants for this study were female Division III athletes (ages 17-23) recruited
from the Varsity Field Hockey and Soccer teams at a private college. All participants
were medically cleared to participate in sport as per NCAA requirements, and
volunteered to participate in the study with the informed consent document (see
Appendix A) obtained prior to testing. Underage athletes completed assent documents
and provided parental consent to participate (see Appendix A). The Field Hockey and
Soccer teams from this Division III institution were chosen to participate in this study
because of the similarities in their schedules, team composition, 2010 records (soccer: 4-
11-1; field hockey: 4-12-1), and because they were both fall outdoor team sports. Both
teams began training camp in mid-August 2011, started their competitive schedules the
second week of September 2011, and played 16 regular season games each. The Field

40
Hockey team had a roster size of 19 at the start of training camp, while the Soccer team
started with 28, which was reduced to 21 at the start of the season. This yielded 47
potential participants during training camp for baseline data collection, and 40 potential
participants for the duration of the study. One team was randomly selected to complete
the Mental Toughness Training Program while the other served as the control.
Randomization by team rather than individual was done to help reduce condition
contamination that was likely to occur if teammates discussed the intervention at practice.
Ill or injured participants were allowed to continue to participate in the study, unless
advised otherwise for medical reasons.
All 47 potential participants during training camp consented to participate in
baseline data collection for Hypothesis 1#. From the 40 potential participants on the
finalized team rosters, all 40 consented to participate. However, data from two athletes
was not used in the study because they each experienced concussions that affected their
ability to participate in the intervention program and data collection. One participant
dropped out of the study. Therefore, data from 37 participants were used in the data
analysis for Hypothesis #2 and #3.
3.2.2 Power Analysis and Sample Size.
A power analysis was conducted based on the reported highest and lowest
correlations among mental toughness, mood disturbances, and burnout, an alpha level set
at 0.05, and an obtained power of 0.8. This yielded sample sizes of N =16 and N = 33. A
sample size of approximately 40 participants was used because of the necessity of using
two teams for the intervention, and because it would ensure that the study was adequately
powered even if participant attrition occurred. The study had a final sample size of 37

41
and was therefore adequately powered.
3.3 Measures
See Appendix B for the measures used in this study.
3.3.1 Demographics Questionnaire
All participants completed a brief demographics questionnaire. Questions on age,
year in school, year of eligibility in NCAA sport, medications, prior or present chronic
physical or psychological conditions, and the number of years of participation in sport
were asked.
3.3.2 Mental, Emotional, and Bodily Toughness Inventory
The Mental, Emotional, and Bodily Toughness Inventory (MeBTough; Mack &
Ragan, 2008) was used to measure mental toughness, and consisted of 41 items (divided
into nine components) rated on a four-point scale, with response options ranging from 1 =
almost never and 4 = almost always. It assessed physical (assessed with two
components: Being Well Prepared and Acting Tough), emotional (four components:
Emotional Flexibility, Emotional Resiliency, Emotional Strength, and Emotional
Responsiveness), and mental (three components: Coping, Creating an Optimal
Performance State, and Accessing Empowering Emotions) toughness. Example items
from this measure: “During stressful times, I have the ability to act tough”, which is from
the Acting Tough subscale, and “I have the ability to cope with crisis and adversity”,
from the Coping subscale. The MeBTough was scored using a computer algorithm, with
higher scores indicating that an individual had a higher level of mental toughness. Rasch
analysis showed that this questionnaire is a valid and reliable measure of mental

42
toughness in collegiate athletes. It had an item separation index of 6.31, indicating that it
had six levels of item difficulty, and separation reliability statistic of 0.98 (Mack and
Ragan, 2008).
3.3.3 Profile of Mood States-30
The short form version of the Profile of Mood States-30 (POMS; McNair et al.,
1971) questionnaire had 30 mood-related adjectives (for example: happy, full of pep) that
represented six subscales: Tension, Depression, Anger, Vigor, Fatigue, and Confusion.
Participants responded to the items based on how they were feeling “at this time” and the
items were scored on a five-point scale, with response options of 1= not at all to 5 =
extremely. Scores for each subscale were calculated by summing the responses from the
items in that subscale. A total mood disturbance score was calculated by subtracting
scores on the Vigor subscale from the sum of the scores from all the other subscales. A
higher total score indicated a greater magnitude of mood disturbance. The POMS is a
valid and reliable measure of mood state (Bourgeois, Meyers, & LeUnes, 2010).
3.3.4 Athlete Burnout Questionnaire
The Athlete Burnout Questionnaire (ABQ; Raedeke & Smith, 2001) is a 15 item
measure of athlete burnout that has three subscales with five items each: Reduced Sense
of Accomplishment, Devaluation, and Emotional/Physical Exhaustion. The ABQ uses a
five-point scale with response options ranging from 1 = almost never to 5 = most of the
time. Example item from this measure are as follows: “I feel “wiped out” from [sport]”,
“I’m not into [sport] like I used to be”, and “I feel physically worn out from [sport]”. A
total score as well as subscale scores were calculated by summing the item responses.
Higher scores on the ABQ indicated a greater magnitude of burnout. Construct validity

43
has been established for the ABQ, it has good internal reliability, and the subscales have
high test-retest reliability (Raedeke & Smith, 2001).
3.3.5 BriefCOPE
The BriefCOPE (Carver, 1997) is an abbreviated version of the COPE Inventory
(Carver, Scheier, & Weintraub. 1989). It has 28 items organized into 14 subscales with
two items each – Self-Distractive, Active Coping, Denial, Substance Use, Use of
Emotional Support, Use of Instrumental Support, Behavioral Disengagement, Venting,
Positive Reframing, Planning, Humor, Acceptance, Religion, and Self-Blame. The
measure uses a four-point Likert scale with response options ranging from 1 = I haven’t
been doing this at all to 4 = I’ve been doing this a lot. Sample items from this measure
are as follows: Active Coping: “I’ve been concentrating my efforts on doing something
about the situation I’m in”, Use of Instrumental Support: “I’ve been getting help and
advice from other people”, and Religion: “I’ve been trying to find comfort in my religion
or spiritual beliefs”. There is no overall score for this measure, each subscale is scored
separately and indicated the individual’s use of those strategies. The subscales have
reliability values ranging from 0.50 to 0.90 (Carver, 1997). The original COPE Inventory
from which this measure is adapted has discriminant and convergent validity (Carver et
al., 1989).
3.3.6 Beck Depression Inventory
The Beck Depression Inventory (BDI; Beck, Ward, Mendelson, Mock, &
Erbaugh, 1961) contained 21 items and assessed the existence and severity of depressive
symptoms over the previous two weeks. Items are scored on a 0-3 scale, with 0
corresponding to not experiencing the symptom and 1, 2, and 3 indicating increasing

44
levels of severity. Example items from this measure are “sadness”, “pessimism”, and
“past failure”. A total score was calculated from the sum of the items, and a score of 0-
13 indicated minimal depression, 14-19 mild depression, 20-28 moderate depression, and
29-63 severe depression. The BDI is a valid and reliable (Cronbach’s alpha = 0.93)
measure of depression in college students (Beck & Steer, 1984).
3.3.7 Cohen-Hoberman Inventory of Physical Symptoms
The Cohen-Hoberman Inventory of Physical Symptoms (CHIPS; Cohen &
Hoberman, 1983) assesses the degree to which an individual is bothered or distressed by
33 physical symptoms during the previous two weeks. The symptoms are rated on a five-
point scale ranging from 0 = not bothered by it to 4 = extremely bothered by it. Example
symptoms listed in this measure are “back pain”, “diarrhea”, and “headache”. CHIPS
was scored by adding up the value assigned to each item, with lower scores indicating
that an individual was less bothered by physical symptoms. CHIPS is a reliable measure
of physical symptoms (Cohen & Hoberman, 1983).
3.3.8 Perceived Stress Scale
The Perceived Stress Scale (PSS; Coehn, Kamarch, & Mermelstein, 1983) has 10
items that measure the degree to which situations in an individual’s life are perceived as
stressful in the last month. A modified response time frame of two weeks was used for this
study. The PSS is scored on a five-point scale, with response options ranging from 1 =
never to 5 = very often. Example items from this measure are as follows: “In the last
month, how often have you felt that things were going your way?” and “In the last month,
how often have you felt that you were on top of things?”. Higher scores indicated higher
levels of perceived stress. The PSS is a valid and reliable measure of perceived stress

45
(Cohen et al., 1983).
3.3.9 Illness and Injury Reports
All illnesses and injuries reported to the team athletic trainer were recorded using
the standard injury reporting protocol used by the college’s athletic trainers. For the
purpose of this study, an injury was defined based on the NCAA Injury Surveillance
System guidelines: a condition that occurred during participation in an organized
intercollegiate practice or competition, required attention from a team certified athletic
trainer or physician; and resulted in restriction of the athlete’s participation in sport for at
least one day (Hootman et al., 2007). An instance of illness was defined as a condition of
the body or mind that required medical attention and was diagnosed by a physician or
other qualified health professional. All injuries and instances of illness were documented
on the Injury Assessment Summary forms used by the college (see Appendix B10).
Although the study sample was not large enough to determine incidence rates, the
number and type of illnesses and injuries were recorded because those qualitative data
could have provided interesting information.
3.4 Protocol
3.4.1 Study Orientation and Informed Consent
A brief letter with information about this study was provided to the athletes of the
Soccer and Field Hockey teams at a Division III private institution prior to the start of
their pre-season training. At the first team practice, the researcher discussed the study,
answered any questions, and obtained written informed consent from the athletes
volunteering to participate in the study. Assent and parental consent was also obtained

46
from athletes who were underage and volunteered to participate in the study.
3.4.2 Baseline Testing
Data collection for Hypothesis #1 took place during 2011 season training camp in
August for both the Soccer (N=28) and Field Hockey (N=19) teams. As such, data were
collected from some athletes who did not make the final rosters and was used in the
analyses for Hypothesis #1. Baseline testing was scheduled for the second day of
practice, and data were collected in between the morning and afternoon training sessions
for both teams, two hours after the morning session and two hours prior to the afternoon
session. Prior to starting the Mental Toughness Training Program, all participants
completed the Demographic Questionnaire, MeBTough, POMS, ABQ, Brief COPE, BDI,
CHIPS and PSS. Questionnaires were completed in a paper/pencil format. Data
collection took place in a classroom on the college’s campus. Lunch was provided for
the athletes after they have completed the testing.
After completing the baseline MeBTough, the researcher scored the MeBTough
and developed each athlete’s individualized training program. The training program
began on the first day of the second week of practice. Baseline data was also used to
establish correlations among the measures for Hypothesis #1.
3.4.3 Implementation of the Mental Toughness Training Program
The training program used for this study was developed by Measuremental LLC
and was administered via Measuremental’s online training website. As previously
discussed, the Mental Toughness Training Program (©Measuremental LLC, 2010) is a
personalized training program based on the athlete’s overall mental toughness score,
primary strength, and primary weakness. During the six-week program, the athlete
47
received daily emails containing feedback and mental toughness training exercises to
complete. An online performance journal was used for some of the training exercises and
for daily reflection about the training experience.
3.4.4 Testing during the Intervention Program
Over the course of the six-week intervention program, both the Soccer (N=21)
and Field Hockey (N=16) teams completed the POMS, Brief COPE BDI, CHIPS, and
PSS at the end of the second week (± one day) of mental toughness training and the end
of the fourth week (± one day) of the training. Data were collected from only those
athletes who made the final rosters. Data were collected prior to practice and at least one
day before or after a game day in paper/pencil formats.
3.4.5 Post-Testing
After the completion of the six-week training program, all participants (N=37)
completed the MeBTough, POMS, ABQ, Brief COPE, BDI, CHIPS and PSS to assess
for significant changes of the scores from these measures. All testing was completed two
days ± four days following the completion of the training program. Testing took place in
a reserved classroom at the college and data was collected using paper/pencil format.
3.4.6 Follow-Up Testing
All participants completed the MeBTough two weeks after the final game of the
competitive season, which corresponded to three weeks after the conclusion of the
Mental Toughness Training Program, ± one day. Data was collected in a reserved
classroom at the college. Dinner was provided to all participants after completing the
questionnaires.

48
3.5 Data Analysis
SPSS 18.0 was used for data analyses. Data was examined to determine if all of
the variables were distributed normally and descriptive statistics for all of the outcome
measures were expressed as mean ± standard deviation and range. For all comparisons
an intent-to-treat approach was used. Significance level for all analyses was set at p≤.05.
3.5.1 Data Analysis Hypothesis 1
The baseline data from all participants was combined for this analysis.
Spearman-rho correlation coefficients (ρ) were used to assess the cross-sectional
relationships among mental toughness, mood disturbances, burnout, coping ability,
depression, physical symptoms, and perceived stress. The classification system that was
used for the correlations generated among the scores from the measures in this study was
based on Cohen’s (1988) guidelines for interpreting correlations in social science
research. In this classification system, a ρ value of 0.1 to 0.3 was considered a small or
weak correlation, a ρ value of 0.31 to 0.5 a moderate correlation, and a ρ value of 0.51 or
greater was interpreted as a large or strong correlation.
3.5.2 Data Analysis Hypothesis 2
The effectiveness of the training program was analyzed using the Baseline and
Post Testing MeBTough data. A one-tailed dependent t-test was used to determine if the
MeBTough scores were significantly higher after the training program. A repeated
measures ANOVA was used to determine if the post-testing and follow-up testing scores
for the MeBTough were significantly different from each other.
3.5.3 Data Analysis Hypothesis 3
A series of repeated measures ANOVAs with main effects for group (treatment,

49
control) and time (Baseline, After Week 2, After Week 4, Post-Test) were used to
analyze the outcome measures. Data was collected from the ABQ at only two time
points, and a repeated measures ANOVA with main effect for group (treatment, control)
and time (Baseline, Post-Test) was conducted.
3.6 Human Hazards Precautions
The potential hazards associated with this study were minimal. Participants might
have experienced fatigue while completing the battery of questionnaires or experienced
mild psychological discomfort when answering questions about their psychological states
(for example: depression, stress, and mental toughness level). Psychological discomfort
should have dissipated rapidly after completion of the questionnaires. Additional
discomfort could have occurred with some of the mental toughness training exercises that
required the participant to think about a previous unsuccessful athletic performance in
order to focus on actions that could have been taken to alter the situation. The goal of the
exercises was to teach the participant how to evaluate previous negative performance
situations differently so that they would be better able to handle similar situations in the
future. No physical hazards beyond those normally experienced by participants on a
daily basis were expected.
3.7 Study Timelines
The approval, preparation, data collection, data analysis, and manuscript
preparation timelines for the study are shown in Table 1. The intervention in this study,
the Mental Toughness Training Program, was be administered over six weeks. The

50
baseline, intermittent, and post-program data collection timelines are shown in Figure 11.
Table 1 Study Timelines
Month Task May June July Aug Sept Oct Nov Dec Jan Feb March
IRB Approval
Study Preparation
Data Collection
Data Analysis
Manuscript Preparation
Figure 11: Intervention timeline for the study
The timeline for data collection in this study is presented in Table 2.

51
Table 2 Data Collection Timeline
STUDY WEEK
Measure
1 (Baseline Testing)
2 (Week 1
of program)
3
4
5 6
7 (Week 6 of program)
8 Post-
Testing
10 Follow-up
Testing
MeBTough X X X POMS X X X X ABQ X X Brief COPE X X X X BDI X X X X CHIPS X X X X PSS X X X X Note: MeBTough=Mental, Emotional, and Bodily Toughness Inventory, POMS=Profile of Mood, ABQ=Athlete Burnout Questionnaire, BDI= Beck Depression Inventory, CHIPS=Cohen-Hoberman Inventory of Physical Symptoms, PSS=Perceived Stress Scale

52
CHAPTER 4
RESULTS
In this study, both cross-sectional (Hypothesis #1) and longitudinal (Hypotheses
#2 and #3) hypotheses were tested. A total of 47 athletes participated in the baseline,
cross-sectional data collection, while 37 athletes had longitudinal data available. Data
were pooled for the analyses of Hypothesis #1, and were split by team for Hypotheses #2
and #3 analyses.
4.1 Hypothesis #1 Results: Cross-Sectional Relationships
Hypothesis #1: Consistent with the literature, baseline mental toughness will be
negatively correlated with mood disturbances, athlete burnout, depression, physical
symptoms, and perceived stress, and positively correlated with coping ability.
4.1.1 Participant Characteristics
Demographic information from the 47 participants that provided data for
Hypothesis #1 are provided in Table 3. Participants were between the ages of 17 and 23,
with a mean age of 19.3±1.4 years. Two participants were under the age of 18. In this
sample, 95.7% of the participants had played their sport for more than five years. The
majority of the sample was in their first or second year of NCAA eligibility. Twelve
participants stated that they suffered from chronic health conditions, which included:
asthma (N=4), chronic back conditions (N=4), lupus (N=3), heart conditions (N=1), and
Crohn’s disease (N=1). Seven participants suffered from a psychological condition,
which included: depression (N=4) and anxiety (N=3).

53
Table 3 Participant Demographic Information for Hypothesis #1 (N=47)
Demographic Variable N % Sex Female 47 100 Age 17 2 4.3 18 15 31.9 19 13 27.7 20 6 12.8 21 9 19.1 22 1 2.1 23 1 2.1 Sport Field Hockey 19 40.4 Soccer 28 59.6 Years Playing Sport 1-5 2 4.3 6-10 24 51.1 11-15 19 40.4 16-20 2 4.3 Year in School Freshman 13 27.7 Sophomore 18 38.3 Junior 6 12.8 Senior 10 21.3 NCAA Eligibility 1 15 31.9 2 17 36.2 3 7 14.9 4 8 17.0 Chronic Health Conditions Yes 12 25.5 No 35 74.5 Psychological Conditions Yes 7 14.9 No 40 85.1

54
4.1.2 Descriptive Statistics
Descriptive statistics for the scores from all the measures (MeBTough, POMS,
ABQ, BDI, CHIPS, PSS, and BriefCOPE) at baseline are provided in Table 4A-C. The
majority of the scores from the measures were normally distributed, with only a few
skewness and kurtosis values deviating greatly from the acceptable range of ±2 and ±7
respectively (Curran, West, & Finch, 1996). The BriefCOPE subscale Substance Use
(skewness=2.81, kurtosis=8.64) was the only measure that had both skewness and
kurtosis outside the acceptable ranges.
Table 4A Descriptive Statistics for the Total Scores of MeBTough, ABQ, BDI, CHIPS, and PSS (N=47) at Baseline
Measure N M SD Range Skewness Kurtosis MBTTOTAL 47 475.5 81.6 293-670 .37 .00 ABQTOTAL 47 30.0 9.0 17-55 .88 .40 BDI 47 6.5 4.6 0-17 .58 -.23 CHIPS 47 16.6 11.1 1-40 .44 -1.06 PSS 46 14.5 5.6 3-24 .10 -.95
Note: MBTTOTAL=Mental, Emotional, and Bodily Toughness Inventory total score, ABQTOTAL=Athlete Burnout Questionnaire total score, BDI= Beck Depression Inventory, CHIPS=Cohen-Hoberman Inventory of Physical Symptoms, PSS=Perceived Stress Scale
4.1.3 Correlation Analyses
Spearman Rho correlations were calculated among the total scores of the
MeBTough, POMS, ABQ, BDI, CHIPS, and PSS and presented in Table 5. A correlation
ranging from of 0.1 to 0.3 was considered a small or weak correlation, between 0.31 to
0.5 a moderate correlation, and 0.51 or greater was interpreted as a large or strong
correlation (Cohen, 1988).

55
Table 4B Descriptive Statistics for the Total Score and Subscales of POMS (N=47) at Baseline
Table 4C Descriptive Statistics for the Subscales of BriefCOPE (N=47) at Baseline Measure N M SD Range Skewness Kurtosis Self-Distraction 47 5.0 1.7 2-8 -.25 -.54 Active Coping 46 5.6 1.5 2-8 -.15 -.49 Denial 47 2.2 .4 2-3 1.45 .11 Substance Use 47 2.3 .8 2-6 2.81 8.64 Use of Emotional Support 47 5.7 1.5 3-8 .10 -1.13 Use of Instrumental Support 47 5.4 1.7 2-8 -.07 -.77 Behavioral Disengagement 47 2.5 .9 2-6 2.17 4.90 Venting 47 3.9 1.4 2-8 .62 .18 Positive Reframing 47 5.5 1.9 2-8 -.13 -.109 Planning 47 5.7 1.7 2-8 -.27 -.81 Humor 47 3.7 1.8 2-8 1.08 .50 Acceptance 47 6.1 1.7 2-8 -.91 .04 Religion 47 2.8 1.4 2-8 2.00 3.72 Self-blame 47 4.2 1.6 2-8 .70 .39
Significant relationships were observed between mental toughness (MeBTough)
and the psychological variables measured at baseline. Specifically, significant moderate
to strong negative correlations (ρ=-0.46 to -0.53, p ≤.05) were found between mental
toughness and total mood disturbance (POMS), athlete burnout (ABQ), depression (BDI),
Measure N M SD Range Skewness Kurtosis Total Mood Disturbance 46 29.8 10.8 8-64 .77 1.14 Tension 47 9.2 3.5 5-21 1.02 1.21 Depression 47 7.1 2.6 5-15 1.42 1.54 Anger 47 5.8 1.2 5-11 2.16 6.63 Vigor 47 12.5 3.8 7-25 .97 1.24 Fatigue 47 12.2 3.7 6-21 .35 -.70 Confusion 46 7.9 1.7 5-12 .42 -.44

56
and perceived stress (PSS). A significant relationship was not found between mental
toughness and physical symptoms (CHIPS). Only one subscale of the BriefCOPE, Self-
Blame (ρ=-0.56, p≤.01), was significantly associated with mental toughness. All other
subscales of the BriefCOPE were not significantly correlated with MeBTough scores,
with Spearman Rho correlations ranging from ρ=-0.29 to 0.17 (p=.06 to .93). Because
scores from only one subscale of the BriefCOPE were significantly correlated with scores
from the MeBTough, the BriefCOPE was not used in any further analyses in this study.
Significant correlations were also found among the scores of the psychological
and physical measures. Physical symptom scores, while not significantly associated with
mental toughness, had significant positive relationships with all the other variables
(ρ=0.40 to 0.61, p≤.0.1) used in this study. Significant positive correlations were also
seen among all the psychological variables.
Table 5 Spearman Rho Correlations Among the Total Scores of MeBTough, POMS, ABQ, BDI, CHIPS, and PSS 1 2 3 4 5 6 1. MBTTOTAL -------- 2. POMSTMD -.51** ------- 3. BDI -.49** .56** ------- 4. ABQTOTAL -.46** .59** .50** ------- 5. CHIPS -.16 .40** .61** .43** ------- 6. PSS -.53** .54** .59** .44** .45** ------- Note: *=p≤.05 **=p≤.01 Note: MBTTOTAL=Mental, Emotional, and Bodily Toughness Inventory total score, POMSTMD=Profile of Mood States Total Mood Disturbance, BDI= Beck Depression Inventory, ABQTOTAL=Athlete Burnout Questionnaire total score, CHIPS=Cohen-Hoberman Inventory of Physical Symptoms, PSS=Perceived Stress Scale

57
4.2 Hypothesis #2 Results: Changes in Mental Toughness
Hypothesis #2: The Mental Toughness Training Program will result in increased levels
of mental toughness as compared to the control group where no changes in mental
toughness levels are expected.
4.2.1 Participant Characteristics
Participant demographic information for Hypothesis #2 is provided in Table 6.
The mean age of the sample for this hypothesis was 19.4±1.4 years. In this sample,
94.6% of the participants had played their sport for over five years. Nine participants
indicated that they suffered from chronic health conditions, including lupus (N=3), back
conditions (N=3), asthma (N=2), and heart conditions (N=1). Six participants suffered
from a psychological condition, including depression (N=4) and anxiety (N=2).
4.2.2 Descriptive Statistics
Descriptive statistics for the scores of MeBTough at baseline, post-intervention,
and at follow-up are provided in Table 7. All of measures were normally distributed,
with skewness and kurtosis values within an acceptable range of ±2 and ±7 respectively
(Curran et al., 1996). MeBTough scores increased in the training group by approximately
17 points from baseline to post-intervention. At baseline, the training group scores
differed from the overall mean by 19.6 points, and post-intervention, differed from the
overall mean by 39.9 points. The MeBTough scores demonstrated good reliability at
baseline (α= 0.73), post-intervention, (α =0.84), and at follow-up (α= 0.84).

58
Table 6 Participant Demographic Information for Hypothesis #2 (N=37)
Demographic Variable N %
Sex Female 37 100 Age 17 2 5.4 18 10 27.0 19 10 27.0 20 5 13.5 21 8 21.7 22 1 2.7 23 1 2.7 Sport Field Hockey 16 43.2 Soccer 21 56.8 Years Playing Sport 1-5 2 5.4 6-10 20 54.1 11-15 13 35.1 16-20 2 5.4 Year in School Freshman 11 29.7 Sophomore 12 32.5 Junior 5 13.5 Senior 9 24.3 NCAA Eligibility 1 12 32.4 2 12 32.4 3 6 16.3 4 7 18.9 Chronic Health Conditions Yes 9 24.3 No 28 75.7 Psychological Conditions Yes 6 16.2 No 31 83.8

59
Table 7 Descriptive Statistics for the Total Scores of MeBTough at Baseline, Post-Intervention, and at Follow-Up (N=37) Measure M SD Range Skewness Kurtosis
MBTTOTAL Overall (N=37) 490.3 79.9 339-670 .40 -.28
MBTTOTAL Training Group (N=16) 509.9 84.3 339-670 .15 .56
Pre-Training Intervention
MBTTOTAL Control Group (N=21) 475.4 75.0 381-621 .59 -.68
MBTTOTAL Overall (N=37) 487.3 90.1 348-670 .42 -.65
MBTTOTAL Training Group (N=16) 527.2 100.9 348-670 .14 -.98
Post-Training Intervention
MBTTOTAL Control Group (N=21 456.9 68.8 348-583 .41 -.55
MBTTOTAL Overall (N=37) 519.8 114.0 320-809 .75 .25
MBTTOTAL Training Group (N=16) 571.3 130.6 352-809 .12 -.45
After Follow-Up Period
MBTTOTAL Control Group (N=21) 480.6 82.7 320-710 .96 2.10
Note: MBTTOTAL=Mental, Emotional, and Bodily Toughness Inventory total score
4.2.3 Repeated Measures ANOVA
A 2 (Sport) x 3 (Time) repeated measures ANOVA was conducted to compare the
MeBTough scores at baseline, post-intervention, and at follow-up and the results are
provided in Table 9. There were main effects for Sport F(1,35) = 5.78, p = .02 and Time
F (2,70) = 6.03, p =. 004. There was a significant Sport X Time interaction F(2,70) =
3.25, p = .045. There were no differences between sports at baseline. Significant
differences were observed at post-test and follow-up. The MeBTough scores in the
intervention and control group are shown in Figure 12. The difference between post-
intervention scores and follow-up scores for the MeBTough were significant in the

60
intervention group, and scores from the measure in the intervention group continued to
improve after the conclusion of the training program.
Table 8 2 (Sport) X 3 (Time) Repeated Measures ANOVA Comparing Pre- and Post-Intervention MeBTough Scores (N=37)
Source SS df MS F p Observed Power
Sport 38571.62 1 38571.62 5.78 .02 .65 Time 27354.33 2 13677.16 6.03 .00 .87 Sport X Time 14751.73 2 7375.87 3.25 .045 .60 Error 158747.04 70 2267.82
Figure 12: Mean mental toughness scores at baseline, post-intervention, and follow-up (* indicates p≤.05)
*
*
400
420
440
460
480
500
520
540
560
580
600
620
Baseline Post-Intervention Follow-Up
MeB
Toug
h S
core
Intervention Group
Control Group

61
Table 9 provides the number of exercises completed by each participant in the
Mental Toughness Training Program with their pre-training program and post-training
program total scores, as well as the difference between their total scores. There was a
3.9% increase in mean mental toughness scores when comparing pre- and post-training
scores in the intervention group. There was a strong positive correlation between the
number of sessions completed in the training program and the change in MeBTough
score from pre-intervention to post-intervention (ρ=0.60, p≤.05).
Table 9 Sessions Completed in the Training Intervention, Pre-Intervention Scores, Post-Intervention Scores, and Difference Between Pre- and Post-Intervention Scores (N=16)
Participant Number of intervention exercises done
MBT score pre-intervention
MBT score post-intervention
Change in MBT score from pre- to post-intervention
F1 36 576 576 0 F2 0 520 445 -75 F4 32 520 557 37 F5 6 445 482 37 F6 10 526 570 44 F7 5 670 658 -12 F8 3 498 482 -16 F10 11 570 639 69 F12 10 339 348 9 F13 0 430 425 -5 F15 34 658 658 0 F16 0 470 461 -9 F17 0 503 381 -122 F18 15 503 670 167 F19 14 515 520 5 U1 8 415 563 148
MEAN 11.5 509.87 527.19 17.31 Note: MBT=Mental, Emotional, and Bodily Toughness Inventory total score, F=Field Hockey, U=underage Field Hockey participant

62
4.3 Hypothesis #3 Results: Changes in Psychological and Physical Variables
Hypothesis #3: Improved mental toughness resulting from the training will attenuate
levels of mood disturbances, athlete burnout, depression, physical symptoms, and
perceived stress in the training group as compared to the control group.
4.3.1 Participant Characteristics
The same group of participants provided data for both Hypothesis #2 and #3. For
participant demographic information for Hypothesis #3 refer to Table 6. Due to
incomplete data (N=4) resulting from skipped items in questionnaires, data from all 37
participants were not used in the final analyses for Hypothesis #3.
4.3.2 Descriptive Statistics
Descriptive statistics for mood disturbance, perceived stress, physical symptoms,
depression, and athlete burnout at baseline, at the end of the second week and at the end
of the fourth week of the intervention, and post-intervention in Table 10. As the athlete
burnout was only measured at two time points, descriptive statistics for baseline and post-
intervention are presented. Three measures were not normally distributed, with skewness
and kurtosis values deviating greatly from the acceptable range of ±2 and ±7 respectively
(Curran at al., 1996). Skewness and kurtosis values for POMS after week four in the
Intervention group (skewness=2.60, kurtosis=7.69), BDI after week four in the
Intervention group (skewness=2.52, kurtosis=7.12), and CHIPS after week four in the
Intervention group (skewness=2.76, kurtosis=8.97) fell outside the acceptable range
suggesting they may not be normally distributed. Cronbach alpha reliability coefficients
(see Table 11) were calculated for each measure across time points. All measures
demonstrated adequate reliability across all measurement time points.

63
Table 10 Descriptive Statistics for the Total Scores of POMS, ABQ, BDI, CHIPS, and PSS at Baseline, After Week 2, After Week 4, and Post-Intervention (N=35) Measure Time Point Group N M SD Range Skewness Kurtosis
Total 34 28.8 8.6 8-47 -.10 -.24 Intervention 14 26.1 9.9 8-44 .10 -.61
Baseline
Control 20 30.7 7.3 21-47 .41 -.49 Total 34 28.1 14.7 8-72 1.20 1.92 Intervention 14 25.3 19.9 8-72 1.78 2.37
After week 2
Control 20 30.1 9.6 10-52 .11 .77 Total 34 27.4 16.2 6-83 1.57 3.09 Intervention 14 23.1 19.3 6-83 2.60 7.69
After week 4
Control 20 30.5 13.2 15-58 .77 -.31 Total 34 25.9 13.4 3-56 .64 -.16 Intervention 14 18.2 9.2 3-37 .76 .32
POMS
Post-Intervention
Control 20 31.3 13.3 9-56 .34 -.47 Total 35 28.9 8.4 17-55 .91 1.03 ABQ
Intervention 15 26.3 6.5 20-43 1.50 1.92
Baseline
Control 20 30.8 9.4 17-55 .54 .51 Total 35 29.6 11.5 17-59 1.02 .46 Intervention 15 22.9 6.5 17-39 1.59 1.71
Post-Intervention
Control 20 34.6 12.1 18-59 .57 -.20 Total 35 6.2 4.3 0-17 .69 .27 Intervention 15 4.9 4.2 0-1 .69 .13
Baseline
Control 20 7.2 4.2 1-1 .88 .57
BDI
Total 35 5.9 5.7 0-19 .84 .40 Intervention 15 3.6 4.5 0-14 1.35 .74
After week 2
Control 20 7.6 6.0 1-19 .56 -.10 Total 35 6.0 7.4 0-29 1.60 2.00 Intervention 15 3.4 5.6 0-21 2.52 7.12
After week 4
Control 20 8.0 8.1 0-29 1.30 1.04 Total 35 5.3 6.9 0-26 1.64 1.99 Intervention 15 1.5 2.0 0-7 1.68 2.84
Post-Intervention
Control 20 8.2 7.8 0-26 .97 -.09 CHIPS Total 35 17.1 11.1 1-40 .34 -1.08
Intervention 15 16.3 11.7 3-33 .40 -1.66
Baseline
Control 20 17.6 10.9 1-40 .34 -.52 Total 35 15.1 11.6 1-43 1.06 .50 Intervention 15 12.9 13.0 1-42 1.57 1.63
After week 2
Control 20 16.7 10.5 1-43 .84 .64

64
Measure Time Point Group N M SD Range Skewness Kurtosis Total 35 13.4 12.6 0-49 1.52 1.84 Intervention 15 8.3 10.9 0-44 2.76 8.97
After week 4
Control 20 17.3 12.7 1-49 1.29 1.21 Total 35 15.2 12.2 0-51 1.08 .83 Intervention 15 10.3 10.0 0-39 1.92 4.21
CHIPS
Post-Intervention
Control 20 18.9 12.7 0-51 .78 .62 PSS Total 34 14.6 5.7 3-24 .07 -.98
Intervention 14 3.0 6.4 3-22 .22 -.136 Baseline
Control 20 15.8 5.1 9-24 .37 -1.15 Total 34 13.7 5.8 5-25 .22 -.97 Intervention 14 13.1 4.6 6-20 -.05 -1.40
After week 2
Control 20 14.2 6.5 5-25 .17 -1.22 Total 34 15.0 6.2 3-28 .00 -.29 Intervention 14 14.4 6.9 3-28 .28 .24
After week 4
Control 20 15.5 5.8 6-27 -.21 -.43 Total 34 15.6 7.0 0-29 .02 -.47 Intervention 14 12.1 6.1 0-22 -.13 -.14
Post-Intervention
Control 20 18.0 6.7 6-29 -.14 -68
Note: POMS=Profile of Mood States Total Mood Disturbance score, ABQ= Athlete Burnout Questionnaire total score, BDI=Beck Depression Inventory, CHIPS=Cohen-Hoberman Inventory of Physical Symptoms, PSS=Perceived Stress Scale. Table 11 Reliability Coefficients for POMS, BDI, CHIPS, ABQ, PSS, and BriefCOPE
Baseline After Week 2 After Week 4 Post-Intervention Follow-up Measure N α N α N α N α N α POMS 46 .79 40 .85 37 .92 39 .87 38 .90 BDI 47 .76 41 .94 38 .94 38 .92 38 .93 CHIPS 47 .82 40 .86 38 .88 39 .85 38 .86 ABQ 47 .89 --- ---- -- --- 39 .93 38 .94 PSS 46 .82 39 .85 38 .84 39 .86 38 .87 Brief COPE 46 .86 39 .85 38 .93 39 .84 38 .88
Note: POMS=Profile of Mood States, BDI= Beck Depression Inventory, CHIPS=Cohen-Hoberman Inventory of Physical Symptoms, ABQ=Athlete Burnout Questionnaire, PSS=Perceived Stress Scale, BriefCOPE= BriefCOPE Questionnaire

65
4.3.3 Repeated Measures ANOVAS
For the analysis of Hypothesis #3, repeated measures ANOVAs were conducted.
Data were collected for some measures only pre- and post-training intervention (ABQ),
and a 2 (Sport) X 2 (Time) repeated measures ANOVA was conducted to analyze scores
from ABQ. For other measures, data were collected at four time points: pre-
intervention, after two weeks, after four weeks, and post-intervention (POMS, BDI, PSS,
and CHIPS). Multiple 2 (Sport) X 4 (Time) repeated measures ANOVAs were
conducted to analyze scores from the POMS, BDI, CHIPS, and PSS.
4.3.3.1 2 (Sport) X 2 (Time) Repeated Measures ANOVA: ABQ
The results of the 2 (Sport) X 2 (Time) repeated measures analyses for the scores from
the ABQ at baseline and post-intervention are provided in Table 12. There was no main
effect of Time. A main effect of Sport was observed F(1,33) = 8.32, p = .01 and there
was a significant Sport X Time interaction F(1,33) = 5.87, p =.02. ABQ scores at
baseline and post-intervention are shown in Figures 13.
Table 12 2 (Sport) X 2 (Time) Repeated Measures ANOVA Comparing Baseline and Post-Intervention Total Scores for ABQ (N=35) Source SS df MS F p Observed
Power Sport 554.30 1 554.30 8.32 .01 .80 Time .53 1 .53 .01 .91 .05 Sport X Time 219.10 1 219.10 5.87 .02 .65 Error 1232.68 33 37.35
Note: ABQ= Athlete Burnout Questionnaire

66
Figure 13: Athlete Burnout Questionnaire (ABQ) scores at baseline and post-intervention (* indicates p≤.05)
4.3.3.2 2 (Sport) X 4 (Time) Repeated Measures ANOVA: POMS
A main effect of Sport was observed F(1,32) = 4.92, p = .03, but there was not a
Time main effect or a Sport X Time interaction for the POMS scores (see Table 13).
POMS scores across the four measurement time points are shown in Figure 14.
Table 13 2 (Sport) X 4 (Time) Repeated Measures ANOVA Comparing POMS Total Mood Disturbance Scores at Baseline, After 2 and 4 Weeks into the Intervention, and Post-Intervention (N=33)
Source SS df MS F p Observed
Power Sport 454.45 1 454.45 4.92 .03 .58 Time 246.07 3 82.02 .785 .51 .21 Sport X Time 390.25 3 130.08 1.24 .30 .32 Error 10034.80 96 104.53
Note: POMS=Profile Of Mood States
*
0
5
10
15
20
25
30
35
40
Baseline Post-Intervention
AB
Q S
core
Intervention Group
Control Group

67
Figure 14: Total Mood Disturbance scores from the Profile of Mood States (POMS) at baseline, after week 2 and 4, and post-intervention
4.3.3.3 2 (Sport) X 4 (Time) Repeated Measures ANOVA: BDI
There was not a Time main effect for the BDI. There was a significant Sport main effect
F(1,32) = 6.55, p = .02 and a significant Sport X Time interaction F(3,99) = 2.67, p = .05
(see Table 14). Follow-up comparisons demonstrated that there were significant
differences in mean BDI scores between the Field Hockey and Soccer teams at baseline,
after Week 2 and Week 4, and at Post-Intervention as shown in Figure 15.
4.3.3.4 2 (Sport) X 4 (Time) Repeated Measures ANOVA: CHIPS
There was not a Time or Sport main effect for the CHIPS. There was a significant
Sport X Time interaction F(3,99) = 2.90, p = .04 (see Table 15). Follow-up comparisons
demonstrated that there were significant differences in mean CHIPS scores between the
Field Hockey and Soccer teams after Week 4, and at Post-Intervention (see Figure 16).
0 5
10 15 20 25 30 35 40
Moo
d D
istu
rban
ce S
core
Intervention Group
Control Group

68
Table 14 2 (Sport) X 4 (Time) Repeated Measures ANOVA Comparing BDI Scores at Baseline, After 2 and 4 Weeks into the Intervention, and Post-Intervention (N=33) Source SS df MS F p Observed
Power Sport 165.94 1 165.94 6.55 .02 .70 Time 27.62 3 9.21 .84 .47 .23 Sport X Time 87.39 3 29.13 2.67 .05 .64 Error 1080.67 99 10.92
Note: BDI=Beck Depression Inventory
Figure 15: Beck Depression Inventory (BDI) scores at baseline, after week 2, after week 4, and post-intervention (* indicates p≤.05)
Table 15 2 (Group) X 4 (Time) Repeated Measures ANOVA Comparing CHIPS Scores at Baseline, After 2 and 4 Weeks into the Intervention, and Post-Intervention (N=33) Source SS df MS F p Observed
Power Sport 270.40 1 270.40 2.61 .12 .35 Time 300.39 3 100.13 2.41 .07 .59 Sport X Time 361.07 3 120.36 2.90 .04 .68 Error 4110.90 99 41.52
Note: CHIPS=Cohen-Hoberman Inventory of Physical Symptoms
* * * *
0
2
4
6
8
10
12
BD
I Sco
re
Intervention Group
Control Group

69
Figure 16: Cohen-Hoberman Inventory of Physical Symptoms (CHIPS) scores at baseline, after week 2 and 4, and post-intervention (* indicates p≤.05)
4.3.3.5 2 (Sport) X 4 (Time) Repeated Measures ANOVA: PSS
There was not a Time or Sport main effect for the PSS. There was a significant
Sport x Time interaction F(3,96) = 3.71, p = .01 (see Table 16). Follow-up comparisons
demonstrated that there were significant differences in mean PSS scores between the
Field Hockey and Soccer teams at Post-Intervention (see Figure 17).
Table 16 2 (Group) X 4 (Time) Repeated Measures ANOVA Comparing PSS Scores at Baseline, After 2 and 4 Weeks into the Intervention, and Post-Intervention (N=33)
Source SS df MS F p Observed
Power Sport 60.35 1 60.35 2.16 .15 .06 Time 39.15 3 13.05 1.11 .35 .29 Sport X Time 130.79 3 43.60 3.71 .01 .79 Error 1129.50 96 11.77
Note: PSS=Perceived Stress Scale
* *
0
5
10
15
20
25
CH
IPS
Sco
re
Intervention Group
Control Group
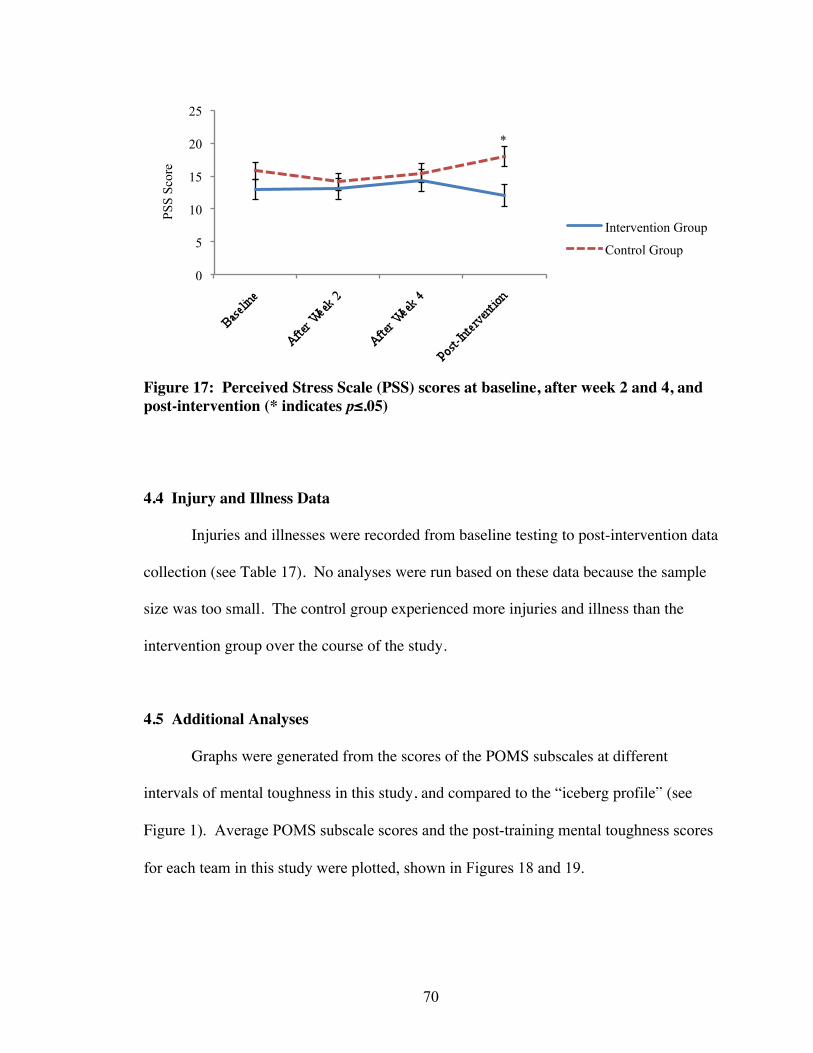
70
Figure 17: Perceived Stress Scale (PSS) scores at baseline, after week 2 and 4, and post-intervention (* indicates p≤.05)
4.4 Injury and Illness Data
Injuries and illnesses were recorded from baseline testing to post-intervention data
collection (see Table 17). No analyses were run based on these data because the sample
size was too small. The control group experienced more injuries and illness than the
intervention group over the course of the study.
4.5 Additional Analyses
Graphs were generated from the scores of the POMS subscales at different
intervals of mental toughness in this study, and compared to the “iceberg profile” (see
Figure 1). Average POMS subscale scores and the post-training mental toughness scores
for each team in this study were plotted, shown in Figures 18 and 19.
*
0
5
10
15
20
25
PSS
Scor
e
Intervention Group
Control Group

71
Table 17 Occurrences of Injury and Illness and Number of Days Missed for each Occurrence in the Intervention and Control Group (N=37)
Injuries Illness Group Participant Number Days Missed Number Days Missed
F1 F2 F4 F5 F6 F7 F8 1 5
F10 1 3 F12 F13 F15 F16 F17 F18 U1 1 21
Intervention Group
TOTAL 3 29 0 0 S2 3 2,1,4 S4 1 1 S5 3 4, 10, 12 S6 1 1 S9 1 11
S10 2 1,8 S11 S12 S14 1 1 S16 S17 1 4 S18 2 2,5 S19 1 3 S20 S21 S22 1 2 S23 1 6 S25 3 2,10,1
Control Group
S26

72
Injuries Illness Group Participant Number Days Missed Number Days Missed
S27 1 2 S28
Control Group
U2 1 2 TOTAL 22 94 1 1
Figure 18: POMS profile plots for mental toughness scores in intervals in the intervention group post-intervention
Figure 19: POMS profile plots for mental toughness scores in intervals in the control group post-intervention
0 2 4 6 8
10 12 14 16 18 20
600-699 500-599 400-499 300-399
0 2 4 6 8
10 12 14 16 18 20
500-599 400-499 300-399

73
CHAPTER 5
DISCUSSION
Undergoing high levels of physical training is necessary for elite athlete
development. Athletes prepare for the demands of high-level competition by training to
be able to perform at their best. However, when continued long term, this can predispose
athletes to physical and psychological problems, illnesses, and injuries (Kuipers &
Keizer, 1988). Smith’s Cognitive-Affective Model of Athletic Burnout (1986) is a
framework for understanding the relationships among stressors. Based on this model, the
modification of an individual’s interpretation of stressful situations could change the
individual’s evaluation of his/her ability to handle the physical and psychological
stressors of training and competition. This, in turn, could modify the stress response, and
could result in decreased susceptibility to illness, injury, overtraining syndrome, and
burnout. The mental toughness training intervention used in this study targeted the
component of cognitive appraisal in this model, or how a person interprets stressful
situations, highlighted in Figure 20. Improved ability to handle stressors may reduce
overtraining, which may result in a lower incidence of mood disturbances, physical
symptoms, illnesses, and injuries in collegiate athletes.
The purpose of the current study was to a) evaluate the cross-sectional
relationships between mental toughness and mood disturbances, athlete burnout, coping
ability, depression, physical symptoms, and perceived stress in Division III athletes, b)
implement a six-week online Mental Toughness Training Program, and c) evaluate the
impact of the mental toughness training on changes in mood disturbances, athlete

74
burnout, coping ability, depression, physical symptoms, perceived stress, and mental
toughness before, during, and after the intervention program. In this chapter, the results
of this study will be interpreted and discussed, and compared with the literature. Each of
the three hypotheses will be discussed separately. Limitations, study implications, and
future directions will also be addressed.
Figure 20: Modifying cognitive appraisal through mental toughness training in Smith’s (1986) Cognitive-Affective Model of Athletic Burnout 5.1 Hypothesis #1 Discussion
Hypothesis #1: Consistent with the literature, baseline mental toughness will be
negatively correlated with mood disturbances, athlete burnout, depression, physical
symptoms, and perceived stress, and positively correlated with coping ability.
The results of the study partially supported Hypothesis #1. Higher levels of
mental toughness were significantly associated with lower levels of mood disturbance,
Mental Toughness

75
athlete burnout, depression, and perceived stress at baseline. Mental toughness was not,
however, significantly associated with physical symptoms.
5.1.1 Variables Correlated with Mental Toughness
In this study, mental toughness was associated with mood state and burnout at
baseline. The correlation between mental toughness and mood state in this study was ρ=-
.51 (p≤.01), and the correlation between mental toughness and athlete burnout was ρ=-.46
(p≤.01). The inverse relationship observed between mental toughness with mood state
and burnout is consistent with previous research conducted among 145 Division I
collegiate athletes (Welch, 2010) that used the same instruments to measure mental
toughness (MeBtough), mood disturbance (POMS), and levels of athlete burnout (ABQ).
Prior research showed that higher levels of mental toughness were moderately correlated
with lower levels of mood disturbance (r =-.46, p≤.01), and strongly correlated with
lower levels of athlete burnout (r =-.65, p≤.01; Welch, 2010). The difference in the
strength of the correlations between these results may be reflective of the much larger
sample size (approximately 100 more participants) of the study conducted by Welch
(2010). The associations among the scores from these measures at baseline in this study
are similar to the relationships found in the literature
Higher mental toughness scores were significantly correlated with lower
perceived stress scores and lower depression scores from data collected at baseline. The
relationship between mental toughness and depression in this study was of moderate
strength (ρ=-.49, p≤.01), and the relationship between mental toughness and perceived
stress was strong (ρ=-.53, p≤.01). Based on the framework of the Cognitive-Affective
Model of Athletic Burnout (Smith, 1986), perceived stress should be dependent on the

76
cognitive appraisal of a situation. Therefore, perceived stress was expected to be
negatively correlated with mental toughness levels, as mental toughness can modify
cognitive appraisal (see Figure 21). Prior to this study, the relationship between mental
toughness and perceived stress had not been demonstrated in the literature in athletes. It
had been previously stated in the literature that a mentally-tough individual has the
capacity to deal effectively with stressors, pressures, and challenges (Clough et al., 2002),
which would again suggest that mental toughness and perceived stress would be
associated. Depression is also part of the framework of the Cognitive-Affective Model of
Athletic Burnout (Smith, 1986), and can be a physiological consequence of perceiving
overload, or an imbalance of resources and demands (see Figure 21). Therefore, as
expected, it was negatively correlated with mental toughness, a relationship also not
previously addressed in the literature. Perceived stress and depression were associated
with mental toughness, and fit within the framework of the Cognitive-Affect model
(Smith, 1986).
Figure 21: Depression and perceived stress in Smith’s (1986) Cognitive-Affective Model of Athletic Burnout
Mental Toughness

77
5.1.2 Variables Not Correlated with Mental Toughness
A cross-sectional relationship between mental toughness and physical symptoms
at baseline was not found. It was originally hypothesized that there would be an
association between these two variables, based on the Cognitive-Affective Model of
Athletic Burnout (Smith, 1986). In the framework of this model, the stress response
results in a physiological response, for example, arousal. Prolonged stress could lead to
these physiological responses culminating into physical symptoms. As mental toughness
can affect cognitive appraisal, it could mediate the stress response, and could affect the
physiologic response. Additional support for a relation between mental toughness and
perceived stress came from Clough and colleagues (2002) who stated that mentally-tough
athletes have the ability to handle stressors better than their less mentally-tough
counterparts. Therefore, athletes who are mentally-tough would be expected to be less
bothered by physical symptoms.
However, a significant association between mental toughness and physical
symptoms was not found in this study at baseline. This could have occurred because the
mean score from CHIPS, the measure used to evaluate physical symptoms, at baseline
was 16.6 ±11.1, with scores ranging from 1 - 40. The maximum score on the CHIPS is
132, thus the scores from CHIPS at baseline were low. Participants were not reporting
many physical symptoms, or were reporting low severity of symptoms at baseline.
Because these data were collected at the start of the season, it is possible that a significant
correlation between the scores from the measures was not found because participants,
regardless of mental toughness score, were reporting low levels of physical symptoms. It
is possible that not enough symptoms were being experienced for symptom levels to vary

78
at different mental toughness levels. When the correlational analyses were conducted
with scores from a different time point, the relationship between physical symptoms and
mental toughness varied. At the end of the intervention program, towards the end of the
season, higher mental toughness levels were significantly associated with lower levels of
physical symptoms (ρ=-.49 p≤.01).
5.1.3 Relationships Among Psychological Variables
Although the primary focus of this hypothesis focused on the relationship
between mental toughness and the psychological variables, it should be noted that the
relationships among mood state, athlete burnout, and perceived stress were consistent
with expectations. The results from this study supported relationships among the
psychological variables of mood state, athlete burnout, and perceived stress from prior
research. A strong association between mood disturbance (measured by POMS) and
athlete burnout (measured by ABQ) was found in this study (ρ=.59, p≤.01). A previous
study conducted in 145 Division I collegiate athletes also showed a strong relationship
between mood disturbance and athlete burnout (r=.64, p≤.01; Welch, 2010), using the
same measures, POMS and ABQ respectively. In this study, higher burnout scores
(measured by ABQ) were significantly positively correlated with higher levels of
perceived stress (measured by PSS) moderately (ρ=.44, p≤.01). Raedeke and Smith
(2004) found that higher burnout scores, measured by the ABQ, were significantly
correlated with higher levels of perceived stress, measured by the PSS, in 244 teenaged
senior level elite swimmers (r=.63, p≤.01).
Other findings from the correlational analysis at baseline were significant.
Depression was strongly associated with perceived stress (ρ=.59, p≤.01). Depression was

79
also strongly associated with athlete burnout (ρ=.50, p≤.01). These relationships had not
been previously reported in athletes.
5.1.4 Variables Correlated with Physical Symptoms
While a relationship between mental toughness and physical symptoms at
baseline was not found in this study, physical symptom scores were associated
significantly with mood state, depression, athlete burnout, and perceived stress. A
moderate correlation was found in the current study between the physical symptom
scores, measured by CHIPS, and perceived stress, measured by PSS (ρ=.45, p≤.01). In
previous research, physical symptoms and perceived stress, measured by CHIPS and PSS
respectively, were shown to be strongly correlated (r=.54, p≤.01; Pbert, Doerfler, &
DeCosimo, 1992). This was found in a study conducted by Pbert and colleagues (1992)
involving intervention programs in two clinical populations: a cardiac rehabilitation
group and general health promotion group. Both men and women (N=100) with a mean
age of 39.0 years participated.
In the current study, a strong correlation was found between physical symptom
scores and depression (ρ=.61, p≤.01). In prior research, physical symptom scores have
also been correlated with depression, measured by the BDI, (r=.34, p≤.01; Lawler-Row
& Piferi, 2006). This association was found in a study conducted by Lawler-Row and
Piferi (2006) in older adults (N=425) from the general population with a median age of
59.5 years.
The results of the current study show that physical symptom scores were not
correlated significantly with any of the subscale scores of the POMS, but were
significantly moderately correlated with total mood disturbance, the combined score of
80
the POMS subscales (ρ=.40, p≤.01). In prior research, scores from CHIPS have been
correlated positively with all six subscales of the POMS questionnaire (Lawler &
Younger, 2002). In a study conducted by Lawler and Younger (2002) with 80 men and
women from the general population, physical symptom levels were strongly associated
with higher scores from all subscales of POMS (r=.34 to r=.73, p≤.01). A correlation
between total mood disturbance and physical symptoms was not reported by Lawler and
Younger (2002). It is important to note that these previously established correlations in
the literature were not from studies conducted in athletes.
5.1.5 Hypothesis #1 Discussion Summary
The results from cross-sectional data collected in this study show that higher
levels of mental toughness are significantly associated with lower levels of mood
disturbance, athlete burnout, depression, and perceived stress. The associations between
mental toughness and the psychological variables of mood state, depression, athlete
burnout, and perceived stress, are consistent with the Cognitive-Affective Model of
Athletic Burnout (Smith, 1986). This supports the identification of mental toughness as a
modifiable variable that could alter cognitive appraisal, the mediating component
between the situation (demands vs. resources) and the negative or positive outcomes.
Thus, the next steps in this study were to first implement a six-week mental toughness
training program, and then to determine if it can 1) increase mental toughness, and 2)
attenuate negative psychological variables.
81
5.2 Hypothesis #2 Discussion
Hypothesis #2: The Mental Toughness Training Program will result in increased levels
of mental toughness as compared to the control group where no changes in mental
toughness levels are expected.
5.2.1 Effectiveness of the Mental Toughness Training Program
The results of the study supported Hypothesis #2 and showed that the Mental
Toughness Training Program significantly increased mental toughness levels in the
participants in the intervention group when compared with the control group from
baseline to post-intervention testing. Mental toughness levels continued to rise after the
program had ended, as demonstrated by the increase in scores of the MeBTough between
post-intervention and follow-up data collection. This increase after the conclusion of the
program was significant, showing that the Mental Toughness Training Program had
continued effects on mental toughness levels. Additionally, baseline scores and scores at
the follow-up period (three weeks after the conclusion of the training program) were
significantly different in the intervention group (F(2,70)=3.25, p≤.05), supporting that the
program had significantly impacted mental toughness levels even after its conclusion.
Mental toughness levels in the control group did fluctuate from baseline to post-
intervention, but after the follow-up period, returned to baseline levels. These results
showed that the program had both long-term and continued effects on mental toughness
levels, as measured by the MeBTough, and that the program was effective in this
population.
This is the first occasion that this six-week, personalized, online mental toughness
training intervention has been implemented in a research study. Therefore, there are no

82
comparisons to be made between the results of this intervention and previous research.
In this study, a 3.9% increase in mental toughness scores was seen in the intervention
group, or a 17-point increase in MeBTough scores. At baseline, the training group scores
differed from the overall mean by 19.6 points, and post-intervention, differed from the
overall mean by 39.9 points, further demonstrating this increase. Additionally, this
research has demonstrated that the training intervention resulted in mental toughness
levels continuing to rise after the completion of the program, with MeBTough scores
increasing by approximately 44 points higher than post-intervention mental toughness
scores.
The Mental Toughness Training Program is a six-week, online, personalized
intervention involving daily psychological skills training. Participants were given one
exercise to complete every day for the duration of the program. The number of exercises
completed in the intervention program was strongly associated with the improvement or
change in mental toughness score (ρ=0.60, p≤.05). This relationship demonstrated that
those participants who completed more exercises in the program had greater
improvements in mental toughness scores than participants who completed fewer. This
supports the hypothesis, and shows that the six-week, online Mental Toughness Training
Program is effective at increasing mental toughness levels.
5.2.2 Challenges Associated with Intervention Implementation
As with all intervention programs, challenges arose with the implementation of
the Mental Toughness Training Program. Participant compliance, tracking participant
compliance, and the format of the training program were three areas that caused
challenges with the implementation of this training intervention.
83
5.2.2.1 Participant compliance
As with any intervention, participants could not be forced to adhere to the
program or made to participate consistently. All participants were encouraged to
complete the Mental Toughness Training Program exercises by research administrators
and coaches, and reminder notices to complete the daily exercise were posted in locker
rooms. Raffles were held weekly for those individuals who had completed six out of the
seven exercises for that week as an additional incentive to participate consistently.
However, some participants did not complete training intervention exercises on a regular
basis, and some did not complete any exercises.
5.2.2.2 Problems with Tracking Compliance
To track program compliance, the number of sessions completed in the online
performance journal on the intervention program website were counted for each athlete in
the intervention group. In 40 out of the 42 exercises given to the participants, they were
asked to either complete an exercise and write an entry about it in the performance
journal, or post an entry in the performance journal recording their progress in the
program. Therefore, counting the number of entries in the performance journal should
have been an accurate way to track how compliant the participants were with the training
program. The advantage of using this method was that a researcher could log into the
study website and count the number of entries, rather than having participants keep track
and self-report their progress to the researcher. The disadvantages to using this method
were that it was time consuming to count how many entries each participant had posted
to the journal, and participants did not always indicated which exercises they were
completing.

84
There were a few reasons why the total number of completed program exercises
counted may not have been an accurate representation of how involved a participant was
in the program. Some participants who fell behind in the program attempted to catch up
by combining exercises from different days together into a single journal entry, and then
did not indicate which exercises they were completing in that entry. This made it
difficult to determine which exercises they were completing and how many times to
count this combined entry towards their total number of exercises completed. This could
have led to the possibility of both an underestimation or overestimation of sessions
completed. Some participants commented that it was easier to think about what they
would put in their journal entry rather than actually creating an entry in their journal,
which would translate to an underestimation of the total sessions completed. There were
also qualitative differences in entries posted, with some participants entering large
quantities of detailed information in their performance journal, and others posting a few
sentences. It is also possible that a participant could have skipped an exercise but
continued to repeat her affirmation statement to herself, possibly contributing to
improving her mental toughness even though there was no record of completing the
exercise in the journal. In some stages of the Mental Toughness Training Program,
exercises were repeated over a few days. Participants may have completed an exercise
on the first day and felt that they had mastered it, and may have not continued to
complete that exercise each following day.
Finally, as all the participants in the intervention group were part of the same
team, regardless of how many sessions they each actually completed individually,
intervention group participants were not independent of each other. Some of the athletes

85
spearheaded a group mental toughness activity, where each member of the team wrote
her personal affirmation statement on her arms before a few games. If a participant had
not done any exercises in the training program, this group activity would require them to
complete at least one exercise in the program: creating an affirmation statement. While
there may be no record of this in a participant’s performance journal, this activity was
completed and done on three separate occasions as a group.
5.2.2.3 Format
The Mental Toughness Training Program was administered online, and exercises
were emailed daily in the morning to each participant. This was to ensure that each
participant received one exercise per day and that the exercise was targeted to that
individual’s specific strength or weakness. The email also served as a reminder to
complete the exercise for that day. However, this system operates under the impression
that participants would be checking their campus emails daily. During the administration
period, there were some Internet outages on campus, and on those occasions, participants
did not receive their emails until later in the day. This could have affected participant
adherence to the program.
5.2.3 Mental Toughness Training Program Feedback
An evaluation form was given to all participants (N=18) in the intervention group
to provide feedback on the training program, and asked the participants to comment on
the program exercises, length, and format. Fifteen participants completed this form.
5.2.3.1 General Feedback
The majority of the participants in the intervention group who completed the
training program evaluation commented that they found the program to be a worthwhile

86
experience. A common complaint was that it was difficult to balance physical training,
competition, academic responsibilities, and the Mental Toughness Training Program. In
general, the participants felt that if they had more time during the fall semester (during
which the program was administered) to allocate towards completing the daily exercises
they would have put more effort into the program. Based on the feedback received, the
affirmation statement was the activity that the participants found most useful.
5.2.3.2 Length
Majority of the participants commented that they felt the length of the
intervention program and the number of exercises was adequate. However, few
completed all the exercises in the program. In future, an “off” or “rest” day could be
added to the program, similar to an “off” or “rest” day in their physical training
schedules. This would allow participants to either catch up on the exercises missed or
take a break from the program. Some comments were made about the duration of the
program being too lengthy and that some of the exercises were repetitive. Seven
exercises per week over six weeks may be too great a number for student athletes to
complete successfully. If implemented again in a Division III population, the Mental
Toughness Training Program could be modified to have five or six exercises per week
instead of seven, and be shortened to four weeks instead of six, spending one week on the
strength and three weeks on the weakness.
5.2.3.3 Format
A few participants indicated that the email format of the program was difficult for
them to follow. Some participants indicated that the emails would get mixed in with the
other emails in their inbox and that they would forget to read them. Another comment

87
was that some of the emails were too long and tedious to read. In the future, emails or
exercises that involve a lot of reading could be turned into a reading assignment.
Participants could be given a reading assignment as an exercise on one day, and then be
given an exercise to complete the next day based off of the information or instructions
provided in the reading.
The performance journal format could also be improved. When the program was
administered in this study, the online performance journal was set up similar to a blog.
Everything written at one time point and then submitted was counted as the entry for that
day. A section could be added to the journal to enter the program day number
corresponding to the exercise being entered. Alternatively, links could be added for each
“day” in the performance journal for participants to click on and then record their entry
for that day. The latter would also make it easier to count how many entries participants
had done to track program compliance.
5.2.4 Hypothesis #2 Discussion Summary
The results of this study demonstrated that the Mental Toughness Training
Program, a personalized online training program created using an individual’s baseline
scores on the MeBTough (Mack & Ragan, 2008), increased levels of mental toughness in
Division III female athletes. Mental toughness levels increased immediately following
the program, and continued to increase when measured three weeks after the program
was completed at the conclusion of the competitive season. The results show that the
Mental Toughness Training Program does have a continued effect on mental toughness
levels. The Mental Toughness Training Program had previously been implemented in
Division I populations successfully (Measuremental LLC, 2010), but had not been tested

88
in a research study, and had never been used in Division III athletes. The results showed
that this program is a successful intervention in Division III athletes, and suggest that the
Mental Toughness Training Program may also be an effective intervention in other
athletic populations. The results also demonstrate that an online psychological skills
training program is an effective mode of intervention in collegiate level athletes.
However, the program was administered in female athletes in this study and should be
repeated in male athletes to further test if implementation is successful in non-elite
athletes.
5.3 Hypothesis #3 Discussion
Hypothesis #3: Improved mental toughness resulting from the training will attenuate
levels of mood disturbances, athlete burnout, depression, physical symptoms, and
perceived stress in the training group as compared to the control group.
The results of this study partially supported Hypothesis #3. The mental toughness
training led to an attenuation of levels of athlete burnout, depression, physical symptoms,
and perceived stress in participants in the intervention group when measured at different
time points during and after the season. These variables were measured at baseline, 2
weeks into the intervention program, 4 weeks into the program, and post-intervention.
Levels of athlete burnout were attenuated when measured at baseline and post-
intervention. Levels of depression, physical symptoms, and perceived stress were
attenuated when measured at baseline, 2 weeks into the intervention, 4 weeks into the
intervention, and post-intervention. Differences in scores of mood state were not
significant across the timepoints.

89
5.3.1 Variables Attenuated by Mental Toughness Training
This study showed that the Mental Toughness Training Program attenuated levels
of burnout, depression, physical symptoms, and perceived stress across different time
points throughout the season. Based on the Cognitive-Affective Model of Athletic
Burnout (Smith, 1986), the framework used for this study, modifying cognitive appraisal
through mental toughness training would reduce the imbalance of demands and
resources, reducing burnout, depression, the occurrence of physical symptoms, and
perceived stress (see Figure 20). This is the first study to implement the Mental
Toughness Training Program in Division III athletes and collect longitudinal data on
psychological and physical variables during the intervention. Therefore, there are no
studies in the literature to compare the findings from this study for Hypothesis #3.
5.3.2 Variables Not Attenuated by Mental Toughness Training
It was expected that the training intervention program would significantly
attenuate levels of mood disturbance, which was not found in this study. Based on the
Cognitive-Affective Model of Athletic Burnout (see Figure 20), modifying mental
toughness levels would have effected cognitive appraisal, and resulted in lower levels of
mood disturbance from the optimal “iceberg” POMS profile (see Figure 1). The results
of Hypothesis #1 also supported this, as mental toughness had a significant negative
relationship with mood state, demonstrating that the variables were associated. It is
possible that mood disturbances were not attenuated because of the wide range of scores
seen in from the POMS. The range of scores from the POMS in the intervention group at
all time points was much wider than the range of some of the other measures. It is
possible that the wide range of scores influenced the results, as the mean total mood

90
disturbance scores in the intervention group did decrease over the six weeks. However,
this decrease was not significant.
5.3.3 Hypothesis #3 Discussion Summary
Mental toughness training attenuated levels of athlete burnout, depression,
physical symptoms, and perceived stress. As these psychological and physical variables
are predictors of illness and injury, this suggests that mental toughness training may be
able to reduce the number of injuries or illnesses experienced by athletes. Consistent
with Smith’s (1986) Cognitive-Affective Model of Athletic Burnout, by balancing the
demands placed on athletes and resources available to them to deal with this, the negative
outcomes associated with burnout and overtraining may be avoided or reduced.
5.4 Injury and Illness Rates In addition to the primary outcome measures of this study, the Athletic Training
department at the institution where this study was conducted kept records of the
occurrence of illness and injury during the study. The control group experienced more
injuries than the training group, and also had more days missed due to injury and illness.
The control group had 22 injuries and missed 94 days due to injury, and one illness and
one day missed due to that illness. The intervention group had three injuries, and 29 days
missed due to injury. The sample size used in this study was not large enough to make
conclusions based on these injury and illness data collected, and it is unknown whether
the intervention group sustained fewer injuries and illnesses than the control group due to
the intervention program. The injury rates between groups may have also differed
because the groups were not playing the same sport. Making conclusions based on injury

91
and illness data was not one of the purposes of this study, but this data was collected
because of its availability, its potential for serving as pilot data for future research, and to
see if any interesting “trends” resulted from it. The control group experienced more
injuries towards the end of the season than the intervention group, which experienced
fewer. Without comparing this data to injury data from previous years, no conclusion can
be made about the effectiveness of the program in reducing injuries or illnesses directly
in the intervention group. Based on the Smith (1986) model, variables that mental
toughness were associated with and that mental toughness training attenuated have been
associated with illness and injuries. Therefore, the findings from this study support an
indirect relationship between injury/illness and mental toughness.
5.5 Mental Toughness Levels and Mood State
Graphs were generated from the scores of the POMS subscales at different
intervals of mental toughness scores in this study, and compared to the “iceberg profile”
(See Figure 1). Average POMS subscale scores and the post-training mental toughness
scores for each team in this study were plotted in Figures 18 and 19. Those results can be
compared with POMS profile plots associated with different levels of mental toughness
from a previous study done in 145 Division I athletes (Welch, 2010) in Figures 22 and
23. The POMS profile plots from the literature show that as mental toughness scores
decline, the POMS profile plot deviates further from the “iceberg profile”. At lower
intervals of mental toughness, the POMS profile plot resembles the inverted iceberg
profile associated with overtraining (see Figure 2). In Figure 22, POMS profile plots
from the intervention group post-intervention are compared with plots from previous

92
Figure 22: Comparing POMS profile plots for mental toughness scores in intervals from the literature (Welch, 2010) to the intervention group post-intervention
Figure 23: Comparing POMS profile plots for mental toughness scores in intervals from the literature (Welch, 2010) to the control group post-intervention

93
research (Welch, 2010). The profiles for the majority of the subgroups follow the same
general pattern of increased deviation from the ideal profile as mental toughness levels
decrease. The deviations from the ideal profile in the intervention group are less
pronounced than the deviations seen in the literature. This finding is likely due to the
difference in sample sizes between the current study (N=15 in the intervention group) and
the prior study (N=145). In Figure 23, POMS profile plots from the control group post-
intervention are compared to plots from previous research (Welch, 2010). The graph
generated for the control group generally follows the pattern of increased deviation from
the “iceberg profile” as mental toughness scores decrease. These graphs further support
the relationship between mental toughness and mood state that was found at baseline in
this study.
5.6 Implications
These results have noteworthy implications in the field of sport psychology. This
study showed that there are relationships between mental toughness and the
psychological variables of mood state, athlete burnout, depression, and perceived stress.
The Mental Toughness Training Program was found to be an effective intervention in
Division III athletes. This study is novel in that it not only measured changes in mental
toughness after implementation of the training program, but it also examined the
program’s impact on changes in important psychological and physical outcomes related
to injury and illness. It was also demonstrated that psychological skills training can
mediate levels of negative psychological and physical variables that have been associated
with illness and injury, and provides another potential avenue for reducing illness and

94
injury susceptibility. If mental toughness training can attenuate variables associated with
injury and illness, then the training may be able to reduce illness and injury rates directly.
The results of the study supports Smith’s (1986) model of athlete burnout. It
showed that mentally-tough athletes have a more positive mood state, reduced levels of
athlete burnout, lower levels of depressive symptoms, and would perceive less stress than
an athlete with lower levels of mental toughness. Based on the model, lower levels of
perceived demands, or higher levels of resources to cope with demands, would lead to
less occurrences of burnout. Illnesses and injuries can increase demands placed on the
athlete, and increase susceptibility to burnout. By reducing illness and injury
susceptibility, an athlete may be less likely to experience burnout.
5.7 Study Limitations
There were several limitations of this study. Baseline testing took place during
training camp for both the intervention and control groups. In the control group, several
athletes were in the process of trying out for the final roster, and the added stress of trying
to make the team may have affected the results. The entire intervention group already
knew they had made the final roster.
While data was collected at the same time points for all the participants in both
groups, exam schedules and stress levels varied individually, and could not be controlled
for. A participant with a heavy academic load during a data collection time point could
have answered items more negatively than a participant who did not have added
academic stress. General life stressors could have varied between participants at the
same points.

95
Data were collected for this study primarily from self-reported measures. Self-
reported measures have limitations, and it is possible that individual interpretations and
perceptions of items on the questionnaires may have affected responses. Because the
same measures were used multiple times in the study, participants may have memorized
items on the questionnaires and then responded the same way each time.
The results of the study also have limited applicability because of the population
used. Female Division III athletes at a private, academically elite institution would not be
expected to have the same level of mental toughness as elite Division I athletes, or on the
opposite end of the spectrum, the general active population. While Division III athletes
could be closer to the general population than Division I athletes, psychological and
physical variables may have different associations with mental toughness and may be
influenced differently by an intervention program in the general population.
5.8 Future Directions
In this study, participants were followed-up after the conclusion of the
competitive season. However, long-term assessment was not incorporated into the study
design. In the future, another study could be conducted involving long-term follow up
with participants of the Mental Toughness Training Program to see if effects of the
program last over months or years.
Because this was the first study to evaluate the impact of the training program on
psychological variables, the protocol should be repeated in athletic populations other than
Division III athletes. The study should be repeated in male athletes or athletes in other
divisions to determine its effectiveness across different athlete populations. The training

96
program also needs to be conducted with athletes in other team sports, for example in
hockey or football, and among athletes in individual-level sports, such as swimming or
track and field.
This study took place during the competitive or traditional season for the teams
involved. It would be interesting to see if the same associations between measures
existed in the non-traditional season, or if the Mental Toughness Training Program is
effective when administered in the off-season when athletes are not specifically training
for their sport.
The measures could be changed if this study was repeated. It was difficult to
analyze the relationship between mental toughness and coping in this study due to the
measure of coping used. The BriefCOPE questionnaire (Carver, 1997) did not have a
total score. The 28-item questionnaire had 14 subscales with two items each and
provided scores for each subscale to indicate the individuals’ use of that particular coping
strategy. However, no formula or method existed to calculate a total coping score. Each
subscale score had to be analyzed separately. The data from the BriefCOPE was used in
the correlational analyses for Hypothesis #1 and a significant correlation was found
between only one subscale of the BriefCOPE (Self-Blame) and mental toughness. For
this reason, the BriefCOPE was not included in further analyses in this study, and in the
future a coping questionnaire with a total score would provide more useful information
for this type of study. If this study was repeated, a more appropriate coping questionnaire
that provides a total or overall score could be used to support the hypothesis that mental
toughness and coping are associated. The psychological variables of mood state,
depression, perceived stress, and coping, and physical measures of physical symptoms
97
were used in this study. In future, other psychological variables, such as emotional
support, locus of control, or anxiety, could be measured to establish or support
associations between these variables and mental toughness, and determine if a mental
toughness training intervention attenuates levels of these psychological variables.
The mental toughness training intervention used in this study was individualized,
and was based on participants’ strengths and weaknesses, as determined from the results
of the MeBTough. This study could be repeated in a randomized control trial format
comparing the personalized Mental Toughness Training Program and a generic, non-
individualized mental toughness program and its impact on mental toughness levels.
This would help to determine if the program is effectively targeting participants’
strengths and weakness, and if mental toughness levels are increasing due to
improvements in strengths and weakness, or non-specific overall improvement.
5.9 Conclusion
Intense physical training is an inherent part of being an elite athlete, and is meant
to improve performance through training adaptations (Bompa, 1983). However,
insufficient recovery time and physical and psychological stressors associated with
training over the long-term can result in overtraining and burnout, and results in increased
susceptibility to injuries, illnesses, and psychological conditions (Kuipers & Keizer,
1988). The Cognitive-Affective Model of Athletic Burnout (Smith, 1986) demonstrates
the consequences of the imbalance in demands placed on athletes and the resources
available to them to cope. The results of long-term imbalance between demands and
resources can result in psychological problems, overtraining, burnout, illness, and injury

98
(Kuipers & Keizer, 1988; Raedeke, 1997). However, the progression to these negative
outcomes is dependent on cognitive appraisal, or how one interprets a situation. Mental
toughness is a modifier of cognitive appraisal, and therefore, modifying mental toughness
levels would impact psychological variables associated with negative health outcomes.
In this study, it was found that higher levels of mental toughness were associated
with lower levels of mood disturbance, athlete burnout, depression, and perceived stress
in Division III athletes. A six-week, online Mental Toughness Training Program
(Measuremental LLC, 2010) was successfully implemented in this same population and
was effective at increasing mental toughness levels. This intervention program
attenuated levels of athlete burnout, depression, physical symptoms, and perceived stress.
The results of the study showed that mental toughness is associated with psychological
variables that are predictors of illness and injury in athletes. The Mental Toughness
Training Program was able to mediate levels of variables associated with illness and
injury. Mental toughness training, therefore, may have the potential to reduce
overtraining, burnout, illness, and injury in Division III collegiate athletes.

99
APPENDICES
Appendix A – INFORMED CONSENT DOCUMENTS
Appendix B – STUDY INSTRUMENTS

100
APPENDIX A
INFORMED CONSENT DOCUMENTS
A1. Consent Form for Participation in a Research Study A2. Parental Consent Form for Participation in a Research Study A3. Assent Form for Participation in a Research Study

101
A1. Consent Form for Participation in a Research Study
Consent Form for Participation in a Research Study
University of Massachusetts Amherst
Principal Investigators: Aisha Visram ATC, Erin Snook PhD Study Title: Impact of Mental Toughness Training on psychological
and physical predictors of illness and injury
1. WHAT IS THIS FORM? This form is called a Consent Form. It will give you information about the study so you can make an informed decision about participation in this research study.
2. WHO IS ELIGIBLE TO PARTICIPATE? You have been asked to participate in this study because you are a healthy female athlete on the soccer or field hockey team and are of ages 18-23 years of age. Participants should be medically cleared as per NCAA procedures to participate in varsity sport in the 2011-2012 season. Participation in this study is voluntary.
3. WHAT IS THE PURPOSE OF THIS STUDY? The purposes of this research study are 1) to determine if there are associations between mental toughness levels and mood disturbances, burnout, stress, coping ability, depression, and physical symptoms experienced, 2) to evaluate the effectiveness of a Mental Toughness Training Program at increasing mental toughness levels in Division III athletes, and 3) to compare levels of mood disturbances, burnout, stress, coping ability, depression, and physical symptoms experienced before, during, and after the Mental Toughness Training Program. This will provide information not only about improving mental toughness in Division III athletes, but also about what other variables may affect and be affected by mental toughness in this population.
4. WHERE WILL THE STUDY TAKE PLACE AND HOW LONG WILL IT LAST? The study will take place over the fall competitive season. The study will take place at the college at the start of the 2011 training camp in August. The time commitment for the study will depend on whether you are assigned to the intervention or control group. Both groups will spend 30-45 minutes completing questionnaires at the beginning and end of the study period, and at the end of the competitive season. All participants will be asked to fill out questionnaires on two occasions midway through the study, which will take 15-30 minutes each time. In addition, participants in the intervention group will complete daily activities requiring 10-15 minutes per day for 6 weeks.
5. WHAT WILL I BE ASKED TO DO? The procedure for this research study is as follows: 1) The first part involves filling out questionnaires relating to various concepts in sports psychology. You will be asked to fill out questionnaires about demographic information, mental toughness, athlete burnout, mood state, depression, perceived stress, coping ability, and physical symptoms. These questionnaires will be fairly straightforward, and will ask you to evaluate yourself in various areas. This process should take 30-45 minutes to complete. Over the course

102
of the study, you may be asked to fill out some of these questionnaires again. 2) After filling out these questionnaires, you will be assigned to either the training group or control group. Participants in the training group will be enrolled in an online Mental Toughness Training Program, lasting 6 weeks. This program will ask you to complete activities daily, such as writing a small entry in a journal, requiring 10-15 minutes per day. 3) During the study period, you will be asked to fill out questionnaires on two occasions on mood state, depression, perceived stress, coping ability, and physical symptoms. This should take 15-30 minutes to complete. 4) After completing the 6 week training program, you will be asked to fill out questionnaires on mental toughness, athlete burnout, mood state, depression, perceived stress, coping ability, and physical symptoms. This should take 30-45 minutes to complete. 5) At the end of the competitive season, you will be asked to fill out the above questionnaires for one final time. 6) At the conclusion of the competitive season, the control group will be given the opportunity to take the Mental Toughness Training Program.
6. WHAT ARE THE BENEFITS OF BEING IN THIS STUDY? There are potential benefits to participating in this study. Since the Mental Toughness Training Program is designed to improve levels of mental toughness, after completing the training program participants may have higher levels of mental toughness, which may improve sport performance. Your participation may help with the improvement of the Mental Toughness Training Program for use in Division III athletes. It will also aid in the understanding of mental toughness and its relationship with other psychological variables.
7. WHAT ARE THE RISKS OF BEING IN THIS STUDY? There are minimal risks associated with being involved in this study. You may experience negative feelings when filling out questionnaires asking you to evaluate different aspects about yourself, but these feelings should be temporary. You may experience some fatigue filling out questionnaires or completing the Mental Toughness Training Program. You may experience some inconvenience when being asked to complete activities for the Mental Toughness Training Program. However, the training program can be completed at your own pace and at a time of your choosing each day to minimize the amount of inconvenience you will experience.
8. HOW WILL MY PERSONAL INFORMATION BE PROTECTED? The following procedures will be used to protect the confidentiality of your study records. The researchers will keep all study records (including any codes to your data) in a secure location in a locked file cabinet, and only the researchers will have access to the data. Records will be labeled with a code. A master key that links names and codes will be maintained in a separate and secure location. Data will be kept for 7 years. All electronic files (e.g., database, spreadsheet, etc.) containing identifiable information will be password protected. Any computer hosting such files will also have password protection to prevent access by unauthorized users. Only the members of the research staff will have access to the passwords. At the conclusion of this study, the researchers may publish their findings. Information will be presented in summary format and you will not be identified in any publications or presentations. Your results will not be shared with other athletes, coaches, athletics staff, etc.
9. WILL I RECEIVE ANY PAYMENT FOR TAKING PART IN THE STUDY? Participants will not directly be receiving any payment for taking part in this study. However, they will receive the opportunity to take the Mental Toughness Training Program, which normally costs $199, for free. Both the intervention and control groups will be eligible to win prizes for completing certain sections of the study. There will be periodic raffles with prizes for

103
participants in the intervention group for completing certain sections of the training program. There will be periodic raffles with prizes for participants in the control group for participating in filling out questionnaires. Prizes include restaurant vouchers and movie tickets. There will be no cost to you to participate in the study.
10. WHAT IF I HAVE QUESTIONS? Take as long as you like before you make a decision. We will be happy to answer any question you have about this study. If you have further questions about this project or if you have a research-related problem, you may contact Aisha Visram at [email protected] or Dr. Erin Snook at [email protected]. If you have any questions concerning your rights as a research subject, you may contact the University of Massachusetts Amherst Human Research Protection Office (HRPO) at (413) 545-3428 or [email protected].
11. CAN I STOP BEING IN THE STUDY? You do not have to be in this study if you do not want to. If you agree to be in the study, but later change your mind, you may drop out at any time. There are no penalties or consequences of any kind if you decide that you do not want to participate.
12.WHAT IF I AM INJURED? The University of Massachusetts, Amherst does not have a program for compensating subjects for injury or complications related to human subjects research, but the study personnel will assist you in getting treatment.
13. SUBJECT STATEMENT OF VOLUNTARY CONSENT I have read this form and decided that I will participate in the project described above. The general purposes and particulars of the study as well as possible hazards and inconveniences have been explained to my satisfaction. I understand that I can withdraw at any time. ________________________ ____________________ __________ Participant Signature: Print Name: Date: By signing below I indicate that the participant has read and, to the best of my knowledge, understands the details contained in this document and has been given a copy. _________________________ ____________________ __________ Signature of Person Print Name: Date: Obtaining Consent
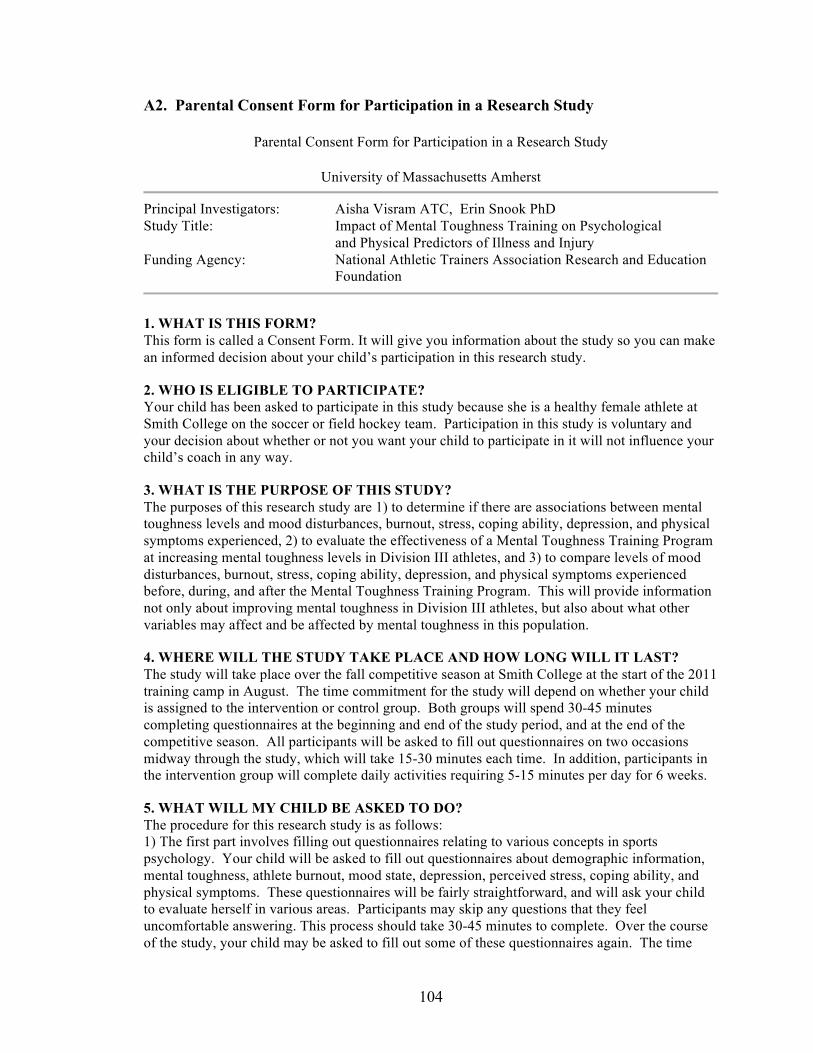
104
A2. Parental Consent Form for Participation in a Research Study
Parental Consent Form for Participation in a Research Study
University of Massachusetts Amherst
Principal Investigators: Aisha Visram ATC, Erin Snook PhD Study Title: Impact of Mental Toughness Training on Psychological
and Physical Predictors of Illness and Injury Funding Agency: National Athletic Trainers Association Research and Education
Foundation
1. WHAT IS THIS FORM? This form is called a Consent Form. It will give you information about the study so you can make an informed decision about your child’s participation in this research study.
2. WHO IS ELIGIBLE TO PARTICIPATE? Your child has been asked to participate in this study because she is a healthy female athlete at Smith College on the soccer or field hockey team. Participation in this study is voluntary and your decision about whether or not you want your child to participate in it will not influence your child’s coach in any way.
3. WHAT IS THE PURPOSE OF THIS STUDY? The purposes of this research study are 1) to determine if there are associations between mental toughness levels and mood disturbances, burnout, stress, coping ability, depression, and physical symptoms experienced, 2) to evaluate the effectiveness of a Mental Toughness Training Program at increasing mental toughness levels in Division III athletes, and 3) to compare levels of mood disturbances, burnout, stress, coping ability, depression, and physical symptoms experienced before, during, and after the Mental Toughness Training Program. This will provide information not only about improving mental toughness in Division III athletes, but also about what other variables may affect and be affected by mental toughness in this population.
4. WHERE WILL THE STUDY TAKE PLACE AND HOW LONG WILL IT LAST? The study will take place over the fall competitive season at Smith College at the start of the 2011 training camp in August. The time commitment for the study will depend on whether your child is assigned to the intervention or control group. Both groups will spend 30-45 minutes completing questionnaires at the beginning and end of the study period, and at the end of the competitive season. All participants will be asked to fill out questionnaires on two occasions midway through the study, which will take 15-30 minutes each time. In addition, participants in the intervention group will complete daily activities requiring 5-15 minutes per day for 6 weeks.
5. WHAT WILL MY CHILD BE ASKED TO DO? The procedure for this research study is as follows: 1) The first part involves filling out questionnaires relating to various concepts in sports psychology. Your child will be asked to fill out questionnaires about demographic information, mental toughness, athlete burnout, mood state, depression, perceived stress, coping ability, and physical symptoms. These questionnaires will be fairly straightforward, and will ask your child to evaluate herself in various areas. Participants may skip any questions that they feel uncomfortable answering. This process should take 30-45 minutes to complete. Over the course of the study, your child may be asked to fill out some of these questionnaires again. The time
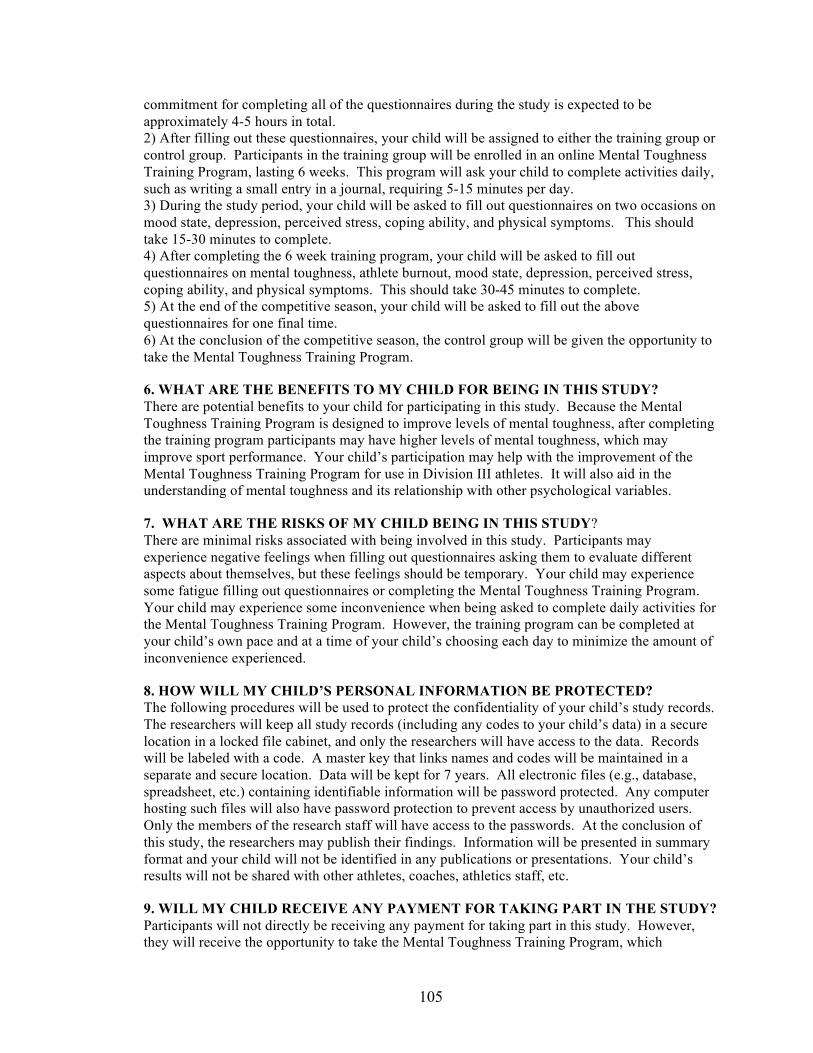
105
commitment for completing all of the questionnaires during the study is expected to be approximately 4-5 hours in total. 2) After filling out these questionnaires, your child will be assigned to either the training group or control group. Participants in the training group will be enrolled in an online Mental Toughness Training Program, lasting 6 weeks. This program will ask your child to complete activities daily, such as writing a small entry in a journal, requiring 5-15 minutes per day. 3) During the study period, your child will be asked to fill out questionnaires on two occasions on mood state, depression, perceived stress, coping ability, and physical symptoms. This should take 15-30 minutes to complete. 4) After completing the 6 week training program, your child will be asked to fill out questionnaires on mental toughness, athlete burnout, mood state, depression, perceived stress, coping ability, and physical symptoms. This should take 30-45 minutes to complete. 5) At the end of the competitive season, your child will be asked to fill out the above questionnaires for one final time. 6) At the conclusion of the competitive season, the control group will be given the opportunity to take the Mental Toughness Training Program.
6. WHAT ARE THE BENEFITS TO MY CHILD FOR BEING IN THIS STUDY? There are potential benefits to your child for participating in this study. Because the Mental Toughness Training Program is designed to improve levels of mental toughness, after completing the training program participants may have higher levels of mental toughness, which may improve sport performance. Your child’s participation may help with the improvement of the Mental Toughness Training Program for use in Division III athletes. It will also aid in the understanding of mental toughness and its relationship with other psychological variables.
7. WHAT ARE THE RISKS OF MY CHILD BEING IN THIS STUDY? There are minimal risks associated with being involved in this study. Participants may experience negative feelings when filling out questionnaires asking them to evaluate different aspects about themselves, but these feelings should be temporary. Your child may experience some fatigue filling out questionnaires or completing the Mental Toughness Training Program. Your child may experience some inconvenience when being asked to complete daily activities for the Mental Toughness Training Program. However, the training program can be completed at your child’s own pace and at a time of your child’s choosing each day to minimize the amount of inconvenience experienced.
8. HOW WILL MY CHILD’S PERSONAL INFORMATION BE PROTECTED? The following procedures will be used to protect the confidentiality of your child’s study records. The researchers will keep all study records (including any codes to your child’s data) in a secure location in a locked file cabinet, and only the researchers will have access to the data. Records will be labeled with a code. A master key that links names and codes will be maintained in a separate and secure location. Data will be kept for 7 years. All electronic files (e.g., database, spreadsheet, etc.) containing identifiable information will be password protected. Any computer hosting such files will also have password protection to prevent access by unauthorized users. Only the members of the research staff will have access to the passwords. At the conclusion of this study, the researchers may publish their findings. Information will be presented in summary format and your child will not be identified in any publications or presentations. Your child’s results will not be shared with other athletes, coaches, athletics staff, etc.
9. WILL MY CHILD RECEIVE ANY PAYMENT FOR TAKING PART IN THE STUDY? Participants will not directly be receiving any payment for taking part in this study. However, they will receive the opportunity to take the Mental Toughness Training Program, which

106
normally costs $199, for free. Everyone in the control group will have the opportunity to do the Mental Toughness Training Program when the study is finished. Both the intervention and control groups will be eligible to win prizes for completing certain sections of the study. There will be periodic raffles with prizes for participants in the intervention group for completing certain sections of the training program. There will be periodic raffles with prizes for participants in the control group for participating in filling out questionnaires. Prizes include restaurant vouchers and movie tickets. There will be no cost to your child to participate in the study.
10. WHAT IF I HAVE QUESTIONS? Take as long as you like before you make a decision about your child participating. We will be happy to answer any question you have about this study. If you have further questions about this project or if you have a research-related problem, you may contact Aisha Visram at [email protected] or Dr. Erin Snook at [email protected]. If you have any questions concerning your child’s rights as a research subject, you may contact the University of Massachusetts Amherst Human Research Protection Office (HRPO) at (413) 545-3428 or [email protected]. Alternatively, if you have any problems or concerns that occur as a result of your child’s participation, you may contact Phil Peake, the Co-chair of the Smith College Institutional Review board at (413) 585-3914. Concerns can also be reported by completing a Participant Complaint Form, which can found on the IRB website at www.smith.edu/irb/compliance.htm.
11. CAN MY CHILD STOP BEING IN THE STUDY? Your child does not have to be in this study if you do not want your child to participate. If you agree to have your child participate in the study, but later change your mind, you may have your child discontinue participation at any time. There are no penalties or consequences of any kind if you decide that you do not want your child to participate.
12.WHAT IF MY CHILD IS INJURED? The University of Massachusetts, Amherst does not have a program for compensating subjects for injury or complications related to human subjects research, but the study personnel will assist your child in getting treatment. It is not expected that your child will be injured by participating in the Mental Toughness Training Program, as all activities are computer-based. Should your child be injured during Smith College Athletics practices or games, your child will still receive appropriate care from the Smith College Athletic Training Department.
13. SUBJECT STATEMENT OF VOLUNTARY CONSENT I have read this form and decided that I do want my child to participate in the project described above. The general purposes and particulars of the study as well as possible inconveniences and hazards have been explained to my satisfaction. I understand that my child can withdraw at any time. There are two copies of this form. I will keep one copy and return the other to the researchers. __________________________________ _______________________________ Parent/legal guardian Name (Print) Parent/legal guardian Signature _____________________________ ______________________ Child’s Name (Print) Date

107
A3. Assent Form for Participation in a Research Study
Assent Form for Participation in a Research Study University of Massachusetts Amherst
Principal Investigators: Aisha Visram ATC, Erin Snook PhD Study Title: Impact of Mental Toughness Training on Psychological
and Physical Predictors of Illness and Injury Funding Agency: National Athletic Trainers Association Research and Education
Foundation
1. WHAT IS THIS FORM? This form is called an Assent Form. It will give you information about the study so you can make an informed decision about participation in this research study.
2. WHO IS ELIGIBLE TO PARTICIPATE? You have been asked to participate in this study because you are a healthy female athlete at Smith College on the soccer or field hockey team. Participants should be medically cleared as per NCAA procedures to participate in varsity sport at Smith College in the 2011-2012 season. Participation in this study is voluntary and your decision about whether or not to participate in it will not influence your coach in any way.
3. WHAT IS THE PURPOSE OF THIS STUDY? The purposes of this research study are 1) to determine if there are associations between mental toughness levels and mood disturbances, burnout, stress, coping ability, depression, and physical symptoms experienced, 2) to evaluate the effectiveness of a Mental Toughness Training Program at increasing mental toughness levels in Division III athletes, and 3) to compare levels of mood disturbances, burnout, stress, coping ability, depression, and physical symptoms experienced before, during, and after the Mental Toughness Training Program. This will provide information not only about improving mental toughness in Division III athletes, but also about what other variables may affect and be affected by mental toughness in this population.
4. WHERE WILL THE STUDY TAKE PLACE AND HOW LONG WILL IT LAST? The study will take place over the fall competitive season. The study will take place at Smith College at the start of the 2011 training camp in August. The time commitment for the study will depend on whether you are assigned to the intervention or control group. Both groups will spend 30-45 minutes completing questionnaires at the beginning and end of the study period, and at the end of the competitive season. All participants will be asked to fill out questionnaires on two occasions midway through the study, which will take 15-30 minutes each time. In addition, participants in the intervention group will complete daily activities requiring 5-15 minutes per day for 6 weeks.
5. WHAT WILL I BE ASKED TO DO? The procedure for this research study is as follows: 1) The first part involves filling out questionnaires relating to various concepts in sports psychology. You will be asked to fill out questionnaires about demographic information, mental toughness, athlete burnout, mood state, depression, perceived stress, coping ability, and physical symptoms. These questionnaires will be fairly straightforward, and will ask you to evaluate yourself in various areas. You may skip any questions you feel uncomfortable answering. This process should take 30-45 minutes to complete. Over the course of the study, you may be asked

108
to fill out some of these questionnaires again. The time commitment for completing all of the questionnaires during the study is expected to be approximately 4-5 hours in total. 2) After filling out these questionnaires, you will be assigned to either the training group or control group. Participants in the training group will be enrolled in an online Mental Toughness Training Program, lasting 6 weeks. This program will ask you to complete activities daily, such as writing a small entry in a journal, requiring 10-15 minutes per day. 3) During the study period, you will be asked to fill out questionnaires on two occasions on mood state, depression, perceived stress, coping ability, and physical symptoms. This should take 15-30 minutes to complete. 4) After completing the 6 week training program, you will be asked to fill out questionnaires on mental toughness, athlete burnout, mood state, depression, perceived stress, coping ability, and physical symptoms. This should take 30-45 minutes to complete. 5) At the end of the competitive season, you will be asked to fill out the above questionnaires for one final time. 6) At the conclusion of the competitive season, the control group will be given the opportunity to take the Mental Toughness Training Program.
6. WHAT ARE THE BENEFITS OF BEING IN THIS STUDY? There are potential benefits to participating in this study. Since the Mental Toughness Training Program is designed to improve levels of mental toughness, after completing the training program participants may have higher levels of mental toughness, which may improve sport performance. Your participation may help with the improvement of the Mental Toughness Training Program for use in Division III athletes. It will also aid in the understanding of mental toughness and its relationship with other psychological variables.
7. WHAT ARE THE RISKS OF BEING IN THIS STUDY? There are minimal risks associated with being involved in this study. You may experience negative feelings when filling out questionnaires asking you to evaluate different aspects about yourself, but these feelings should be temporary. You may experience some fatigue filling out questionnaires or completing the Mental Toughness Training Program. You may experience some inconvenience when being asked to complete activities for the Mental Toughness Training Program. However, the training program can be completed at your own pace and at a time of your choosing each day to minimize the amount of inconvenience you will experience.
8. HOW WILL MY PERSONAL INFORMATION BE PROTECTED? The following procedures will be used to protect the confidentiality of your study records. The researchers will keep all study records (including any codes to your data) in a secure location in a locked file cabinet, and only the researchers will have access to the data. Records will be labeled with a code. A master key that links names and codes will be maintained in a separate and secure location. Data will be kept for 7 years. All electronic files (e.g., database, spreadsheet, etc.) containing identifiable information will be password protected. Any computer hosting such files will also have password protection to prevent access by unauthorized users. Only the members of the research staff will have access to the passwords. At the conclusion of this study, the researchers may publish their findings. Information will be presented in summary format and you will not be identified in any publications or presentations. Your results will not be shared with other athletes, coaches, athletics staff, etc.
9. WILL I RECEIVE ANY PAYMENT FOR TAKING PART IN THE STUDY? Participants will not directly be receiving any payment for taking part in this study. However, they will receive the opportunity to take the Mental Toughness Training Program, which normally costs $199, for free. Everyone in the control group will have the opportunity to do the

109
Mental Toughness Training Program when the study is finished. Both the intervention and control groups will be eligible to win prizes for completing certain sections of the study. There will be periodic raffles with prizes for participants in the intervention group for completing certain sections of the training program. There will be periodic raffles with prizes for participants in the control group for participating in filling out questionnaires. Prizes include restaurant vouchers and movie tickets. There will be no cost to you to participate in the study.
10. WHAT IF I HAVE QUESTIONS? Take as long as you like before you make a decision. We will be happy to answer any question you have about this study. If you have further questions about this project or if you have a research-related problem, you may contact Aisha Visram at [email protected] or Dr. Erin Snook at [email protected]. If you have any questions concerning your rights as a research subject, you may contact the University of Massachusetts Amherst Human Research Protection Office (HRPO) at (413) 545-3428 or [email protected]. Alternatively, if you have any problems or concerns that occur as a result of your participation, you may contact Phil Peake, the Co-chair of the Smith College Institutional Review board at (413) 585-3914. Concerns can also be reported by completing a Participant Complaint Form, which can found on the IRB website at www.smith.edu/irb/compliance.htm.
11. CAN I STOP BEING IN THE STUDY? You do not have to be in this study if you do not want to. If you agree to be in the study, but later change your mind, you may drop out at any time. There are no penalties or consequences of any kind if you decide that you do not want to participate.
12.WHAT IF I AM INJURED? The University of Massachusetts, Amherst does not have a program for compensating subjects for injury or complications related to human subjects research, but the study personnel will assist you in getting treatment. It is not expected that you will be injured by participating in the study intervention, as all activities are computer-based. Should you be injured during Smith College Athletics practices or games, you will still receive appropriate care from the Smith College Athletic Training Department.
13. SUBJECT STATEMENT OF VOLUNTARY CONSENT I have read this form and decided that I want to participate in the project described above. The general purposes and particulars of the study as well as possible hazards and inconveniences have been explained to my satisfaction. I understand that I can withdraw at any time. ______________________ ____________________ __________ Participant Signature Print Name Date By signing below I indicate that the participant has read and, to the best of my knowledge, understands the details contained in this document and has been given a copy. _________________________ ____________________ __________ Signature of Person Print Name Date Obtaining Consent

110
APPENDIX B
STUDY INSTRUMENTS
B1. Demographics Questionnaire B2. Profile of Mood States (POMS) B3. Athlete Burnout Questionnaire (ABQ) – Field Hockey B4. Athlete Burnout Questionnaire (ABQ) - Soccer B5. BriefCOPE B6. Beck Depression Inventory (BDI) B7. Perceived Stress Scale (PSS) B8. Cohen-Hoberman Inventory of Physical Symptoms (CHIPS) B9. Mental Toughness Training Program Evaluation Form B10. Injury Assessment Summary Forms

111
B1. Demographic Questionnaire
1. Date of Birth ____ Age ____
2. Sport (circle one) Soccer Field Hockey
3. How long have you been playing this sport? ____________
4. Year in school _______
5. Year of NCAA eligibility _______
6. Do you have any chronic health conditions? (circle one) Yes No
If yes, please list __________________________________________________________ ________________________________________________________________________ ________________________________________________________________________
7. Do you have a history of suffering from depression or any other psychological conditions? (circle one) Yes No
If yes, please list __________________________________________________________
________________________________________________________________________
________________________________________________________________________
8. Do you take any medications regularly? (circle one) Yes No
If yes, please list _________________________________________________________
_______________________________________________________________________
_______________________________________________________________________

112
B2. POMS
PROFILE OF MOOD STATES QUESTIONNAIRE Below is a list of words that describe feelings people have. Please read each one carefully. Then circle the one number to the right which best describes how you feel right now, at this minute.
RESPONSE KEY
NOT AT ALL A LITTLE MODERATELY QUITE A BIT EXTREMELY
1 2 3 4 5
1. Tense…. 1 2 3 4 5
2. Angry…. 1 2 3 4 5
3. Worn out…. 1 2 3 4 5
4. Lively…. 1 2 3 4 5
5. Confused…. 1 2 3 4 5
6. Shaky…. 1 2 3 4 5
7. Sad…. 1 2 3 4 5
8. Active…. 1 2 3 4 5
9. Grouchy…. 1 2 3 4 5
10. Energetic…. 1 2 3 4 5
11. Unworthy…. 1 2 3 4 5

113
RESPONSE KEY
NOT AT ALL A LITTLE MODERATELY QUITE A BIT EXTREMELY
1 2 3 4 5
12. Uneasy…. 1 2 3 4 5
13. Fatigued…. 1 2 3 4 5 14. Annoyed…. 1 2 3 4 5 15. Discouraged… 1 2 3 4 5 16. Nervous…. 1 2 3 4 5 17. Lonely…. 1 2 3 4 5 18. Muddled…. 1 2 3 4 5 19. Exhausted…. 1 2 3 4 5 20. Anxious…. 1 2 3 4 5 21. Gloomy…. 1 2 3 4 5 22. Sluggish…. 1 2 3 4 5 23. Weary…. 1 2 3 4 5 24. Bewildered…. 1 2 3 4 5

114
RESPONSE KEY NOT AT ALL A LITTLE MODERATELY QUITE A BIT EXTREMELY
1 2 3 4 5
25. Furious…. 1 2 3 4 5
26. Efficient…. 1 2 3 4 5 27. Full of pep…. 1 2 3 4 5 28. Bad-tempered… 1 2 3 4 5 29. Forgetful…. 1 2 3 4 5 30. Vigorous…. 1 2 3 4 5

115
B3. ABQ – Field Hockey
ATHLETIC BURNOUT QUESTIONNAIRE – Field Hockey
Directions: A number of statements that athletes have used to describe their feelings about field hockey are given below. By entering a number from the scale below for each item, please indicate the degree to which you are experiencing each feeling now, at this point in time.
RESPONSE KEY
1 2 3 4 5
almost never rarely sometimes frequently almost always
1. I’m accomplishing many worthwhile things in field hockey. 2. I feel so tired from my training that I have trouble finding energy to do other things. 3. The effort I spend in field hockey would be better spent doing other things. 4. I feel overly tired from my field hockey participation. 5. I am not achieving much in field hockey. 6. I don’t care as much about my field hockey performance as I used to. 7. I am not performing up to my ability in field hockey. 8. I feel “wiped out” from field hockey. 9. I’m not into field hockey like I used to be. 10. I feel physically worn out from field hockey. 11. I feel less concerned about being successful in field hockey than I used to. 12. I am exhausted by the mental and physical demands of field hockey. 13. It seems that no matter what I do, I don’t perform as well as I should. 14. I feel successful at field hockey. 15. I have negative feelings toward field hockey.

116
B4. ABQ - Soccer
ATHLETIC BURNOUT QUESTIONNAIRE - Soccer
Directions: A number of statements that athletes have used to describe their feelings about soccer are given below. By entering a number from the scale below for each item, please indicate the degree to which you are experiencing each feeling now, at this point in time.
RESPONSE KEY
1 2 3 4 5
almost never rarely sometimes frequently almost always
1. I’m accomplishing many worthwhile things in soccer. 2. I feel so tired from my training that I have trouble finding energy to do other things. 3. The effort I spend in soccer would be better spent doing other things. 4. I feel overly tired from my soccer participation. 5. I am not achieving much in soccer. 6. I don’t care as much about my soccer performance as I used to. 7. I am not performing up to my ability in soccer. 8. I feel “wiped out” from soccer. 9. I’m not into soccer like I used to be. 10. I feel physically worn out from soccer. 11. I feel less concerned about being successful in soccer than I used to. 12. I am exhausted by the mental and physical demands of soccer. 13. It seems that no matter what I do, I don’t perform as well as I should. 14. I feel successful at soccer. 15. I have negative feelings toward soccer.
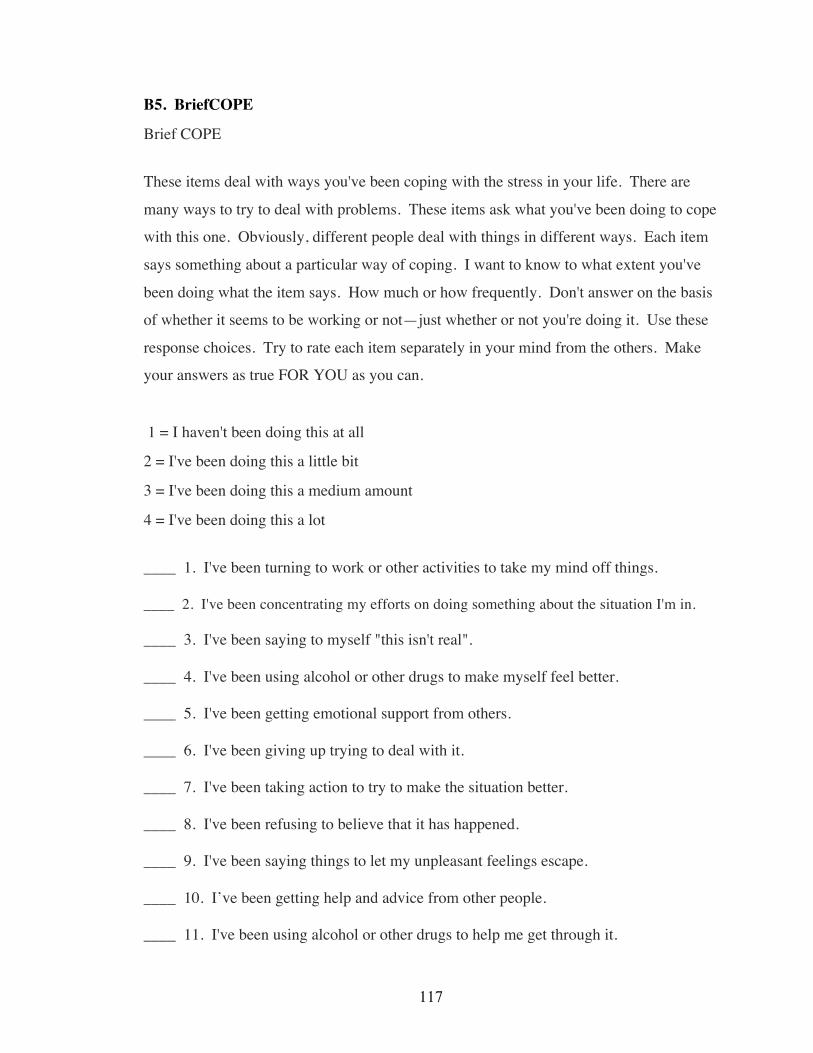
117
B5. BriefCOPE
Brief COPE
These items deal with ways you've been coping with the stress in your life. There are
many ways to try to deal with problems. These items ask what you've been doing to cope
with this one. Obviously, different people deal with things in different ways. Each item
says something about a particular way of coping. I want to know to what extent you've
been doing what the item says. How much or how frequently. Don't answer on the basis
of whether it seems to be working or not—just whether or not you're doing it. Use these
response choices. Try to rate each item separately in your mind from the others. Make
your answers as true FOR YOU as you can.
1 = I haven't been doing this at all ���
2 = I've been doing this a little bit ���
3 = I've been doing this a medium amount ���
4 = I've been doing this a lot
____ 1. I've been turning to work or other activities to take my mind off things.
���____ 2. I've been concentrating my efforts on doing something about the situation I'm in. ���
____ 3. I've been saying to myself "this isn't real".
���____ 4. I've been using alcohol or other drugs to make myself feel better. ���
____ 5. I've been getting emotional support from others.
���____ 6. I've been giving up trying to deal with it. ���
____ 7. I've been taking action to try to make the situation better. ���
____ 8. I've been refusing to believe that it has happened. ���
____ 9. I've been saying things to let my unpleasant feelings escape. ���
____ 10. I’ve been getting help and advice from other people. ���
____ 11. I've been using alcohol or other drugs to help me get through it. ���

118
____ 12. I've been trying to see it in a different light, to make it seem more positive. ���
____ 13. I’ve been criticizing myself. ���
____ 14. I've been trying to come up with a strategy about what to do. ���
____ 15. I've been getting comfort and understanding from someone. ���
____ 16. I've been giving up the attempt to cope. ���
____ 17. I've been looking for something good in what is happening. ���
____ 18. I've been making jokes about it. ���
____ 19. I've been doing something to think about it less, such as going to movies,
��� watching TV, reading, daydreaming, sleeping, or shopping. ���
____ 20. I've been accepting the reality of the fact that it has happened. ���
____ 21. I've been expressing my negative feelings. ���
____ 22. I've been trying to find comfort in my religion or spiritual beliefs. ���
____ 23. I’ve been trying to get advice or help from other people about what to do.
���____ 24. I've been learning to live with it. ���
____ 25. I've been thinking hard about what steps to take. ���
____ 26. I’ve been blaming myself for things that happened. ���
____ 27. I've been praying or meditating. ���
____ 28. I've been making fun of the situation.

119
B6. BDI BECK DEPRESSION INVENTORY
This questionnaire consists of 21 groups of statements. Please read each group of statements carefully, and then pick out the one statement in each group that best describes the way you have been feeling during the past two weeks, including today. Circle the number beside the statement you have picked. If several statements in the group seem to apply equally well, circle the highest number for that group. Be sure that you do not choose more than one statement for any group, including Item 16 (Changes in Sleeping Pattern) or Item 18 (Changes in Appetite).
1. Sadness
0 I do not feel sad.
1 I feel sad much of the time
2 I am sad all the time
3 I am so sad or unhappy that I can’t stand it
2. Pessimism
0 I am not discouraged about my future
1 I feel more discouraged about my future than I used to be
2 I do not expect things to work out for me
3 I feel my future is hopeless and will only get worse
3. Past Failure
0 I do not feel like a failure
1 I have failed more than I should have
2 As I look back, I see a lot of failures
3 I feel I am a total failure as a person

120
4. Loss of Pleasure
0 I get as much pleasure as I ever did from the things I enjoy
1 I don’t enjoy things as much as I used to
2 I get very little pleasure from the things I used to enjoy
3 I can’t get any pleasure from the things I used to enjoy
5. Guilty Feelings
0 I don’t feel particularly guilty
1 I feel guilty over many things I have done or should have done
2 I feel quite guilty most of the time
3 I feel guilty all the time
6. Punishment Feelings
0 I don’t feel I am being punished
1 I feel I may be punished
2 I expect to be punished
3 I feel I am being punished
7. Self-Dislike
0 I feel the same about myself as ever
1 I have lost confidence in myself
2 I am disappointed in myself
3 I dislike myself

121
8. Self-Criticalness
0 I don’t criticize or blame myself more than usual
1 I am more critical of myself than I used to be
2 I criticize myself for all of my faults
3 I blame myself for everything bad that happens
9. Suicidal Thoughts or Wishes
0 I don’t have any thoughts of killing myself
1 I have thoughts of killing myself, but I would not carry them out
2 I would like to kill myself
3 I would kill myself if I had the chance
10. Crying
0 I don’t cry anymore than I used to
1 I cry more than I used to
2 I cry over every little thing
3 I feel like crying, but I can’t
11. Agitation
0 I am no more restless or wound up than usual
1 I feel more restless or wound up than usual
2 I am so restless or agitated that it’s hard to stay still
3 I am so restless or agitated that I have to keep moving or doing something

122
12. Loss of Interest
0 I have not lost interest in other people or activities
1 I am less interested in other people or things than before
2 I have lost most of my interest in other people or things
3 It’s hard to get interested in anything
13. Indecisiveness
0 I make decisions about as well as ever
1 I find it more difficult to make decisions than usual
2 I have much greater difficulty in making decisions than I used to
3 I have trouble making any decisions
14. Worthlessness
0 I do not feel I am worthless
1 I don’t consider myself as worthwhile and useful as I used to
2 I feel more worthless as compared to other people
3 I feel utterly worthless
15. Loss of Energy
0 I have as much energy as ever
1 I have less energy than I used to have
2 I don’t have enough energy to do very much
3 I don’t have enough energy to do anything

123
16. Changes In Sleeping Pattern
0 I have not experienced any change in my sleeping patterns
1a I sleep somewhat more than usual
1b I sleep somewhat less than usual
2a I sleep a lot more than usual
2b I sleep a lot less than usual
3a I sleep most of the day
3b I wake up 1-2 hours early and can’t get back to sleep
17. Irritability
0 I am no more irritable than usual
1 I am more irritable than usual
2 I am much more irritable than usual
3 I am irritable all the time
18. Changes in Appetite
0 I have not experienced any change in my appetite
1a My appetite is somewhat less than usual
1b My appetite is somewhat greater than usual
2a My appetite is much less than before
2b My appetite is much greater than usual
3a I have no appetite at all
3b I crave food all the time

19. Concentration Difficulty
0 I can concentrate as well as ever
1 I can’t concentrate as well as usual
2 It’s hard to keep my mind on anything for very long
3 I find I can’t concentrate on anything
20. Tiredness or Fatigue
0 I am no more tired or fatigued than usual
1 I get more tired or fatigued more easily than usual
2 I am too tired or fatigued to do a lot of things I used to do
3 I am too tired or fatigued to do most of the things I used to do
21. Loss of Interest in Sex
0 I have not noticed any recent change in my interest in sex
1 I am less interested in sex than I used to be
2 I am much less interested in sex now
3 I have lost interest in sex completely
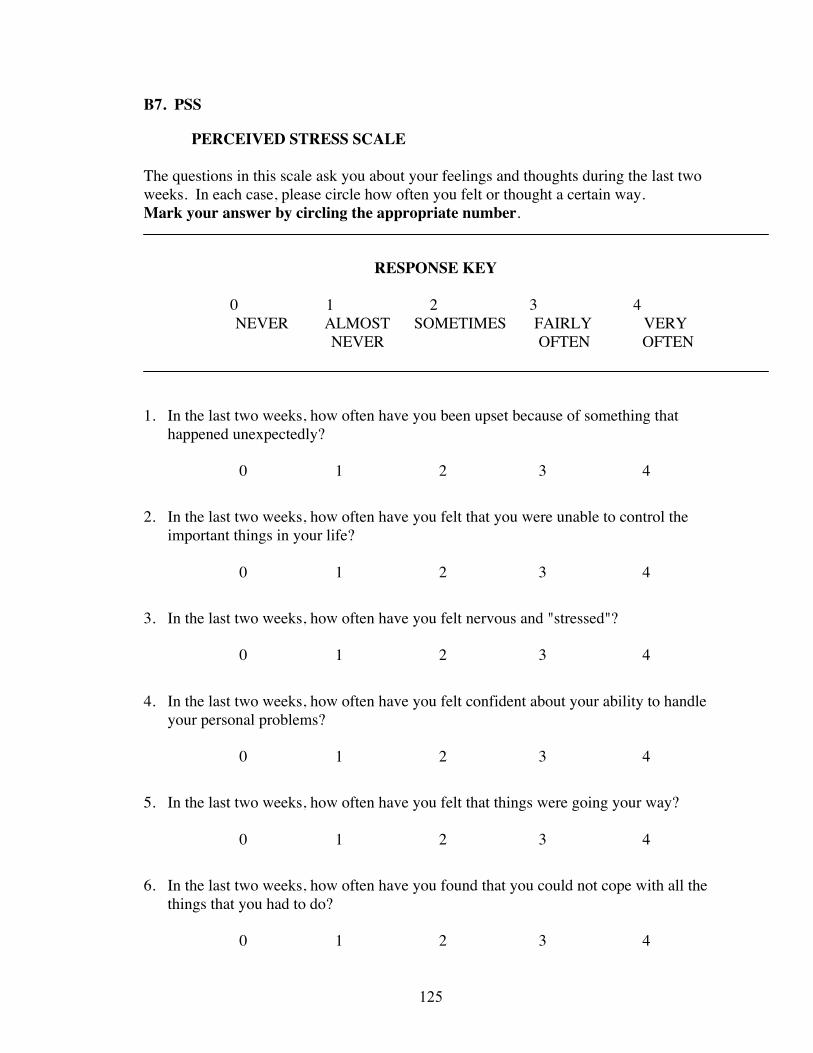
125
B7. PSS
PERCEIVED STRESS SCALE The questions in this scale ask you about your feelings and thoughts during the last two weeks. In each case, please circle how often you felt or thought a certain way. Mark your answer by circling the appropriate number.
RESPONSE KEY
0 1 2 3 4
NEVER ALMOST SOMETIMES FAIRLY VERY NEVER OFTEN OFTEN
1. In the last two weeks, how often have you been upset because of something that happened unexpectedly?
0 1 2 3 4 2. In the last two weeks, how often have you felt that you were unable to control the important things in your life?
0 1 2 3 4 3. In the last two weeks, how often have you felt nervous and "stressed"?
0 1 2 3 4 4. In the last two weeks, how often have you felt confident about your ability to handle your personal problems?
0 1 2 3 4 5. In the last two weeks, how often have you felt that things were going your way?
0 1 2 3 4 6. In the last two weeks, how often have you found that you could not cope with all the things that you had to do?
0 1 2 3 4

126
RESPONSE KEY
0 1 2 3 4 NEVER ALMOST SOMETIMES FAIRLY VERY NEVER OFTEN OFTEN
7. In the last two weeks, how often have you been able to control irritations in your life?
0 1 2 3 4
8. In the last two weeks, how often have you felt that you were on top of things?
0 1 2 3 4 9. In the last two weeks, how often have you been angered because of things that were outside of your control?
0 1 2 3 4 10. In the last two weeks, how often have you felt difficulties were piling up so high that you could not overcome them?
0 1 2 3 4

127
B8. CHIPS COHEN-HOBERMAN INVENTORY OF PHYSICAL SYMPTOMS (CHIPS)
Mark the number for each statement that best describes HOW MUCH THAT PROBLEM HAS BOTHERED OR DISTRESSED YOU DURING THAT PAST TWO WEEKS INCLUDING TODAY. Mark only one number for each item. RESPONSE KEY At one extreme, 0 means that you have not been bothered by the problem. At the other extreme, 4 means that the problem has been an extreme bother.
HOW MUCH WERE YOU BOTHERED BY:
1. Sleep problems (can't fall asleep, wake up in middle of night or early in morning) 0 1 2 3 4
2. Weight change (gain or loss of 5 lbs. or more) 0 1 2 3 4
3. Back pain 0 1 2 3 4
4. Constipation 0 1 2 3 4
5. Dizziness 0 1 2 3 4
6. Diarrhea 0 1 2 3 4
7. Faintness 0 1 2 3 4
8. Constant fatigue 0 1 2 3 4
9. Headache 0 1 2 3 4
10. Migraine headache 0 1 2 3 4
11. Nausea and/or vomiting 0 1 2 3 4
12. Acid stomach or indigestion 0 1 2 3 4
13. Stomach pain (e.g., cramps) 0 1 2 3 4
14. Hot or cold spells 0 1 2 3 4
15. Hands trembling 0 1 2 3 4
16. Heart pounding or racing 0 1 2 3 4
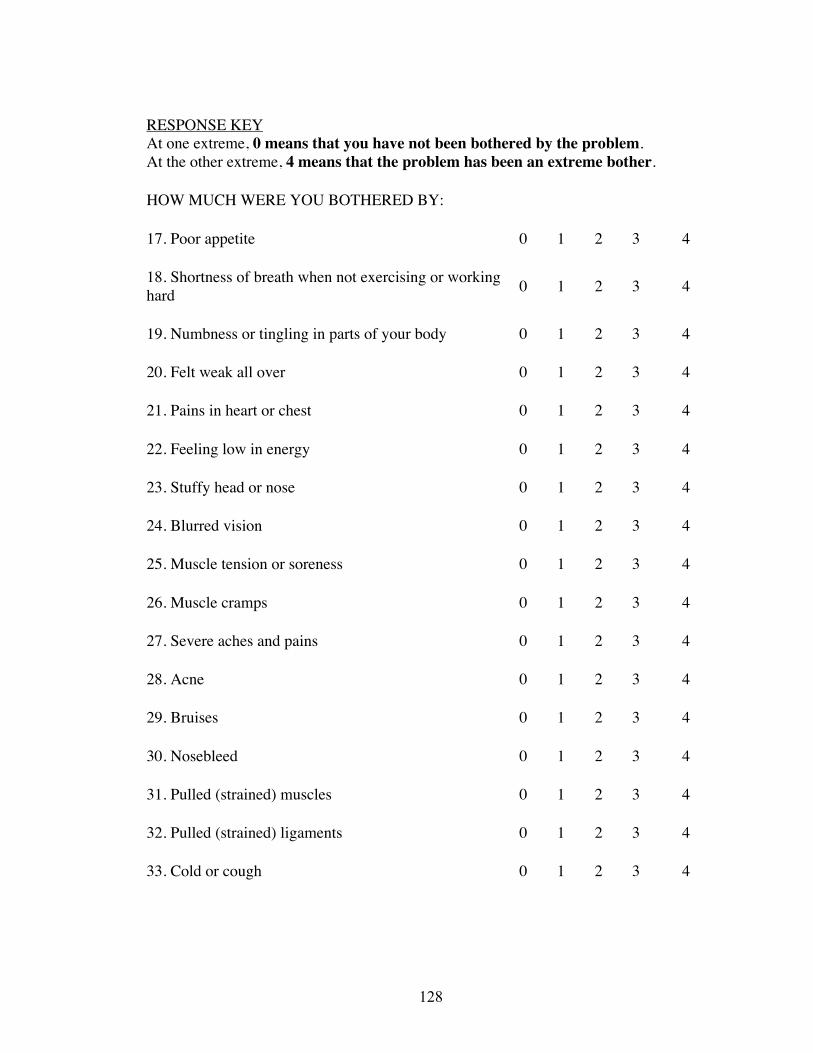
128
RESPONSE KEY At one extreme, 0 means that you have not been bothered by the problem. At the other extreme, 4 means that the problem has been an extreme bother.
HOW MUCH WERE YOU BOTHERED BY:
17. Poor appetite 0 1 2 3 4
18. Shortness of breath when not exercising or working hard 0 1 2 3 4
19. Numbness or tingling in parts of your body 0 1 2 3 4
20. Felt weak all over 0 1 2 3 4
21. Pains in heart or chest 0 1 2 3 4
22. Feeling low in energy 0 1 2 3 4
23. Stuffy head or nose 0 1 2 3 4
24. Blurred vision 0 1 2 3 4
25. Muscle tension or soreness 0 1 2 3 4
26. Muscle cramps 0 1 2 3 4
27. Severe aches and pains 0 1 2 3 4
28. Acne 0 1 2 3 4
29. Bruises 0 1 2 3 4
30. Nosebleed 0 1 2 3 4
31. Pulled (strained) muscles 0 1 2 3 4
32. Pulled (strained) ligaments 0 1 2 3 4
33. Cold or cough 0 1 2 3 4

129
B9. Mental Toughness Training Program Evaluation Form Please indicate what your biggest strength was (e.g., coping etc.):
Please indicate what your biggest weakness was:
1. Which exercises did you find were most useful to you or more beneficial? Why?
2. Which exercises did you find were least beneficial to you? Why?
3. Were the exercises challenging enough for you? Too difficult? At the right level?
4. If you completed the exercises on a consistent basis, did you feel that they were
applicable to your sport and your competition level?
5. If you did not complete the exercises on a consistent basis, was there something about
the program that made it difficult to do so (eg too many exercises, took too much
time, poor explanations in the email, etc)?
6. What did you think about the amount of exercises and the length of the program – is
having one exercise per day for 6 weeks too much/too little/the right amount?
7. After completing the program, did you feel that it had been a worthwhile experience?
Why or why not? Do you feel that the exercises helped tackle your specific weakness
or improve your specific strength?
8. If you were to do this program again, is there anything about the program itself that
you change?
9. If you were to do this program again what would you do differently (if anything)?
10. Additional comments (use back of paper if necessary):

130
B10. Injury Assessment Summary
131
BIBLIOGRAPHY Armstrong, S. & Oomen-Early, J. (2009). Social connectedness, self-esteem, and
depression symptomatology among collegiate athletes versus nonathletes. Journal of American College Health, 57(5), 521-526.
Asztalos, M., Wijndaele, K., De Bourdeaudhuij, I., Philippaerts, R., Matton, L.,
Duvigneaud, N., …Cardon, G. (2009). Specific associations between types of physical activity and components of mental health. Journal of Science and Medicine in Sport, 12, 468-474.
Bailey, R. (2006). Physical education and sport in schools: A review of benefits and
outcomes. Journal of School Health, 76(8), 397-401. Beck, A.T. & Steer, R.A. (1984). Internal consistencies of the original and revised Beck
Depression Inventory. Journal of Clinical Psychology, 40(6),1365-1367. Beck, A.T., Ward, C.H., Mendelson, M., Mock, J., & Erbaugh, J. (1961). An inventory
for measuring depression. Archives of General Psychiatry, 4, 561-571. Bompa, T.O. (1983). Theory and Methodology of Training. Dubuque, IA: Kendall/Hunt. Booth, F.W., Tseng, B.S., Fluck, M., & Carson, J.A. (1998). Molecular and cellular
adaptation to muscle in response to physical training. Acata Physiologica Scandinavica, 162, 343-350.
Bouffard, M. & Crocker, P.R. (1992). Coping by individuals with physical disabilities
with perceived challenge in physical activity: Are people consistent? Research Quarterly for Exercise and Sport, 63(4), 410-417.
Bourgeois, A.E., Meyers, M.C., & LeUnes, A.D. (2010). Full-scale and short-form of
the Profile of Mood States: A factor analytic comparison. Journal of Sport Behavior, 33(4), 1-22.
Brink, M. S., Visscher, C., Coutts, A. J. & Lemmink, K. A. P. M. (2012). Changes in
perceived stress and recovery in overreached young elite soccer players. Scandinavian Journal of Medicine & Science in Sports, 22, 285–292.
Budgett, R. (1990). Overtraining syndrome. British Journal of Sports Medicine, 24(4),
231-236. Budgett, R. (1998). Fatigue and underperformance in athletes: The overtraining
syndrome. British Journal of Sports Medicine, 32, 107-110.

132
Bull, S.J., Shambrook, C.J., James, W., & Brooks, J.E. (2005). Towards an understanding of mental toughness in elite English cricketers. Journal of Applied Sport Psychology, 17, 209-227.
Carver, C. S. (1997). You want to measure coping but your protocol's too long: Consider
the Brief COPE. International Journal of Behavioral Medicine, 4(1), 92-100. Carver, C. S., Scheier, M. F., & Weintraub, J. K. (1989). Assessing coping strategies: A
theoretically based approach. Journal of Personality and Social Psychology, 56, 267-283.
Clough, P., Earle, K., & Sewell, D. (2002). Mental toughness: The concept and its
measurement. In I. Cockerill (Ed.), Solutions in sport psychology (pp. 32-45). London: Thomson.
Coakley, J. (1992). Burnout among adolescent athletes: A personal failure or social
problem? Sociology of Sport Journal, 9, 271-285. Cohen, J. (1988). Statistical power for the behavioral sciences (2nd ed.). Hillsdale, NJ:
Erlbaum. Cohen, S. & Hoberman, H. (1983). Positive events and social supports as buffers of life
change stress. Journal of Applied Psychology, 13, 99-12. Cohen, S., Kamarck, T., & Mermelstein, R. (1983). A global measure of perceived
stress. Journal of Health and Social Behavior, 24, 385-396. Cohen, S. & Williamson, G.M. (1991). Stress and infectious disease in humans.
Psychological Bulletin, 109(1), 5-24. Connaughton, D., Wadey, R., Hanton, S., & Jones, G. (2008). The development and
maintenance of mental toughness. Journal of Sports Sciences, 26, 83-95. Cresswell, S.L. (2009). Possible early signs of athlete burnout: A prospective study.
Journal of Science and Medicine in Sport, 12, 393-398. Curran, P.J., West, S.G., & Finch, J. (1996). The robustness of test statistics to non-
normality and specification error in confirmatory factor analysis. Psychological Methods, 1, 16-29.
Eichner, E. (1995). Overtraining: Consequences and prevention. Journal of Sports
Sciences, 13, S41-S8. Endler, N.S. & Parker, J.D.A. (1994). Assessment of multidimensional coping: Task,
emotion, and avoidance strategies. Psychological Assessment, 6(1), 50-60.
133
Fletcher, D. (2005). “Mental toughness” and human performance: Definitional, conceptual and theoretical issues. Journal of Sports Sciences, 23, 1246-1247.
Flynn, M.G., Pizza, F.X., Boone, J.B., Andres, F.F., Michaud, T.A., & Rodriguez-Zayas,
J.R. (1994). Indices of training stress during competitive running and swimming seasons. International Journal of Sports Medicine, 15(1), 21-26.
Ford, I.W., Eklund, R.C., & Gordon, S. (2000). An examination of psychosocial
variables moderating the relationship between life stress and injury time-loss among athletes of a high standard. Journal of Sports Sciences, 18(5), 301-312.
Freudenberger, H.J. (1974). Staff burnout. Journal of Social Issues, 30, 159-165. Fry, R.W., Morton, A.R., & Keast, D. (1991). Overtraining in athletes: An update.
Sports Medicine, 12(1), 32-65. Gaudreau, P. & Blondin, J.P. (2002). Development of a questionnaire for the assessment
of coping strategies employed by athletes in competitive sport settings. Psychology of Sport and Exercise, 3(1), 1-34.
Goodger, K., Gorely, T., Lavallee, D., & Harwood, C. (2007). Burnout in sport: A
systematic review. The Sport Psychologist, 21, 127-151. Goss, J.D. (1994). Hardiness and mood disturbances in swimmers while overtraining.
Journal of Sport Exercise Psychology, 16, 135-149. Gould, D., Udry, E., Tuffey, S., & Loehr, J. (1996). Burnout in competitive junior tennis
players: I. A qualitative psychological assessment. The Sport Psychologist, 10, 322-340.
Grylls, E. & Spittle, M. (2008). Injury and burnout in Australian athletes. Perceptual
and Motor Skills, 107, 873-880. Gustafsson, H., Hassmen, P., Kentta, G., & Johannson, M. (2008). A qualitative analysis
of burnout in elite Swedish athletes. Psychology of Sport and Exercise, 9, 800-816.
Hanson, S.J., McCullagh, P., & Tonymon, P. (1992). The relationship of personality
characteristics, life stress, and coping resources to athletic injury. Journal of Sport & Exercise Psychology, 14(3), 262-272.
Hill, A.P., Hall, H.K., & Appleton, P.R. (2010). Perfectionism and athlete burnout in
junior elite athletes: The mediating role of coping tendencies. Anxiety, Stress, & Coping, 23(4), 415-430.

134
Hootman, J.M., Dick, R., & Agel, J. (2007). Epidemiology of collegiate injuries for 15 sports: Summary and recommendations for injury prevention initiatives. Journal of Athletic Training, 42(2), 311-319.
Iacovides, A., Fountoulakis, K.N., Kaprinis, S., & Kaprinis, G. (2003). The relationship
between job stress, burnout and clinical depression. Journal of Affective Disorders, 75, 209-221.
Jones, G., Hanton, S., & Connaughton, D. (2002). What is this thing called mental
toughness? An investigation of elite sport performers. Journal of Applied Sport Psychology, 14, 205-218.
Jones, J.W., Neuman, G., Altmann, R., & Dreschler, B. (2001). Development of the
Sports Performance Inventory: A psychological measure of athletic potential. Journal of Business and Psychology, 15, 491-503.
Kaiseler, M., Polman, R., & Nicholls, A. (2009). Mental toughness, stress, stress
appraisal, coping and coping effectiveness in sport. Personality and Individual Differences, 47, 728-733.
Kellmann, M. (2010). Preventing overtraining in athletes in high-intensity sports and
stress/recovery monitoring. Scandinavian Journal of Medicine and Science in Sports, 20(supplement 2), 95-102.
Kibler, W.B. & Chandler, T.J. (1998). Musculoskeletal and orthopedic considerations.
In: R.B. Kreider, A.C. Fry, & M.L. O’Toole (Eds.), Overtraining in Sport (pp. 169-190). Champlain, IL: Human Kinetics Publishers, Inc.
Kibler, W.B., Chandler, T.J., & Stracener, E.S. (1992). Musculoskeletal adaptations and
injuries due to overtraining. Exercise and Sport Science Reviews, 20, 99-126. Kobasa, S.C. (1979). Stressful life events, personality and health. An inquiry into
hardiness. Journal of Personality and Social Psychology, 37, 1-11. Kraemer, W.J., & Nindl, B.C. (1998). Factors involved with overtraining for strength
and power. In: R.B. Kreider, A.C. Fry, & M.L. O’Toole (Eds.), Overtraining in Sport (pp. 69-70). Champlain, IL: Human Kinetics Publishers, Inc.
Kuipers, H. & Keizer, H.A. (1988). Overtraining in elite athletes: Review and
directions for the future. Sports Medicine, 6(2), 79-92. Lawler, K.A. & Younger, J.W. (2002). Theobiology: An analysis of spirituality,
cardiovascular responses, stress, mood, and physical health. Journal of Religion and Health, 41(4), 347-362.
135
Lawler-Row, K.A. & Piferi, R.L. (2006). The forgiving personality: Describing a life well lived? Personality and Individual Differences, 41, 1009-1020.
Lazarus, R.S. & Folkman, S. (1984). Stress, appraisal, and coping. New York:
Springer. Levy, A., Clough, P., Polman, R., Marchant, D., & Earle, K. (2005). Mental toughness
and injury occurrence in elite swimming. Journal of Sport Sciences, 23, 1256-1257.
Loehr, J.E. (1986). Mental toughness training for sport: Achieving athletic excellence.
New York, NY: Penguin Books USA Inc. Loehr, J.E. (1994). The new toughness training for sports: Mental, emotional, and
physical conditioning from one of the world’s premier sports psychologists. New York, NY: Penguin Books USA Inc.
Mack, M.G. & Ragan, B.G. (2008). Development of the Mental, Emotional, and Bodily
Toughness Inventory in collegiate athletes and non-athletes. Journal of Athletic Training, 43, 125-132.
MacKinnon, L.T. (2000). Overtraiing effects on immunity and performance in athletes.
Immunology and Cell Biology, 78, 502-509. MacKinnon, L.T. & Hooper, S. (1994). Mucosal (secretory) immune system responses
to exercise of varying intensity and during overtraining. International Journal of Sports Medicine, 15, S179-S183.
Maddison, R. & Prapavessis, H. (2005). A psychological approach to the prediction and
prevention of athletic injury. Journal of Sport & Exercise Psychology, 27, 289-310.
Main, L.C., Dawson, B., Grove J.R., Landers, G.J., & Goodman, C. (2009). Impact of
training on changes in perceived stress and cytokine production. Research in Sports Medicine, 17, 121-132.
Main, L.C., Landers, G.J., Grover, J.R., Dawson, B., & Goodman, C. (2010). Training
patterns and negative health outcomes in triathlon: Longitudinal observations across a full competitive season. Journal of Sports Medicine and Physical Fitness, 50, 475-485.
Mandelbaum, B.R., Silvers, H.J., Watanabe, D.S., Knarr, J.F., Thomas, S.D., Griffin,
L.Y.,…Garrett, W. (2005). Effectiveness of a neuromuscular and proprioceptive training program in preventing Anterior Cruciate Ligament injuries in female Athletes : 2-year follow-up. American Journal of Sports Medicine, 22, 1003-1010.

136
McNair, D.M., Lorr, M., & Droppleman, L.F. (1971). Profile of Mood States manual. North Tanawanda, NY: Multi-health Systems.
Measuremental LLC. (2010). The Research. Retrieved from
http://measuremental.com/The%20Research.html. Moran, A. (2004). Sport and exercise psychology: A critical introduction. Hove,
England: Routledge. Moreira, A., Arsati, F., de Oliveira Lima-Arsati, Y. B., Simões, A. C. and de Araújo, V.
C. (2011). Monitoring stress tolerance and occurrences of upper respiratory illness in basketball players by means of psychometric tools and salivary biomarkers. Stress and Health, 27, 166–172.
Morgan, W.P. (1985). Selected psychological factors limiting performance: A mental
health model. In D.H. Clarke & H.M. Eckert (Eds.), Limits of human performance (pp. 70-80). Champaign, IL: Human Kinetics.
Morgan, W.P., Brown, D.R., Raglin, J.S., O’Connor, P.J., & Ellickson, K.A. (1987).
Psychological monitoring of overtraining and staleness. British Journal of Sports Medicine, 21(3), 107-114.
Morgan, W.P., Costill, D.L., Flynn, M.G., Raglin, J.S., & O’Connor, P.J. (1988). Mood
disturbance following increased training in swimmers. Medicine and Science in Sports and Exercise, 20(4), 408-414.
Morgan, W.P., O’Connor, P.J., Sparkling, P.B., & Pate, R.R. (1987). Psychologic
characterization of the elite female distance runner. International Journal of Sports Medicine, 8, 124-131.
Nicholls, A.R., Polman, R.C.J., Levy, A.R., & Backhouse, S.H. (2008). Mental
toughness, optimism, pessimism, and coping among athletes. Personality and Individual Differences, 44, 1182-1192.
Nicholls, A.R. & Polman, R.C.J. (2007). Coping in sport: A systematic review.
Journal of Sports Sciences, 25(1), 11-31. Nideffer, R.M. (1983). The injured athlete: Psychological factors in treatment.
Orthopedic Clinics of North America, 14(2), 373-385. Niederbracht, Y., Shim, A.L., Sloniger, M.A., Paternostro-Bayles, M., & Short, T.H.
(2008). Effects of a shoulder injury prevention strength training program on eccentric external rotator muscle strength and glenohumeral joint imbalance in female overhead activity athletes. Journal of Strength and Conditioning Research, 22(1), 140-145.

137
Ntoumanis, N., Biddle, S.J.H., & Haddock, G. (1999). The mediating role of coping strategies on the relationship between achievement motivation and affect in sport. Anxiety, Stress, and Coping, 12, 299-327.
Pbert, L., Doerfler, L.A., & DeCosimo, D. (1992). An evaluation of the Perceived Stress
Scale in two clinical populations. Journal of Psychopathology and Behavioral Assessment, 14(4), 363-375.
Perna, F.M., Antoni, M.H., Bum, A., Gordon, P., & Schneiderman, N. (2003). Cognitive
behavioral stress management effects on injury and illness among competitive athletes: A randomized clinical trial. Annuals of Behavioral Medicine, 25(1), 66-73.
Peterson, K. (2005). Overtraining: Balancing practice and performance. In S. M.
Murphy (Ed.), The Sport Psych Handbook: A complete guide to today’s best mental training techniques (pp. 49-70). Champaign, IL: Human Kinetics Publishers, Inc.
Purvis, D., Gonsalves, S. & Deuster, P.A. (2010). Physiological and psychological
fatigue in extreme conditions: Overtraining and elite athletes. Physical Medicine & Rehabilitation, 2(5), 442-450.
Raedeke, T.D. (1997). Is athlete burnout more than just stress? A sport commitment
perspective. Journal of Sport Exercise Psychology, 19, 396-417. Raedeke, T.D. & Smith, A.L. (2001). Development and preliminary validation of an
athlete burnout measure. Journal of Sport Exercise Psychology, 23, 281-306. Raedeke, T.D. & Smith, A.L. (2004). Coping resources and athlete burnout: An
examination of stress mediated and moderation hypotheses. Journal of Sport & Exercise Psychology, 26, 525-541.
Raglin, J.S., Morgan, W.P., & O’Connor, P.J. (1991). Changes in mood states during
training in female and male college swimmers. International Journal of Sports Medicine, 12(6), 585-589.
Requa, R.K., DeAvilla, L.N., & Garrick, J.G. (1993). Injuries in recreational adult
fitness activities. American Journal of Sports Medicine, 21(3), 461-467. Schaufeli, W.B. & Buunk, B.P. (2003). Burnout: An overview of 25 years of research in
theorizing. In M.J. Schabracq, J.A.M. Winnubst, & C.L. Cooper (Eds.), The handbook of work and health psychology (pp. 383-425). Chichester: Wiley.
Schmidt, G.W. & Stein, G.L. (1991). Sport commitment: A model of integrating
enjoyment, dropout, and burnout. Journal of Sport & Exercise Psychology, 13, 254-265.

138
Sheard, M. (2010). Mental toughness: The mindset behind sporting achievement. New York, NY: Routledge.
Sheard, M., Golby, J., & van Wersh, A. (2009). Progress towards construct validation of
the Sports Mental Toughness Questionnaire (SMTQ). European Journal of Psychological Assessment, 25, 184-191.
Smith, A.L., Gustafsson, H., & Hassmen, P. (2010). Peer motivational climate and
burnout perceptions of adolescent athletes. Psychology of Sport and Exercise, 11, 453-460.
Smith, R.E. (1986). Toward a cognitive-affective model of athletic burnout. Journal of
Sport Psychology, 8, 36-50. Smith, R.E., Smoll, F.L., & Ptacek, J.T. (1990). Conjunctive moderator variables in
vulnerability and resiliency research: Life stress, social support and coping skills, and adolescent sport injuries. Journal of Personality and Social Psychology, 58(2), 360-370.
Sonnenschein, M., Sorbi, M.J., van Doornen, L.J.P., Schaufeli, W.B., & Maas, C.J.M.
(2007). Evidence that impaired sleep recovery may complicate burnout improvement independently of depressive mood. Journal of Psychosomatic Research, 62, 487-494.
Steptoe, A.S. & Butler, F.R.C.P. (1996). Sport participation and emotional wellbeing in
adolescents. The Lancet, 347(9018), 1789-1792. United States Government Accountability Office. (2007). Intercollegiate athletics -
Recent trends in teams and participants in National Collegiate Athletic Association sports. (GAO Publication No. GAO-07-535). Retrieved 30 April 2011 from Government Accountability Office website: http://www.gao.gov/new.items/d07535.pdf
Urhausen, A., Gabriel, H., & Kindermann, W. (1995). Blood hormones as markers of
training stress and overtraining. Sports Medicine, 20(4), 251-276. Walsh, N.P., Blannin, A.K., Robson, P.J., & Gleeson, M. (1998). Glutamine, exercise
and immune function: Links and possible mechanisms. Sports Medicine, 26(3), 177-191.
Welch, M.J. (2010). The Overtraining Syndrome and its Effects on Athletic Burnout.
(Unpublished master’s thesis project). University of Massachusetts Amherst. Williams, J.M. & Krane, V. (2001). Psychological characteristics of peak performance.
In J.M. Williams (Ed.), Applied sport psychology: Personal growth to peak performance (4th ed.) (pp.162-178). Mountain View, CA: Mayfield.

139
Williams, J.M., Tonymon, P., & Andersen, M.B. (1990). Effects of life-event stress on anxiety and peripheral narrowing. Behavioral Medicine, 16(4), 174-181.
Zhu, W., Timm, G., & Ainsworth, B. (2001). Rasch calibration and optimal
categorization of an instrument measuring women’s exercise perseverance and barriers. Research Quarterly for Exercise and Sport, 72(2), 104-116.


![Mental Toughness in Sport By [Adelaida Maggard] · Mental Toughness iii Abstract Background: Successful performance of athletes and sports players is dependent on mental toughness,](https://img.dokumen.tips/doc/110x75/5f87de01559f9076a1599664/mental-toughness-in-sport-by-adelaida-maggard-mental-toughness-iii-abstract-background.jpg)