Embed Size (px)
Citation preview

International Journal of Food and Agricultural Economics ISSN 2147-8988
Vol. 2 No. 2 pp. 113-126
113
IMPACT OF MAIZE IMPORT TARIFF POLICY CHANGES ON
PRODUCTION AND CONSUMPTION IN INDONESIA: A
MULTIMARKET MODEL ANALYSIS
Sintya Jummoni Krissanty Umboh
Sam Ratulangi University, Jl. Kampus Unsrat, Bahu Manado-North Sulawesi 95115,
Indonesia, Email: [email protected]
Dedi Budiman Hakim
Bogor Agricultural University, Indonesia
Bonar Marulitua Sinaga
Bogor Agricultural University, Indonesia
I Ketut Kariyasa
Indonesian Center for Food Crops Research and Development, Bogor, Indonesia
Abstract
The purposes of this study is at analyzing the impact of maize import tariff policy changes
on production and consumption in Indonesia. Three groups of households were assessed in
this studi, namely: (1) large scale broiler farming, (2) small scale broiler farming, and (3)
other households. Employed data in this study were classified into 3 types: (1) production
and input, consumption, and household income, (2) inputs and outputs, and (3) elasticities.
The abolishment of the import tariff policy on maize had an impact on increased maize
imported and decreased maize price. Decreased domestic maize price was responded by
maize farmer through lessing maize planted area and fertilizer input uses that had impact on
the declining in maize production. On the other hand, this policy had positive impact on
production of rice, chicken meat, and eggs which led to increase incomes of small scale
broiler farming and agricultural sector, as well as national. It furthermore increased the consumption for maize, chicken meat, and eggs in Indonesia.
Key words: Maize, import tariff, production, consumption, multimarket
1. Introduction
Consumption rates of meat and eggs tend to increase from year to year. Meat
consumption in 2010 increased by 10.42 percent compared with 2009 from 6.29
kg/capita/year to 6.95 kg/capita/year. The same condition was found for eggs consumption,
in which it increased by 13.24 percent compared with 2009 (Bureau of Food Security of
Ministry of Agriculture, 2012). The fact showed that the demand for meat and eggs continuously increasing has triggered efforts to produce more meat and eggs.
The sustainability of broiler farming business is to some extent determined by the
changes in the prices of inputs and outputs. The changes in input prices affect on the
decisions of inputs allocation and production by small scale broiler farming. In other words,
the amount of chicken meat production depends on the changes in feed prices. The changes
Impacts Of Maize Import Tariff Policy Changes…
114
in feed prices depend on the changes in the prices of maize as feed ingredient with a
proportion reaching 55-65 percent. If the availability of maize decreases, the availability of
raw material for feed industry will decline, and vice versa. Eventually, it will affect chicken
meat available. For example, an increased demand for broiler will lead to an increased
demand for broiler feed, which in turn has an impact on the increased demand for maize, and
vice versa. This phenomenon indicates that the performance of each market is not only
determined by internal factors but also affected by the behavior of the other markets.
During the period 2000-2005, maize demand was higher than the production, thereby
Indonesia imported maize of between 226 thousand and 1.8 million tons. In 2007, the
national maize production was only 13.3 million tons and began being above it national
demand of 12.5 million tons. The same condition also occurred during the period 2008-2010. However, imports of maize were still done of 795 thousand tons in 2007 and 300 thousand
tons in 2009. Even in 2011, imported maize increased by 3.1 million tons compared with the
previous year (1.5 million tons). According to Feed Animal Manufacture Corporation, the
increase imported maize because of the difficulty in getting maize from farmers that their
location is spread out in the country (Destiana, 2010; FAO, 2011).
Multimarket model is a model that focuses on analyzing direct and indirect effects of
changes in price and quantity of a set of interrelated commodities in terms of supply and
demand. This economic mathematical approach is suitable to evaluate the government policy
in the field of economy (Arulpragasam et al. (2003). The World Bank has developed a
linkage market model for Senegal, South Korea, and Cyprus to analyze the impact of policy
changes in prices, such as changes in the level of subsidy and fertilizer on the productivity of rice, domestic demand, local revenues, stock, trade, and government revenue (Sadoulet & de
Janvry, 1995, Braverman & Hammer, 1986, Goletti & Rich, 1998). In the early 1990, a
multimarket model analysis was used to measure the impact of policy changes on the poor
households (Dorosh et al., 1995), and it was focused on analyzing the impact of food imports
on the poverty level in Mozambique. In Indonesia Sayaka et al., (2007) conducted a study to
assess the impact of import tariff policy changes on the welfare of domestic rice farmers in
Indonesia. The research results showed that the elimination of tariff on rice would reduce
the supply of rice and decreased farmer household income in rural areas; however, it
increased the purchasing power of rice farmers. The opposite condition occurred if there was
an increase in rice import tariff. The impact of import tariff on rice market affected the
market of food crop and livestock commodities analyzed.
To control the importation of maize and protect domestic maize farmers, the government issued a policy of import tariffs. During the period 1974-1978, 5 (five) percent import tariff
was imposed before it was increased to 10 percent in the period 1980-1993. In 1994, the
import tariff was lowered and it went back to 5 percent, and in 1995 it was totally removed.
However, since 2007, based on Government Regulation No. 7, 2007 concerning the duties of
imported goods, the import tariff of maize has been charged 5 percent. This policy has an
impact on rice production as a competitor for maize in land usage, and furthermore has an
impact on broiler businesses performance that use maize as the main raw material for feed.
Based on the description above, this research analyzed the impact of maize import tariff
policy changes on production and consumption in Indonesia with the problem statement is
how the maize import tariff policy changes have impacted: (i) the production of food crops
and livestock in Indonesia and (ii) the consumption for rice, maize, chicken meat, and eggs in Indonesia. Therefore, the study was conducted with the aims at analyzing the impact of
maize import tariff policy changes on: (1) the production of food crops and livestock in
Indonesia and (ii) the consumption for rice, maize, chicken meat, and eggs in Indonesia.

S. J. K. Umboh, D. B. Hakim, B. M. Sinaga and I. K. Kariyasa
115
2. Methodology
2.1. Data Types and Sources
There are 3 groups of households in this study, namely: (1) large scale broiler farming
(PRSHN), (2) small scale broiler farming (PTRYT), and (3) other households (RTOTH).
Furthermore, the data were classified into 3 types: (1) production and inputs, consumption,
and household income of every commodity, (2) inputs and outputs, and (3) elasticities. The
data of production, input use, consumption, income, and prices were gathered from the
Central Bureau of Statistics and the Ministry of Agriculture in 2011, while the elasticities
data were collected from previous studies (Sayaka et al., 2007; Sugema & Roy, 2010).
2.2. Model Formulation
This study employed multimarket model that derived from Lundberg and Rich (2002),
Stifel and Randrianarisoa (2004). This models part of partial equilibrium model. This partial
equilibrium model was used to analyze the impact of changes in price and quantity in a
particular market in household income and expenditures. This model was divided into 6
blocks of equations, namely: (1) price, (2) supply, (3) input demand, (4) consumption, (5)
income, and (6) equilibrium condition. The commodities were analyzed in this study
consisted of six commodities, namely: rice (rc), maize (m), broiler (br), eggs (lr), urea (ur),
and triple super phosphate (TSP). Price Block
Consumer prices (PC) are higher than producer prices (PP) due to the domestic
marketing margin (MARG). The consumer price can be calculated by using the following
equation:
(1)
where the subscripts c, h, refer to commodity, household type respectively. The border
price (PM) of the importable products (im) rice and maize are linked to the world price by
the exchange rate (er), import tariffs (tm), and the international marketing margin (RMARG).
(2)
The border price (PM) of the importable products (im) are linked to the world price by
the exchange rate (er), import tariffs (tm), and the international marketing margin (RMARG).
PCc,h = PMc * (1+RMARG) (3)
The large scale of consumer price differ from the small scale broiler farming by an
internal marketing margin (INTMARG) that reflects transportation and marketing costs.
PCc,pr = PCc,p * (1 + INTMARG) (4)
PCc,rt = PCc,pr (5)
It included a price index for each household group to reflect changes in prices weighted
by their shares of consumption:
∑
(6)
Impacts Of Maize Import Tariff Policy Changes…
116
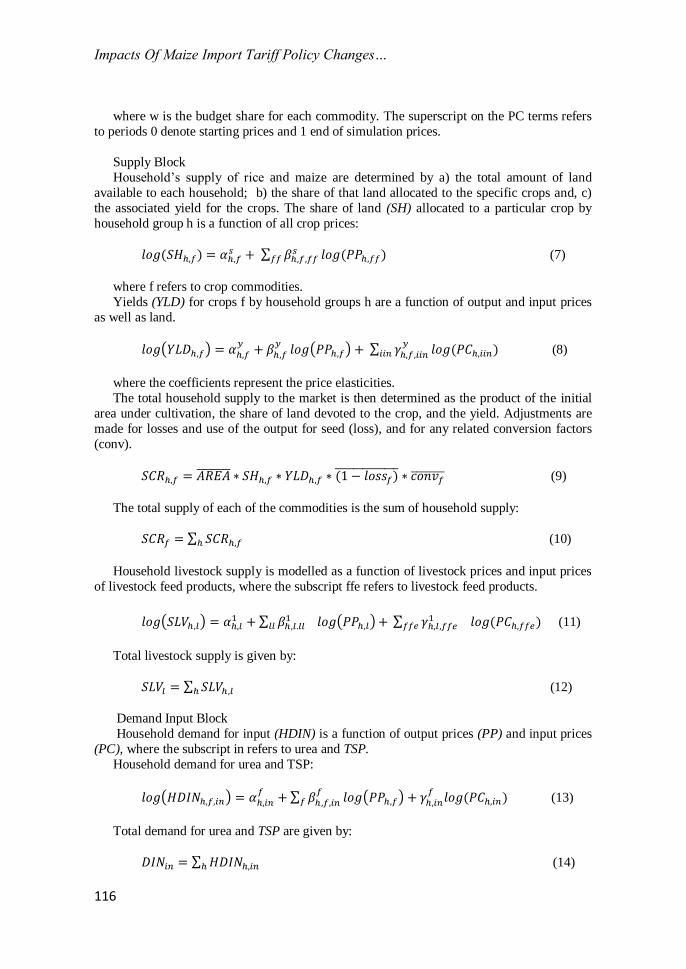
where w is the budget share for each commodity. The superscript on the PC terms refers
to periods 0 denote starting prices and 1 end of simulation prices.
Supply Block
Household’s supply of rice and maize are determined by a) the total amount of land
available to each household; b) the share of that land allocated to the specific crops and, c)
the associated yield for the crops. The share of land (SH) allocated to a particular crop by
household group h is a function of all crop prices:
∑
(7)
where f refers to crop commodities.
Yields (YLD) for crops f by household groups h are a function of output and input prices
as well as land.
( )
( ) ∑
(8)
where the coefficients represent the price elasticities.
The total household supply to the market is then determined as the product of the initial
area under cultivation, the share of land devoted to the crop, and the yield. Adjustments are
made for losses and use of the output for seed (loss), and for any related conversion factors
(conv).
(9)
The total supply of each of the commodities is the sum of household supply:
∑ (10)
Household livestock supply is modelled as a function of livestock prices and input prices
of livestock feed products, where the subscript ffe refers to livestock feed products.
( ) ∑
( ) ∑
(11)
Total livestock supply is given by:
∑ (12)
Demand Input Block
Household demand for input (HDIN) is a function of output prices (PP) and input prices
(PC), where the subscript in refers to urea and TSP.
Household demand for urea and TSP:
( )
∑
( )
(13)
Total demand for urea and TSP are given by:
∑ (14)

S. J. K. Umboh, D. B. Hakim, B. M. Sinaga and I. K. Kariyasa
117
Household demand maize for livestock feed:
( ) ∑
( ) ∑
( ) (15)
Total demand for maize is given by:
∑ (16)
Consumption Block
Demand for the consumption items (HC) by the household groups, where the i refer to
commodities households purchase, i.e. rice, maize, chicken meat, and eggs. YH is household
income, PC are consumer prices.
( ) ∑
( )
(17)
Total consumption is given by :
∑ (18)
Income Block
Agricultural income (YHAG) for rural households is the sum of crop and livestock
revenue minus input costs:
YHAGh=∑f(PPf*SCRh,f)+∑1(PP1*SLVh,1)–(PCin*DINh,in)-(PCfe*DFEh,fe) (19)
and total household income (YH) is the sum of agricultural income and the exogenously
determined non-agricultural income (YHNAG). The latter component is adjusted by a price index and the price index is as defined in equation (6).
(20)
Equilibrium Conditions
All commodity markets clear, i.e. the sum of quantity supplied (domestic production plus
net imports) is equal to the amount demand for human and livestock consumption.
(21)
where M equals imports and CONS and DFE denote human and livestock consumption
respectively.
2.3. Model Simulation
The study was conducted with the aims at analyzing the impact of maize import tariff
policy changes on: (1) the production of food crops and livestock in Indonesia and (ii) the
consumption for rice, maize, chicken meat, and eggs in Indonesia. To answer the purposes of
this study, the following simulations were conducted: (1) an increase 10 percent in the maize
import tariff and (2) elimination of maize import tariff

Impacts Of Maize Import Tariff Policy Changes…
118
3. Results and Discussion
3.1. Production
Maize is a versatile crop being used for direct consumption or as raw material for a
diverse range of industrial products, both food and feed. In the sub-sector of food crop,
maize is the second largest contributor after rice as a carbohydrate source that is instrumental
in supporting food security. Meanwhile, as for its function as the main raw material for feed,
maize still could not be replaced by other agricultural products. This is exactly what causes
the demand for maize continuously increasing along with the increased demand for livestock
products such as meat and eggs.
Most maize cultivations in Indonesia are carried out on dry land. Out of 79 % maize planted area, only around 11 % is in irrigated land and 10 % in rainfed land. However, in last
years, the maize planted area in the irrigated land have increased rapidly since producing
maize in irrigated land relatively easier than that of in rainfed land. This indicates that rice
and maize are quite competitive in land use.
Household farming businesses are not monoculture in nature, they also have other
businesses both agricultural and non-agricultural sectors. There are two indicator as
characteristic of small scale broiler farming, namely farmer landholding and farmer
household income sources. In terms of land holding, the land size owned by farmers is far
lower compared to other agricultural enterprises. The land used for farming business was
only 8.50 percent. Meanwhile, for other activities and non agricultural business were 83.02
percent and 8.48 percent, respectively (BPS-Ditjennak, 2008). The research conducted by Ilham and Yusdja (2010) showed that the land use of small scale broiler farming households
for food crop was 0.455 hectare; in which 52.62 percent for rice, 15.96 percent for maize,
3.27 percent for soybean, and 5.39 percent for cassava, respectively.
The data of rice, maize, chicken meat, and eggs production in three groups of households
shown in Table 1. The small scale households (PTRYT) produced rice, maize, chicken meat,
and eggs of by 2,598.32; 1,107.53; 181.83; and 0.100 (thousands ton), respectively. While
the other households only produced rice, maize and eggs of by 23,240.54; 9,211.81; 1,025.91
(thousands ton), respectively. However, the asummed production on the large scale
households (PRSHN) was focussed only on chicken meat (1,137.12 thousands ton).
Table 1. Household Production of Rice, Maize, Chicken Meat and Eggs in 2011 (000
tons)
Households Commodities
Rice Maize Chicken meat Eggs
PRSHN 0 0 1,137.12 0
PTRYT 2,598.32 1,107.53 181.83 0.100
RTOTH 23,240.54 9,211.81 0 1,025.91
Total 25,838.86 10,319.34 1,318.95 1,026.01
Source: BPS-Ditjennak (2008), Ilham & Yusdja (2010), Directorate General of Livestock
and Animal Health (2012), processed
Result of production (Table 1) based on productivities of rice and maize. Productivity of
rice on range between 4.207 tons/ha and 5.580 tons/ha, while between 3.5 tons/ha and 4.560
tons/ha for maize. From these data, the small scale broiler farming households were
classified at the lowest productivity values of by 4.207 tons/ha for rice and 3.5 tons/ha for
maize, based on assuming that the small scale broiler farming households have managed
their food crop business as by a side line business or not intensivelly. Meanwhile, the other

S. J. K. Umboh, D. B. Hakim, B. M. Sinaga and I. K. Kariyasa
119
households were referred to the highest value of productivity, because in these households
group, they have managed their food crop business intensivelly.
3.2. Consumption
The consumption of the three household groups was classified into 3 groups: urban, rural
and average of urban and rural groups. Based on the consideration of the average expenditure
per capita by category of goods, in which the large scale were referred to the food
consumption of urban people, while the small scale households were referred to the food
consumption of rural people, and other households based on the average consumption of
urban and rural people. The consumption of rice, maize, chicken meat, and eggs in the large scale households (PRSHN) were 37,529; 4,792; 2,326; 1,832 (thousands ton), respectively.
Furthermore, the consumption of rice, maize, chicken meat, and eggs in the small scale
households (PTRYT) were 36,288; 17,870; 1,114; 1,268 (thousands ton), respectively (Table
2).
Table 2 Household Consumption for Rice, Maize, Chicken Meat, and Eggs in 2011
(000 tons)
Households Commodities
Rice Maize Chicken meat Eggs
PRSHN 37,529 4,792 2,326 1,832
PTRYT 36,288 17,870 1,114 1,268
RTOTH 24,715.26 7,918.35 1,133.77 1,024.70
Total 24,789.08 7,941.02 1,137.21 1,027.80
Source: Bureau of Food Security of Ministry of Agriculture (2012), processed
3.3. Impact of Maize Import Tariff Policy Changes on Food Crops Production
The result of this research showed that the policy of maize import tariff changes had an
impact on food crop production in Indonesia as shown in Table 3. Increasing maize import
tariff policy by 10 percent led to decreasing in the volume of maize imported of by 19.77
percent, lowering domestic maize demand, and increasing maize price by 9.523 percent, respectively (Table 3). The rise in maize price caused a decline in the demand for both
consumption and feed by 1.498 (Table 6) and 1.525 percent (Table 4), respectively.
The increase in the price of maize was responded by farmers by increasing the land share
for planting maize of by 3.0 and 3.007 percent by the households of small scale broiler
farming and other households, respectively. In addition, the improvement in the price of
maize led to the use of Urea and TSP fertilizer for maize increased by 5.754 and 5.755
percent, respectively, and triggering improvement in productivity by 2.657 and 2.659 on the
households of small scale and other households, respectively. The increase in the land share
and productivity would cause the increase in national maize production by 5.762 percent.
But, on the other side, on increased use of land for maize has a negative impact on rice
production by 2.4748 percent. This indicated that when there was an increase in the price of maize, farmers would use part of their rice land for planting maize.
Eliminating maize import tariff had an impact on food crop production in Indonesia in
Table 3. It led to the increase in imported maize which amounted by 10.25 percent, and this
certainly encouraged the increase in domestic maize supply and lowered the domestic maize
price from US $ 0.302 to 0.287. Another impact was the increased demand for both
consumption and feed by 0.700 (Table 6) and 0.246 percent (Table 4), respectively.

Impacts Of Maize Import Tariff Policy Changes…
120
Table 3 The Results of Simulation of Maize Import Tariff Changes on Food Crops
Production in Indonesia
Variables
Base
Value
Alternative Simulation
5% Tariff 15% Tariff* 0% Tariff**
(Unit) (Unit) (%) (Unit) (%)
PMm (Imported Maize Price) 2346.40 2569.86 9.523 2234.66 -4.762
PCm,p (Maize Price of PRSHN) 2933.00 3212.33 9.523 2793.33 -4.762
PCm,pr (Maize Price of PTRYT) 3519.60 3854.8 9.523 3352 -4.762
PMrc (Imported Rice Price) 6150.40 0 0 0 0
PCrc (Domestic Rice Price) 7688.00 0 0 0 0
SH1,2 (Rice Land Share of PTRYT) 0.0780 0.0767 -1.538 0.0784 0.4871
SH1,2 (Rice Land Share of RTOTH) 0.5260 0.5173 -1.635 0.5285 0.4828
YLD1,2 (Rice Productivity of
PTRYT)
4.2070 4.1713 -0.8469 4.2172 0.24126
YLD1,2 (Rice Productivity of
RTOTH)
5.5800 5.5327 -0.8467 5.593 0.24133
HSCR1 (Rice Production of
PTRYT)
2598.32 2534.02 -2.4747
2617.178
0.72577
HSCR2 (Rice Production of
RTOTH)
23240.54 22665.36 -2.4749 23409.17
3
0.72560
SCR1,2(Rice Production of
Indonesia)
25838.86 25199.37 -2.4748 26026.35 0.72562
SH3,4 (Maize Land Share of PTRYT)
0.0250 0.02575 3.0 0.0246 -1.44
SH3,4 (Maize Land Share of RTOTH)
0.1596 0.1644 3.007 0.1573 -1.434
YLD3,4 (Maize Productivity of PTRYT)
3.5000 3.5930 2.657 3.4581 -1.19771
YLD3,4 (Maize Productivity of RTOTH)
4.5600 4.6812 2.659 4.5054 -1.19759
HSCR3 (Maize Production of
PTRYT)
1107.53 1171.35 5.7620 1078.56 -2.61573
HSCR4 (Maize Production of
RTOTH)
9211.81 9742.60 5.762 8970.85 -2.61577
SCR3,4 (Maize Production of
Indonesia)
10319.34 10913.95 5.762 10049.41 -2.61576
HDIN1 (Demand for Urea PTRYT) 1.679 1.694 0.893 1.635 -2.620
HDIN2 (Demand for Urea RTOTH) 1049.36 1109.82 5.7619 1021.91 -2.615
DIN1,2 (Demand for Urea
Indonesia)
1051.04 1111.52 5.754 1023.54 -2.616
HDIN3 (Demand forTSP PTRYT) 0.705 0.711 0.851 0.686 -2.695
HDIN4 (Demand for TSP RTOTH) 440.73 466.125 5.762 429.2 -2.616
DIN3,4 (Demand for TSP
Indonesia)
441.43 466.836 5.755 429.9 -2.612
IMrc (Net Import of Rice) 4499.991 4896.17 8.804 4321.992 -3.95
IMm (Net Import of Maize) 3182.356 2553.00 -19.77 3508.592 10.25
Note: * increasing maize import tariff of by 10 percent; ** eliminating maize import tariff
For maize farmers, the reduction in maize price as a result the elimination of maize
import tariff was responded by reducing the land share for planting maize by 1.44 percent for

S. J. K. Umboh, D. B. Hakim, B. M. Sinaga and I. K. Kariyasa
121
small scale broiler farming households and by 1.434 percent for other households,
respectively and followed also by reduction in Urea and TSP fertilizers uses of by 2.616 and
2.612 percent, respectively. Finally, it had impact on maize production declaining of by
2.61576 percent. When the maize price goes down, farmers were more interested in
increasing the area for planting rice as maize competitor. In this condition, planting rice give
more interesting benefit than that of planting maize. This was showed by the increased share
of rice planted land for small scale broiler farming households and other households by
0.4871 and 0.4828 percent, respectively. Therefore, when there was a decline in the maize
price, farmers would divert their maize planted land to rice farming. Finally, at level of
productivity and land share increase, it would lead to the increase in rice production of by
0.72562 percent.
Table 4 The Results of Simulation of Maize Import Tariff Policy Changes on Livestock
Production in Indonesia
Variables
Base
Value
Alternative Simulation
5% Tariff 15% Tariff* 0% Tariff**
(Unit) (Unit) (%) (Unit) (%)
PCbr (Domestic Chicken Meat Price)
27500
27500
0 27500
0
PClr (Domestic Egg Price) 18058 18058 0 18058 0
HSLV1(Chicken Meat Production of
PRSHN)
1137.12
1131.96
-0.453
1139.9
0.245
HSLV2(Chicken Meat Production of
PTRYT)
181.83
181
-0.456
182.27
0.243
SLV1,2 (Chicken Meat Production of
Indonesia)
1318.95
1312.96
-0.4536
1322.17
0.244
HSLV3( Eggs Production of
PTRYT)
0.100
0.0999
-0.8
0.1033
3.30
HSLV4( Eggs Production of RTOTH)
1025.91
1017.09
-0.8591
1028.42
0.245
SLV3,4 ( Eggs Production of Indonesia)
1026.01
1017.19
-0.8590
1028.53
0.246
HDFE1 (Demand for Maize PRSHN) 1066.37
1060.92
-0.511
1068.98
0.244
HDFE2 (Demand Maize for Broiler Feeds PTRYT)
227
226.185
-0.359
227.6
0.264
HDFE3 (Demand Maize for Layer
Feeds PTRYT)
0.127
0.126
-0.787
0.131
3.15
HDFE4 (Demand for Maize
RTOTH)
1292.25
1259.08
-2.567
1295.41
0.244
DFE1,2,3,4 (Demand for Maize
Indonesia)
2585.747
2546.31 -1.525
2592.12
0.246
Note: * increasing maize import tariff of by 10 percent; ** eliminating maize import tariff
3.4. Impact of Maize Import Tariff Policy Changes on Livestock Production
Feed is the biggest part of the cost of production is about 70%, while the share of other
costs such as DOC only 13 percent (Yusdja dan Pasandaran 1998). Feed requirements of
broiler and layer in the period 2005-2010 respectively increased by 6.85 percent and 8.31
percent. In 2010 the need of feed for broiler reached 3.51 million tons and 2.06 million tons

Impacts Of Maize Import Tariff Policy Changes…
122
for layer chicken. This shows the role of feed in the poultry production. Therefore, in the
event of market shocks to the feed industry will greatly affect the performance of broiler and
layer.
The result of research showed that policy changes of maize import tariff affects the
livestock production in Indonesia as shown in Table 4. When the government increased
maize import tariff by 10 percent maize demand either by the large and small scale broiler
farming went down by 0.511 and 0.359 percent, respectively. Consequently, the production
for broiler from those broiler farming decreased by 0.453 and 0.456 percent, respectively.
The same phenomenon also occured in layer business.
In contrast, the elimination of import tariff policy impact on maize caused its price
became lower, led to the increase in maize demand for feed by both the large and small scale broiler farming of by 0.244 and 0.264 percent, respectively. This condition triggered the
increase in production both at large and small scale broiler farming level of by 0.245 and
0.243 percent, respectively, and increased the national production of meat of by 0.244
percent. It also had a positive impact on the improvement of eggs production of by 0.246
percent.
3.5. Impact of Maize Import Tariff Policy Changes on the Household Income
There were some studies on the linkages markets of maize, feed, and chicken meat
conducted using an econometric approach. Kariyasa & Sinaga (2007) conducted a study on
the linkage between maize market, feed, and chicken markets in Indonesia. The linkage was created through the domestic prices of maize, feeds, and chicken meat, as well as through the
world prices of imported maize, imported feed components, and imported chicken meat.
These indicated that price and quantity that occur in a market are not only determined by the
market power itself but also by the power of other markets.
Table 5 The Results of Simulation of Maize Import Tariff Policy Changes on
Households Income in Indonesia (Million Rupiahs)
Variables
Base Value Alternative Simulation
5% Tariff 15% Tariff* 0% Tariff**
(Unit) (Unit) (%) (Unit) (%)
I. Household Income
a. YHAG1 (Income of PRSHN)
21888976 21495146
-1.799
22091783
0.927
b. YHAG2 (Income of PTRYT)
22286608
21828241
-2.057
23366945
4.8
1. Rice 15968858.53 155740057 -2.472 16084756 4.7
2. Maize 3115440.07 3143068 0.887 3033903 -0.726
3. Broiler 3201210.80 3110161 -2.847 3247233 2.617
4. Laying hens 997.65 954.37 -4.338 1052.37 1.434
c. YHAG3 (Income of
RTOTH)
1049290416
1034191127
-1.439
1053088847
5.485
II. Agricultural Sector
Income
1093466000
1077514515
-1.488
1098547575
0.362
III. Non-Agricultural
Sector Income
6448679204
6448679204
0 6448679204
0
IV. National Income 7542145204 7526193719 -0.2115 7547226779 0.067
Note: * increasing maize import tariff of by 10 percent; ** eliminating maize import tariff

S. J. K. Umboh, D. B. Hakim, B. M. Sinaga and I. K. Kariyasa
123
Increasing maize import tariff policy by 10 percent caused an increase in maize prices.
It led to the increase small scale broiler farming income from maize by 0.887 percent, but
decrease small scale broiler farming income from rice farming, broiler, and layer business of
by 2.472, 2.847, and 4.338 percent, respectively. Furthermore, this policy caused the
agricultural sector income (YHAG) and the national income (YH) dropped by 1.488 percent
and 0.2115 percent, respectively.
Table 6 The Results of Simulation of Maize Import Tariff Policy Changes on
Households Consumption in Indonesia
Variables
Base Value
Alternative Simulation
5% Tariff 15% Tariff* 0% Tariff**
(Unit) (Unit) (%) (Unit) (%)
HCY1,2(Consumption for
Rice PRSHN)
37.529
37.614
0.23
37.483
-0.122
HCY1,2(Consumption for
Rice PTRYT)
36.288 36.648
0.99
36.241
-0.130
HCY1,2(Consumption for
Rice RTOTH)
24715.26
24921.26
0.825
24674.84
-0.163
CONS1,2(Consumption for
Rice Indonesia)
24789.08
24995.70
0.826
24748.57
-0.163
HCY3,4(Consumption for
Maize PRSHN)
4.792
4.727
-1.355
4.827
0.734
HCY3,4(Consumption for Maize PTRYT)
17.870
17.603
-1.495
17.999
0.725
HCY3,4(Consumption for Maize RTOTH)
7918.35
7799.73
-1.499
7973.48
0.690
CONS3,4(Consumption for Maize Indonesia)
7941.02
7822.07
-1.498
7996.31
0.700
HCP1,2(Consumption for Chicken Meat PRSHN)
2.326 2.3207
-0.227
2.329
0.122
HCP1,2(Consumption for Chicken
Meat PTRYT)
1.114
1.110
-0.355
1.1152
0.108
HCP1,2(Consumption for Chicken
Meat RTOTH)
1133.77 1129.84
-0.346
1134.42
0.057
CONSP1,2(Consumption for Chicken
Meat Indonesia)
1137.21
1133.28
-0.345
1137.86
0.058
HCP3,4(Consumption for
Eggs PRSHN)
1.832 1.816
-0.86
1.8405
0.465
HCP3,4(Consumption for Eggs PTRYT)
1.268 1.2675
-0.042
1.2737
0.448
HCP3,4(Consumption for Eggs RTOTH)
1024.70
1024.36
-0.033
1028.77
0.397
CONSP3,4(Consumption for Eggs Indonesia
1027.80 1027.47 -0.031 1031.89 0.398
Note: * increasing maize import tariff of by 10 percent; ** eliminating maize import tariff
In contrast, when government issued the elimination policy of maize import tariff
decreased the household income of small scale broiler farming from maize by 0.726 percent
but increased their income from rice farming, broiler business and layer business by 4.7, 2.617, and 1.434 percent, respectively (Table 5). This policy also resulted the increase in

Impacts Of Maize Import Tariff Policy Changes…
124
agricultural income (YHAG) as well as national income (YH) by which amounted to by 0.362
and 0.067 percent, respectively.
3.6. Impact of Maize Import Tariff changes on Households Consumption
Impact of the increasing import tariff on maize of by 10 percent caused an increase in
maize price. As a result of maize price became more expensive, it led to the consumption for
maize by the three households went down by 1.355, 1.495, and 1.499 percent, respectively,
and then decreased the maize national consumption of by 1.498 percent. Furthermore, this
policy also caused the chicken meat consumption dropped 0.227, 0.355, 0.346 percent,
respectively, and lowered the national consumption by 0.345 percent. This same phenomenon also occured in eggs consumption.
On the other hand, when government issued of elimination maize import tariff policy
caused a drop in maize price and then led to the increase in maize consumption in all
household categories. The large scale broiler farming households maize consumption
increased by 0.734 percent, and by 0.725 and 0.690 percent from the small scale broiler
farming households and other households, respectively. It also caused the national
consumption increase by 0.700 percent. The same phenomenon also occured for chicken
meat and eggs consumption. Chicken meat consumption by the large and small scale broiler
farming and other households were increasing by 0.122, 0.108, 0.057, respectively.
Consequently, the national consumption for this kind of meat also increased by 0.058
percent. This policy also resulted the increase in consumption for eggs of by 0.465, 0.448, 0.397, respectively in those three households. As a whole this policy brought the national
consumption for eggs increased by 0.398 percent.
4. Conclusion
Elimination maize import tariff policy caused imported maize increase due and its price
became cheeper. This policy made the domestic supply of this commodity increased. On the
other hand, less attractive of maize price was responded by farmers through reducing maize
planted land and fertilizer input uses. The change of this farmer’s decision caused production
of maize and income from maize farming decline. In addition, this policy that caused maize
price to be lower would have positive impact on maize demand for both consumption and
feed industry. A side from that, this policy also led to the increase in consumption for both chicken meat and eggs on all household categories, as well as national consumption.
References
Arulpragasam, J., Conway, P. J. (2003). Partial Equilibrium Multi-market Analysis Chapter
12 in F. Bourguignon and L.A Pereira da Silva (Eds.) The Impact of Economic Policies
on Poverty and Income Distribution: Evaluation Techniques and Tools, Washington,
D.C.: World Bank and Oxford University Press.
Bureau of Food Security of Ministry of Agriculture. (2012). Development of Food
Consumption Directory. Bureau of Food Security of Ministry of Agriculture, Jakarta.
[BPS]-[Ditjennak]. (2008). National Household Survey. Cooperation Central Bureau of Statistics and Directorate General of Livestock, Jakarta.
Braverman, A., & Hammer, J. S. (1986). “Multimarket Analysis of Agricultural Pricing
Policies in Senegal”. In Singh, I., L. Squire & J. Strauss (Eds.), Agricultural Household
Models: Extensions, Applications, and Policy, Chapter 8, Baltimore, MD.: The Johns
Hopkins University Press.

S. J. K. Umboh, D. B. Hakim, B. M. Sinaga and I. K. Kariyasa
125
Directorate General of Livestock and Animal Health. (2012). Livestock and Animal Health
Statistics. Directorate General of Livestock and Animal Health, Jakarta.
Destiana, M. (2010). National Feed Industry Prospects. Economic Review, 219,1-10.
www.bni.co.id [21 Agustus 2011].
Dorosh, P., del Ninno, C., & Sahn, D. E. (1995). Poverty alleviation in Mozambique: a
Multimarket Analysis of the Role of Food Aid. Agricultural Economics, 13, 89-99.
Food and Agricultural Organization [FAO]. (2011). FAO Trade Yearbook. Food and
Agricultural Organization, Roma.
Goletti, F., & Rich, K. (1998). Analysis of Policy Options for Income Growth and Poverty
Alleviation. Report prepared for the USAID project on Structure and Conduct of Major
Agricultural Input and Output Markets and Response to Reforms by Rural Households in Madagascar. Washington, D.C.
Ilham, N., & Yusdja, Y. (2010). Impact of Avian Influenza on Production and Contribution
of Poultry to Small Scale Farmers Income in Indonesia. Agro Ekonomi Journal, 28, 39-
68.
Kariyasa, I., & Sinaga, B.M. (2007). Feed and Chicken Meat Markets Behaviour Analysis in
Indonesia: Simultaneous Econometric Model Approach. Socio-Economic of Agriculture
and Agribusiness (SOCA), 7, 158-166.
Lundberg, M., & Rich, K. (2002). Multimarket Models and Policy Analysis: An Application
to Madagascar. Development Economics Research Group/Poverty Reduction Group,
Environment and Infrastructure Team, mimeo, World Bank. Washington, D.C.
Sadoulet , E., de Janvry, A. (1995). Quantitative Development Policy Analysis. Baltimore, MD. The Johns Hopkins University Press.
Sayaka, B., Sumaryanto, S., Croppenstedt, A., & DiGiuseppe, S. (2007). An Assessment of
The Impact of Rice Tariff Policy in Indonesia: A Multi-Market Approach. ESA Working
Paper No 07-18, Agricultural Development Economics Division, Food and Agriculture
Organization of The United Nations, Rome, Italy.
Stifel, D., & Randrianarisoa, J.C. (2004). Rice Prices, Agricultural Input Subsidies,
Transactions Costs and Seasonality: A Multi-Market Model Poverty and Social Impact
Analysis (PSIA) for Madagascar. Academic Papers: World Bank.
Sugema, I., & Roy, D. (2010). The Impact of Avian Influenza (AI) on Indonesian Economy:
A Multi-market Model Analysis, Bogor.
Yusdja, Y., & Pasandaran, E. (1998). Restructurization Direction of Indonesia Poultry
Agribusiness. Agro Ekonomi, 16, 21-32.

Impacts Of Maize Import Tariff Policy Changes…
126


![T2 KIPO rev2 [互換モード]...Capital Intensive Industries Innovation Capability Importation of Technology of Domestic R&D Activity ... Global Work-Sharing & Cooperation ... in](https://img.dokumen.tips/doc/110x75/6078b63f77a1886cf5274fa5/t2-kipo-rev2-fff-capital-intensive-industries-innovation-capability.jpg)