Embed Size (px)
Citation preview

1
Measuring the Impact of IXL Math and IXL Language Arts in Texas Schools
This study was peer reviewed and presented at the 2019 Annual Meeting of the American Educational Research Association in Toronto, Canada.
Previous research has shown that the use of IXL can have significant impact on student achievement for an individual school (Empirical Education, 2013). In this study, we explored IXL usage across the entire state of Texas. Examining such a large sample of schools allows us to quantify the impact of IXL Math and IXL English Language Arts (ELA) on school performance as measured by the Texas state exams.
This study investigated thousands of public schools in Texas that used IXL Math or IXL ELA between 2014 and 2017. Using data from the 2017 State of Texas Assessments of Academic Readiness (STAAR) exams, researchers examined academic achievement in both IXL schools and non-IXL schools. Scores from the 2014 STAAR program were used to control for schools’ achievement prior to using IXL. IXL usage by the schools in this study ranged from less than one minute per student, per week, to over 100 minutes per student, per week. Even with the wide range in usage, our researchers found a strong positive correlation between IXL usage and school performance. These results are statistically significant.
Texas schools using IXL outperformed schools without IXL in math (grades 3-8), reading (grades 3-8), and writing (grades 4 and 71). Schools that used IXL for two or three school years performed better than schools that used IXL for only one school year.
Introduction
Peer Review
Abstract
Key Findings
The IXL Effect
1 The STAAR exam for writing is only administered in grades 4 and 7, so the IXL effect was calculated just for these two grades.

The IXL Effect
2
Practice makes perfect. If every student achieved a SmartScore2 of 70 or above on one additional skill per week, the school’s proficiency rate would increase by 5.09 points in math and 8.48 points in reading. If every student mastered one additional skill per week, the school’s proficiency rate would increase by 7.40 points in math and 12.86 points in reading.
Elementary and middle schools using both IXL Math and IXL ELA received better accountability ratings (i.e., showed higher achievement, made more progress, were more successful in closing achievement gaps, and did better in advancing student postsecondary readiness) than similar schools using just one IXL subject or not using IXL.
2 SmartScore is a score ranging from 0 to 100 that measures how well a student understands a skill. This proprietary IXL score is calculated based on a number of metrics, including percentage of questions correct, question difficulty, and consistency.

The IXL Effect
3
Our researchers wanted to determine the effect of IXL on student achievement at the school level, as measured by the percentage of students in the school meeting proficiency goals set by the state of Texas. To do this, we looked at state test results for schools before and after implementing IXL. We used schools not implementing IXL as a control. This study used a pretest-posttest control group design to measure the impact of IXL. This type of study design evaluates the treatment effect by comparing the performance of the treatment group and the control group on the posttest, after adjusting for their performance on the pretest (see Figure 1). The treatment group included schools that started using IXL in the 2014-15, 2015-16, or 2016-17 school years (called “IXL schools”). The control group consisted of schools that did not use IXL in the 2014-15, 2015-16, or 2016-17 school years (called “non-IXL schools”).
Study Design
JANUARY 5, 2018
The IXL Effect in Texas Schools
The State of Texas Assessments of Academic Readiness (STAAR) program was used as the pretest and the posttest for this study. STAAR is designed to measure the extent to which students have learned and are able to apply the knowledge and skills defined in the state-mandated curriculum standards. Students in grades 3-8 are tested in mathematics and reading. Students in grades 4 and 7 are also tested in writing.
The Texas Education Agency provides annual academic accountability ratings to evaluate all public schools in Texas. Nearly all schools receive one of two ratings: Met Standard or Improvement Required. The ratings are calculated based on four performance indices: Student Achievement (Index 1), Student Progress (Index 2), Closing Performance Gaps (Index 3), and Postsecondary Readiness (Index 4). Index 1, Student Achievement, provides a snapshot of STAAR performance across subjects. Index 2, Student Progress, measures year-to-year student progress. Index 3, Closing Performance Gaps, emphasizes the academic achievement of economically disadvantaged students and the two lowest-
Figure 1. Pretest-Posttest Control Group Design
Not using IXL
Not using IXL
Treatment:Start using IXL
Pretest:2014 STAAR Program
Pretest:2017 STAAR Program
2013-14SCHOOL YEAR
2014-15, 2015-16,and 2016-17SCHOOL YEARS
2014SPRING
2017SPRING
TREATMENT GROUP:IXL SCHOOLS
CONTROL GROUP:NON-IXL SCHOOLS

The IXL Effect
4
performing racial/ethnic student groups. Index 4, Postsecondary Readiness, emphasizes the importance of earning a high school diploma that provides students with the foundation necessary for success in college, job training programs, the workforce, or the military. These accountability ratings provide a roadmap to help educators, parents, and community members understand their school’s performance.
The study analyzed data from 6,516 Texas public schools, including both traditional public schools and charter schools. A total of 1,539 public schools used IXL Math and/or IXL ELA between 2014 and 2017. As the number of students who practiced on IXL within a school ranged from a single classroom to the entire school, this study defined a school as an “IXL school” at each grade level rather than at a school level. A school is identified as an IXL school at a certain grade level if at least 70 percent of the students enrolled in this grade level practiced on IXL (see Appendix A for details on school selection and classification). Based on this criteria, 734 grade level cohorts from 365 schools were identified as IXL schools for IXL Math and 361 grade level cohorts from 206 schools were identified as IXL schools for IXL ELA. Appendix B shows the characteristics of IXL schools and the Texas state averages. The school performance and enrollment data were obtained from the Texas Education Agency and the Institute of Education Science.
Our researchers used multilevel linear models to calculate the IXL effect—i.e., the performance difference between IXL schools and non-IXL schools on the 2017 STAAR, controlling for factors such as prior performance, school size, percentage of students with limited English proficiency, percentage of students in special education, and school location. Similar multilevel linear models were applied to low-income schools (i.e., schools with an above-average percentage of economically disadvantaged students3) and low-performing schools (i.e., schools that performed below the state average on the 2014 STAAR program) to calculate the IXL effect for these two types of schools. We used a different set of multilevel linear models to evaluate the IXL effect on schools’ 2017 accountability ratings. Another set of multilevel linear models was applied to estimate the strength of association between IXL usage and school performance, and to compare the performance difference between IXL schools with different amounts of IXL usage (i.e., fewer than or at least 15 questions answered per student per week). (See Appendix C for a detailed explanation of analytical methods.)
This form of analysis allowed us to answer four key questions:1. What is the IXL effect on student achievement for IXL schools? In other words, did IXL
schools perform better on the 2017 STAAR than non-IXL schools?2. What is the IXL effect for low-income schools and low-performing schools? 3. Did IXL schools received higher accountability ratings than non-IXL schools?4. What is the association between IXL usage and school performance?
Methodology
3 For Texas public schools, the average percentage of economically disadvantaged students is 59 percent.

The IXL Effect
5
The Efficacy of IXL Math
Figure 2. The Effect of IXL Math on the 2017 STAAR Math
Results
4 Adjusted percent met or mastered grade level: the percentage of students who received a performance level of “meets or masters grade level” after adjusting for differences in prior performance and school characteristics between IXL schools and non-IXL schools.
Analysis of the data showed that the use of IXL had positive and statistically significant effects on school performance in math, reading, and writing, indicating there is a high probability that similar schools using IXL would achieve similar results. A positive and statistically significant IXL effect was also found in low-income schools and low-performing schools. The IXL effect on school accountability ratings was larger when schools used both IXL Math and IXL ELA as opposed to just one IXL subject. Our analysis also showed a positive correlation between IXL usage and school performance. In particular, on the 2017 STAAR, IXL schools with at least 15 questions answered per student per week outperformed IXL schools with fewer questions answered. One additional skill mastered per student, per week, was associated with an expected 7.40 percent increase on a school’s percent proficient in math and a 12.86 percent increase in ELA.
The implementation of IXL Math showed a statistically significant effect on schools’ performance on the 2017 STAAR math tests across grades 3 through 8 (see Appendix D, Table D1 for details).
Figure 2 shows that the adjusted percent of students that met or mastered grade level4 was 40.69 for non-IXL schools, 41.82 for 1-year IXL schools, 43.15 for 2-year IXL schools, and 45.92 for 3-year IXL schools. The effect of IXL Math is not statistically significant for 1-year IXL schools, but it is statistically significant for 2-year and 3-year IXL schools. For 2-year IXL schools, the 2.46 percent difference corresponds to a percentile gain of 5 points in school ranking. For 3-year IXL schools, the 5.23 percent difference corresponds to a percentile gain of 11 points in school ranking. That is, if an average non-IXL school (at the 50th percentile) had used IXL Math for three school years from 2014 to 2017, the percent of students that meet or master grade level would be expected to increase 5.23 percent, putting the school at the 61st percentile.

The IXL Effect
6Figure 4. The Effect of IXL ELA on the 2017 STAAR Reading
Figure 3 shows the effect of IXL Math on low-income schools and low-performing schools. For low-income schools, the IXL effect is 1.62 points and corresponds to a 4 point percentile gain. For low-performing schools, the IXL effect is 2.37 points and corresponds to a 7 point percentile gain. Note that the 50th percentile in Figure 3 refers to the 50th percentile among low-income schools or low-performing schools.
The implementation of IXL ELA showed a statistically significant effect on schools’ performance on the 2017 STAAR reading tests across grades 3 through 8 (see Appendix D, Table D2 for details).
Figure 4 shows that the adjusted percent of students that met or mastered grade level was 39.74 for non-IXL schools, 39.84 for 1-year IXL schools, 43.50 for 2-year IXL schools, and 47.00 for 3-year IXL schools. The effect of IXL ELA is not statistically significant for 1-year IXL schools, but it is statistically significant for 2-year and 3-year IXL schools. For 2-year IXL schools, the 3.76 percent difference corresponds to a percentile gain of 9 points in school ranking. For 3-year IXL schools, the 7.26 percent difference corresponds to a percentile gain of 17 points in school ranking. That is, if an average non-IXL school (at the 50th percentile) had used IXL ELA for three school years from 2014 to 2017, the percent of students that meet or master grade level in reading would be expected to increase 7.26 percent, putting the school at the 67th percentile.
The Efficacy of IXL ELA on
Reading
Figure 3. The Effect of IXL Math for Low-Income Schools and Low-Performing Schools

The IXL Effect
7
The Efficacy of IXL ELA on
Writing
Figure 5 shows the effect of IXL ELA on reading for low-income schools and low-performing schools. For low-income schools, the IXL effect is 2.10 points and corresponds to a 7 point percentile gain. For low-performing schools, the IXL effect is 1.99 points and also corresponds to a 7 point percentile gain.
The implementation of IXL ELA showed a statistically significant effect on schools’ performance on the 2017 STAAR writing tests for grades 4 and 7 (see Appendix D, Table D3 for details).
Figure 6 shows that the adjusted percent of students that met or mastered grade level was 31.09 for non-IXL schools, 33.80 for 1-year IXL schools, and 34.55 for 2-year and 3-year IXL schools. For 1-year IXL schools, the 2.71 percent difference corresponds to a percentile gain of 7 points in school ranking. For 2-year and 3-year IXL schools, the 3.46 percent difference corresponds to a percentile gain of 8 points in school ranking. Although the effect of IXL ELA is not statistically significant for 2-year and 3-year IXL schools, the results still suggest a positive correlation between IXL implementation and students’ writing performance.
Figure 5. The Effect of IXL ELA on Reading for Low-Income Schools and Low-Performing Schools
Figure 6. The Effect of IXL ELA on the 2017 STAAR Writing

The IXL Effect
8
The Efficacy of Using One IXL
Subject versus Two IXL Subjects
Figure 7 shows the effect of IXL ELA on writing for low-income schools and low-performing schools. For low-income schools, the IXL effect is 3.97 points and corresponds to a 12 point percentile gain. For low-performing schools, the IXL effect is 2.62 points and corresponds to a 10 point percentile gain.
Figures 8 and 9 show the effect of using one IXL subject (i.e., IXL Math or ELA) versus two IXL subjects (IXL Math and ELA) on schools’ accountability ratings at the elementary and middle school levels (see Appendix D, Table D4 for details).
As shown in Figure 8, for non-IXL schools, the percentage of schools that earned a rating of Met Standard increased from 91 percent in 2014 to 95 percent in 2017. For IXL schools that used one IXL subject, 86 percent of schools received a Met Standard rating in 2014 before they started using IXL. After implementing one IXL subject, the percentage increased to 96 percent in 2017. For IXL schools that used two IXL subjects, the percentage of schools with a Met Standard rating increased from 98 percent in 2014 to 100 percent in 2017.
Figure 7. The Effect of IXL ELA on Writing for Low-Income Schools and Low-Performing Schools
Figure 8. The IXL Effect on School Accountability Ratings

The IXL Effect
9
Figure 9 shows the IXL effect on the four performance indices that are used to calculate the 2017 accountability ratings. For Index 1, Student Achievement, the IXL effect is 0.45 for IXL schools that used one IXL subject and 2.64 for IXL schools that used two IXL subjects. The effect for 2-subject IXL schools is statistically significant and corresponds to a 9 point percentile gain. For Index 2, Student Progress, the IXL effect is 0.60 for IXL schools that used one IXL subject and 1.32 for IXL schools that used two IXL subjects. The effect for 2-subject IXL schools corresponds to a 7 point percentile gain. For Index 3, Closing Performance Gaps, the IXL effect is 0.45 for IXL schools that used one IXL subject and 2.42 for IXL schools that used two IXL subjects. The effect for 2-subject IXL schools is statistically significant and corresponds to a 10 point percentile gain. For Index 4, Postsecondary Readiness, the IXL effect is 1.38 for IXL schools that used one IXL subject and 3.57 for IXL schools that used two IXL subjects. The effect for 2-subject IXL schools is statistically significant and corresponds to an 8 point percentile gain.
Figure 9. The IXL Effect on Performance Indices 1, 2, 3, and 4
The IXL Effect
10
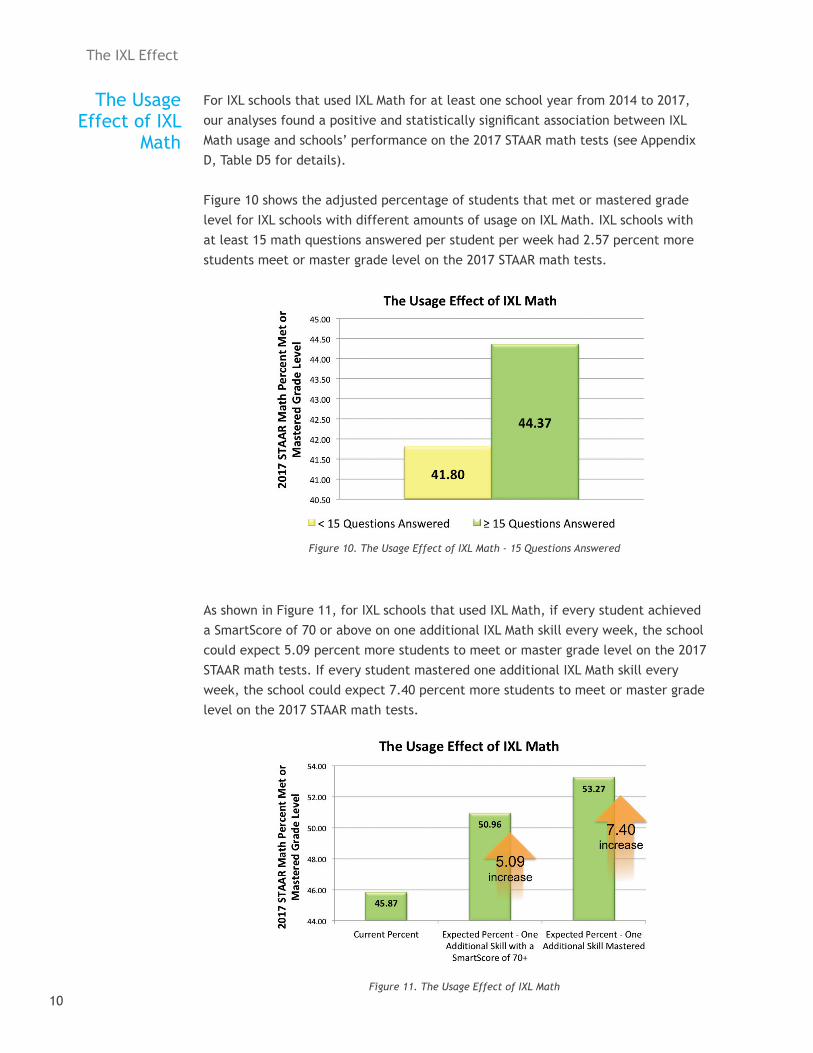
As shown in Figure 11, for IXL schools that used IXL Math, if every student achieved a SmartScore of 70 or above on one additional IXL Math skill every week, the school could expect 5.09 percent more students to meet or master grade level on the 2017 STAAR math tests. If every student mastered one additional IXL Math skill every week, the school could expect 7.40 percent more students to meet or master grade level on the 2017 STAAR math tests.
Figure 10. The Usage Effect of IXL Math - 15 Questions Answered
Figure 11. The Usage Effect of IXL Math
The Usage Effect of IXL
Math
For IXL schools that used IXL Math for at least one school year from 2014 to 2017, our analyses found a positive and statistically significant association between IXL Math usage and schools’ performance on the 2017 STAAR math tests (see Appendix D, Table D5 for details).
Figure 10 shows the adjusted percentage of students that met or mastered grade level for IXL schools with different amounts of usage on IXL Math. IXL schools with at least 15 math questions answered per student per week had 2.57 percent more students meet or master grade level on the 2017 STAAR math tests.

The IXL Effect
11
As shown in Figure 13, for IXL schools that used IXL ELA, if every student achieved a SmartScore of 70 or above on one additional IXL ELA skill every week, the school could expect 8.48 percent more students to meet or master grade level on the 2017 STAAR reading tests. If every student mastered one additional IXL ELA skill every week, the school could expect 12.86 percent more students to meet or master grade level on the 2017 STAAR reading tests.
Figure 12. The Usage Effect of IXL ELA - 15 Questions Answered
Figure 13. The Usage Effect of IXL ELA
The Usage Effect of IXL
ELA
For IXL schools that used IXL ELA for at least one school year from 2014 to 2017, our analyses also found a positive and statistically significant association between IXL ELA usage and schools’ performance on the 2017 STAAR reading tests (see Appendix D, Table D5 for details).
Figure 12 shows the adjusted percentage of students that met or mastered grade level for IXL schools with different amounts of usage on IXL Math. IXL schools with at least 15 ELA questions answered per student per week had 3.74 percent more students meet or master grade level on the 2017 STAAR reading tests.

The IXL Effect
12
Empirical Education (2013). A Study of Student Achievement, Teacher Perceptions, and IXL Math. Retrieved from https://www.ixl.com/research/IXL-Research-Study-2013.pdf What Works Clearinghouse (2014). What Works Clearinghouse procedures and standards handbook (Version 3.0). Retrieved from http://ies.ed.gov/ncee/wwc/pdf/reference_ resources/wwc_procedures_v3_0_standards_handbook.pdf
This study determined whether a school is an IXL school based only on the number of students using IXL. Because a school may choose to use IXL only in a few classrooms or across the entire school, this study defined schools as IXL schools at each testing grade level5 rather than at a school level. The group of students at the same grade level within the same school is referred to as a grade level cohort.
During a certain school year, for a certain grade level cohort within a school, the school is identified as an IXL school for this grade level if: 1) the school has an active IXL account within this school year, and 2) at least 70 percent of the enrolled students at this grade level have practiced on IXL within the school year.
During a certain school year, for a certain grade level cohort within a school, the school is identified as a non-IXL school for this grade level if no students at this grade level have practiced on IXL within the school year.
For example, suppose that a K-6 school had an active IXL account within the 2015-16 school year and over 70 percent of students in grades K-4 had practiced on IXL, while less than 70 percent of students in grades 5 and 6 practiced on IXL during the school year. This school would be defined as an IXL school for the 3rd and 4th grade level cohorts and as a non-IXL school for the 5th and 6th grade level cohorts. Students in grades K-2 are excluded from the analysis because they do not take the state standardized tests.
References
Appendix A: IXL School
Identification
5 Testing grade level: a grade level in which students are required to take the state standardized tests.

The IXL Effect
13
State average
IXL schools
IXLMath
IXLELA
Number of schools 6,516 365 206
Number of grade level cohorts 17,717 734 361
2014 STAAR math percent proficient 74% 75% -
2017 STAAR math percent proficient 44% 46% -
2014 STAAR reading percent proficient 77% - 78%
2017 STAAR reading percent proficient 43% - 45%
% of economically disadvantaged students
59% 59% 60%
% of students with limited English proficiency
19% 19% 16%
% of students in special education 9% 8% 9%
% of schools in cities 38% 30% 28%
% of schools in suburbs 25% 20% 17%
% of schools in towns 13% 15% 13%
% of schools in rural areas 24% 35% 42%
Table B1. Background Information for Texas and IXL Schools
Appendix B: Schools’
Background Information
Table B1 shows the background information for all public schools in Texas and for IXL schools. IXL schools performed slightly better than the state average on the STAAR math and reading tests in 2014 and 2017. IXL schools had fewer schools located in cities and suburbs compared to the state average.

The IXL Effect
14
Appendix C: Analytical
Methods
A three-level linear model was used to calculate the IXL effect on STAAR performance (i.e., the performance difference between IXL schools and non-IXL schools on the 2017 STAAR), after adjusting for schools’ prior academic performance (i.e., 2014 STAAR percent met or mastered grade level), cohort size (i.e., the number of enrolled students in the grade level cohort), percentage of students with limited English proficiency, percentage of students served by special education, and school location (i.e., city, suburb, town, or rural as defined by the Institute of Education Science). The units of analysis of the three-level model are grade level cohorts (i.e., level 1). Grade level cohorts are nested within schools (i.e., level 2), which are further nested within districts (i.e., level 3). Similar multilevel linear models were applied to the low-income grade level cohorts only (i.e., cohorts with at least 59 percent economically disadvantaged students) and low-performing grade level cohorts only (i.e., cohorts that performed below the state average on the 2014 STAAR program) to calculate the IXL effect on these two types of schools separately. To assist in the interpretation of the IXL effect, we reported statistical significance, effect size, and percentile gain. Statistical significance, also referred to as p-value, is the probability that the IXL effect is zero. A small p-value (e.g., less than 0.05) indicates strong evidence that the IXL effect is not zero. Effect size is the mean difference in standard deviation units and is known as Hedges’ g. In this study, effect size is computed using adjusted mean and unadjusted standard deviations. Percentile gain is the expected change in percentile rank for an average non-IXL school if the school had used IXL. It is calculated based on the effect size. More details about these analytical methods can be found in What Works Clearinghouse (2014).
A different set of three-level linear models was used to calculate the IXL effect on accountability ratings (i.e., the difference between IXL schools and non-IXL schools on the 2017 performance indices 1, 2, 3, and 4), after adjusting for schools’ prior index value (i.e., 2014 index value), school size (i.e., the number of enrolled students at the school), percentage of students with limited English proficiency, percentage of students served by special education, and school location.The units of analysis of this three-level model are schools (i.e., level 1). Schools are nested within districts (i.e., level 2), which are further nested within regions (i.e., level 3). We also reported statistical significance, effect size, and percentile gain to assist in the interpretation.
We applied another set of three-level linear models to compare the performance difference between IXL schools with different amounts of IXL usage (i.e., fewer than or at least 15 questions answered per student per week). These models were very similar to the first model described in this appendix, but these models included the IXL usage group (i.e., fewer than or at least 15 questions answered) as an independent variable, and the sample only included IXL schools.
The IXL Effect
15
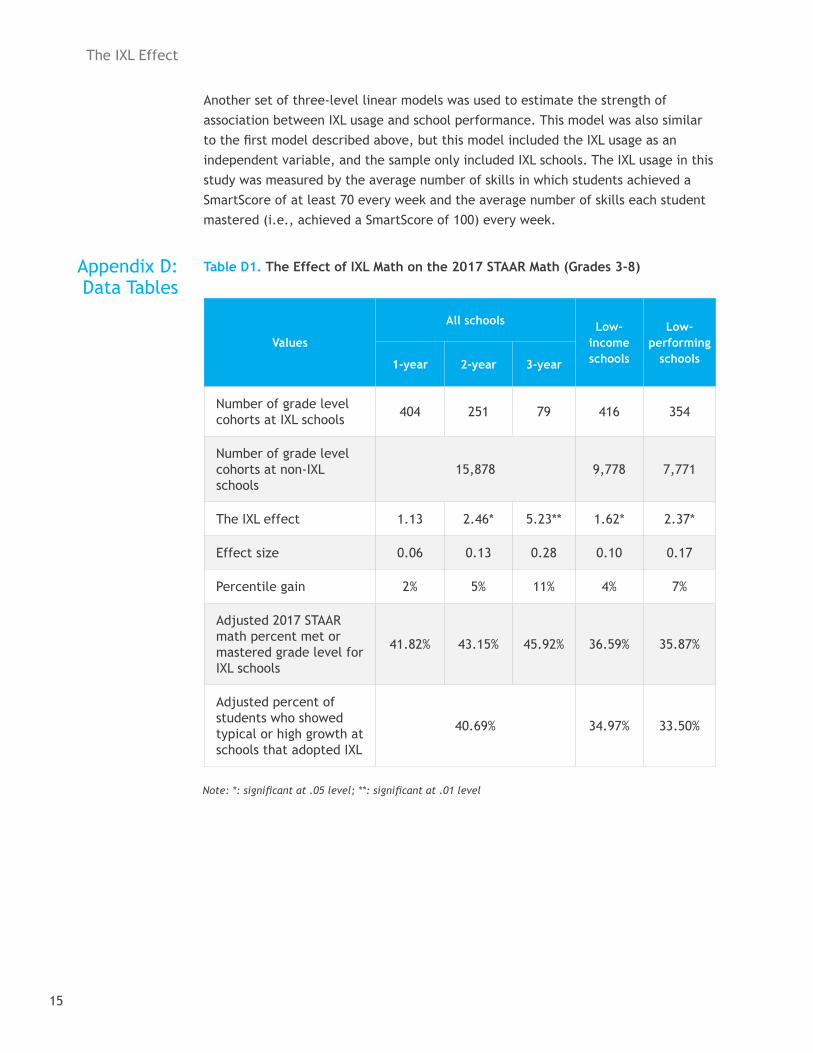
Another set of three-level linear models was used to estimate the strength of association between IXL usage and school performance. This model was also similar to the first model described above, but this model included the IXL usage as an independent variable, and the sample only included IXL schools. The IXL usage in this study was measured by the average number of skills in which students achieved a SmartScore of at least 70 every week and the average number of skills each student mastered (i.e., achieved a SmartScore of 100) every week.
Table D1. The Effect of IXL Math on the 2017 STAAR Math (Grades 3-8)Appendix D: Data Tables
Note: *: significant at .05 level; **: significant at .01 level
Values
All schools Low-income schools
Low-performing
schools1-year 2-year 3-year
Number of grade level cohorts at IXL schools 404 251 79 416 354
Number of grade level cohorts at non-IXL schools
15,878 9,778 7,771
The IXL effect 1.13 2.46* 5.23** 1.62* 2.37*
Effect size 0.06 0.13 0.28 0.10 0.17
Percentile gain 2% 5% 11% 4% 7%
Adjusted 2017 STAAR math percent met or mastered grade level for IXL schools
41.82% 43.15% 45.92% 36.59% 35.87%
Adjusted percent of students who showed typical or high growth at schools that adopted IXL
40.69% 34.97% 33.50%

The IXL Effect
16
Table D2. The Effect of IXL ELA on the 2017 STAAR Reading (Grades 3-8)
ValuesAll schools Low-
income schools
Low-performing
schools1-year 2-year 3-year
Number of grade level cohorts at IXL schools 270 75 16 207 154
Number of grade level cohorts at non-IXL schools
16,823 10,268 8,091
The IXL effect 0.10 3.76** 7.26** 2.10* 1.99
Effect size 0.01 0.22 0.43 0.17 0.18
Percentile gain 0% 9% 17% 7% 7%
Adjusted 2017 STAAR reading percent met or mastered grade level for IXL schools
39.84% 43.50% 47.00% 35.00% 33.64%
Adjusted 2017 STAAR reading percent met or mastered grade level for non-IXL schools
39.74% 32.90% 31.65%
Note: *: significant at .05 level; **: significant at .01 level

The IXL Effect
17
Table D3. The Effect of IXL ELA on the 2017 STAAR Writing (Grades 4 and 7)
Values
All schools Low- income schools
Low-performing
schools1-year 2- or 3-year
Number of grade level cohorts at IXL schools 107 142 85 74
Number of grade level cohorts at non-IXL schools 5,623 3,438 2,683
The IXL effect 2.71* 3.46 3.97* 2.62*
Effect size 0.17 0.21 0.31 0.26
Percentile gain 7% 8% 12% 10%
Adjusted 2017 STAAR writing percent met or mastered grade level for IXL schools
33.80% 34.55% 28.73% 25.75%
Adjusted 2017 STAAR writing percent met or mastered grade level for non-IXL schools
31.09% 24.76% 23.13%
Note: *: significant at .05 level; **: significant at .01 level

The IXL Effect
18
Table D4. The Effect of IXL on the 2017 Accountability Ratings (Grades 3–8)
Table D5. The Usage Effect of IXL Math and ELA
ValuesIndex 1 Index 2 Index 3 Index 4
1S 2S 1S 2S 1S 2S 1S 2S
Number of IXL schools 148 40 130 32 146 39 146 40
Number of non-IXL schools 5,355 4,936 5,329 5,322
The IXL effect 0.45 2.64* 0.60 1.32 0.45 2.42* 1.38 3.57*
Effect size 0.04 0.22 0.08 0.17 0.05 0.25 0.08 0.20
Percentile gain 1% 9% 3% 7% 2% 10% 3% 8%
Adjusted 2017 index value for IXL schools
74.16 76.35 42.69 43.41 41.64 43.61 44.16 46.35
Adjusted 2017 index value for non-IXL schools
73.71 42.09 41.19 42.78
Values IXL schools - IXL Math
IXL schools - IXL ELA
Number of grade level cohorts with at least 15 questions answered per student per week 581 228
Number of grade level cohorts with fewer than 15 questions answered per student per week 184 166
Usage effect 2.57* 3.74**
Effect size 0.13 0.22
Adjusted 2017 STAAR percent met or mastered grade level for IXL schools with at least 15 questions answered per student per week
44.37% 44.68%
Adjusted 2017 STAAR percent met or mastered grade level for IXL schools with fewer than 15 questions answered per student per week
41.80% 40.94%
Note: 1) 1S: 1-subject; 2S: 2-subject. 2) *: significant at .05 level
Note: *: significant at .05 level; **: significant at .01 level.