Embed Size (px)
Citation preview

Impact of Institutional Quality and Governance on
Tax-GDP Ratio: A Cross Country Analysis Shahzad Hussain,
∗ Naveed Ilahi,
∗∗ and Muhammad Muqeem ul Islam
∗∗∗
Abstract This endeavour intends to examine the impact of institutional quality
and governance indicators on tax to GDP ratio utilising cross country
empirical analysis. Generally, amount of tax revenue collection is
considered a pure economic phenomenon related to level of economic
activity in a certain country. This paper deviates from this common
perception. Hence it utilises new institutionalists’ stance that
governance and institutional quality are major determinants of
economic and government efficiency in a country consequently revenue
collection too. It also focuses the examination of efficiency and
effectiveness impacts of tax administrations in order to achieve
enhanced revenue collection targets. In the wake of measuring impact
of governance and institutional quality, six World Bank governance
indicators namely corruption, political stability, rule of law,
government effectiveness, regulatory authority, and voice and
accountability have been regressed with tax to GDP ratio as
dependant variable. Panel data is used for a span of six years.
Inclusion of population, economic growth rate, imports as percent of
GDP and exports as percent of GDP as control variables are used to
test robustness of the model. A stratified random sample of thirteen
developing and thirteen developed countries tests the validity of the
model. Empirical analysis suggests a positive relationship between tax
to GDP ratio and the above mentioned six governance indicators. It
provides empirical evidence that by improving governance in areas like
political stability, corruption, regulatory effectiveness, voice and
accountability likely to provide more robust policy options for
enhancing revenue collection rather increasing tax rates and tax base.
The paper also presents comprehensive set of policy options based on
empirical results and literature on the subject for policy practitioners.
Keywords: Institutional Quality, Governance, Tax-GDP Ratio, Cross
Country Analysis
∗ Dr. Shahzad Husain, Assistant Professor, Dept. of Govt and Public Policy,
National Defence University, Islamabad ∗∗
Naveed Ilahi, Additional Commissioner, Internal Revenue Service of
Government of Pakistan, Islamabad ∗∗∗
Muhammad Muqeem ul Islam, Additional Director (Public Policy), National
School of Public Policy, Peshawar

Impact of Institutional Quality and Governance… Shahzad, Naveed & Muqeem
Journal of Managerial Sciences Volume X Number 2 184
Introduction
An efficient administration is necessary to increase revenue collection.
In developing countries, the major reasons for low tax-GDP ratio are
mismatch between sectoral shares in taxes and GDP, narrow tax base and
poor compliance by taxpayers. Too many exemptions hamper the smooth
implementation of legal frame work. Presence of large underground
economy and informal sector is largely attributable to documentation
problem. Leakages and evasion due to administrative weaknesses are
common issues amongst developing countries. Too much centralisation
and adverse taxpayer's perception that the collected amount is not spent
on basic needs makes citizens away from ownership and tax
responsibilities.
A country seeking to enhance revenue collection can either look
for potential areas for taxation or improve its ability to govern.
Developing countries with narrow tax base have limited tax potential.
Additional taxation retards economic growth and has sever repercussion
on political economy. Moreover, citizens from all strata of society feel
the taxation additional burden on their business and disposable income.
Particularly, developing countries through constitutional protection often
provide tax exemption to protect agricultural sector. Taxing this sector
can affect the livelihood of the already downtrodden. A significant
portion of revenue in developing countries stems from indirect taxes.
According to Khan (1999) any further imposition of higher rate of
indirect taxes inevitably leads to higher inflation and hurts the poor.
Indirect taxes are regressive in nature and lead to higher inflation and
lower spending. Gera (2007) asserts that the recent Structural Adjustment
Program of the IMF and World Bank for the developing countries aims
at fiscal prudence through imposition of broad based General Sales Tax
and taxation of the agricultural sector.
Institutional Quality and Governance are important factor
according to New Institutionalists’ paradigm. Daron & James (2006)
describes: ‘The institutions of a country may create incentives for investment and
technology adoption, for its businesses to invest, and the opportunity
to accumulate human capital for its workers, thus enhancing economic
growth. Or they may discourage such activities, leading to stagnation.
They may create incentives for politicians to work towards creating a
growth-enhancing environment. Or they may encourage rent seeking
activities, corruption, poverty, illiteracy and the unfettered pursuance
of personal gain at great cost for the rest of the society.’”
Improvement in governance is an optimal solution. The paper provides
empirical evidence to suggest that improvement in institutional quality
and governance indicators enhances tax to GDP ratio of a country. The

Impact of Institutional Quality and Governance… Shahzad, Naveed & Muqeem
Journal of Managerial Sciences Volume X Number 2 185
government needs to emphasize on governance in order to enhance its
revenue potential.
Developing countries are unable to impose taxation measures
due to their socio-economic and political repercussions. However,
empirical evidence suggests that strong political and administrative
desire creates an efficient and effective tax administrative mechanism
(Bird & Jantsher, 1992).
Improvement in institutional quality and
governance affects revenue collection in a positive manner.
Literature Review Without the ability to raise revenues effectively, governments are limited
in the extent to which they can provide security, meet basic needs, and
foster economic development. Taxation can stimulate calls for more
representative governments, while the need to increase revenues can
stimulate institution-building. Funding state expenditures primarily
through resources that are raised without much effort (foreign aid or
revenues derived from oil and other natural resources) does little to
stimulate the development of state capacity (Bird, 1992).
In developed countries, taxes not only help to create the state,
they also help make it democratic. Charles (1985) concludes that there is
a linkage between democratic forms of government and evolution of
taxation. Formed originally to finance wars, the revenue authorities
became essential supports for European economic development. Kaldor
(1963) points out the linkage between state capacity and taxation by
stating that, “No underdeveloped country has the manpower resources or
the money to create a high-grade civil service overnight”. Kaldor (1963)
asserts that it is not sufficiently recognized that the revenue service is the
'point of entry'; if they concentrated on this, they would secure the means
for the rest.
In his view, political will is the sine qua non of any
successful tax reforms. According to Torgler (2007), tax system is a
reflection of the stability of a country’s political institutions. Torgley
reports the existence of a strong relationship between procedural fairness
and high tax revenues in the developed countries.
Tanzi (1992) describe that there is a large gap between tax-to-
GDP ratio of developing and developed countries on account of a
number of challenges. First, a large sum of working population of
developing countries is employed in the informal agricultural sector.
Significant amount of earnings remain out of the ambit of income tax.
Second, absence of trained tax officials and transparent tax procedures
allows tax officials and tax payers to exploit the system. Third,
developing countries find it difficult to develop reliable statistics in
presence of an undocumented economy. As a result significant revenue
potential remains unrealized. Fourth, inequalities in income distribution
in the developing countries lead to regressive taxation. The rich and

Impact of Institutional Quality and Governance… Shahzad, Naveed & Muqeem
Journal of Managerial Sciences Volume X Number 2 186
politically powerful are able to prevent fiscal reforms to implement
progressive taxation. Daron & James (2006) give a detailed elaboration
of this failure of progressive taxation in developing countries through the
following derived mathematical model:
))(('1)1)(1(
)1)(1(XTC
XX
XX−=
+∂−−
+−−
∂
θθ
X implies political power of the elites; θ indicates share of income of the
rich; δ stands for the number of elite in a society while T is the tax rate.
Increase in political power of the elites increases the left hand side of the
equation which affects the right hand side. In order for the right hand
side to increase, C’ (T(X) declines. Thus, an increase in the power of the
rich to influence the policy making in a democratic developing country
pulls the tax rate down to their level of satisfaction (Daron, 2010).
Developing countries mainly rely on indirect taxes for their
revenues. Increase in tax rates is the only option in the wake of their
narrow tax base. However, increase in tax rates does not necessarily
result in an increase in government revenues. Laffer (2004) advocates
lowering tax rates in order to increase tax revenues. The figure 1 at
illustrates that tax revenues start to decline with an increase in tax rate
beyond t*. Laffer (2004) asserts that the practice of reliance on higher
tax rates for higher revenue yields has failed in developing countries.
Figure 1: Laffer Curve
Source: Laffer, A. B. (2004)
Pakistan is one such example where despite several tax reforms and
increase in tax rates for General Sales Tax, tax-to-GDP ratio has
remained stagnant. Tax policy and tax administrative reforms have
failed to make any significant break-through. A narrow tax base, failure
to curb evasion and delay in bringing new forms of incomes in the tax
net, has resulted in an inelastic tax structure. Ahmed & O’Donoghue
(2009) state that despite high economic growth rate during 2000 to 2006,
tax-to-GDP ratio has not improved. Pakistan is an ideal application of
Daron (2010) model where there is a greater reliance on indirect taxes as
depicted in Fig 2. The data on Pakistan’s tax composition is exhibited in

Impact of Institutional Quality and Governance… Shahzad, Naveed & Muqeem
Journal of Managerial Sciences Volume X Number 2 187
Table 2A in the appendix A. This is the reason that tax to GDP ratio has
remained at 10% since the year 2000.
Figure 2: Composition and Trend of Tax-GDP ratio in Pakistan
Source: Economic Survey of Pakistan and FBR data base 2014-15
High tax-GDP ratios in the West are partly explained by the high social
security contributions which pay for several welfare schemes. Another
major caveat is the method of taxation. Poor and common citizens face
tax burden in case of indirect taxation. On the contrary, if, like European
countries, taxes are levied on personal and business income, common
citizens are not burdened. Evolution of civic sensibility, maturity of
ruling classes and corruption are the key elements that differentiate the
high and low tax-to-GDP ratio countries.
The state-building role of taxation is a central issue for those
concerned with the problem of collapsed states, weak governments, and
the lack of democracy across the developing world. Economic self-
sufficiency is possible through achievement of optimal revenues. Tax
policy needs to be designed in a progressive manner. The literature
indicates that transparent tax laws in addition to stable political
infrastructure and effective governance have a positive impact.
The developing countries need to improve governance of their
institutions to enhance tax-to-GDP ratio. World Bank Governance
Indicators (WGI) is a depiction of the quality of governance in a country.
The WGI consist of six aggregate indicators of governance covering over
200 countries, combining cross-country data on governance provided by
30 different organizations. WGI indicators for the period 2008-13 have
been tested for the purpose of this study. The governance index of the
World Bank consists of several hundred measuring perceptions of
governance and derives from 30 different data sources (Kaufmann &
Aart, 2008). All scores lie between -2.5 to +2.5, with higher scores
corresponding to better institutional frameworks.

Impact of Institutional Quality and Governance… Shahzad, Naveed & Muqeem
Journal of Managerial Sciences Volume X Number 2 188
Governance indicators are based on perceptions collected through
surveys conducted by various international organizations in a country.
There are certain limitations to these indicators. These include
comparability over time and across countries, biases in expert
assessments, correlated perception errors, definitional issues, and
reliance on subjective data.
Methodology, Hypotheses and Model Specification
The paper utilizes the pooled data for 26 countries for a span 6 years; its
estimation is modeled as:
The dummies are used for each year under consideration to smoothen the
model for estimation cross-section panel data. The estimation procedure
of polled data exhibited in Fig-2 described that all the countries with
certain years converted into single series and OLS estimation is carried
out to determine parameter with an assumption of no presence of
heteroskedasticity. In order to capture effects of endogenous on
exogenous variables in cross-sectional data across the countries for a
certain time period, this method is useful despite some weaknesses.
Figure 3: Estimation Design of Pooled Data
According to the theory, better governance plausibly should enhance tax-
to-GDP ratio. The test of following sub-hypothesis corroborates the
assumptions of the principle hypothesis.
H01: An accountable State with adequate public representation has no
impact on tax to GDP ratio.
H11: An accountable State with adequate public representation results in
a higher tax to GDP ratio.
Impact of Institutional Quality and Governance… Shahzad, Naveed & Muqeem
Journal of Managerial Sciences Volume X Number 2 189
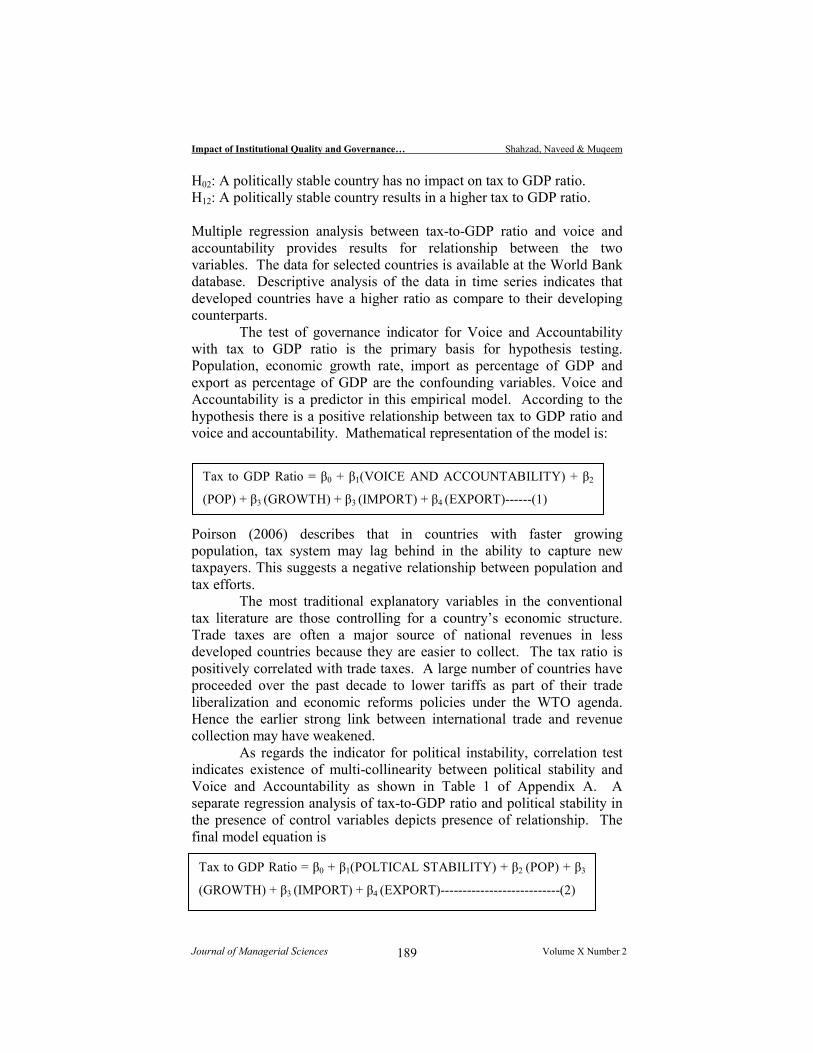
H02: A politically stable country has no impact on tax to GDP ratio.
H12: A politically stable country results in a higher tax to GDP ratio.
Multiple regression analysis between tax-to-GDP ratio and voice and
accountability provides results for relationship between the two
variables. The data for selected countries is available at the World Bank
database. Descriptive analysis of the data in time series indicates that
developed countries have a higher ratio as compare to their developing
counterparts.
The test of governance indicator for Voice and Accountability
with tax to GDP ratio is the primary basis for hypothesis testing.
Population, economic growth rate, import as percentage of GDP and
export as percentage of GDP are the confounding variables. Voice and
Accountability is a predictor in this empirical model. According to the
hypothesis there is a positive relationship between tax to GDP ratio and
voice and accountability. Mathematical representation of the model is:
Poirson (2006) describes that in countries with faster growing
population, tax system may lag behind in the ability to capture new
taxpayers. This suggests a negative relationship between population and
tax efforts.
The most traditional explanatory variables in the conventional
tax literature are those controlling for a country’s economic structure.
Trade taxes are often a major source of national revenues in less
developed countries because they are easier to collect. The tax ratio is
positively correlated with trade taxes. A large number of countries have
proceeded over the past decade to lower tariffs as part of their trade
liberalization and economic reforms policies under the WTO agenda.
Hence the earlier strong link between international trade and revenue
collection may have weakened.
As regards the indicator for political instability, correlation test
indicates existence of multi-collinearity between political stability and
Voice and Accountability as shown in Table 1 of Appendix A. A
separate regression analysis of tax-to-GDP ratio and political stability in
the presence of control variables depicts presence of relationship. The
final model equation is
Tax to GDP Ratio = β0 + β1(POLTICAL STABILITY) + β2 (POP) + β3
(GROWTH) + β3 (IMPORT) + β4 (EXPORT)---------------------------(2)
Tax to GDP Ratio = β0 + β1(VOICE AND ACCOUNTABILITY) + β2
(POP) + β3 (GROWTH) + β3 (IMPORT) + β4 (EXPORT)------(1)

Impact of Institutional Quality and Governance… Shahzad, Naveed & Muqeem
Journal of Managerial Sciences Volume X Number 2 190
Deniz & Ceyhun (2009), in their study on the impact of political stability
on tax to GDP ratio provide proof that there is a direct relationship
between the two. The data analysis should show a direct relationship
between the two variables in the presence of control variables along with
dummy variables for the country difference and time effect. Significance
of country variable would indicate that the tax-to-GDP ratio is higher for
developed countries.
H03: A country with effective & efficient bureaucratic infrastructure will
have no impact on tax to GDP ratio.
H13: A country with effective & efficient bureaucratic infrastructure will
have a higher tax to GDP ratio.
H04: An effective regulated framework in a country will have no impact
on tax to GDP ratio.
H14: An effective regulated framework a country will have a higher tax
to GDP ratio.
The testing of hypothesis that there exists relationship between tax to
GDP ratio and government effectiveness and regulatory framework is
identical to the steps taken in hypothesis 1. The test includes insertion of
two new governance indicators of government effectiveness and
regulatory authority through a step wise regression analysis. There is a
separate analysis for each indicator on account of multi-collinearity as
shown in table A-1 of Appendix A. The new equation for government
effectiveness is as follows:
Similarly the model for regulatory authority is as follows:
Data for governance indicators for regulatory authority is available at the
World Bank’s data source (World Bank, 2013).
Population, economic growth rate and openness of the economy
act as confounding variables and make the model dynamic and robust.
Population and economic growth should have negative relationship with
statistical significance. Similarly openness of the economy should have a
positive relationship. However, in view of the recent WTO regulations
signed by a number of developing countries this is insignificant
relationship. According to the hypothesis there needs to be a positive
Tax to GDP Ratio = β0 + β1(GOVERNMENT EFFECTIVENESS) + β2
(POP) + β3 (GROWTH) + β3 (IMPORT) + β4 (EXPORT)--------------(3)
Tax to GDP Ratio = β0 + β1(REGULATORY AUTHORITY) + β2
(POP) + β3 (GROWTH) + β3 (IMPORT) + β4 (EXPORT)--------------(4)

Impact of Institutional Quality and Governance… Shahzad, Naveed & Muqeem
Journal of Managerial Sciences Volume X Number 2 191
direct relationship between tax to GDP ratio and Government
Effectiveness and Regulatory Authority. Multiple regression analysis
provides the results of the relationship.
H05: A state with improved rule of law will have no impact on tax to
GDP ratio.
H15: A state with improved rule of law will have a higher tax to GDP
ratio.
H06: A state with higher controls on corrupt practices will have no impact
on tax to GDP ratio.
H16: A state with higher controls on corrupt practices will have a higher
tax to GDP ratio.
Is it possible to increase tax to GDP ratio by improving rule of law and
reducing corrupt practices? The analysis includes multiple linear
regressions of the two indicators against tax to GDP ratio separately due
to existence of high correlation amongst them as shown in table 1 in the
appendix A. Analysis includes addition of the four control variables;
population, economic growth rate, percent import of GDP and percent
export of GDP. A dummy variable for distinguishing developed country
from developing country makes the model more robust. The inclusion of
dummy variables for time effect would examine whether there is any
impact on tax-to-GDP ratio over a period of time. The model equation
for rule of law is as follows:
Similar empirical analysis on control of corruption depicts the following
model equation:
Data for governance indicators for rule of law and control of corruption
is available at the World Bank’s website for the World Bank Governance
Indicators (World Bank 2013). According to the hypothesis there needs
to be a positive direct relationship between tax to GDP ratio and rule of
law and control of corruption. Significance of the dummy variable can
predict the fact that whether developed countries have a higher tax to
GDP ratio while controlling for all other factors given in the model. The
regression results provide an indication of the direction of the
relationship of each of the independent variable with tax to GDP ratio.
Tax to GDP Ratio = β0 + β1(CONTROL OF CORRUPTION) + β2 (POP)
+ β3 (GROWTH) + β3 (IMPORT) + β4 (EXPORT) ---------------------(6)
Tax to GDP Ratio = β0 + β1(RULE OF LAW) + β2 (POP) + β3
(GROWTH) + β3 (IMPORT) + β4 (EXPORT) ----------------------(5)

Impact of Institutional Quality and Governance… Shahzad, Naveed & Muqeem
Journal of Managerial Sciences Volume X Number 2 192
Model Estimation and Results
Multiple Regression Analysis of the dataset indicates a positive
relationship between governance indicators and tax to GDP ratio while
controlling for other factors during the time period 2009-13. The
findings are in accordance with the assumptions laid out in the
methodology. It also corroborates with the findings of Martinez & Bird
(2006) regarding the existence of positive relationship between the
governance indicators and TGR (tax to GDP ratio). Regression results
for six equations are exhibited in tables 1 to table 3.
Table 1: Regression - Tax to GDP Ratio and Voice and Accountability &
Political Stability. Model
Dependent Variables
OLS Results of Eq-1
Tax-GDP Ratio
OLS Results of Eq-2
Tax-GDP Ratio
Independent Variables Coefficients SE Coefficients SE
INSTITUTIONS
Voice and Accountability
Political Stability
REGIONS
Developed
DEVELOPMENT
Population
Economic Growth rate
OPENNESS
Percent of Imports of GDP
Percent of Exports of GDP
Year 2009
Year 2010
Year 2011
Year 2012
Year 2013
2.828* (0.980)
-- --
9.726* (1.754)
-5.62E-09** (2.4E-09)
-1.229** (0.629)
0.150*** (0.098)
-0.141*** (0.087)
1.826 (1.938)
0.677 (1.951)
0.551 (1.920)
-0.302 (1.920)
0.576 (1.930)
-- --
3.500* (0.920)
8.463* (1.766)
-5.1E-09* (2.6E-09)
-1.660* (0.617)
0.161*** (0.096)
-0.174*** (0.085)
3.041 (1.909)
1.991 (1.921)
1.317 (1.891)
-0.181 (1.883)
0.762 (1.891)
F-Test : INSTITUTIONS 21.943* 23.353*
Multiple R
R Square
Adjusted R Square
Standard Error
Observations
0.791
0.626
0.598
6.889
156
0.800
0.641
0.613
6.754
156
* indicates significance at the 1 percent level ,
** indicates significance at the 5 percent level
*** indicates significance at the 10 percent level. Robust standard errors in
parentheses.

Impact of Institutional Quality and Governance… Shahzad, Naveed & Muqeem
Journal of Managerial Sciences Volume X Number 2 193
Table 2: Regression –Tax - GDP Ratio & Government Effectiveness &
Regulatory Authority Model
Dependent Variables
OLS Results of Eq-3
Tax-GDP Ratio
OLS Results of Eq-4
Tax-GDP Ratio
Independent Variables Coefficients SE Coefficients SE
INSTITUTIONS
Government Effectiveness
Regulatory Authority
REGIONS
Developed
DEVELOPMENT
Population
Economic Growth rate
OPENNESS
Percent of Imports of GDP
Percent of Exports of GDP
Year 2009
Year 2010
Year 2011
Year 2012
Year 2013
2.907* (1.140)
-- --
8.414* (2.273)
-6.7E-09* (2.4E-09)
-1.497* (0.630)
0.195*** (0.100)
-0.205*** (0.089)
2.330 (1.946)
1.095 (1.957)
0.549 (1.932)
-0.404 (1.932)
0.649 (1.941)
-- --
2.415** (1.093)
9.998** (1.940)
-6.7E-09* (2.4E-09)
-1.361* (0.633)
0.155** (0.099)
-0.167*** (0.088)
2.442 (1.959)
1.348 (1.971)
0.863 (1.944)
0.033 (1.948)
0.747 (1.951)
F-Test : INSTITUTIONS 21.522* 21.148*
Multiple R
R Square
Adjusted R Square
Standard Error
Observations
0.789
0.622
0.593
6.931
156
0.786
0.618
0.588
6.968
156
* indicates significance at the 1 percent level ,
** indicates significance at the 5 percent level
*** indicates significance at the 10 percent level. Robust standard errors in
parentheses.
Table 3: Regression –Tax - GDP Ratio & Rule of Law & Control on
Corruption Model
Dependent Variables
OLS Results of Eq-5
Tax-GDP Ratio
OLS Results of Eq-6
Tax-GDP Ratio
Independent Variables Coefficients SE Coefficients SE
INSTITUTIONS
Rule of Law
Control on Corruption
REGIONS
Developed
DEVELOPMENT
Population
Economic Growth rate
OPENNESS
Percent of Imports of GDP
Percent of Exports of GDP
Year 2009
Year 2010
Year 2011
Year 2012
2.833* (1.073)
-- --
8.847* (2.088)
-7.0E-09* (2.4E-09)
-1.379** (0.629)
0.158*** (0.099)
-0.166*** (0.087)
2.352 (1.943)
1.246 (1.955)
0.790 (1.929)
-0.101 (1.930)
-- --
1.909** (0.917)
9.865* (2.058)
-6.6E-09* (2.4E-09)
-1.498** (0.635)
0.184*** (0.101)
-0.192** (0.090)
2.551 (1.967)
1.354 (1.975)
0.765 (1.946)
-0.204 (1.946)

Impact of Institutional Quality and Governance… Shahzad, Naveed & Muqeem
Journal of Managerial Sciences Volume X Number 2 194
Year 2013 0.795 (1.937) 0.817 (1.955)
F-Test : INSTITUTIONS 21.630* 21.021*
Multiple R
R Square
Adjusted R Square
Standard Error
Observations
0.789
0.623
0.594
6.920
156
0.785
0.616
0.587
6.981
156
* indicates significance at the 1 percent level ,
** indicates significance at the 5 percent level
*** indicates significance at the 10 percent level. Robust standard errors in
parentheses.
Discussion about Estimation & Results
The analysis of the correlation results (Table A-1 in Appendix A)
indicates that there is a high correlation amongst all governance
indicators and is greater than the correlation between governance
indicators and tax to GDP ratio. This indicates presence of
multicollinearity. In order to test hypotheses presented in the previous
sections for statistical significance, pool of data for 26 countries for time
span of 6 years has be utilized to examine the relationship of each
governance indicator with tax to GDP ratio. Regression analysis of tax to
GDP ratio against each World Bank Governance Indicator have used as
main variable of interest in the study. Population, GDP growth rate, total
imports as percent of GDP and total exports as percent of GDP are the
control variables which make the model dynamic and robust.
Longitudinal study for the time period 2009 to 2013 highlights the
effects of time period. The benefit of a longitudinal study is its ability to
distinguish short term results from long term.
Estimation result of Equation 1 described in the table describes
that estimated value of coefficient of voice and accountability taken as
exogenous variable is highly significant at 1%. Hence hypotheses Ho
1
that Voice and accountability has no effect lies in area with high
probability of rejection. As policy matter the results tells that public
participation and accountability measures adopted will affect tax-GDP
ratio more than double i.e. The value of coefficient of dummies for
developed and developing countries is highly significant and Ho is
rejected at one percent probability. In case of developed countries
occurrence of higher Tax-GDP ratio may take more than nine times than
that of developing countries. It also depicts that developing countries
need more efforts to enhance level of participation and to enhance
effectiveness and efficiency of accountability apparatus. Economic
growth though significant at 5% percent confidence interval, however its
sign, which is negative, depicts against the general perception that higher
growth will increase Tax-GDP ratio. The data shows that countries with
high level of Tax-GDP ratio like France, Sweden, Canada and USA has

Impact of Institutional Quality and Governance… Shahzad, Naveed & Muqeem
Journal of Managerial Sciences Volume X Number 2 195
low level of growth indicators because of high GDP base in comparison
with countries like Pakistan, India, Bangladesh , Philippines . In these
developing countries Tax-GDP ratio is low but it has been observed
higher level of economic growth coupled with higher population growth.
Coefficients of Ratios of export-GDP and import-GDP as indicators of
openness are significant only at 10% confidence interval hence predicts a
mixed trend over data. Negative value of coefficient of population is
significant at 5% confidence interval which speaks that countries with
high population tend to pose higher threat on Tax-GDP ratio. As a
consequence of rise of electronic and social media, the accountability
mechanism and public participation have enhanced manifolds than that
of earlier decades.
Coefficients based on equation-2 depict relationship between
political stability and tax-GDP ratio. The coefficient equivalent to 3.5 is
highly significant and H02 is rejected at one percent of confidence
interval that political stability has no impact on Tax-GDP ratio. It is
worth noting that in all six estimated equations impact of political
stability is highest in term of value. Hence it prescribes that as principal
of first-come-first, political stability should given top priority in
improving institutions and governance policies in developing countries.
Higher frequency of political turmoil leads to an economy more fragile
towards tax collection efforts. Consequently it weakens the tax
administration apparatus which is an indispensable tool of tax collection.
The political instability also hampers the confidence that their tax money
is properly utilized or not.
Coefficient of Government effectiveness in equation 3 is
significant at 1% level of confidence, hence H03 is rejected. It describes
that enhance of government effectiveness will likely to enhance tax-
GDP ratio around three times of the efforts exerted. Civil services are
backbone of the government. Though political leadership provides better
vision and enhanced policy options but bureaucracy are ultimate tools of
implementation of policies and execution of ways and means in an
economy. The results conclude that effective government will generate
true value of public money and contribute economic growth along with
public confidence on the government machinery.
Selectivity in implementation under the influence of ruling
parties a subtle act generally committed in most of the developing world
particularly countries with fragile political and accountability structure.
In order to verify the fact empirically that effective and efficient
regulatory apparatus in a country has any effect in Tax-GDP ratio, the
estimation results of Equation 4 rejects the null hypothesis H04. The
coefficient value 2.415 is significant at 5% confidence interval. Hence
efforts exerted to enhance regulatory efficiency will likely to generate
more than double the increase in Tax-GDP ratio. The empirical results

Impact of Institutional Quality and Governance… Shahzad, Naveed & Muqeem
Journal of Managerial Sciences Volume X Number 2 196
of this study speak that better governance and enhanced institutional
quality in developing countries will enhance economic activity, higher
efficiency of revenue collecting apparatus and consequently higher
degree of tax-GDP ratio.
The rule of law is an encompassing concept in the areas of
governance and institutional quality. It covers depiction of situation
covering the areas like policing, judiciary, functionary of ministries,
recruitment policies, financial prudence in the government functionaries
etc. Estimation results of the Eq-5 depicts that coefficient of rule of law
is significant at 1% confidence interval and null hypothesis. Hence H05
stands rejected. The coefficient of dummy depicting regional
identification is highly tilted towards developed countries. Hence asserts
that developed countries likely fetch around 8.847 times more revenue as
percentage to GDP than that of in case of developing countries.
Estimation results of Eq-6 containing control on corruption
describe that null hypothesis H06 is rejected due to the reason that
coefficient of control on corruption variable is significant at 5%
confidence interval. The results say that corruption eradication efforts
will likely fetch around double more revenue at a certain level of GDP.
The tax evasion and theft in corroboration with tax machinery is century
old phenomenon. Transparency International has also created local
chapters in many countries in order to watch corruption and anti
corruption policies.
Detailed analysis of the regression results corroborate the
findings of earlier empirical studies of Bird (2007), Bahl (1971), Bird
(2003), Poirson (2006) and Deniz & Ceyhun ( 2011). Following is a
summary of each of these findings:
• All governance indicators are not only positively related to tax to
GDP ratio but are also statistically significant. The findings
match Bird’s results (2007). This indicates that effective
governance leads to higher tax-to-GDP ratio.
• Population is statistically significant. Furthermore, it is
negatively related with tax to GDP ratio which is in line with
studies of Bahl(2003). This implies that taxation structure is
unable to capture entire population under the tax net.
• Economic Growth remains negatively related and statistically
insignificant to tax-to-GDP ratio. This agrees with cross country
studies conducted by Poirson (2006). This indicates stagnancy of
tax-to-GDP ratio amongst developing countries. Despite
economic growth, the developing countries are unable to capture
the expansion in economy on account of their narrow tax base.
• There is a strong positive relationship in imports and tax to GDP
ratio which indicates that developing countries have a strong
dependency on their import taxes. However, negative

Impact of Institutional Quality and Governance… Shahzad, Naveed & Muqeem
Journal of Managerial Sciences Volume X Number 2 197
relationship in exports is the result of duty exemptions to raw
materials imported for goods, which are subsequently exported.
An increase in exports would mean an increase in import of
exempted goods which would have a negative effect on tax to
GDP ratio.
Limitations the Model and Estimation
Following are the limitations to the empirical model:
i). The study analyzes data for only thirteen developing and thirteen
developed countries. Using data for a greater number of
countries can make the analysis reliable and statistically
significant.
ii). Five years data is the basis for the longitudinal study. An
analysis over a larger time frame can provide better estimates.
iii). The study includes only four control variables in addition to the
predictor variable of governance. Additional independent
variables such as Foreign Direct Investment and per capita
income can provide a better estimate of the model.
iv). There are several limitations to the World Bank Governance
Indicators. First, there are concerns about the over-time and
cross-country comparability of the WGI. There are substantive
margins of error in the dataset. Second, there are significant
biases in expert assessments. Third, critics have suggested that
expert assessments make similar errors when assessing the same
country, leading to correlations in the perception errors across
various expert assessments. Fourth, there is no consensus on the
definition of governance indicators. Fifth, there is a greater
reliance on subjective data in the formulation of governance
indicators.
Recommendations & Conclusion
In view of the above mentioned policy options, following are
recommended to enhance the tax to GDP ratio of a developing country:
• Developing countries should focus on progressive taxation in
order to enhance their tax-to-GDP ratio.
• In order to gain maximum representation in tax policy making,
Chamber of Commerce and Industry should be involved in the
formulation of tax policies.
• Accountability Commissions should be managed by people of
professional integrity.
• Government expenditures create opportunities for employment
and economic growth. Optimal tax collection can lead to higher
public expenditure in development program.

Impact of Institutional Quality and Governance… Shahzad, Naveed & Muqeem
Journal of Managerial Sciences Volume X Number 2 198
• Tax reforms should be framed and tested at a pilot level before
embarking on a larger scale in order to test the efficiency of
reforms.
• Change in tax policies should happen only once a year during the
budgetary exercise of the parliament. Repeated shifts in tax
policies make the system ambiguous and open to criticism.
• The Upper and Lower House of the parliament should
thoroughly debate budgetary proposals before making any
amendments in tax policies.
• Tax policies should be framed in a transparent and effective
manner with exact rules for implementation. The tax machinery
run by bureaucrats should ensure implementation of each rule
and regulation.
• In order to eliminate the menace of corruption from the taxation
infrastructure, it is imperative that taxation officers and officials
are hired on market based salaries. There is a need to reduce the
redundant lower level staff through the introduction of
automation. Financial incentives in the form of annual rewards
for outstanding performance can play a major role in controlling
corruption index.
Empirical analysis indicates the importance of effective governance.
Legitimate and responsive state is therefore an essential pre-condition for
attainment of higher tax to GDP ratio. Developing countries cannot rely
on increasing tax burden on an already narrow tax base for higher tax
growth. The study also suggests that a stable legal framework along with
improved controls on corrupt practices contributes toward reduction in
tax evasion. The following policy solutions, if implemented, results in a
to a higher tax-to-GDP ratio. First, creation of a tax accountability and
vigilance commission can result in unearthing of mega tax frauds.
Second, there is a need to keep a vigilant watch on corrupt practices by
tax officials in collusion with the business community. Third,
implementation of consistent tax policies depicts a stable political
framework. Empirical studies show that Multi National Corporations
consider political stability in the host country as one of the most
important determinants in investment decision making.
Optimal tax
levels lead to large economic growth and social welfare. Third, clear,
concise and transparent laws promote investor confidence resulting in
higher revenue generation. Fourth, tax laws should be transparent in
every manner. Fifth, government in a developing country should strive
for an independent and efficient tax bureaucracy along with transparent
automated taxation systems. Empirical evidence suggests that where
governments reduce bureaucracy and increase the control of corruption,
tax compliance is at its highest. Sixth, developing countries need to have

Impact of Institutional Quality and Governance… Shahzad, Naveed & Muqeem
Journal of Managerial Sciences Volume X Number 2 199
a transparent budget making process with adequate public representation.
Implementation of the above policy options can result in a higher tax to
GDP ratio which is essential for socio-economic development of any
developing country.

Impact of Institutional Quality and Governance… Shahzad, Naveed & Muqeem
Journal of Managerial Sciences Volume X Number 2 200
Appendix A
Table 1-A: Correlation between Tax to GDP Ratio and the Six
Governance Indicators
tax
es
Po
ls
ge
reg
Law
corr
up
tio
n
va
Tax
es
1
Po
ls
0.6
63
40
49
37
1
Ge
0.6
72
60
49
09
0
.89
14
22
3
65
1
Reg
0.6
72
87
46
28
0
.88
52
31
5
59
0
.96
45
14
2
79
1
Law
0.6
89
92
60
84
0
.88
57
03
0
53
0
.96
73
91
1
47
0
.95
67
22
4
19
1
Co
rru
pti
on
0.6
52
77
45
52
0
.89
59
83
3
9
0.9
82
36
09
43
0
.96
23
03
3
2
0.9
79
70
97
37
1
Va
0.7
02
96
01
31
0
.78
34
80
1
6
0.8
20
06
23
57
0
.83
45
03
7
36
0
.83
63
43
7
62
0
.81
42
06
8
55
1

Impact of Institutional Quality and Governance… Shahzad, Naveed & Muqeem
Journal of Managerial Sciences Volume X Number 2 201
Table 2-A: Composition of Tax to GDP Ratio in Pakistan (R
s. M
illio
n)
DIR
EC
T T
AX
ES
IND
IRE
CT
TA
XE
SS
UR
CH
AR
GE
S *
TO
TA
L T
AX
ES
TO
TA
L T
AX
ES
YE
AR
SG
DP
*
WIT
HO
UT
S
UR
CH
AR
GE
SW
ITH
S
UR
CH
AR
GE
S
(mp
)C
ollection
Tax/G
DP
Colle
ction
Tax/G
DP
Colle
ction
Tax/G
DP
Collection
Tax/G
DP
Colle
ction
Tax/G
DP
(Net)
Ratio (
%)
(Net)
Ratio (
%)
(Net)
Ratio (
%)
(Net)
Ratio (
%)
(Net)
Ratio (
%)
12
34
56
78
910
11
12
19
96
-97
2,4
28,3
12
85,0
60
3.5
0197,0
27
8.1
127,3
17
1.1
2282,0
87
11.6
2309,4
04
12.7
19
97
-98
2,6
77,6
56
103,1
82
3.8
5190,4
49
7.1
142,9
11
1.6
0293,6
31
10.9
7336,5
42
12.6
19
98
-99
2,9
38,3
79
110,2
07
3.7
5198,3
02
6.7
561,9
27
2.1
1308,5
09
10.5
0370,4
36
12.6
19
99
-00
3,8
26,1
11
112,9
50
2.9
5234,1
54
6.1
238,9
12
1.0
2347,1
04
9.0
7386,0
16
10.1
20
00
-01
4,2
09,8
73
124,5
85
2.9
6267,6
92
6.3
630,2
00
0.7
2392,2
77
9.3
2422,4
77
10.0
20
01
-02
4,4
52,6
54
142,5
05
3.2
0261,5
65
5.8
754,8
54
1.2
3404,0
70
9.0
7458,9
24
10.3
20
02
-03
4,8
75,6
48
151,8
98
3.1
2308,7
29
6.3
368,2
30
1.4
0460,6
27
9.4
5528,8
57
10.8
20
03
-04
5,6
40,5
80
165,0
79
2.9
3355,7
64
6.3
161,4
00
1.0
9520,8
43
9.2
3582,2
43
10.3
20
04
-05
6,4
99,7
82
183,3
72
2.8
2407,0
15
6.2
626,7
69
0.4
1590,3
87
9.0
8617,1
56
9.5
20
05
-06
7,6
23,2
05
224,9
88
2.9
5488,4
54
6.4
150,8
00
0.6
7713,4
42
9.3
6764,2
42
10.0
20
06
-07
8,6
73,0
07
333,7
37
3.8
5513,4
99
5.9
264,5
46
0.7
4847,2
36
9.7
7911,7
82
10.5
20
07
-08
10,2
84,3
80
387,8
61
3.7
7620,2
30
6.0
335,1
78
0.3
41,0
08,0
91
9.8
01,0
43,2
69
10.1
20
08
-09
13,1
99,7
07
443,5
48
3.3
6717,6
02
5.4
4126,0
26
0.9
51,1
61,1
50
8.8
01,2
87,1
76
9.8
20
09
-10
14,8
66,9
96
525,9
77
3.5
4801,4
05
5.3
9114,6
50
0.7
71,3
27,3
82
8.9
31,4
42,0
32
9.7
20
10
-11
18,2
76,4
40
602,4
51
3.3
0955,5
63
5.2
3113,1
03
0.6
21,5
58,0
14
8.5
21,6
71,1
17
9.1
20
11
-12
20,0
46,5
00
738,4
24
3.6
81,1
44,2
69
5.7
183,3
29
0.4
21,8
82,6
93
9.3
91,9
66,0
22
9.8
20
12
-13
22,4
89,0
77
743,4
09
3.3
11,2
02,9
51
5.3
5141,8
37
0.6
31,9
46,3
60
8.6
52,0
88,1
97
9.3
20
13
-14
25,4
01,8
95
877,2
55
3.4
51,3
77,2
77.0
5.4
2142,0
64
0.5
62,2
54,5
32
8.8
82,3
96,5
96
9.4
20
14
-15
27,3
84,0
00
1,0
33,7
20
3.7
71,5
56,2
58
5.6
8115,3
16
0.4
22,5
89,9
78
9.4
62,7
05,2
94
9.9
* S
ourc
e: P
akis
tan
Econom
ic
Surv
ey
2014-1
5 (
Table
4.3
) and F
BR
Data
base

Impact of Institutional Quality and Governance… Shahzad, Naveed & Muqeem
Journal of Managerial Sciences Volume X Number 2 202
References
Ahmad V. & O’Donoghue, C. (2009) Redistributive Effects of Personal
Income Taxation in Pakistan. Pakistan Economic and Social
Review 47(1). pp.1-17.
Bahl, R. (1971) A Regression Approach to Tax Effort and Tax Ratio
Analysis. Staff Paper (18). International Monetary Fund. pp.
570–612.
Belkaoui, A. R. (2008) Taxation and Public Finance in Transition and
Developing Economies. New York: Springer Science & Business
Media.
Bird, R. M. (2007) Tax Effort: The Impact of Corruption, Voice and
Accountability. ITP Paper 0702, University of Toronto, Canada.
Bird, R.M & Casanegra J. M. (1992) Improving Tax Administration in
Developing Countries. Washington: International Monetary Fund.
Charles T. (1985) War Making and State Making as Organized Crime.
In Skocpol, T., Evans, P. and Rueschemeyer, D., 1999, Bringing
the State Back. Cambridge: Cambridge University Press.
Chelliah, R. J. (1971) Trends in Taxation in Developing Countries.
Staff Papers (18). International Monetary Fund. pp. 254–0331.
Cicek, D. & Elgin C. (2009) Political Stability, Taxes and the Shadow
Economy. University of Minnesota.
Daron, A. & James, A. R. (2006) Economic Origin of Dictatorship and
Democracy. Cambridge: Cambridge University Press. pp. 97-99.
Daron, A. (2010) Institutions, Factor Prices, and Taxation: Virtues of
Strong States?. American Economic Review. pp. 115–119
Deniz Ç. & Ceyhun, E. ( 2011) Not-quite-great depressions of Turkey:
A quantitative analysis of economic growth over 1968–2004.
Economic Modeling 28(6). pp. 2691-2700.
Gera, N. (2007) Structural Adjustment Programs in Pakistan: A Boon or
a Bane?. Lahore School of Economics Press, Lahore. Pp. 169
Jones, P. (1999) Political Risk and Foreign Investment Decision of
International Hotel Companies. London: University of Sussex.
Kaldor, N. (1963) Will Underdeveloped Countries Learn to Tax?,
Foreign Affairs. pp. 410-419.
Kaufmann, D. & Kraay, A. (2008) Governance Indicators: Where Are
We, Where Should We Be Going?. Available at:
http://siteresources.worldbank.org/INTWBIGOVANTCOR/Reso
urces/KKGovernanceIndicatorsSurveyWBROSpring2008.pdf.
Khan, S. R. (1999) Do World Bank and IMF Policies Work. Hampshire
and London. Macmillan Press and New York: St. Martin’s Press
Inc.

Impact of Institutional Quality and Governance… Shahzad, Naveed & Muqeem
Journal of Managerial Sciences Volume X Number 2 203
Laffer, A. B. (2004) The Laffer Curve: Past, Present, and Future.
Available at: http://www.heritage.org/research/reports/2004/
06/the-laffer-curve-past-present-and-future
Larry, E. J., Rodolfo E. M. & Peter E. R. (1993) Optimal Taxation in
Models of Endogenous Growth. The Journal of Political
Economy 101(3). pp 485-517.
Ministry of Finance Government of Pakistan. (2015) Economic Survey
of Pakistan. Available at:
http://www.finance.gov.pk/survey_1415.html
Nicholas, K. (1963) Will Underdeveloped Countries Learn to Tax?.
Foreign Affairs 41. pp. 410-19.
Nina, G. (2007) Impact of Structural Adjustment Programs on Overall
Social Welfare in Pakistan. South Asia Economic Journal 8(1). p.
39.
Owens, J. & Hamilton, S. (2004) Experience and innovations in other
countries. In Aaron, H. J. & Slemrod, J. (Eds.), The crisis in tax
administration. Washington, D.C. Brookings Institution Press. pp.
310-336
Poirson, H. (2006) Making India’s tax system pro-growth. IMF Survey
(35)15 International Monetary Fund.
Richard, M. B. (2003) Societal institutions and tax efforts in Developing
countries. Toronto: University of Toronto.
Tanzi, V. (1992). Structural Factors and Tax Revenue in Developing
Countries: A Decade of Evidence. In Goldin. I and Winters, L. A.
(eds.), Open Economies: Structural Adjustment and Agriculture.
Cambridge. Cambridge University Press. pp. 267-281.
Torgler, B. (2007) Tax Compliance and Tax Morale: A Theoretical and
Empirical Analysis. Cheltenham: Edward Elgar.
Vaqar, A. & O’Donoghue, C. (2009) Redistributive Effects of Personal
Income Taxation in Pakistan. Pakistan Economic and Social
Review 47(1). pp.1-17.
Vito, T. & Howell Z. (2001) Tax Policy for Developing Countries.
International Monetary Fund.
World Bank (2013) Governance Indicators. Available at:
http://info.worldbank.org/governance /wgi/sc_country.asp.