Embed Size (px)
Citation preview

Impact of immortal time
and selection bias on
exposure-response
modelling
Mats O Karlsson
Uppsala University, Uppsala, Sweden


Immortal time is a span of cohort follow-up during which,
because of exposure definition, the outcome under
study could not occur.
Suissa, Am J Epidemiology, 2008
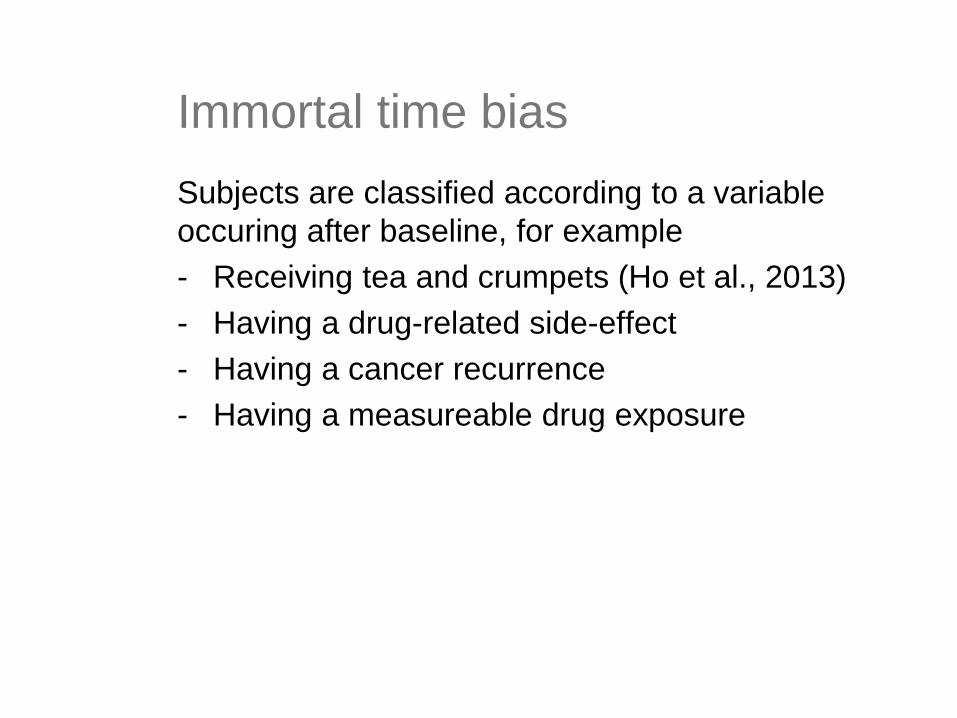
Immortal time bias
Subjects are classified according to a variable
occuring after baseline, for example
- Receiving tea and crumpets (Ho et al., 2013)
- Having a drug-related side-effect
- Having a cancer recurrence
- Having a measureable drug exposure

Immortal time bias, cont’d
A continuous variable, assessed post-baseline, is
used in survival analysis as if it was available at
baseline, for example
- Chemotherapy dose-intensity
- Adherence to therapy
- Total cumulative exposure (AUC)
- Maximal in reduction in tumor size

Depth of tumor response
McCoach et al. Ann Oncol 2017 28(11):2707-2714
Response by Weber et al., Ann Oncol 2018 29(1):282-3

How handle post-baseline
information?
Do not assume that post-baseline information is
available already at baseline
Do not use information from the future to predict
the present survival
Alternatives for using post-baseline information:
Time-varying covariates
Landmark analysis (with dynamic prediction)
Joint models (events/time-varying covariates)

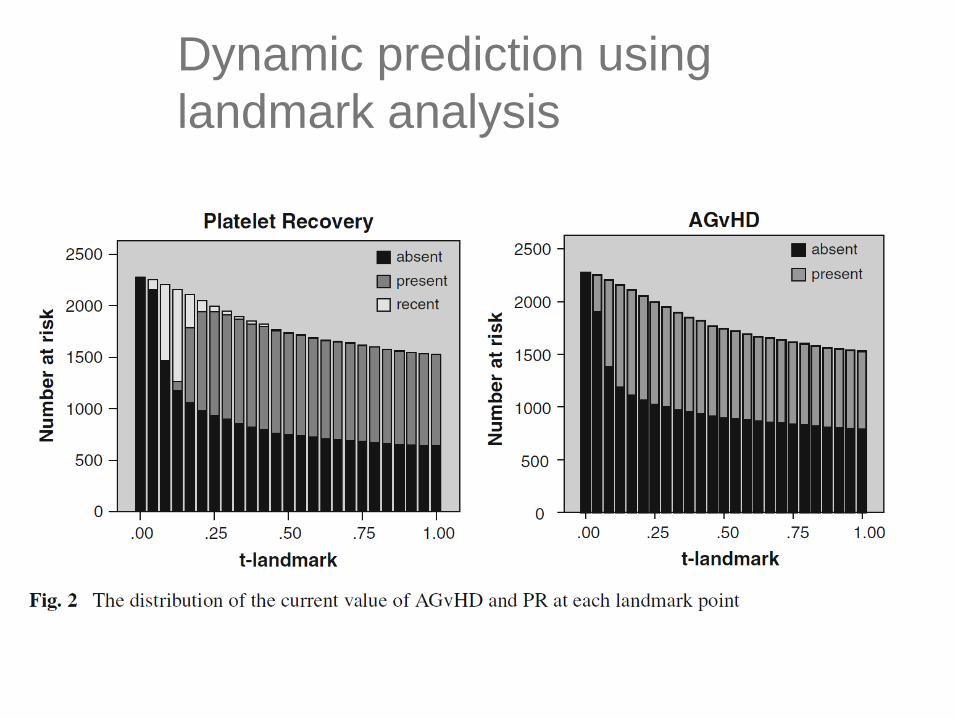
Dynamic prediction using
landmark analysis

Landmarking: covariate regression coefficients
Note, graph is from a different example
Hein Putter. The landmark approach, Dynamic prediction workshop, Bordeaux 2013

Multi-State Markov model

Parameter estimates of the multi-
state model

Modelling alternatives

Markov model for ACR20 responder,
non-responder and dropout
Lacroix et al., Clin Pharmacol Ther, 2009
1Responder
0Non-
Responder
2Dropped
out
Pr00 of remaining
non-responder
Pr11 of remaining
responderPr10 of becoming
responder
Pr01 of becoming
non-responder
Pr12 of
dropping out
Pr02 of
dropping out

Sleep state model
Karlsson et al., Clin Pharmacol Ther 2000
Time in stageP
robabili
ty o
f
falli
ng a
sle
ep
Concentration
Pro
babili
ty o
f
falli
ng a
sle
ep
Time of night
Pro
babili
ty o
f
falli
ng a
sle
ep

Stomach
F = proximal stomach
A = distal stomach
Small intestine
SI:1-4 transit
Colon
AC = Ascending colon
TC = Transverse colon
DC = Descending colon
KSI
FA
SI:1 SI:2 SI:3 SI:4
AC
KFA
KAF
KAS
KSI KSI KSI
TCDC
KTC KAC
SCR
KDC
Sigmoid colon /
Rectum
Bergstrand et al., CPT 2009
Gastro-intestinal tablet transit model

Competing risks analysis of the Finnish
diabetes prevention study
Ibrahim et al., PAGE 2019
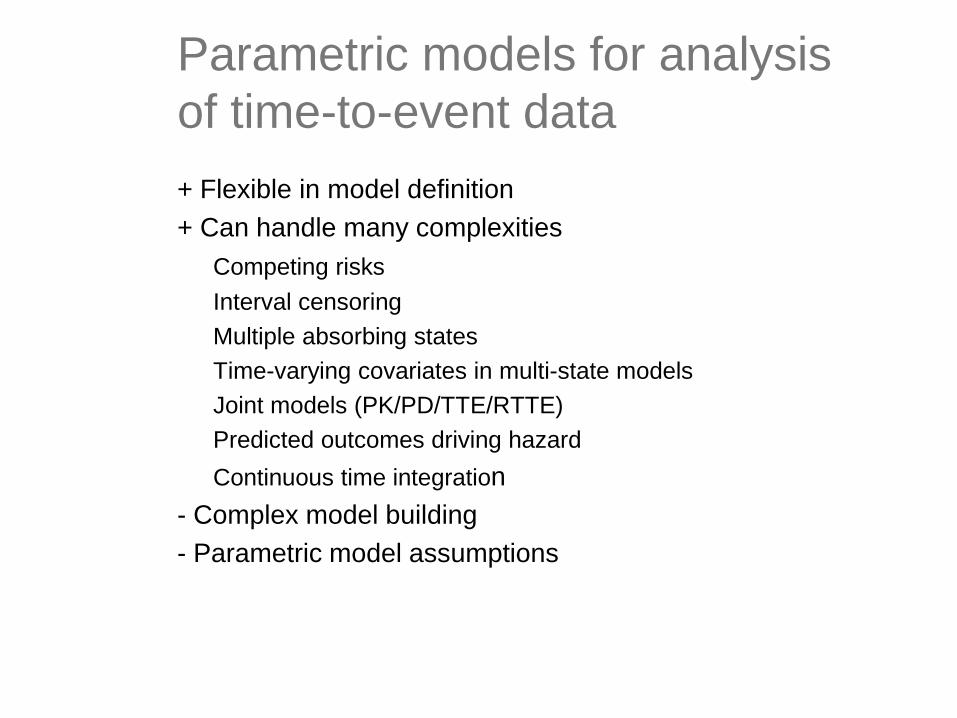
Parametric models for analysis
of time-to-event data
+ Flexible in model definition
+ Can handle many complexities
Competing risks
Interval censoring
Multiple absorbing states
Time-varying covariates in multi-state models
Joint models (PK/PD/TTE/RTTE)
Predicted outcomes driving hazard
Continuous time integration
- Complex model building
- Parametric model assumptions

Tumor growth inhibition model (TGI)
𝑑𝑆𝐿𝐷
𝑑𝑡= 𝑘𝐺𝑅𝑂𝑊 ∙ 𝑆𝐿𝐷 𝑡 − 𝑘𝐷𝑅𝑈𝐺 ∙ 𝐸𝑥𝑝𝑜𝑠𝑢𝑟𝑒 𝑡 ∙ 𝑒−𝜆∙𝑡 ∙ 𝑆𝐿𝐷 𝑡
𝑑𝐷𝑜𝑐𝑒𝑡𝑎𝑥𝑒𝑙
𝑑𝑡= −𝑘𝐾𝑃𝐷 ∙ 𝐷𝑜𝑐𝑒𝑡𝑎𝑥𝑒𝑙 𝑡
𝐸𝑥𝑝𝑜𝑠𝑢𝑟𝑒 𝑡 = 𝐷𝑜𝑐𝑒𝑡𝑎𝑥𝑒𝑙 𝑡
Claret et al., J Clin Oncol 2009.
Bender et al., PAGE 2017

Mixture multi-state model (MMSM)
Progression
107
Stable
0
Decrease
14
Death
340
Second line
88
225
314
10
180
155
31
144
Sreenath Krishnan, Lena Friberg, Mats Karlsson, for illustration
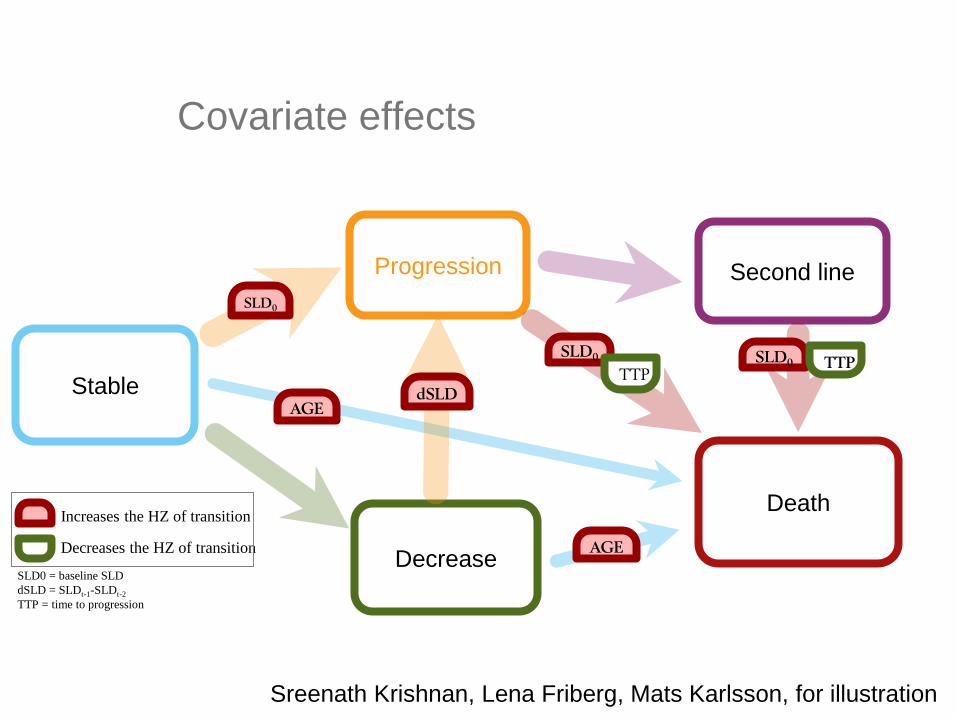
Covariate effects
Progression
Stable
Decrease
Death
Second line SLD0
SLD0
dSLD
TTP
AGE
SLD0 TTP
AGE
Increases the HZ of transition
Decreases the HZ of transition
SLD0 = baseline SLD
dSLD = SLDt-1-SLDt-2
TTP = time to progression
Sreenath Krishnan, Lena Friberg, Mats Karlsson, for illustration
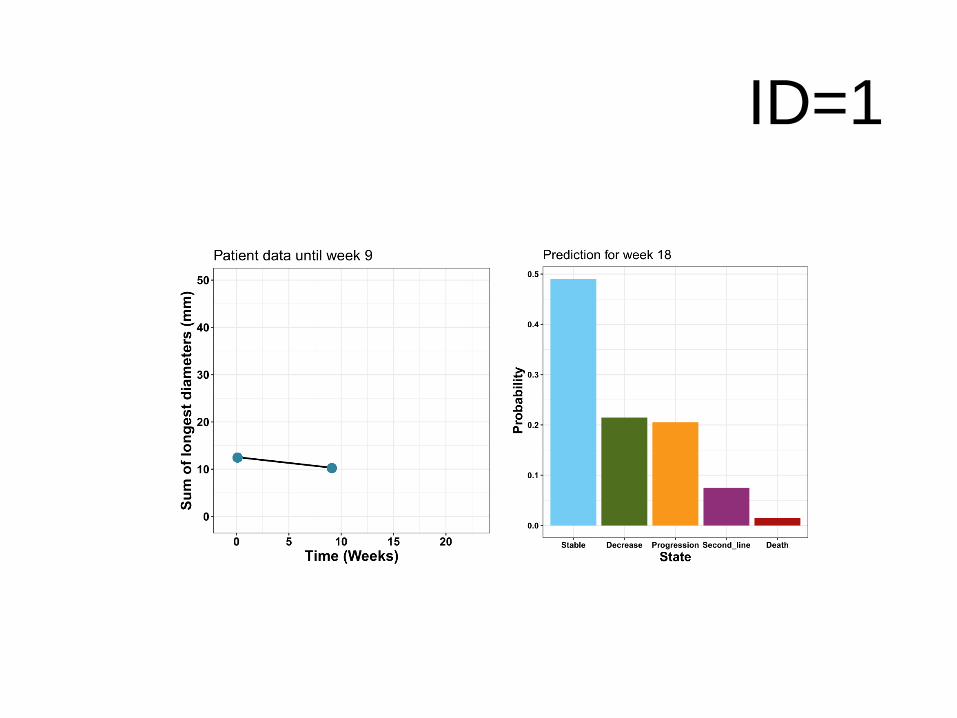
ID=1

ID=1

ID=1

ID=1
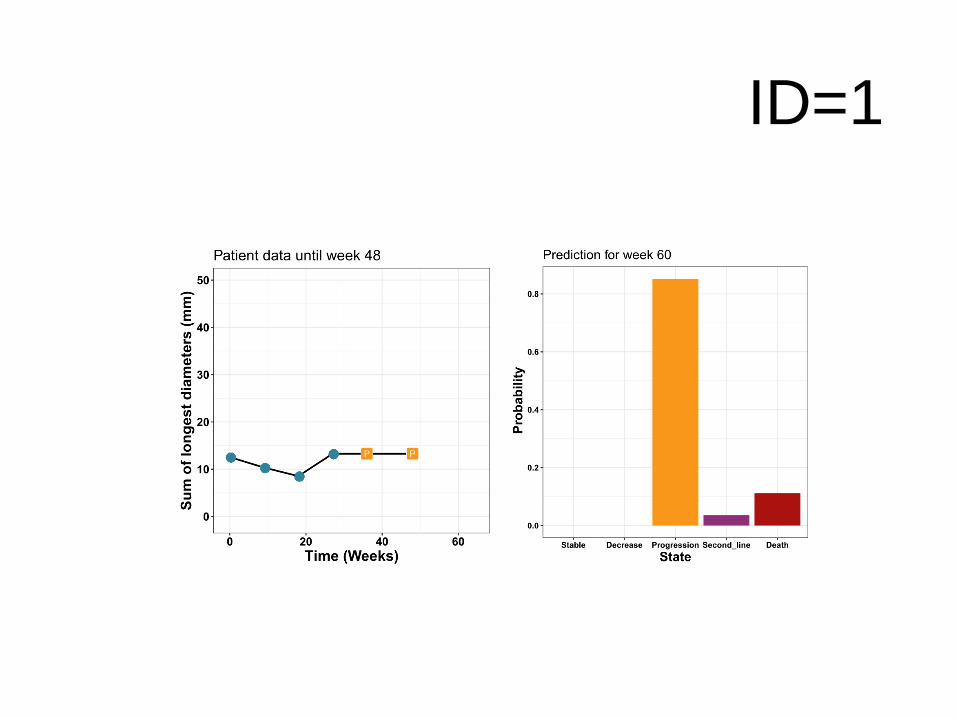
ID=1

ID=1
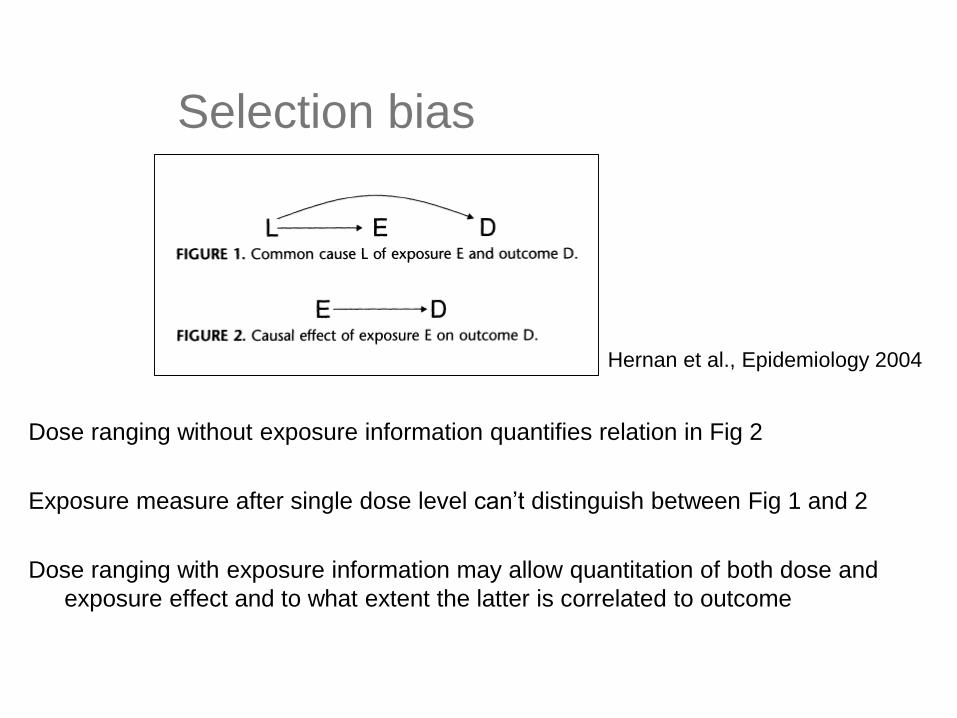
Selection bias
Dose ranging without exposure information quantifies relation in Fig 2
Exposure measure after single dose level can’t distinguish between Fig 1 and 2
Dose ranging with exposure information may allow quantitation of both dose and
exposure effect and to what extent the latter is correlated to outcome
Hernan et al., Epidemiology 2004

Trastuzemab – clinical development
Shah et al., J Clin Oncol 2017Bang et al., Lancet 2010
Cosson et al., Cancar Clin Pharmacol 2014


Lyuak et al., Clin Transl Sci (2019) 12, 481-489

Analyzed 69 Pfizer dose-ranging studies
68 of these studies were well described by an Emax model
0
0.1
0.2
0.3
0.4
0.5
0.6
0.7
0.8
0.9
1
0 5 10 15 20
Effe
ct
Dose
Emax model properties:
D90/D10 = 81

Comparison of aspects
for exposure-response
Non-oncology
Small molecule
Oncology
mAb
Dose-range for efficacy wide / moderate none / narrow
Drug PK correlated with
disease
seldom often
Elimination routes renal / hepatic target-mediated / FcRn
receptor levels / cachexia
/ hypermetabolism / ADAs
/…
Time-varying PK seldom / well understood often / poorly understood


Variability in exposure
2-arm dose-ranging versus CL
Drug %CV CL
Nivolumab 43%
Ipilimumab 40%
Tremelimumab 38%
Docetaxel 41%
0%
20%
40%
60%
80%
100%
120%
0 2 4 6 8
Exp
osu
re v
aria
bili
ty (
%C
V)
[High dose - Low dose]/[low dose]

Summary
To addressing immortality bias, use
time-varying covariates
dynamic predictions using landmarking
parametric models
Selection bias in exposure response analysis
If only one dose level, don’t trust exposure
response analyses
Clinical trial simulations may be effective to
learn about (modest) dose-ranging studies

Thank you!

Milligan et al. Clin Pharmacol Ther 93:502-14 (2014)
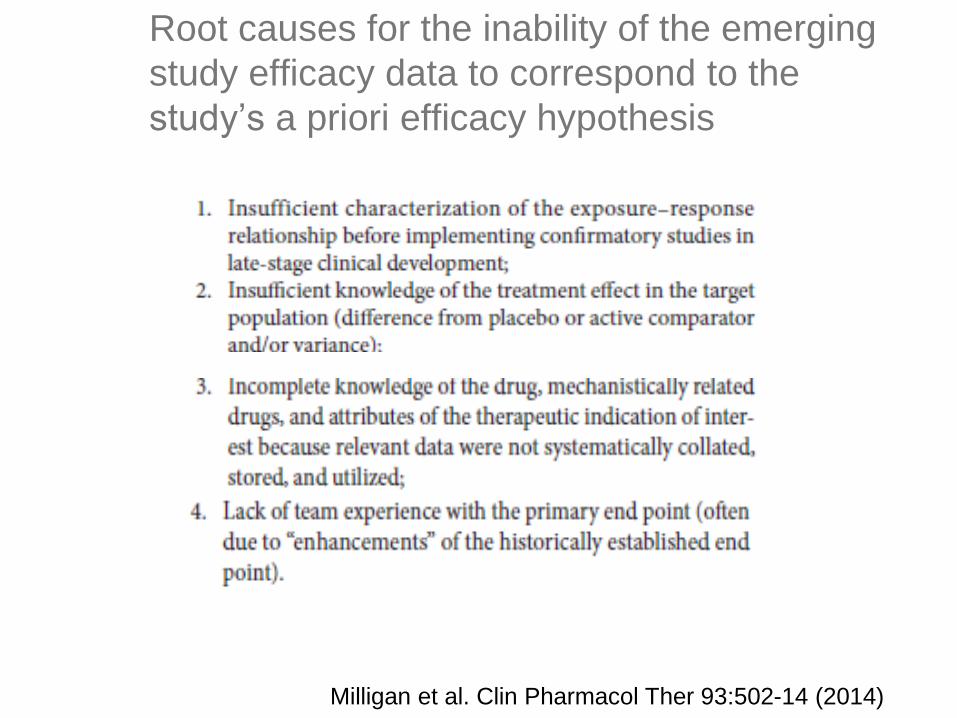
Root causes for the inability of the emerging
study efficacy data to correspond to the
study’s a priori efficacy hypothesis
Milligan et al. Clin Pharmacol Ther 93:502-14 (2014)

Implementation dose-finding trials
Milligan et al. Clin Pharmacol Ther 93:502-14 (2014)

Causes of Compound Failure: 2007 -
2010 and 2013 - 2015
Phase 2 Phase 3
Arrowsmith J. Nat Rev Drug Discov 2011;10: Feb; Arrowsmith J. Nat Rev Drug Discov 2011;10: May; Harrison RK. Nat Rev Drug Discov 2016;15:817-8
Phase 2 Phase 3
(Lack of) Efficacy
continues to be the
major cause of failure