Embed Size (px)
Citation preview

(IMPACT OF FORTIGN INSTITUTIONAL INVESTORS ON INDIAN MARKET)
1

2

PREFACE
The Indian capital markets may appear mysterious and puzzling to many foreign
investors and even to domestic Indian investor. To my knowledge, however, there is no
current information material that comprehensively addresses invertors’ concerns about
this rapidly growing market. I have no power to solve its inherent problems; but what I
have tried to do is shed some light on practices and rules in the Indian market, including
problematic ones, so that foreign as well as Indian investors can look at the market more
rationally for their portfolio investments in Indian securities.
The Indian financial system is a vast universe. This universe is regulated and supervised
by two government agencies under the Ministry of Finance.
(i). The Reserve bank of India, India’s Central Bank, and
(ii). The Securities Exchange Board of India, the country’s capital market regulator.
All parts of the system are interconnected with one another, and the jurisdictions of the
central bank and the capital market regulator overlap in some fields of Indian financial
activities. This research focuses on the FII (foreign institutional investor) flows to Indian
capital market, its portfolio investment and determinants of investing in Indian market
and deciding the portfolio preferences. This research also gives the suggestions on the
investment avenues available for the FII in Indian with the help of Gap analysis.
The Indian capital market changes amazingly quickly. Some part of this research may be
out-of-date by the time of completion. Therefore, please do not assume that the
information in this research continues to be correct or remains unchanged. This research
is originally focused on foreign investor and its role and impact on Indian capital market.
3

SYNOPSIS
TITLE OF THE PROJECT: - Foreign institutional investors and Indian capital
market (its determinants and avenues of investment).
OBJECTIVE OF THE RESEARCH: - To study the role and impact foreign institutional
investor on Indian capital market and find out the factors that determines the flow of FIIs.
CHAPTER 1: INTRODUCTION
Since the beginning of the liberalization of investment policies. Flows FIIs in India
steadily grown in importance. Paper covers the flow of FII in India and their relationship
with other economic variables. In this paper I’m particularly covering the relationship
between FII and stock market. It covers the investment trend of FII and the various
issues related to the FII investment in the domestic market.
BACKGROUND: -
The national common minimum programmed of the present UPA government envisages policies, which encourage foreign institution investors (FIIs), but reduce exposure to the Indian financial system to speculative capital flows
An FII means an entity established or incorporated outside India, which proposes to
undertake investment in India; while an FII sub-account includes those foreign corporate,
foreign individuals, institutions, funds or portfolios established or incorporated outside
India on whose behalf investments are proposed to be made in India by an FII
4
CHAPTER II: RESEARCH METHODOLOGY
Research is often described as active; diligent and systematic process of inquiry aimed at
discovering, interpreting and revising facts. This intellectual investigation produces a
greater understanding of events, behaviors or theories and makes practical application
through laws and theories. In other words we can say, the purpose of research is to
discover answers to the questions through the application of scientific procedures. The
main aim of research is to find out the truth which is hidden and which has not been
discovered as yet.
Research methodology is a way to systematically solve the research problem. It may be
understood as a science of studying how research is done scientifically. In it we study the
various steps that are generally adopted by a researcher in studying his research problem
along with the logic behind them.
OBJECTIVE: -The main objective of the research is to show that Supply Chain
Management is the key tool in the brand building of any company. Especially in the
sectors like retailing, FMCG, consumer durables etc. it is the key differentiator among
strong brands and weak brands.
To carry out my project I have used the exploratory research.
Exploratory research includes surveys and fact-finding enquiries of different kinds. The
major purpose of exploratory research is to explore the facts which are existing but new
for everyone.The main characteristic of this method is that the researcher has no control
over the variables; he can only report what has happened or what is happening. It is also
called as ex post facto research. Most ex post facto research projects are used for
descriptive studies in which researcher seeks to measure such items as, for example,
frequency of shopping, preferences of people, or similar data.
DATA SOURCE: - To carry out the project work I have consulted the various secondary
sources of data such as Magazines, Journals and websites.
SCOPE OF THE STUDY: - The research will be covering whole capital market and
investment made by FIIs. This research is helpful for investors who made the large
investment in the market and too much bothered about the volatility because of FII.
5

CHAPTER IV: DESCRIPTIVE WORK
The subtopics, which will be covered as a part of the study can be given in the following
points:
Flow of FII in India.
Regulatory information about FII.
Liberalization of foreign investment policy.
Flow of FII: its nature and causes.
Determinants of flow of FII.
CHAPTER III: DATA ANALYSIS AND INTERPRETATION
To analyze the data that are collected from the various secondary sources, I have
implemented some statistical tools. I am using two model, one is for analyzing the
determinants of FII flow and second is for analyzing the avenues of investment for FII
through Cap and Gap analysis.
CHAPTER V: SUGGESTIONS AND CONCLUSION
This section of the report will show all the conclusions and suggestions that I will be
drawing from the above analysis.
6

CONTENTS
i) CERTIFICATE………………………………………………….2
ii) ACKNOWLEDGEMENT ……………………………………...3
iii) PREFACE ……………………………………………………….4
iv) SYNOPSIS ………………………………………………………5
V) CONTENT……………………………………………………….8
CHAPTER 1: INTRODUCTION ……………………………………………….9
i) Background
ii) Research Review
CHAPTER II: RESEARCH METHODOLOGY .………………………...18
i) Research Process
ii) Scope of the study
CHAPTER III: DESCRIPTIVE WORK ……..…………………………….26
i) Regulatory information.
ii) FII flow to India: nature and causes.
iii) Liberalization of foreign institutional investor in India.
iv) Foreign institutional investment in India.
v) Determinants of foreign institutional investor.
CHAPTER IV: DATA ANALYSIS AND INTERPRETATION ……78
i) Conceptual model for analysis
ii) Gap analysis for investment avenues
iii) Findings
CHAPTER V: SUGGESTIONS AND CONCLUSION ……………..94
BIBLIOGRAPHY……………………………………………………….98
ANNEXURE..…………………………………………………………..100
7

CHAPTER – 1
INTRODUCTION OF THE TOPIC
8

INTRODUCTIONForeign investment refers to investments made by the residents of a country in the
financial assets and production processes of another country. After the opening up of the
borders for capital movement, these investments have grown in leaps and bounds. The
effect of foreign investment, however, varies from country to country. It can affect the
factor productivity of the recipient country and can also affect the balance of payments.
In developing countries there has been a great need for foreign capital, not only to
increase the productivity of labor but also because foreign capital helps to build up the
foreign exchange reserves needed to meet trade deficits. Foreign investment provides a
channel through which developing countries can gain access to foreign capital. It can
come in two forms: foreign direct investment (FDI) and foreign institutional investment
(FII). Foreign direct investment involves in direct production activities and is also of a
medium- to long-term nature. But foreign institutional investment is a short-term
investment, mostly in the financial markets. FII, given its short-term nature, can have
bidirectional causation with the returns of other domestic financial markets such as
money markets, stock markets, and foreign exchange markets. Hence, understanding the
determinants of FII is very important for any emerging economy as FII exerts a larger
impact on the domestic financial markets in the short run and a real impact in the long
run. The present study examines the role, impact and relationship of FII’s and Indian
capital market, and also determinants of foreign institutional investment in India, a
country that opened its economy to foreign capital following a foreign exchange crisis.
India, being a capital scarce country, has taken many measures to attract foreign
investment since the beginning of reforms in 1991. Up to the end of January 2003, India
succeeded in attracting a total foreign investment of around U.S.$48 billion out of which
U.S.$12 billion was in the form of FII. These figures show the importance of FII in the
overall foreign investment program. India is in the process of liberalizing its capital
account, and this has a significant impact on foreign investment and particularly on FII,
which affects short-term stability in the financial markets.
Hence, there is a need to determine the push and pull factors behind any change in the
FII, so that we can frame our policies to influence the variables that attract foreign
9

investment. Also, FII has been the subject of intense discussion, as it is held to be
responsible for having intensified the currency crises of the 1990s in East Asia and
elsewhere in the world.
The present study aims to examine the role, impact, determinants and avenues of
investment for FII in the Indian context.
We attempt to analyze the effect of return, risk, and inflation, which in the research are
considered to be the major determinants of FII. The proposed relationship among the
factors (discussed in detail later) is that inflation and risk in the domestic country and
return in the foreign country adversely affect the FII flowing to the domestic country,
whereas inflation and risk in the foreign country and return in the domestic country have
a favorable effect on the flow of FII. In the next section we will briefly consider the
existing studies of this topic. In Section III, we discuss the theoretical model. Section IV
briefly assesses the trends in FII in India. The database and methodology adopted in this
study are explained in Section V. In Section VI, we discuss the estimated results of the
study, and appropriate conclusions are drawn in the last section.
There is another concept called “foreign portfolio investments” (FPI), which is a broader
one compared to FII. Foreign portfolio investments include FII and other components
like GDR (Global Depositary Receipts), ADR (American Depositary Receipts), and off-
shore funds and others. As the components in FPI other than FII are not dependent on
market forces and they are not volatile, we consider only FII in this study.
10

THE BACKGROUND
An FII means an entity established or incorporated outside India, which proposes to
undertake investment in India; while an FII sub-account includes those foreign corporate,
foreign individuals, institutions, funds or portfolios established or incorporated outside
India on whose behalf investments are proposed to be made in India by an FII
The national common minimum programmed of the present UPA government envisages
policies, which encourage foreign institution investors (FIIs), but reduce exposure to the
Indian financial system to speculative capital flows.
The character of global capital flows to developing countries underwent significant
changes on many counts during the 'nineties. By the time the East Asian financial crisis
surfaced, the overall size of the flows more than tripled. It stood at US$ 100.8 bn. in 1990
and rose to US$ 308.1 bn. by 1996. The increase was entirely due to the sharp rise in the
flows under private account that rose from US$ 43.9 bn. to 275.9 billion during the same
period. In relative terms the percentage of private account capital flows increased from
43.55 to 89.55 per cent. Simultaneously, the Official Development Assistance (ODA),
declined both in relative and absolute terms. All the main components of the private
account capital transfers, namely, (a) commercial loans, (b) foreign direct investments
(FDI), and (c) foreign portfolio investments (equity and bonds) (FPI) recorded significant
increases. Portfolio flows increased at a faster rate than direct investments on private
account. As a result, starting with a low level of 11.16 per cent, the share of capital flows
in the form of portfolio investments quadrupled to reach 37.22 per cent in 1996 reflecting
the enhanced emphasis on private capital flows with portfolio investments forming the
second important constituent of the flows during the 'nineties. In this process multilateral
bodies led by the International Finance Corporation (IFC) played a major role.
Following the East Asian financial crisis, initially there was a slow down followed, by a
decline in private capital flows. While bonds and portfolio equity flows reacted quickly
and declined in 1997 itself, loans from commercial banks dropped a year later in 1998.
Decline in FDI was also delayed. But the fall in FDI was quite small compared to the
11
other three major forms of private capital flows. While flows on official account
increased, following the crisis, they continue to constitute only a small portion of the total
flows. Thus, starting with the resolve by the developed countries to provide one per cent
of their GNP as developmental aid, the industrialised world preferred to encourage
private capital transfers through direct investments instead of official assistance. The
declining importance of official development finance is attributed to budgetary
constraints in donor countries and the optimism of private investors in the viability of the
developing countries.
12

Portfolio investments spread risk for foreign investors, and provide an opportunity to
share the fruits of growth of developing countries, which are expected to grow faster.
Investing in emerging markets is expected to provide a better return on investments for
pension funds and private investors of the developed countries. For developing countries,
foreign portfolio equity investment has different characteristics and implications
compared to FDI. Besides supplementing domestic savings, FDI is expected to facilitate
transfer of technology, introduce new management and marketing skills, and helps
expand host country markets and foreign trade. Portfolio investments supplement foreign
exchange availability and domestic savings but are most often not project specific. FPI,
are welcomed by developing countries since these are non-debt creating. FPI, if involved
in primary issues, provides critical risk capital for new projects. Since FPI takes the form
of investment in the secondary stock market, it does not directly contribute to creation of
new production capabilities. To enable FPI flows which prefer easy liquidity, multilateral
bodies, led by the International Finance Corporation (IFC), have been encouraging
establishment and strengthening of stock markets in developing countries as a medium
that will enable flow of savings from developed countries to developing countries.
FPI, it is expected, could help achieve a higher degree of liquidity at stock markets,
increase price-earning (PE) ratios and consequently reduce cost of capital for investment.
FPI is also expected to lead to improvement in the functioning of the stock market, as
foreign portfolio investors are believed to invest on the basis of well-researched strategies
and a realistic stock valuation. The portfolio investors are known to have highly
competent analysts and access to a host of information, data and experience of operating
in widely differing economic and political environments. Host countries seeking foreign
portfolio investments are obliged to improve their trading and delivery systems, which
would also benefit the local investors. To retain confidence of portfolio investors’ host
countries are expected to follow consistent and business friendly liberal policies. Having
access to large funds, foreign portfolio investors can influence developing country capital
markets in a significant manner especially in the absence of large domestic investors.
Portfolio investments have some macroeconomic implications. While contributing to
build-up of foreign exchange reserves, portfolio investments would influence the
13

exchange rate and could lead to artificial appreciation of local currency. This could hurt
competitiveness. Portfolio investments are amenable to sudden withdrawals and therefore
these have the potential for destabilizing an economy.
The volatility of FPI is considerably influenced by global opportunities and flows from
one country to another. Though it is sometime argued that FDI and FPI are both equally
volatile, the Mexican and East Asian crises brought into focus the higher risk involved in
portfolio investments. The present paper has two objectives. One, to assess the
importance of different types of foreign portfolio investments in capital flows to India.
And two, to understand the investment behaviour of foreign portfolio investors through
an analysis of the portfolios of US-based India specific funds. Such an exercise, it is
hoped, would explain the relationship between foreign institutional investments and
trading pattern in the Indian stock market better than aggregate level analysis.
14

RESEARCH REVIEW
There have been several attempts to explain FII behavior in India. All the existing studies
have found that equity return has a significant and positive impact on FII (Agarwal 1997;
Chakrabarti 2001; Trivedi and Nair 2003). But given the huge volume of investments,
foreign investors can play the role of market makers and book their profits, that is, they
can buy financial assets when the prices are declining, thereby jacking-up the asset
prices, and sell when the asset prices are increasing (Gordon and Gupta 2003). Hence,
there is a possibility of a bidirectional relationship between FII and equity returns.
Following the Asian financial crisis and the bursting of the info-tech bubble
internationally in 1998/99, net FII declined by U.S.$61 million. This, however, exerted
little effect on equity returns. This negative investment might possibly disturb the long-
term relationship between FII and other variables such as equity returns, inflation, and so
on. Chakrabarti (2001) has perceived a regime shift in the determinants of FII following
the Asian financial crisis and found that in the pre–Asian crisis period, any change in FII
had a positive impact on equity returns. But it was found that in the post–Asian crisis
period, a reverse relationship has been the case, namely, that change in FII is mainly due
to change in equity returns. This is a fact that needs to be taken into account in any
empirical investigation of FII. Investments, either domestic or foreign, depend heavily on
risk factors. Hence, while studying the behavior of FII, it is important to consider the risk
variable. Further, realized risk can be divided into ex-ante and unexpected risk. Ex-ante
risk is an observed component and is negatively related to FII. But the relationship
between unexpected risk and FII is obscure. Therefore, while examining the impact of
risk on FII, one needs to separate the unobserved component from the realized risk.
Trivedi and Nair (2003) have used only the realized risk. Another possible determinant of
FII is the operation of foreign factors such as returns in the source country’s financial
markets and other real factors in the source economy. So far, however, studies have
found that both return in the source country stock market and the inflation rate have not
exerted any impact on FII. Agarwal (1997) found that world stock market capitalization
had a favorable impact on the FII in India.
15

A survey of the literature shows that existing studies do not account for volatility, which
can be expected in most of the monthly financial time series data. Yet given the increase
in financial market integration, both domestically and in foreign financial markets,
accounting for volatility is unavoidable. Further, the existing studies either do not
incorporate risk in foreign and domestic markets or make use of realized risk, an
approach that does not always yield robust results.
This is because standard deviation/variance (realized risk variable) increases irrespective
of the direction in which stock returns move, while movement of FII is determined by
bull/bear phases. It is preferable, therefore, to divide the realized risk into ex-ante risk
and unpredictable risk. Since investment in stock markets is sentiment driven, and is
affected more or less by everything, the crucial task is to identify a few critical
determinants. This research makes a modest attempt to explore the relation between FII
and its pivotal determinants, for the particular case of India. More specifically, a few
important variables believed to be affecting FII are chosen and then a theoretical model is
built and empirically tested for India. The focus of this research is the study of the critical
determinants of FII, so as to provide a better understanding of FII behavior that helps
while liberalizing the capital account and investment avenues for FII in Indian capital
market. We hope that the study will be important from a policy perspective, as FII
constitutes an important element for the smooth functioning of domestic financial
markets.
16

CHAPTER – 2
RESEARCH MATHEDOLOGY
17

RESEARCH MATHEDOLOGY
The purpose of research is to discover answers to the questions through the application of
scientific procedures. The main aim of research is to find out the truth which is hidden
and which has not been discovered as yet. Though each research study has its own
specific purpose, we may think of research objectives as falling into a number of
following broad categories:
1) To gain familiarity with a phenomenon or to achieve new insights into it.
2) To portray accurately the characteristics of a particular individual, situation or
a group.
3) To determine the frequency with which something occurs or with which it is
associated with something else.
4) To test a hypothesis of a casual relationship between variables.
Research methodology is a way to systematically solve the research problem. It may be
understood as a science of studying how research is done scientifically. In it we study the
various steps that are generally adopted by a researcher in studying his research problem
along with the logic behind them.
Research methodology has many dimensions and research methods do constitute a part of
the research methodology. The scope of research methodology is wider than that of
research methods. Thus, when we talk of research methodology we not only talk of the
research methods but also consider the logic behind the methods we use in the context of
our research study and explain why we are using a particular method or technique and
why we are not using others so that research results are capable of being evaluated either
by the researcher himself or by others. Why a research study has been undertaken, what
data have been collected and what particular method has been adopted, why particular
technique of analyzing data has been used and a host of similar other question are usually
answered when we talk of research methodology concerning a research problem or study.
18

Research Process
Research process consists of series of actions or steps necessary to effectively carry out
research and the desired sequencing of these steps.
Review theLiterature Feed forward
Feed back
A brief description of the above steps is stated below:
1) Formulating the research problem
At the very outset the researcher must single out the problem he wants to study,
i.e. that is he must decide the general area of interest or aspect of a subject matter that he
would like to inquire into. Initially the problem may be stated in a broad general way and
then the ambiguities, if any, relating to the problem be resolved. Then the feasibility of a
particular solution has to be considered before a working formulation of the problem can
be set up. In fact, formulation of the problem often follows a sequential pattern where a
number of formulations are set up, each formulation more specific than the preceding
one, each one phrased in more analytical terms, and each more realistic in terms of the
available data and resources. In this research the problem that I have formulated is ‘role
and impact of foreign institutional investor on Indian capital market.’
19
Define research problem
Review concepts & theories
Review previous research & findings
Formulate hypotheses Design
research
Interpret and report
Analyze data
Collect data

2) Extensive literature survey
Once the problem is formulated, a brief summary of it should be written down. At
this juncture I have undertaken extensive literature survey connected with the problem.
The earlier studies, which are similar to the study in hand have been carefully studied.
3) Development of the working hypothesis
After extensive literature survey, researcher should state in clear terms the
working hypothesis or hypotheses. Working hypothesis is tentative assumption made in
order to draw out and test its logical or empirical consequences. The manner in which
research hypothesis are developed is particularly important since they provide the focal
point for research. They also affect the manner in which tests must be conducted in the
analysis of the data and indirectly the quality of data, which is required for the analysis.
4) Preparing the research design
The research problem having been formulated in clear-cut terms, the researcher will be
required to prepare a research design i.e. he will have to state the conceptual structure
within which research would be conducted. In other words the function of research
design is to provide for the collection of relevant evidence with minimal expenditure of
effort, time and money.
The preparation of the research design, involves usually the consideration of the
following:
a) The means of obtaining the information:
b) The availability and skills of the researcher and his
staff;
c) Explanation of the way in which selected means of
obtaining information will
be organized and the reasoning leading to the selection;
20
d) The time available for research; and
e) The cost factor relating to research.
5) Determining sample design
All the items under consideration in any field of inquiry constitute a ‘universe’ or
‘population’. Quite often we select only a few items from the universe for our study
purposes. The items so selected constitute what is technically called a sample.
The researcher must decide the way of selecting a sample or what is popularly known as
the sample design. In other words, a sample design is a definite plan determined before
any data are actually collected for obtaining a sample from a given population
6) Collecting the data
In dealing with any real life problem it becomes necessary to collect data that are
appropriate. There are several ways of collecting the appropriate data.
Primary data can be collected either through experiment or through survey.but in case of
survey; data can be collected by any one of the following ways:
a) By observation.
b) Through personal interview.
c) Through telephone interview.
d) By mailing of questionnaires.
e) Through schedules.
The researcher should select one of these methods of collecting the data taking into
consideration the nature of investigation, objective and scope of the inquiry.
21

7) Execution of the project
Execution of the project is a very important step in the research process. The researcher
should see that the project is executed in a systematic manner and in time. A careful
watch should be kept for unanticipated factors in order to keep the survey as much
realistic as possible.
8) Analysis of the data
After the data have been collected, the researcher turns to the task of analyzing them.the
analysis of data requires a number of closely related operations such as establishment of
categories, the application of these categories to raw data through coding, tabulation and
then drawing statistical inferences.
Analysis work after tabulation is generally based on the computation of various
percentages, coefficients, etc. in brief the researcher can analyse the collected data with
the help of various statistical tools.
9) Hypothesis-testing
After analyzing the data, the researcher is in a position to test the hypothesis, if any, he
had formulated earlier. Do the facts support the hypothesis or they happen to be contrary?
This is the usual question, which should be answered while testing the hypothesis.
10) Generalisations and interpretation
If a hypothesis is tested and upheld several times, it may be possible for the
researcher to arrive at generalization, i.e., to build a theory. As a matter of fact, the real
value of research lies in its ability to arrive at certain generalization.
22

11) Preparation of the report
Finally the researcher has to prepare the report of what has been done by him.
Writing of report must be done with great care keeping in view the following:
1) In its preliminary pages the report should carry the title and data
followed by acknowledgements and foreword.
2) Report should be written in a concise and objective style.
3) Charts and illustrations in the main report should be used only if
they present the information more clearly and forcibly.
23

SCOPE OF THE STUDY
A number of studies in the past have observed that investments by FIIs and the
movements of Sensex are quite closely correlated in India and FIIs wield significant
influence on the movement of sensex. There is little doubt that FII inflows have
significantly grown in importance over the last few years. In the absence of any other
substantial form of capital inflows, the potential ill effects of a reduction in the FII flows
into the Indian economy can be severe. From the point of attracting foreign capital, the
initial expectations have not been realised. Investment by FIIs directly in the Indian stock
market did not bring significantly large amount compared to the GDR issues. GDR
issues, unlike FII investments, have the additional advantage of being project specific and
thus can contribute directly to productive investments. FII investments, seem to have
influenced the Indian stock market to a considerable extent.
Results of this study show that not only the FIIs are the major players in the domestic
stock market in India, but their influence on the domestic markets is also growing. Data
on trading activity of FIIs and domestic stock market turnover suggest that FII’s are
becoming more important at the margin as an increasingly higher share of stock market
turnover is accounted for by FII trading. Moreover, the findings of this study also indicate
that Foreign Institutional Investors have emerged as the most dominant investor group in
the domestic stock market in India. Particularly, in the companies that constitute the
Bombay Stock Market Sensitivity Index (Sensex), their level of control is very high. Data
on shareholding pattern show that the FIIs are currently the most dominant non-promoter
shareholder in most of the Sensex companies and they also control more tradable shares
of Sensex companies than any other investor groups.
24

CHAPTR – 3
DESCRIPTIVE WORK ON SUBTOPICS
25

REGULATORY INFORMATION
FII flows to India formally began in September 1992 under the foreign portfolio
investment (FPI) scheme, when the Government of India issued the Guidelines for
Foreign Institutional Investment. In November 1995, the Securities and Exchange Board
of India (SEBI) 6 enforced the Securities and Exchange Board of India (Foreign
Institutional Investors) Regulations, 1995 (henceforth, referred to as SEBI FII
Regulations) to regulate matters relating to FII investment flows. At present, investment
by FIIs is jointly regulated by this and Regulation 5(2) of the Foreign Exchange
Management Act (FEMA), 1999. The SEBI regulations require FIIs to register with the
SEBI and also obtain approval from the Reserve Bank of India (RBI) under the FEMA
for securities trading, operating foreign currency and rupee bank accounts and remitting
and repatriating funds. In the entire process of FII registration and regulation, the SEBI
acts as the nodal authority and once SEBI registration has been obtained, an FII does not
require any further permission for trading securities or for transferring funds into or out
of India. The SEBI FII Regulations and RBI policies are amended and modified from
time to time in response to the gradual maturing of the Indian financial market and
changes taking place in the global economic scenario. Such modification, needless to
mention, is required to be done to ensure quantitative as well as qualitative improvements
in the portfolio flows through the FII route, as India has to compete with other Asian
nations and other emerging markets of the world for global capital inflows.
In India, FII investment (in shares and debentures) started in January 1993. FII
regulations by the SEBI were first introduced on November 14, 1995 in the form of the
SEBI FII Regulations. Over the years, the SEBI and the RBI together, through a variety
of measures, are trying to improve the scope, coverage and quality of FII investment.
These measures include (a) widening the array of instruments in which
FIIs are allowed to trade, (b) expanding the list of the types of funds that can be
registered as FIIs in India and the entities on behalf of whom they can invest, (c) raising
the caps for FII investment in different sectors and companies, (d) easing the norms for
26

FII registration, reducing procedural delays, lowering fees, etc., and (e) mandating stricter
disclosure norms, etc. A summary of the major regulatory changes relating
to FIIs along with their reference dates is presented in Table 1.
The hypothesis underlying the present empirical analysis is essentially that
both strengthening of the regulatory infrastructure by the SEBI and the RBI
on the one hand and further liberalisation and easing of regulatory curbs for
FIIs at various time points in history on the other have had a positive impact
on the flows to the national stock markets.
27

28

29

30

31

THE PRE- AND POST-FII REGULATION PERIODS
The SEBI FII Regulations, introduced in mid-November 1995, formally set forth in
detail:
• Conditions and procedures for grant or renewal of certificates to FIIs (and their sub-
accounts) permitting them to operate directly in the Indian stock market. (This includes
the eligibility criteria for being permitted to be registered as an FII in India; verification
of whether it is legally permissible for the applicant to invest in securities outside the
country of its incorporation; whether the applicant has been registered with any statutory
authority in that country; and whether any legal proceeding has been initiated by any
statutory authority against the applicant.)
• Conditions for and restrictions on investment, which include the type of instruments an
FII is allowed to invest in, and the applicable caps or ceilings in respect of different types
of instruments (or sectors), etc.
• General obligations and responsibilities, which include appointment of a domestic
custodian; appointment of a branch of a bank approved by the RBI for opening of foreign
currency denominated accounts and special non-resident rupee accounts; maintenance of
proper books of accounts, records, etc.
• Procedure for action in case of default and suspension/cancellation of certificate.
• The fees and taxes to be paid.
• Provisions for appeal in case of any grievances.
32

It is obviously of interest to see whether the introduction of the SEBI FII Regulations had
any immediate repercussions on FII equity investments, causing a major gap between the
pre- and post- regulation flows. We use the monthly data series of FII net equity inflows
(FIINM) to study this impact. However, in the post-regulation period, the Asian currency
crisis had a very strong negative effect on global capital flows, particularly to emerging
Asian economies. In order to filter out this effect, we compare our pre-regulation period
with the post-regulation period up to the beginning of the Asian crisis (which is taken to
be up to June 1997). Comparing the monthly inflows prior to the introduction of the SEBI
Regulations with the corresponding post regulation (pre-Asian crisis) period inflows, it is
easy to see that the average (and median) monthly inflows during these two sub-periods
were quite different, with the post-regulation period having a much higher average (and
median) inflow. A research confirms that the difference between the means (and
medians) of the two sub-periods are indeed statistically significant with the post-
regulation period experiencing much higher flows on an average. Next we consider the
result of a Chow break point test, which helps us detect any significant shift in the flows
immediately after the introduction of the SEBI FII Regulations. To carry out this test, we
regress the monthly net equity flows (FIINM) (for the 54-month preceding the Asian
crisis) on returns on the BSE Sensex (BSER). The result of the Chow test strongly
suggests existence of a structural break in the time series data on FII flows under
consideration at the time point of the introduction of the SEBI Regulations in November
1995, thus confirming that the introduction of a comprehensive set of laws to govern FII
flows had definitely helped to attract more foreign portfolio investment flows into the
country until the onset of the Asian financial crisis.
33

FII FLOWS TO INDIA: NATURE AND CAUSES
Portfolio investment flows from industrial countries have become increasingly important
for developing countries in recent years. The Indian situation has been no different. In the
year 2000-01 portfolio investments in India accounted for over 37% of total foreign
investment in the country and 47% of the current account deficit. The corresponding
figures in the previous year were 59% and 64% respectively. A significant part of these
portfolio flows to India comes in the form of Foreign Institutional Investors’ (FIIs’)
investments, mostly in equities. Ever since the opening of the Indian equity markets to
foreigners, FII investments have steadily grown from about Rs. 2600 crores in 1993 to
over Rs.11,000 crores in the first half of 2001 alone. Their share in total portfolio flows
to India grew from 47% in 1993-94 to over 70% in 1999-20001. The nature of the foreign
investor’s decision-making process, which lies at the heart of the portfolio flows, is
briefly described bellow.
The International Portfolio Investor’s decision-making problem
International portfolio flows, as opposed to foreign direct investment (FDI) flows, refer to
capital flows made by individuals or investors seeking to create an internationally
diversified portfolio rather than to acquire management control over foreign companies.
Diversifying internationally has long been known as a way to reduce the overall portfolio
risk and even earn higher returns. Investors in developed countries can effectively
enhance their portfolio performance by adding foreign stocks particularly those from
emerging market countries where stock markets have relatively low correlations with
those in developed countries. For instance, according to Morgan Stanley Capital
International’s estimates, between 1985 and 1990, an investor holding an all-US portfolio
could improve her returns by over 25% by holding the MSCI world index instead and at
the same time, reduce her risk by about 2%.
The portfolio investor’s problem may be thought of as deciding upon appropriate country
weights in the portfolio so as to maximize portfolio returns subject to a risk constraint, or
in the absence of a pre-specified risk level, to reach the optimum portfolio, that which has
the highest Sharpe ratio, S where the Sharpe ratio is the ratio of expected excess return
(excess over the risk-free rate) to the dispersion (standard deviation) of the return.
34

While it is generally held that portfolio flows benefit the economies of recipient
countries, policy-makers worldwide have been more than a little uneasy about such
investments. Portfolio flows – often referred to as “hot money” – are notoriously volatile
compared to other forms of capital flows. Investors are known to pull back portfolio
investments at the slightest hint of trouble in the host country often leading to disastrous
consequences to its economy. They have been blamed for exacerbating small economic
problems in a country by making large and concerted withdrawals at the first sign of
economic weakness. They have also been held responsible for spreading financial crises
– causing ‘contagion’ in international financial markets. In the wake of the Asian crisis,
prominent economists have, for these reasons, expressed doubts about the wisdom of the
IMF view of promoting free capital mobility among countries.
International capital flows and capital controls have emerged as an important policy
issues in the Indian context as well. The danger of Mexico-style ‘abrupt and sudden
outflows’ inherent with FII flows and their destabilizing effects on equity and foreign
exchange markets have been stressed. Some authors have argued that FII flows have, in
fact, had no significant benefits for the economy at large.
While these concerns are all well-placed, comparatively less attention has been paid so
far to analyzing the FII flows data and understanding their key features. A proper
understanding of the nature and determinants of these flows, however, is essential for a
meaningful debate about their effects as well as predicting the chances of their sudden
reversals. In an attempt to address this lacuna, this paper undertakes an empirical analysis
of FII investment flows to India.
The broad objective of the present paper is to gain a better understanding of the nature
and determinants of FII flows. Towards this end we first take a look at the FII investment
flow data to bring out the key features of these flows. Next we study the relationship
between FII flows and the stock market returns in India with a close look at the issue of
causality. Finally we study the impact of other factors identified in the portfolio flows
literature on the FII flows to India. In all of these investigations we make a distinction
between the pre-Asian crisis period and the post-Asian crisis period to check
if there was a regime shift in the relationships owing to the Asian crisis.
35

The paper is arranged as follows. The next section sketches a brief review of the recent
literature in the area. The third section provides an overview of the nature and sources of
portfolio flows in India pointing out their main characteristics. The fourth section probes
into the possible determinants of FII flows to India. The fifth and final section concludes
with a summary of the major findings and their policy implications.
International Portfolio Flows
International portfolio flows are, as opposed to foreign direct investment, liquid in nature
and are motivated by international portfolio diversification benefits for individual and
institutional investors in industrial countries. They are usually undertaken by institutional
investors like pension funds and mutual funds. Such flows are, therefore, largely
determined by the performance of the stock markets of the host countries relative to
world markets. With the opening of stock markets in various emerging economies to
foreign investors, investors in industrial countries have increasingly sought to realize the
potential for portfolio diversification that these markets present. While the Mexican crisis
of 1994, the subsequent ‘Tequila effect’, and the widespread ‘Asian crisis’ have had
temporary dampening effects on international portfolio flows, they have failed to counter
the long-term momentum of these flows. Indeed, several researchers5 have found
evidence of persistent ‘home bias’ in the portfolios of investors in industrial countries in
the 90’s. This ‘home bias’ – the tendency to hold disproportionate amounts of stock from
the ‘home’ country – suggests substantial potential for further portfolio flows as global
market integration increases over time.
It is important to note that global financial integration, however, can have two distinct
and in some ways conflicting effects on this ‘home bias’. As more and more countries –
particularly the emerging markets – open up their markets for foreign investment,
investors in developed countries will have a greater opportunity to hold foreign assets.
However, these flows themselves, along with greater trade flows will tend to cause
different national markets to increasingly become parts of a more unified ‘global’ market,
reducing their diversification benefits. Which of these two effects will dominate is, of
36

course, an empirical issue, but given the extent of the ‘home bias’ it is likely that for quite
a few years to come, FII flows would increase with global integration.
In recent years, international portfolio flows to developing countries have received the
attention of scholars in the areas of finance and international economics alike. In the 90’s
several papers have explored the causes and effects of cross-border Portfolio investment.
While papers in the finance tradition have focused on the nature and determinants of
portfolio flows from the perspective of the diversifying investors, those from the
international macroeconomics perspective have focused on the recipient country’s
situation and appropriate policy response to such flows. For the present purposes, we
shall focus only on papers that address the issue of portfolio flows exclusively.
Previous research has also attempted to identify the factors behind these capital flows.
The main question is whether capital flew in to these countries primarily as a result of
changes in global (largely US) factors or in response to events and indicators in the
recipient countries like its credit rating and domestic stock market return. The question is
particularly important for policy makers in order to get a better understanding of the
reliability and stability of such flows. The answer is mixed – both global and country-
specific factors seem to matter, with the latter being particularly important in the case of
Asian countries and for debt flows rather than equity flows.
As for the motivation of US equity investment in foreign markets, recent research8
suggest that US portfolio managers investing abroad seem to be chasing returns in
foreign markets rather than simply diversifying to reduce overall portfolio risk. The
findings include the well-documented ‘home bias’ in OECD investments, high turnover
in foreign market investments and that, in general, the patterns of foreign equity
investment were far from what an international portfolio diversification model would
recommend. The share of investments going to emerging markets has been roughly
proportional to the share of these markets in global market capitalization but the volatility
of US transactions were even higher in emerging markets than in other OECD countries.
Furthermore there was no relation between the volume of US transactions in these
markets and their stock market volatility.
The Mexican and Asian crises and the widespread outcry against international portfolio
investors in both cases have prompted analyses of short-term movements in international
37

portfolio investment flows. The question of ‘feedback trading’ has received For the
related literature on international capital flows in general (comprising both FDI and
portfolio flows) considerable attention. This refers to investors’ reaction to recent
changes in equity prices. If a gain in equity values tends to bring in more portfolio
inflows, it is an instance of ‘positive feedback trading’ while a decline in flows following
a rise in equity values is termed ‘negative feedback trading’. Between 1989 and 1996
unexpected equity flows from abroad raised stock prices in Mexico with at the rate of 13
percentage points for every 1% rise in the flows. There has been, however, no evidence
of ‘feedback trading’ among foreign investors in Mexico. In the period leading to the
Asian crisis, on the other hand, Korea witnessed positive feedback trading and significant
‘herding’ among foreign investors. Nevertheless, contrary to the belief in some segments,
these tendencies actually diminished markedly in the crisis period and there has been no
evidence of any ‘destabilizing role’ of foreign equity investors in the Korean crisis. While
FII flows to the Asian Crisis countries dropped sharply in 1997 and 1998 from their pre-
crisis levels, it is generally held that the flows reacted to the crisis (possibly exacerbating
it) rather than causing it.
More recent studies find that the effect of ‘regional factors’ as determinants of portfolio
flows have been increasing in importance over time. In other words portfolio flows to
different countries in a region tend to be highly correlated. Also the flows are more
persistent than returns in the domestic markets. Feedback trading or return-chasing
behavior is also more pronounced. The flows appear to affect contemporaneous and
future stock returns positively, particularly in the case of emerging markets. Finally stock
prices seem to behave on the assumption of persistent portfolio inflows. It is commonly
argued that local investors possess greater knowledge about a country’s financial markets
than foreign investors and that this asymmetry lies at the heart of the observed ‘home
bias’ among investors in industrialized countries. A key implication of recent theoretical
work in this area is that in the presence of such information asymmetry, portfolio flows to
a country would be related to returns in both recipient and source countries. In the
absence of such asymmetry, only the recipient country’s returns should affect these
flows.
38

FOREIGN INSTITUTIONAL INVESTMENT IN INDIA: AN
OVERVIEW
India opened its stock markets to foreign investors in September 1992 and has, since
1993, received considerable amount of portfolio investment from foreigners in the form
of Foreign Institutional Investor’s (FII) investment in equities. This has become one of
the main channels of international portfolio investment in India for foreigners. In order to
trade in Indian equity markets, foreign corporations need to register with the SEBI as
Foreign Institutional Investors (FII). SEBI’s definition of FIIs presently includes foreign
pension funds, mutual funds, charitable/endowment/university funds etc. as well as asset
management companies and other money managers operating on their behalf.
39

The trickle of FII flows to India that began in January 1993 has gradually expanded to an
average monthly inflow of close to Rs. 1900 crores during the first six months of 2001.
By June 2001, over 500 FIIs were registered with SEBI. The total amount of FII
investment in India had accumulated to a formidable sum of over Rs. 50,000 crores
during this time (see Fig. 1). In terms of market capitalization too, the share of FIIs has
steadily climbed to about 9% of the total market capitalization of BSE (which, in turn,
accounts for over 90% of the total market capitalization in India).
40

The sources of these FII flows are varied. The FIIs registered with SEBI come from as
many as 28 countries (including money management companies operating in India on
behalf of foreign investors). US-based institutions accounted for slightly over 41%, those
from the UK constitute about 20% with other Western European countries hosting
another 17% of the FIIs (Fig. 2). It is, however, instructive to bear in mind The closed-
end country fund, “The India Fund” launched in June 1986 provided a channel for
portfolio investment in India before the stock market liberalization in 1992. Global
Depository Receipts, American Depository Receipts, Foreign Currency Convertible
Bonds and Foreign Currency Bonds issued by Indian companies and traded in foreign
exchanges provide other routes for portfolio investment in India by foreign investors. It is
also possible for foreigners to trade in Indian securities without registering as an FII but
such cases require approval from the RBI or the Foreign Investment Promotion Board.
that these national affiliations do not necessarily mean that the actual investor funds come
from these particular countries. Given the significant financial flows among the industrial
countries, national affiliations are very rough indicators of the ‘home’ of the FII
investments. In particular institutions operating from Luxembourg, Cayman Islands or
Channel Islands, or even those based at Singapore or Hong Kong are likely to be
investing funds largely on behalf of residents in other countries. Nevertheless, the
regional breakdown of the FIIs does provide an idea of the relative importance of
different regions of the world in the FII flows.
41

FACTORS AFFECTING FII FLOWS
In this section we shall study the relationship between FII flows and possible economic
factors affecting it, particularly stock returns in the Indian market.
FII flows and stock returns – determining the cause and the effect
FII flows and contemporaneous stock returns are strongly correlated in India. The
correlation coefficients between different measures of FII flows and market returns on the
Bombay Stock Exchange during different sample periods are shown in the different
panels of Table 1. While the correlations are quite high throughout the sample period,
they exhibit a significant rise since the beginning of the Asian crisis.
42

These positive correlations have often been held as evidence of FII actions determining
Indian equity market returns. However, correlation itself does not imply causality. A
positive relationship between portfolio inflows and stock returns is consistent with at
least four distinct theories: 1) the “omitted variables” hypothesis; 2) the “downward
sloping demand curve” view; 3) the “base-broadening” theory; and 4) the “positive
feedback strategy” view.
The “omitted variables” view is the classic case of spurious correlation – that the
correlated variables, in fact, have no causal relationship between them but are both
affected by one or more other variables missed out in the analysis. The “downward
sloping demand curve” view contends that foreign investment creates a buying pressure
for stocks in the emerging market in question and causes stock prices to rise much in the
same way as suddenly higher demand for a commodity would cause its price to rise. The
‘base-broadening’ argument contends that once foreigners begin to invest in a country,
the financial markets in that country are now no longer moved by national economic
factors alone but rather begin to be affected by foreign market movements as well. As the
market itself is now affected by more factors than before, its exposure to domestic shocks
decline. Consequently the ‘risk’ of the market itself falls, people demand a lower risk
premium to buy stocks, and stock prices rise to higher levels. Finally the ‘positive
feedback view’ asserts that if investors ‘chase’ returns in the immediate past (like the
previous day or week) then aggregating their fund flows over the month can lead to a
positive relationship in the contemporaneous monthly data. In the present context, both
directions of causation are equally plausible.
Further returns on the BSE Index explain close to a third of the total variation in FII
flows during the entire period. They also indicate, however, that the Asian crisis marked
a regime shift in the relationship between FII flows and Indian stock market return.
During and after the crisis, the returns explained about 40% of the total variation in FII
flows. The positive relationship between market return and FII flows, however, serves
only as a first-pass in understanding the nature of such flows and their implications for
the Indian markets. Since the FII flows essentially serve to diversify the portfolio of
foreign investors, it is only normal to expect that several factors – both domestic as well
43

as external to India – are likely to affect them along with the expected stock returns in
India. Past research suggests that the declining world interest rates have been among the
important “push” factors for international portfolio flows in the early 90’s. The “usual
suspects” in the literature include US and world equity returns, changes in interest rates,
stock market volatility, some measure of the country risk and the exchange rate. In the
Indian case, however these factors do not appear to have had a prominent role in
motivating FII flows. Finally it also appears that there has been no significant
informational disadvantage for FIIs vis-à-vis the local investors in the Indian market.
Other factors that may affect FII flows
Country risk measures, that incorporate political and other risks in addition to the usual
economic and financial variables, may be expected to have an impact on portfolio flows
to India though they are likely to matter more in the case of FDI flows. In order to check
the impact of such country risk on FII flows, semi-annual country risk scores for India
were taken from the Institutional Investor magazine, an important country-rating agency.
These raw ratings were then divided by the world average rating to obtain normalized
ratings. The intuition behind this normalization is as follows. If
India’s credit rating improves but that of other countries improve even more, then India
may not improve its relative attractiveness as a destination of investment flows. The
relation between the normalized country rating and the average monthly FII flows (as a
proportion of the preceding month’s BSE capitalization) is shown in Figure 5. The
correlation between the two variables is –0.15. No relationship is evident from the figure
itself and statistical testing confirms this view. Thus we can conclude that broadly
speaking there is no evidence of India’ credit rating affecting FII flows.
44

It is also conceivable that the extent to which the Indian market moves out of step with
the world market is a factor in determining its attractiveness to foreign investors.
The lower the co-movement, the greater the protection that investment in India provides
to investors against world market shocks.
45

LIBERALISATION OF FOREIGN INSTITUTIONAL INVESTMENT
Following the announcement by the Government in the Budget 2002-03 that suggested
those foreign institutional investors’ (FII) portfolio investments would not be subject to
the sectoral limits for foreign direct investment except in specified sectors, a Committee
was constituted with representation from the Department of Economic Affairs as well as
the Department of Industrial Policy and Promotion.
The Committee was reconstituted twice. After the second reconstitution, the Committee
had 5 meetings, the last being held on June, 24, 2004. The report gives an evolution of
FII policy in India, examines the pros and cons of FII investment, especially in an era
with no balance of payment pressures, and also provides a perspective on FII investment
restrictions in peer countries in Asia. The recommendations are as follows:
A. (i) In general, FII investment ceilings, if any, may be reckoned over and above
prescribed FDI sectoral caps. The 24 per cent limit on FII investment imposed in 1992
when allowing FII inflows was exclusive of the FDI limit. The suggested measure will be
in conformity with this original stipulation.
(ii) Special procedure for raising FII investments beyond 24per cent upto the FDI limit in
a company may be dispensed with by amending the relevant SEBI (FII) Regulations.
(iii) In order to provide dispersed investments and prevent concentration, the existing
limit of 10per cent by a FII in a single company may continue.
B Recommendations in para A above would apply, in general, to all sectors.
Specific recommendations are being made for the following sectors with overall
composite caps :
a. Telecom services.
b. Defence production
c. Public sector banks.
d. Insurance companies.
FII investments are currently not permitted in print media, sectors which are not yet
opened for private investment and in gambling, betting, lottery. The Committee
recommends the same may continue.
46

FDI investment in retail trading is prohibited. FII investments, however, are permitted up
to 24 per cent in all listed companies, except in print media companies. The Committee
recommends the same may continue as this would help in developing supply chains in a
wide range of products including that of agriculture.
In his Budget Speech on February 28, 2002, the Finance Minister announced that:
“Foreign Institutional Investors (FIIs) can invest in a company under the portfolio
investment route beyond 24 per cent of the paid-up capital of the company with the
approval of the general body of the shareholders by a special resolution. I propose that
now FII portfolio investments will not be subject to the sectoral limits for foreign direct
investment except in specified sectors. Guidelines in this regard will be issued
separately.”
2. Following this announcement, with the approval of Finance Minister, a committee was
set up on March 13, 2002 to identify the sectors in which FIIs’ portfolio investments will
not be subject to the sectoral limits for Foreign Direct Investment (FDI).
Evolution of FII Investment Policy
India embarked on a gradual shift towards capital account convertibility with the launch
of the reforms in the early 1990s. Although foreign natural persons – except NRIs – are
prohibited from investing in financial assets, such investments were permitted by FIIs
and Overseas Corporate Bodies (OCBs) with suitable restrictions. Ever since September
14, 1992, when FIIs were first allowed to invest in all the securities traded on the primary
and secondary markets, including shares, debentures and warrants issued by companies
which were listed or were to be listed on the Stock Exchanges in India and in the schemes
floated by domestic mutual funds, the holding of a single FII and of all FIIs, Non-resident
Indians (NRIs) and OCBs in any company were subject to the limit of 5 per cent and 24
per cent of the company’s total issued capital, respectively. Furthermore, funds invested
by FIIs had to have at least 50 participants with no one holding more than 5 per cent to
ensure a broad base and preventing such investment acting as a camouflage for individual
investment in the nature of FDI and requiring Government approval.
47

Initially the idea of allowing FIIs was that they were broad-based, diversified funds,
leaving out individual foreign investors and foreign companies. The only exceptions were
the NRI and OCB portfolio investments through the secondary market, which were
subject to individual ceilings of 5 per cent to prevent a possible “take over.” Individuals
were left out because of the difficulties in checking on their antecedents, and of their lack
of expertise in market matters and relatively short-term perspective. OCB investments
through the portfolio route have been banned since November, 2001.
In February, 2000, the FII regulations were amended to permit foreign corporates and
high net worth individuals to also invest as sub-accounts of Securities and Exchange
Board of India (SEBI)-registered FIIs. Foreign corporates and high net worth individuals
fall outside the category of diversified investors. FIIs were also permitted to seek SEBI
registration in respect of sub-accounts for their clients under the regulations. While
initially FIIs were permitted to manage the sub-account of clients, the domestic portfolio
managers or domestic asset management companies were also allowed to manage the
funds of such sub-accounts and also to make application on behalf of such sub-accounts.
Such sub-accounts could be an institution, or a fund, or a portfolio established or
incorporated outside India, or a broad-based fund, or a proprietary fund, or even a foreign
corporate or individual. So, in practice there are common categories of entities, which
could be registered as both FIIs and sub-accounts. However, investment in to a sub
account is to be made either by FIIs, or by domestic portfolio manager or asset
Management Company, and not by itself directly.
In view of the recent concerns of some unregulated entities taking positions in the stock
market through the mechanism of Participatory Notes (PNs) issued by FIIs, the issue was
examined by the Ministry of Finance in consultation with the Reserve Bank of India
(RBI) and SEBI. Following this consultation, in January 2004, SEBI stipulated that PNs
are not to be issued to any non-regulated entity, and the principle of "know your clients”
may be strictly adhered to. SEBI has indicated that the existing non-eligible PNs, will be
permitted to expire or to be wound-down on maturity, or within a period of 5 years,
whichever is earlier. Besides, reporting requirement on a regular basis has been imposed
on all the FIIs.
48
The following entities, established or incorporated abroad, are eligible to be registered as
FIIs:
(a)Pension Funds,
(b)Mutual Funds,
(c)vestment Trusts,
(d) Asset Management Companies,
(e) Nominee Companies,
(f) Banks,
(g) Institutional Portfolio Managers,
(h) Trustees, (i) Power of Attorney holders,
(j) University funds, endowments, foundations or charitable trusts or charitable societies.
Besides the above, a domestic portfolio manager or domestic asset management
company is now also eligible to be registered as an FII to manage the funds of
subaccounts.
The FIIs can also invest on behalf of sub-accounts. The following entities are entitled to
be registered as sub-accounts: i) an institution or fund or portfolio established or
incorporated outside India, ii) a foreign corporate or a foreign individual.
FIIs registered with SEBI fall under the following categories:
(a) Regular FIIs – those who are required to invest not less than 70 per cent of their
investment in equity-related instruments and up to 30 per cent in non-equity instruments.
(b) 100 per cent debt-fund FIIs – those who are permitted to invest only in debt
instruments.
A Working Group for Streamlining of the Procedures relating to FIIs constituted in April,
2003 by the Government, inter alia, recommended streamlining of SEBI registration
procedure, and suggested that dual approval process of SEBI and RBI be changed to a
single approval process of SEBI. This recommendation has since been implemented.
Forward cover in respect of equity funds for outstanding investments of FIIs over and
above such investments on June 11, 1998 was permitted. Subsequently, forward cover up
to a maximum of 15 per cent of the outstanding position on June 11, 1998 was also
49

permitted. This 15 per cent limit was liberalized to 100 per cent of portfolio value as on
March 31, 1999 in January 2003.
Like in other countries, the restrictions on FII investment have been progressively
liberalized. From November 1996, any registered FII willing to make 100 per cent
investment in debt securities were permitted to do so subject to specific approval from
SEBI as a separate category of FIIs or sub-accounts as 100 per cent debt funds. Such
investments by 100 per cent debt funds were, however, subject to fund-specific ceilings
specified by SEBI and an overall debt cap of US$ 1-1.5 billion. Moreover, investments
were allowed only in debt securities of companies listed or to be listed in stock
exchanges. Investments were free from maturity limitations.
From April 1998, FII investments were also allowed in dated Government securities.
Treasury bills being money market instruments were originally outside the ambit of such
investments, but were subsequently included from May, 1998. Such investments, which
are external debt of the Government denominated in rupees, were encouraged to deepen
the debt market. From April, 1997, the aggregate limit for all FIIs, which was 24 per cent,
was allowed to be increased up to 30 per cent by the Indian company concerned by
passing a resolution by its Board of Directors followed by a special resolution to that
effect by its General Body.
While permitting foreign corporates/high net worth individuals in February, 2000 to
invest through SEBI registered FII/domestic fund managers, it was noted that there was a
clear distinction between portfolio investment and FDI. The basic presumption is that
FIIs are not interested in management control. To allay fears of management control
being exercised by portfolio investors, it was noted that adequate safety nets were in
force, for example, (i) transaction of business in securities on the stock exchanges are
only through stock brokers who have been granted a certificate by SEBI, (ii) every
transaction is settled through a custodian who is under obligation to report to SEBI and
RBI for all transactions on a daily basis, (iii) provisions of SEBI (Substantial Acquisition
of Shares and Takeovers) Regulations, 1997 (iv) monitoring of sectoral caps by RBI on a
daily basis.
50

In 1998, the aggregate portfolio investment limits of NRIs/PIOs/OCBs and FIIs were
enhanced from 5 per cent to 10 per cent and the ceilings of FIIs and NRIs/OCBs were
declared to be independent of each other.
Aggregate FII portfolio investment ceiling was enhanced from 30 per cent to 40 per cent
of the issued and paid up capital of a company [March 01 2000]. The enhanced ceiling
was made applicable only under a special procedure that required approval by the
Board of Directors and a Special Resolution by the General Body of the relevant
company. The FII ceiling under the special procedure was further enhanced [March 08
2001] from 40 per cent to 49 per cent. Subsequently, the FII ceiling under the special
procedure was raised up to the sectoral cap in September, 2001.
Sectoral Caps
Quite apart from the ceilings on FII investment, there were and are ceilings on FDI, and
in some cases, unified ceilings for nonresident investments. There are two types of
ceilings on FII investment: statutory and administrative.
Currently non-resident investments in public sector banks and insurance sector are
capped under Acts at 20 per cent and 26 per cent respectively. Accordingly, FDI plus
portfolio investments by FIIs and NRIs are capped at 20 per cent and 26 per cent under
the above statutes.
There are also sectors where administrative caps for non-resident investments have been
prescribed. In these sectors (viz. telecom services, media, private sector 10 banks) FDI
plus portfolio investments by FIIs and NRIs cannot exceed the administrative caps fixed.
Caps can be of three types:
i) a separate cap on FDI,
ii) a separate cap on FII, and
iii) a composite caps on FDI and FII combined together.
51

Separate caps on FDI and FII, in turn, can be of five types:
I) ban on both FDI and FII (e.g. lottery business, gambling and betting),
II) non-zero separate caps on both FDI and FII ([e.g., DTH-broadcasting]), [DTH has
composite ceiling with a sub-ceiling for FDI at 20 per cent]
III) a composite non-zero cap on FDI and FII (banking, insurance, telecom)
IV) ban on FDI with a non-zero cap on FII (e.g.,Terrestrial broadcasting FM,
retail trading), and
V) ban on FII with a non-zero cap on FDI (e.g. print media).
For example, for private sector banks falling within the purview of the RBI’s regulatory
jurisdiction, no distinction is made either between different categories of nonresident
investors or the nature of foreign investment, whether portfolio or FDI.
Similarly, no distinction is made either between different categories of sub-sectors of FM
radio broadcasting and satellite uplinking, cable network and Direct-to-home. The
sectoral equity caps as of May 13, 2004 are given in Table 1 (at annex1).
In August, 2002, the Steering Group on Foreign Direct Investment headed by Shri
N.K.Singh, Member, Planning Commission, submitted its report.1 In this report, six
reasons given for imposing caps and bans on FDI national security, culture and media,
natural monopolies, monopoly power, natural resources, and transition costs, were
discussed in some detail.
The Steering Group observed that while all governments prefer vital defence industries to
be controlled by their own resident nationals, there was not much justification for
restrictions on the production of civilian goods used by the defence forces, and
production of those goods that are either imported or are banned for exports from
developed countries for strategic reasons. On culture and media, the Steering Group
observed that there was a need for true cultural globalization – not a one-way process of
only India having access to the culture of the rest of the world but a two-way street – and
in the field of current affairs and news programmes, editorial control must vest with
52

Indian nationals and eventually could be replaced by limits on aggregate market share (25
– 49 per cent) that can accrue to foreign controlled news/current affairs companies taken
together.
As regards natural monopolies, the Steering Group observed that in the absence of a
proper regulatory system with the requisite expertise, “It can be argued that when such
expertise does not exist in the regulatory system it may be better for monopoly profits to
accrue to resident nationals than to foreigners. Though this argument has some validity in
the short term it is a defeatist approach in the long term. Domestic monopolies are more
likely to succeed in distorting the regulatory process in their favour (‘regulatory capture’)
than foreign monopolies, because of their more intimate knowledge of and association
with domestic political processes. Any such restrictions therefore must be temporary with
continuous efforts made to improve regulatory structures and skills.” On abuse of
monopoly power, the Steering Group argued that foreign investment can in fact enhance
domestic competition and any potential problem arising from a foreign producer with
very high global share tying up with an existing domestic producer should be addressed
under the Competition Law.
With ownership of natural resources, such as, the electro-magnetic spectrum and sites for
dams and harbours vesting with the people and their Government, the Steering Group
noted that if extraction of the resource rent, which arises from the difference between the
market price and efficient costs of exploitation of the particular resource, is effectively
designed to maximize such resource rent to Government through appropriate tax and
auction systems there would be no need to discriminate between foreign and domestic
investments.
Considerable difficulties were encountered in the monitoring of the sectorspecific
composite ceilings on foreign investment because of the problems in identifying the
sector of investment merely by the name of the company and the existence of companies
with diversified activities.
53

Supply and Demand
Various supply and demand factors have made investing via institutions a rapidly
growing sector in many developed countries.2 There is enhanced supply of funds from
investors to institutions because of the aging of population, funded pension systems, and
growing wealth. Institutions are also able to give better services and attractive returns
because of ease of diversification, better corporate governance, liquidity, deregulation
and fiscal incentives. Given this background, there is likely to be a large and growing
demand for Indian stocks by FIIs.
It is of some importance to note that the bouts of liberalization of the FII regime has
coincided with pressure on the foreign exchange and balance of payments fronts, for
example, in the aftermath of the 1991 crisis and around the 1997 East Asian crisis. Now
that there is no apparent balance of payments problem, the critical question is whether
there are any reasons for liberalizing the FII regime.
FIIs have a natural advantage in processing information. One of the problems noted for
such investment in emerging markets consists in the lower amount of reliable and quality
information available in such countries relative to developed ones. It can be expected that
with rapid progress in disclosure norms, accounting standards, shareholder rights, legal
framework, and corporate governance in general, FII investments are going to accelerate
in India. FII investments in some companies are already at their ceiling level, and the
ceiling is much below the stakes that FIIs have acquired in some of the top Korean
chaebols.
Countries that have liberalized their FII regimes did not do it out of balance of payments
compulsions. Taiwan, for example, removed all restrictions – previously 10 per cent
individually and 25 per cent collectively until March 1998, and 15 per cent and 30 per
cent until January 1, 2001 – from the beginning of 2001. People’s Republic of China,
without a balance of payments problem, opened itself up to FII investment in 2003.
54

Swiss Bank UBS, by buying into four of China’s A-share stocks – Baoshan Iron and
Steel, Shanghai Port Container, Sinotrans Air, and ZTE Corp – became the first FII to
enter the Chinese market on Wednesday, July 9, 2003.
Pros of FII Investment
The advantages of having FII investments can be broadly classified under the following
categories.
A. Enhanced flows of equity capital
FIIs are well known for a greater appetite for equity than debt in their asset structure. For
example, pension funds in the United Kingdom and United States had 68 per cent and 64
per cent, respectively, of their portfolios in equity in 1998. Thus, opening up the economy
to FIIs is in line with the accepted preference for non-debt creating foreign inflows over
foreign debt. Furthermore, because of this preference for equities over bonds, FIIs can
help in compressing the yield-differential between equity and bonds and improve
corporate capital structures. Further, given the existing savings-investment gap of around
1.6 per cent, FII inflows can also contribute in bridging the investment gap so that
sustained high GDP growth rate of around 8 per cent targeted under the 10th Five Year
Plan can materialize.
B. Managing uncertainty and controlling risks
Institutional investors promote financial innovation and development of hedging
instruments. Institutions, for example, because of their interest in hedging risks, are
known to have contributed to the development of zero-coupon bonds and index futures.
FIIs, as professional bodies of asset managers and financial analysts, not only enhance
competition in financial markets, but also improve the alignment of asset prices to
fundamentals.
55

Institutions in general and FIIs in particular are known to have good information and low
transaction costs. By aligning asset prices closer to fundamentals, they stabilize markets.
Fundamentals are known to be sluggish in their movements. Thus, if prices are aligned to
fundamentals, they should be as stable as the fundamentals themselves.
Furthermore, a variety of FIIs with a variety of risk-return preferences also help in
dampening volatility.
C. Improving capital markets
FIIs as professional bodies of asset managers and financial analysts enhance competition
and efficiency of financial markets. Equity market development aids economic
development.3 By increasing the availability of riskier long term capital for projects, and
increasing firms’ incentives to supply more information about themselves, the FIIs can
help in the process of economic development.
D. Improved corporate governance
Good corporate governance is essential to overcome the principal-agent problem between
share-holders and management. Information asymmetries and incomplete contracts
between share-holders and management are at the root of the agency costs.
Dividend payment, for example, is discretionary. Bad corporate governance makes equity
finance a costly option. With boards often captured by managers or passive, ensuring the
rights of shareholders is a problem that needs to be addressed efficiently in any economy.
Incentives for shareholders to monitor firms and enforce their legal rights are limited and
individuals with small share-holdings often do not address the issue since others can free-
ride on their endeavour. What is needed is large shareholders with leverage to
complement their legal rights and overcome the free-rider problem, but shareholding
beyond say 5 per cent can also lead to exploitation of minority shareholders.
56
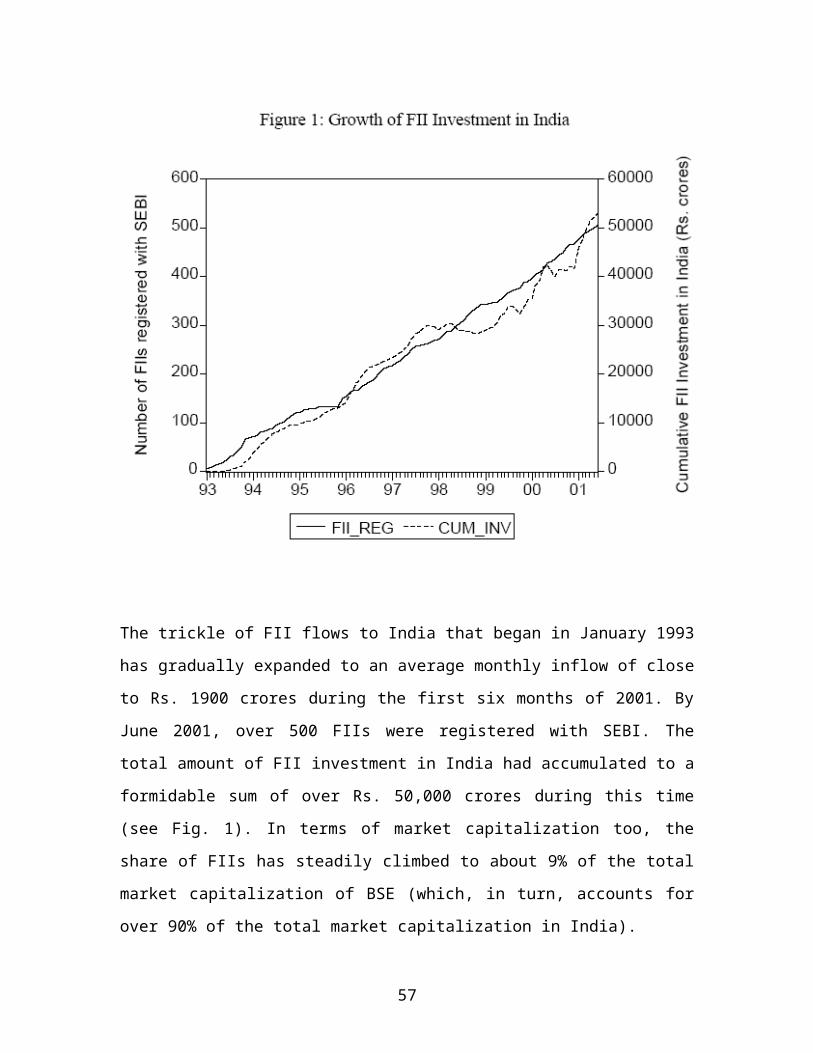
FIIs constitute professional bodies of asset managers and financial analysts, who, by
contributing to better understanding of firms’ operations, improve corporate governance.
Among the four models of corporate control – takeover or market control via equity,
leveraged control or market control via debt, direct control via equity, and direct control
via debt or relationship banking – the third model, which is known as corporate
governance movement, has institutional investors at its core. In this third model, board
representation is supplemented by direct contacts by institutional investors.
Institutions are known for challenging excessive executive compensation, and remove
under performing managers. There is some evidence that institutionalization increases
dividend payouts, and enhances productivity growth.
Cons:
Management Control and Risk of Hot Money Flows
The two common apprehensions about FII inflows are the fear of management takeovers
and potential capital outflows.
A. Management control
FIIs act as agents on behalf of their principals – as financial investors maximizing
returns. There are domestic laws that effectively prohibit institutional investors from
taking management control. For example, US law prevents mutual funds from owning
more than 5 per cent of a company’s stock.
According to the International Monetary Fund’s Balance of Payments Manual 5, FDI is
that category of international investment that reflects the objective of obtaining a lasting
interest by a resident entity in one economy in an enterprise resident in another economy.
The lasting interest implies the existence of a long-term relationship between the direct
investor and the enterprise and a significant degree of influence by the investor in the
management of the enterprise. According to EU law, foreign investment is labeled direct
investment when the investor buys more than 10 per cent of the investment target, and
portfolio investment when the acquired stake is less than 10 per cent.
57

Institutional investors on the other hand are specialized financial intermediaries managing
savings collectively on behalf of investors, especially small investors, towards specific
objectives in terms of risk, returns, and maturity of claims.
All take-overs are governed by SEBI (Substantial Acquisition of Shares and
Takeovers) Regulations, 1997, and sub-accounts of FIIs are deemed to be “persons acting
in concert” with other persons in the same category unless the contrary is established. In
addition, reporting requirement have been imposed on FIIs and currently Participatory
Notes cannot be issued to un-regulated entities abroad.
B. Potential capital outflows
FII inflows are popularly described as “hot money”, because of the herding
behaviour and potential for large capital outflows. Herding behaviour, with all the FIIs
trying to either only buy or only sell at the same time, particularly at times of market
stress, can be rational.4 With performance-related fees for fund managers, and
performance judged on the basis of how other funds are doing, there is great incentive to
suffer the consequences of being wrong when everyone is wrong, rather than taking the
risk of being wrong when some others are right. The incentive structure highlights the
danger of a contrarian bet going wrong and makes it much more severe than performing
badly along with most others in the market. It not only leads to reliance on the same
information as others but also reduces the planning horizon to a relatively short one.
Value at Risk models followed by FIIs may destabilize markets by leading to
simultaneous sale by various FIIs, as observed in Russia and Long Term Capital
Management 1998 (LTCM) crisis. Extrapolative expectations or trend chasing rather than
focusing on fundamentals can lead to destabilization. Movements in the weightage
attached to a country by indices such as Morgan Stanley Country Index (MSCI) or
International Finance Corporation ( IFC) also leads to en masse shift in FII portfolios.
Another source of concern are hedge funds, who, unlike pension funds, life insurance
companies and mutual funds, engage in short-term trading, take short positions and
borrow more aggressively, and numbered about 6,000 with $500 billion of assets under
control in 1998.
58

Some of these issues have been relevant right from 1992, when FII investments were
allowed in. The issues, which continue to be relevant even today, are:
(i) benchmarking with the best practices in other developing countries that compete with
India for similar investments; (ii) if management control is what is to be protected, is
there a reason to put a restriction on the maximum amount of shares that can be held by a
foreign investor rather than the maximum that can be held by all foreigners put together;
and (iii) whether the limit of 24 per cent on FII investment will be over and above the 51
per cent limit on FDI. There are some other issues such as whether the existing ceiling on
the ratio between equities and debentures in an FII portfolio of 70:30 should continue or
not, but this is beyond the terms of reference of the Committee.
It may be noted that all emerging peer markets have some restrictions either in terms of
quantitative limits across the board or in specified sectors, such as, telecom, media,
banks, finance companies, retail trading medicine, and exploration of natural resources.
Against this background, further across the board relaxation by India in all sectors except
a few very specific sectors to be excluded, may considerably enhance the attractiveness
of India as a destination for foreign portfolio flows. It is felt that with adequate
institutional safeguards now in place the special procedure mechanism for raising FII
investments beyond 24 per cent may be dispensed with. The restrictions on foreign
ownership of companies in emerging markets have been summarised in Annex-III.
59

60

61

62
FOREIGN INSTITUTIONAL INVESTMENT IN INDIA
India opened its stock market to foreign investors in September 1992 and since then has
received portfolio investment from foreigners in the form of foreign institutional
investment in equities. This has become one of the main channels of FII in India. In order
to trade in the Indian equity market, foreign corporations need to register with the
Securities and Exchange Board of India (SEBI) as foreign institutional investors. India
allows only authorized foreign investors to invest in pension funds, investment trusts,
asset management companies, university funds, endowments, foundations, charitable
interests and charitable societies that have a track record of five years and which are
registered with a statutory authority in their own country of incorporation or settlement. It
is possible for foreigners to trade in Indian securities without registering as an FII but
such cases require approval from the Reserve Bank of India (RBI) or the Foreign
Investment Promotion Board (FIPB).
Foreign institutional investors generally concentrate on the secondary market. The total
amount of foreign institutional investment in India has accumulated to the formidable
sum of over U.S.$120,243 million as of January 2007.
Daily FII Activity
63
DATE PURCHASES(Rs m)
SALES(Rs m)
NET INV(Rs m)
Mon, 8 Jan,2007 13,853 44,610 (30,757)
Tue, 9 Jan,2007 17,520 28,588 (11,068)
Wed, 10 Jan,2007 17,520 28,588 (11,068)
Thu, 11 Jan.2007 24,603 23,010 1,593
Fri, 12 Jan,2007 26,331 24,261 2,070
Total 99,827 149,057 (49,230)

Contribution by FIIs
The diversity of FIIs has been increasing over 30 countries registered with SEBI as at
march 31st, 2006.Of these 40% originate from 20% and US from UK. Recently FIIs from
Japan and continental Europe are increasing their India exposure. FIIs contributed
approx. 11% of the total market and approx.10% of the total market turnover.
Of the new issuances in FY 2006
-Domestic IPOs aggregated $5.4 billion
-Overseas issuance by the way of ADRs and GDRs were $5billion
-Foreign currency convertible bonds (FCCBs) were for $6 billions
FIIs contributed over 75% of the new equity and equity linked issuances
The FII inflows into India have been on account of:
· Strong economic fundamentals and attractive valuations of companies
· High quality of corporate governance
· Efficient market mechanisms for settlement and clearing
· Product diversification and availability of active derivatives market.
64

Portfolio of FIIs
Shareholding pattern of FIIs.
COMPANIES FII
SHAREHOLDING
TOTAL
OUSTANDING
SHARES
FII
SHAREHOLDING
AS A PERCENT
OF TOTAL
NIFTY 3227 23285 13.85
NON-NIFTY 1508 35060 4.3
TOTAL 4735 58345 8.12
65

FIIs registered with SEBI
FINANCIAL YEAR DURING THE YEAR TOTAL REGISTEREDATAT
THE END OF THE YEAR
1992-93 0 0
1993-94 3 3
1994-95 153 156
1995-96 197 353
1996-97 99 439
1997-98 59 496
1998-99 59 450
1999-00 56 506
2000-01 84 528
2001-02 48 490
2001-03 51 502
2003-04 83 540
2004-05 145 685
2005-06 131 803
EFFECT OF FII ON STOCK MARKET
The FIIs are major institutional investors in Indian capital market. Movement in the
sensex has clearly been driven by the behavior of foreign institution investors. The
presence of foreign institution investor in the sensex companies and their active trading
behaviours, their role in determining the share price movements must be considerable.
Indian stock markets are known to be known narrow and shallow in the sence that there
are few companies whose shares are actively traded. Although there are 4700 companies
listed with stock exchange.the BSE sensex incorporates only 30 companies, trading on
whose shares are seen as indicative f market activity. This shallowness also means that
66

the FIIs can also affect the behavior of other retail investors, who tend to follow the FIIs
when making their investment decision.
These features of Indian stock markets induce a high degree of instability for four reasons
First, increase in investment by FIIs cause sharp price increase. It would provide
additional incentives for FII investment and this encourages further investment so that
there is a tendency for any correction of price unwaeeabted by price earnings ratios to be
delayed. And when the correction begins it would have to lead by an FII pullout and can
take the form of extremely sharp decline in the share prices.
Second, as and when FIIs are attracted to the market by expectations of a price increase
that tend to be automatically realized, the inflow of foreign capital can result in an
appreciation of the rupee. This increases the return earned in foreign exchange, when
rupee assets are sold and the revenue converted into dollars. As a result, the investments
turn even more attractive triggering an investment twisting that would imply a sharper
fall when any correction begins.
Third, the growing realization by the FIIs of the power they wield in what are shallow
markets, encourages speculative investment aimed at pushing the market up and choosing
an appropriate moment to exit. This implicit manipulation of the market if resorted to
often enough would obviously imply a substantial increase in volatility.
Finally, in volatile markets, domestic speculators too attempt to manipulate markets in
periods of unusually high prices.
67

Above fig masks the fact that FIIs hold a much higher percentage of shares that are
normally available for trading in the market therefore to judge the real influence of the
FIIs on the share prices of sensex companies, it is important to see what percentage of
free-floats shares are controlled by FIIs.it shows that average equity holding by FIIs is
more than 20% in the sensex companies.it also shows that an investor group, FIIs are the
biggest non-promoter shareholders of the sensex companies.
68

MONTHLY FII INVESTMENTS
As per the data available for the current month and presented in the above table shows
the monthly flow of the FII during January 2006 to dec. 2006. in the year 2006 the flow
was 37,987 mn. Rs. Or net investment by the FII and at the end of December the total
flow was 382,859mn.rs. we can also see that there is a continuous increase in the BSE
sesex from 9,920 to 13,787 excepted may. This just because of heavy withdrawn by the
FII and lesser investment in the month of June. So we can say that there is a direct
relationship between the index and FII flow.
69
MONTH ENDED
NET INV.
(Rs mn.)
MONTH END
Rs / US$
MONTH END
INDEX
CURRENT VALUE(Rs mn)
CUMM. INV.
(Rs mn.)
% GAIN
(Rs Mn.)
% GAIN(US
$ mn.)
Jan - 2006 37,983 44.07 9,920 53,823 37,983 41.7 42.0
Feb - 2006 75,720 44.39 10,370 102,642 113,703 37.6 37.2
Mar - 2006 59,778 44.62 11,280 74,495 173,481 33.1 32.8
Apr - 2006 39,771 44.97 12,043 46,422 213,252 30.1 30.1
May -2006 (82,473) 46.37 10,399 (111,484) 130,779 26.9 24.4
Jun - 2006 9,094 46.04 10,609 12,050 139,873 27.2 25.1
Jul - 2006 12,764 46.56 10,744 16,700 152,637 27.5 24.9
Aug - 2006 47,739 46.54 11,699 57,361 200,376 25.8 25.1
Sep - 2006 59,282 45.94 12,454 66,912 259,658 22.8 23.2
Oct - 2006 65,995 45.03 12,962 71,570 325,653 19.9 20.6
Nov - 2006 93,142 44.69 13,617 96,152 418,795 16.2 16.9
Dec - 2006 (35,936) 44.27 13,787 (36,640) 382,859 17.5 18.3

Monthly FII inflows and BSE sensex.
The economic literature is prosperous with research pointing towards the close
correlation of the BSE Sensex and FII fund flows. Interestingly, a note by National Stock
Exchange “Indian Securities Markets: A review Vol IV, 2001” observes that FIIs have a
disproportionately high level of influence on the sentiments and price trends in the Indian
equity market as other market participants perceive the FIIs to be infallible in their
assessment of the market and tend to follow decisions taken by FIIs. Such ‘herd
mentality’ displayed by market participants amplifies the role of the FIIs in the Indian
stock market. Over the years, as the ceiling for FII investments were relaxed, there has
also been a progressive increase in the share of FII holdings in leading Indian companies
(and also in the Sensex companies). A big role of the FIIs in determining the Sensex level
is therefore not out of place.
70

That the BSE Sensex is closely correlated with the trend of FII inflows is clearly brought
out from the above fig. It is evident that the equity markets were more or less in a steady
state till around April 2003 when FII inflows per month tended to follow a normal
historical trajectory. The upswings in the FII inflows from around May 2003 have also
led to quantum jumps in the BSE Sensex. But despite the general upward trajectory of the
BSE sensex there have been some months of correction and such corrections occurred in
months with negative FII flows. Little doubts therefore that the BSE Sensex fell by
around 14% in May 2006 compared to April 2006 after FIIs turned net seller to the extent
of USD 1.6 bn in that month.
71

Importance of FII flow in India
fig; net flow of investment by FIIs in India
FII investments are non-debt creating flows, also a reason why Indian policy makers
sought to liberalize such flows in the wake of the BoP crisis in 1990-91. Theoretically,
FII investments bring in global liquidity into the equity markets and raise the price-
earning ratio and thereby reduce the cost of capital domestically. FII inflows help
supplement domestic savings and smoothen inter-temporal consumption. Studies indicate
a positive relationship between portfolio flows and the growth performance of an
economy, though such specific studies for India were not found.
72
fig ;Rising shares of FII investment in FX reserves and total foreign
investment.
India, in the recent past few years seems to have received a disproportionately large part
of its foreign investment flows via the FII investments in the equity markets. While in the
last three years the average share of FII in the total foreign investments was above 70%,
this is almost double the average share of around 36% of FII investments in the three
years of FY01 to FY03. More so, FII inflows have significantly contributed to the
Balance of Payments surplus in the last three years. Our analysis indicates that FII
inflows as a percentage of the BOP surplus was at around 35% in the most recent last
three years while the average from FY95 to FY03 had been only around 4.5%. Exhibit 3
also indicates that FII inflows had significantly contributed to the sharp increase in the
foreign exchange reserves of the economy.
The large build-up of foreign exchange reserves through FII inflows poses a potential
threat of destabilization of the economy. Portfolio flows are most often referred to as “hot
money” that can be notoriously volatile when compared to other forms of capital flows.
73

Advantages of FII investment
Enhance flow of equity capital
FIIs are well known for a greater appetite for equity than debt in their asset structure. In
pension funds in the UK and USA had 68% and 64%, respectively, of their portfolio in
equity in 1998.thus, opening up the economy to FIIs in the line with accepted preferences
for non-debt creating foreign inflows over foreign debt. Because of this preference for
equities over bonds, FIIs can help in compressing the yield differential between equity
and bonds and improve corporate capital structure.
Managing uncertainty and controlling risks
FIIs promote financial innovation and development of hedging instruments. FIIs as
professional bodies of asset managers and financial analysts, not only enhance
competition in the financial markets, but also improve the alignment of asset prices to
fundamentals.
Improving capital markets
FIIs enhance competition and efficiency in the markets. Equity development aids
economic development by the viability of riskier long term capital for projects and
increasing firms’ incentives to supply more information about themselves, the FIIs can
help in the process of economic development.
Improved corporate governance
Bad corporate governance makes equity finance a costly option .incentives for
shareholders to monitor firms and enforce their legal rights are limited and individuals
with small-holdings often do not address the issue since others can free-ride on their
74

endeavor. What is needed is large shareholders with leverage to complaint their legal
rights and overcome the free-rider problem.
Knowledge flows
The activities of FIIs help strengthen Indian finance .FIIs advocate modern ideas in
market design, promote innovation, development of sophisticated products such as
financial derivatives, and enhance competition in financial intermediation.
Costs
Herding and positive feedback trading
There are concern that foreign investors are chronically ill-informed about India, and this
lack of sound information may generate herding and positive feedback trading (buying
after positive return and selling after negative returns these kind of behaviour can
exacerbate volatility, and pushes price away from fair values
Possibilities of taking over companies
While FIIs arne seen as pure portfolio investors, without interest in control, portfolio
investor can occasionally behave like FDI investors, and seek control of companies.
Complexities of monetary management
The problem showed up in terms of very large foreign exchange reserve inflows
requiring considerable sterilization operations by RBI to maintain stability.
75

DETERMINANTS OF FII INVESTMENT
There have been several attempts to explain FII behavior in India. All the existing studies
have found that equity return has a significant and positive impact on FII. But given the
huge volume of investments, foreign investors can play the role of market makers and
book their profits, that is, they can buy financial assets when the prices are declining,
thereby jacking-up the asset prices, and sell when the asset prices are increasing (Gordon
and Gupta 2003). Hence, there is a possibility of a bidirectional relationship between FII
and equity returns
.
Following the Asian financial crisis and the bursting of the info-tech bubble
internationally in 1998/99, net FII declined by U.S.$61 million. This, however, exerted
little effect on equity returns. This negative investment might possibly disturb the long-
term relationship between FII and other variables such as equity returns, inflation, and so
on. Chakrabarti (2001) has perceived a regime shift in the determinants of FII following
the Asian financial crisis and found that in the pre–Asian crisis period, any change in FII
had a positive impact on equity returns. But it was found that in the post–Asian crisis
period, a reverse relationship has been the case, namely, that change in FII is mainly due
to change in equity returns. This is a fact that needs to be taken into account in any
empirical investigation of FII. Investments, either domestic or foreign, depend heavily on
risk factors. Hence, while studying the behavior of FII, it is important to consider the risk
variable. Further, realized risk can be divided into ex-ante and unexpected risk. Ex-ante
risk is an observed component and is negatively related to FII. But the relationship
between unexpected risk and FII is obscure. Therefore, while examining the impact of
risk on FII, one needs to separate the unobserved component from the realized risk.
Trivedi and Nair (2003) have used only the realized risk.
Another possible determinant of FII is the operation of foreign factors such as returns in
the source country’s financial markets and other real factors in the source economy. So
far, however, studies have found that both return in the source country stock market and
76

the inflation rate have not exerted any impact on FII. Agarwal (1997) found that world
stock market capitalization had a favorable impact on the FII in India.
The research shows that existing studies do not account for volatility, which can be
expected in most of the monthly financial time series data. Yet given the increase in
financial market integration, both domestically and in foreign financial markets,
accounting for volatility is unavoidable. Further, the existing studies either do not
incorporate risk in foreign and domestic markets or make use of realized risk, an
approach that does not always yield robust results. This is because standard
deviation/variance (realized risk variable) increases irrespective of the direction in which
stock returns move, while movement of FII is determined by bull/bear phases. It is
preferable, therefore, to divide the realized risk into ex-ante risk and unpredictable risk.
Since investment in stock markets is sentiment driven, and is affected more or less by
everything, the crucial task is to identify a few critical determinants. This paper makes a
modest attempt to explore the relation between FII and its pivotal determinants, for the
particular case of India. More specifically, a few important variables believed to be
affecting FII are chosen and then a theoretical model is built and empirically tested for
India. The focus of this paper is the study of the critical determinants of FII, so as to
provide a better understanding of FII behavior that helps while liberalizing the capital
account. We hope that the study will be important from a policy perspective, as FII
constitutes an important element for the smooth functioning of domestic financial
markets.
77

CHAPTR – 4
DATA ANALYSIS AND INTERPRATATION
78

Description of the Data
The data used in this paper comes from several sources. We use monthly net FII
investment figures obtained from the websites of the RBI and SEBI. Market
capitalization data are obtained from the BSE web site. Other financial data like the
exchange rate, short-term interest rate in India, returns on the MSCI world index, S&P
500 as well as the BSE national index are obtained from Data stream. Country credit
rating data are obtained from several issues of the Institutional Investor magazine.
The FII net investment series starts from January 1993 and the BSE market capitalization
series starts in April 1993. The series of FII flows as a proportion of preceding month’s
BSE market capitalization therefore begins in May 1993.
Since the net monthly FII flows and the returns in the Indian equity markets constitute
two key variables in this study, we present, in the three panels of Figure 1, the net FII
flows, the BSE National Index and net FII flows as a proportion of the preceding month’s
BSE market capitalization from May 1993 to June 2001. The BSE National Index
immediately reveals the massive and short-lived ‘bubble’ during 2000, a phenomenon
that is likely to have caused temporary but marked deviations from the long-term
relationship between FII flows and Indian market returns. In order to avoid misleading
results from this potentially ‘tainted’ period, we restrict our sample to the end of 1999 for
carrying out empirical analyses.
In order to check if the Asian crisis marked a structural break in the relationships studied
here; we sub-divide the sample period into two sub-samples. Dating the Asian crisis to
begin in July 1997, the pre-Asian Crisis sub-sample runs from May 1993 to
June 1997 (50 months) and the Asian crisis sub-sample runs from July 1997 to December
1999 (30 months).
In order to study the causal linkage between FII flows and contemporaneous stock returns
in greater detail, we also use daily FII flows data and daily returns on the BSE National
Index for the year 1999. The daily FII flows data come from the SEBI website while the
daily returns data are, once again, obtained from Datastream.
79

THEORETICAL MODEL FOR FOREIGN INSTITUTIONAL
INVESTMENT
To build the theoretical model, well-known “uncovered interest parity” (UIP) and
“purchasing power parity” (PPP) conditions have been combined. To bring the model
closer to reality, the assumption of equal riskiness in domestic and foreign assets (made
under UIP) is relaxed. When there is both perfect capital mobility and equal risk of both
home and foreign bonds, then home and foreign bonds are said to be perfect substitutes.
Perfect substitutability of domestic and foreign bonds implies that the uncovered interest
parity condition will hold on a continuous basis.
Let the rate of return to foreign investor by investing in domestic stock market be id and
return in the same market if. By investing in the domestic market the foreign investor
makes two investments, one being in the Indian stock market and the other in the Indian
rupee. Accordingly, the overall return to the investor can be divided into a return on the
stock and a return on the investment in the rupee. If the foreign investor subsequently
sells the rupee at the end of the period, the return on the foreign currency would be ic and
this can be presented as if =id+ ic
.
If we consider the nominal exchange rate as rupees per U.S. dollar, e, initially only
expectations can be formed with regard to the exchange rate movement, hence
If = id − E(˙e / e),
where E(˙e / e) is the expected rate of change in value of the rupee against the dollar. This
equation represents the uncovered interest parity condition. Uncovered interest parity
dictates that the expected rate of depreciation of the rupee-dollar exchange rate is equal to
the interest rate differential between Indian and U.S. stocks.
Now we incorporate the PPP condition, according to which the real exchange rate that is
defined as the ratio of the two countries’ price level, expressed in a common currency,
80

should be equated to unity for all pairs of countries and at all times. This can be
expressed as e = QPd / Pf ;
where e is the nominal exchange rate,
Q is the real exchange rate,
Pd is the domestic price level, and
Pf is the foreign price level.
PPP theory also asserts that Q can be taken as exogenously determined (Q = Q¯ ).
Hence, e = Q¯ Pd / Pf implying that over a period of time the exchange rate moves in
proportion to movements in the ratio of price level, pd / pf. Taking log and differentiating
with respect to time, we get ˙e / e =p˙d / pd −p˙f / pf. Hence, the changes in the
exchange rate and E(˙e / e) would depend on the inflation rate differentials.
Putting this result in the uncovered interest parity condition, we have
id =I f + d − f, (1)
where is the inflation rate in respective countries.
Now, to be more realistic, we relax the assumption of equal risk for domestic and foreign
assets under UIP. By dropping this assumption we have
id −if = E(˙e / e) + P,
where P is risk premium. In other words, a large interest rate differential implies a
market expectation of large exchange rate depreciation or currency risk. Risk averse
investors expect higher returns for investing in relatively riskier assets and therefore the
risk premium represents compensation to the investor for assuming risk.
81

The above equation is modeled as
id −if = E(˙e / e) + d −f,
where is a measure of dispersion (standard deviation) representing risk in respective
countries. Hence, the return differentials depend on the inflation rate differentials and the
risk premium. This can be represented as
id −if = d − f + d − f,
where we have drawn three domestic and three foreign variables affecting FII. In a
functional form, it can be represented as
FII =f(id, if, d, f, d,f). (2)
Briefly the signs for the coefficients of each variable and the rational for it are as follows:
Investors are believed to follow a higher return, hence when the return in the
domestic market increases, FII flows to the domestic market.
Since FII follows higher returns, an increase in the return in the U.S. (foreign)
market will induce investors to withdraw from the Indian (domestic) stock market to
invest in the U.S. (foreign) market.
Investors are considered to be risk averse, hence when risk in the domestic market
increases they will withdraw from the domestic market.
Considering investors as risk averse, when risk in the foreign (U.S.) market
increases, investors will withdraw from the foreign (U.S.) market and invest in the Indian
(domestic) market.
When inflation in the domestic country increases, the purchasing power of the
funds invested declines, hence investors will withdraw from the domestic market.
Similarly, when inflation in the foreign country increases, the purchasing power
of funds invested in the foreign country declines, causing institutional investors to
withdraw from the foreign (U.S.) market and make investment in the domestic (Indian)
market.
82

A GAP ANALYSIS OF FIIS INVESTMENTS – AN ESTIMATION OF FIIS INVESTMENTS AVENUES IN INDIAN
EQUITY MARKET
India embarked on a programme of economic reforms in the early 1990s to tie over its
balance of payment crisis and also as a step towards globalization. An important
milestone in the history of Indian economic reforms happened on September 14, 1992,
when the FIIs (Foreign Institutional Investors) were allowed to invest in all the securities
traded on the primary and secondary markets, including shares, debentures and warrants
issued by companies which were listed or were to be listed on the stock exchanges in
India and in the schemes floated by domestic mutual funds. Initially, the holding of a
single FII and of all FIIs, NRIs (Non-Resident Indians) and OCBs (Overseas Corporate
Bodies) in any company were subject to a limit of 5% and 24% of the company’s total
issued capital respectively. In order to broad base the FII investment and to ensure that
such an investment would not become a camouflage for individual investment in the
nature of FDI (Foreign Direct Investment), a condition was laid down that the funds
invested by FIIs had to have at least 50 participants with no one holding more than 5%.
Ever since this day, the regulations on FII investment have gone through enormous
changes and have become more liberal over time. From November 1996, FIIs were
allowed to make 100% investment in debt securities subject to specific approval from
SEBI as a separate category of FIIs or sub-accounts as 100% debt funds. Such
investments were, of course, subjected to the fund-specific ceiling prescribed by SEBI
and had to be within an overall ceiling of US $ 1.5 billion. The investments were,
however, restricted to the debt instruments of companies listed or to be listed on the stock
exchanges. In 1997, the aggregate limit on investment by all FIIs was allowed to be
raised from 24% to 30% by the Board of Directors of individual companies by passing a
resolution in their meeting and by a special resolution to that effect in the company’s
General Body meeting. From the year 1998, the FII investments were also allowed in the
dated government securities, treasury bills and money market instruments. In 2000, the
foreign corporates and high net worth individuals were also allowed to invest as sub-
accounts of SEBI-registered FIIs. FIIs were also permitted to seek SEBI registration in
respect of sub-accounts. This was made more liberal to include the domestic portfolio
83

managers or domestic asset management companies. 40% became the ceiling on
aggregate FII portfolio investment in March 2000. This was subsequently raised to 49%
on March 8, 2001 and to the specific sectoral cap in September 2001. As a move towards
further liberalization, the Finance Minister announced in his budget speech on February
28, 2002 that, “Foreign Institutional Investors (FIIs) can invest in a company under the
portfolio investment route beyond 24 per cent of the paid up capital of the company with
the approval of the general body of the shareholders by a special resolution. I propose
that now FII portfolio investments will not be subject to the sectoral limits for foreign
direct investment except in specified sectors. Guidelines in this regard will be issued
separately.” Accordingly, a committee was set up on March 13, 2002 to identify the
sectors in which FIIs portfolio investments will not be subject to the sectoral limits for
FDI.
The committee has proposed that, ‘In general, FII investment ceilings, if any, may be
reckoned over and above prescribed FDI sectoral caps. The 24 per cent limit on FII
investment imposed in 1992 when allowing FII inflows was exclusive of the FDI limit.
The suggested measure will be in conformity with this original stipulation.’ The
committee also has recommended that the special procedure for raising FII investments
beyond 24 per cent up to the FDI limit in a company may be dispensed with by amending
the relevant regulations. Meanwhile, the increase in investment ceiling for FIIs in debt
funds from US $ 1 billion to US $ 1.75 billion has been notified in 2004. The SEBI also
has reduced the turnaround time for processing of
FII applications for registrations from 13 working days to 7 working days except in the
case of banks and subsidiaries. All these are indications for the country’s continuous
efforts to mobilize more foreign investment through portfolio investment by FIIs. The FII
portfolio flows have also been on the rise since September 1992. Their investments have
always been net positive, but for 1998-99, when their sales were more than their
purchases.
84

TABLE 1TRENDS IN FII INVESTMENT
the increase. But the years 2001-02 and 2002-03 saw some reversal in the trend. From a
net inflow of US $ 2.1 billion in 2000-01, such inflows declined to US $ 1.8 billion in
2001-02, and further dropped to US $ 0.562 billion in 2002-03. The decline is because of
the lower portfolio inflows, as a result of which the net investment has dropped in these
years. However, this decline witnessed a sharp reversal in the year 2003-04. FIIs have
made a net investment of Rs. 45,764 crores during this year registering a growth of
1602% over the previous year, creating a record in the history of FII investment in India.
Gross purchases in this year amounted to Rs.144,857 crores, a growth rate of 208%
compared to the year before. This trend continued in April 2004, only to suffer reversal
again during May and June 2004, when the net investment became negative. Fortunately,
this year from
July 2004 has been seeing a net positive portfolio flows by FIIs. As of September 2004,
the net FII portfolio investment stands at US $ 27,637 million. This study is undertaken
85

to assess what is the net FII investment in specific companies’ vis-à-vis the FII
investment cap in them. This is done to bring to light that though the FII investment, if
studied over time in India, shows a positive trend of increase in general, they are still
insufficient and very much below the level envisaged and permitted by the regulations. If
it is so, then increasing the FII investment cap per se will not just be helpful The country
has to work on specific measures to encourage more FII investments.
The Study
The study has undertaken an analysis of the FII investment gap in the companies included
in the S & P CNX 500 index of National Stock Exchange, by comparing the FII
investment in each of these companies as of September 30, 2004 with the FII investment
cap. The FII investment gap, the difference between the investment allowed under the FII
investment cap provision for the company and the actual investment, is estimated in
terms of the market value prevailing as on the estimate date of September 30, 2004.
Information on the shareholding pattern of these companies as of September 30, 2004,
the closing market price of these shares is downloaded from the NSE site,
www.nseindia.com. Since information is not available for 31 companies they are
excluded from the study. In all the findings of this study relates to 469 companies
included in the S & P CNX 500
index of National Stock Exchange as of September 30, 2004. The information on the FII
investment cap for each of these companies is assessed from the Reserve Bank of India
site, www.rbi.org.in The reason for choosing the companies included in this index is
because this index is fairly comprehensive and includes companies from different sectors
in the same proportion of how they are in the population of all the listed companies.
Sample Profile
The FIIs hold 8.12 per cent of the total outstanding shares of the 469 companies studied
as of September 2004, emerging as the biggest institutional investor, ahead of the mutual
funds, domestic financial institutions and the private corporate bodies. In an overall
ranking they occupy the third position after the promoters and the Indian public holding
higher levels of investment than FIIs.
86
However, when the companies are grouped into those included in the S & P CNX NIFTY
index(referred to as NIFTY companies from now onwards) and those which are not
included, a specific concentration of FIIs investment in NIFTY companies. The FIIs
shareholding is around 13.85 per cent in NIFTY companies as against 4.30 per cent in the
Non-NIFTY companies.
The table above shows that the FIIs investment is certainly more concentrated in the
NIFTY companies than in Non-NIFTY companies. But, this analysis is not complete
87

because a mere comparison of the number of shares held by FIIs is meaningless as the
market price per share varies across companies and it takes different quantum of money
to acquire the same number of shares in different companies. Hence, this analysis is
further extended to include the monetary value of the FIIs investment as of September 30,
2004 by multiplying the number of shares held by the closing market price per share as of
the same day. This will give an understanding of the value of the FIIs investment at
market value as of a particulate date. This is done as a proxy as the cost of their
investments in each of these companies is not readily available.
TABLE 4
VALUE OF FIIS INVESTMENT
Table 4 clearly brings out that when the shareholding of FIIs is analysed in terms of the
market value of their investment as of September 30, 2004, about 85 per cent of the total
value of their investment is held in NIFTY companies and only about 15 per cent is in
Non-NIFTY companies. This shows, once again as mentioned above, that there is a clear
concentration of FIIs investments in few chosen companies. A separate analysis of the
NIFTY and Non-NIFTY companies bears evidence to this fact. About 25 per cent of the
total market value of the FIIs investments is in just two companies namely Infosys and
Reliance Industries where the investment is about 14 and 12 per cent respectively. 50 per
cent of the total market value of the FIIs investment is only in 6 companies namely
Infosys Technologies (13.87%), Reliance Industries (12.44%), ICICI Bank (7.51), HDFC
(7.05), ONGC (5.25%) and Satyam (4.88). The total value of the FIIs investment in these
88

companies is around Rs.677,516 million. When the companies are arranged in a
decending order of their FIIs investment, it is found that 21 of the companies account for
around 81.67 per cent and the balance 29 companies share only 18.83 per cent of the total
market value of the FIIs investments, each one accounting for less than 1.5 per cent. In
the bottom 13 companies, the FIIs investment is less than 0.5 per cent. Dabur India, Tata
Chemicals, VSNL, Colgate-Palmolive and Britannia enjoy less than 0.1 per cent of the
FIIs investments in value terms. In the Non-NIFTY category the top five companies
which are the most favoured destinations for FIIs investments are Container Corporation,
Bank of Baroda, Canara Bank, I-Flex and Asian Paints. As many as 71 companies of the
416 companies in this category have absolutely no FIIs investment in them.
The Analysis
The objective of the study is to bring to light the investment gap in the FIIs investments
by comparing the current investment levels of FIIs in the chosen sample companies
against the cap allowed. The cap on the individual companies has taken into account the
generic cap of 24 per cent prevailing and also the increase of the cap to the sectoral cap
by the individual companies by passing of resolution in the Board and General Body.
It may be noticed from the above table that the percentage of the investment gap in case
of NIFTY companies is around 59 and is 84 for the Non-NIFTY companies. The total
89

gap in respect of all the companies works out to 72 per cent. This is in line with the
findings presented in Tables 3 and 4, where it is brought out that the FIIs investments in
NIFTY companies is higher than in Non-NIFTY companies, both in terms of number of
shares held by them and the market value of these shares.
This finding presented above is not surprising. Though the number of shares available for
further investment by FIIs is less in NIFTY companies than Non-NIFTY companies, in
terms of value the difference is not very wide as the average market price per share of the
NIFTY category is very much higher than that of the Non-NIFTY category. The top 5
companies where the gap is at the maximum in NIFTY category of companies are Bharti
Televentures, Reliance Industries, ONGC, Hindustan Lever and Wipro. In the Non-
NIFTY companies the top 5 companies are Mphais BFL, Neyveli Lignite, LIC Housing
Finance, Tata Teleservices(Maharastra) and Himachal Futuristic.
90

FINDINGS
1. The FIIs investments are highly concentrated in terms of their market value in a very
small number of companies.
2. There seems to be a clear distinction in the FIIs shareholding in NIFTY and Non-
NIFTY companies.
3. There is a wide gap between the actual investments by FIIs and the investments
allowed as per the cap.
4. The gap in their investments exist both in NIFTY and Non-NIFTY companies.
5. FII flows are correlated with contemporaneous returns in the Indian markets.
6. This high correlation is not necessarily evidence of FII flows causing ‘price pressure’ –
if anything, the causality is likely to be the other way around.
7. A collection of domestic and international variables likely to affect both flows and
returns fail to diminish the importance of contemporaneous returns in explaining
FII flows.
8. Since the US and world returns are not significant in explaining the FII flows, there is
no evidence17 of any informational disadvantage of FIIs in comparison with the domestic
investors in India.
9. Changes in country risk ratings for India do not appear to affect the FII flows.
10. The beta of the Indian market with respect to the S&P 500 index (but not the beta
with respect to the MSCI world index) seems to affect the FII flows inversely but the
effect disappears in the post-Asian crisis period.
11. There appears to be significant differences in the nature of FII flows before and after
the Asian crisis. In the post Asian crisis period it seems that the returns on the BSE
National Index have become the sole driving force behind FII flows.
91

The stylized facts listed above lead to a better understanding of FII flows to India.
The weakness of the evidence of causality from flows to returns contradicts the view that
the FIIs determine market returns in general, though ‘herding’ effects – particularly with
domestic speculators imitating FII moves – may well be present in cases of individual
stocks. Particularly since the Asian crisis – which seems to have brought about a regime
shift in the relationship between FII flows and stock market returns – the direction of
causation seems to be running from the returns to the flows. The relative stability in the
exchange rate of the Indian Rupee in the post-Asian crisis era seems to have outweighed
fluctuations in the country’s credit rating among foreign portfolio investors.
It is notable that the Asian crisis appears to have acted as a watershed in several of the
key relationships affecting the FII flows to India. This is not an overly surprising result.
Recent research18 has demonstrated that the Asian crisis caused several major changes in
the financial relationship among European countries halfway across the globe. In fact the
crisis appeared to have altered several of the ‘ground rules’ of international portfolio
investing around the world. Why exactly the relationships analyzed here demonstrate a
structural break at the outbreak of the Asian crisis is a matter of speculation. However, it
is plausible that the crisis and India’s relative imperviousness to it increased India’s
attractiveness to portfolio investors particularly as many other emerging markets began to
appear extremely risky. This ‘substitution effect’ may well have drowned other long-term
relationships. Besides, investors may have started paying closer attention to obtaining and
processing information in destination countries in the wake of the Asian crisis causing an
‘information effect’ that could have altered the past relationship as well. Finally
behavioral changes among international portfolio investors following the crisis cannot be
ruled out either.
Another important area is the mild evidence towards the FII flows being affected by
returns in the Indian markets in the immediate past. Such a relationship suggests that
given the thinness of the Indian market and its evident susceptibility to manipulations, FII
flows can, in fact, aggravate the occurrence of equity market bubbles though they may
not actually start them. This is obviously an important concern for policy makers and
market regulators. This paper provides a preliminary analysis of FII flows to India and
92
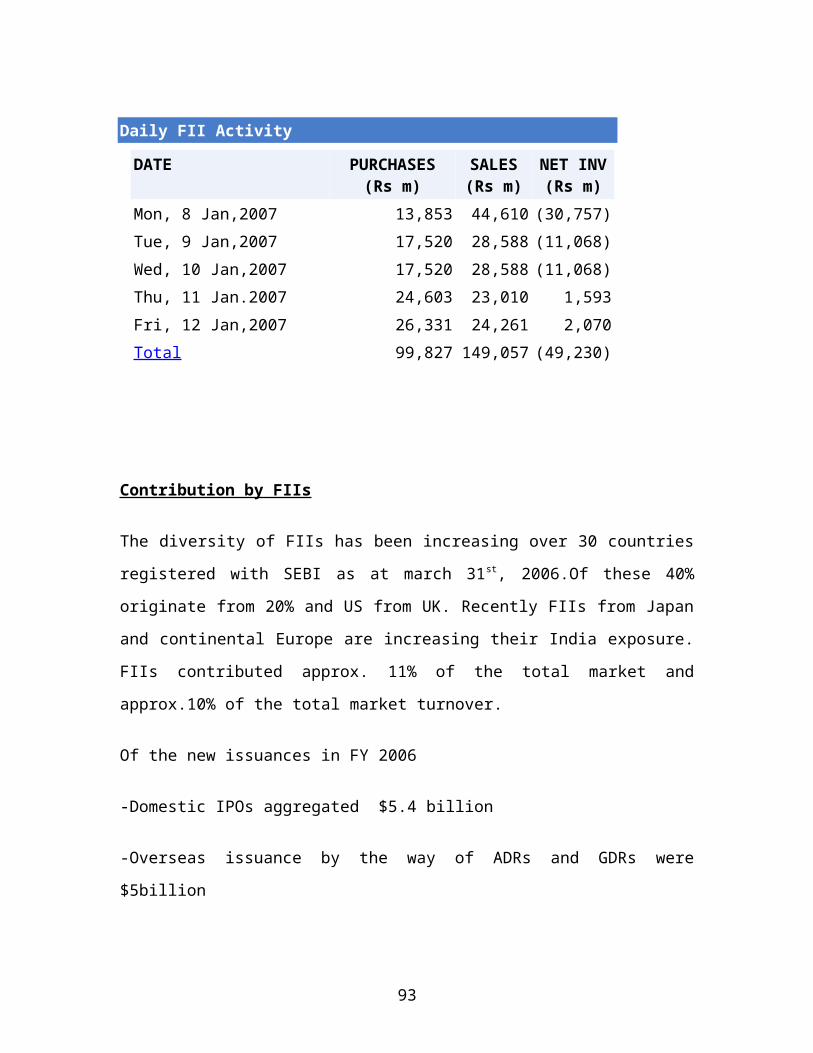
their relationship with several relevant variables especially returns in the Indian stock
market.
A more detailed study using daily data for a longer period or, better still, disaggregated
data showing the transactions of individual FIIs at the stock level can help address
questions regarding the extent of herding or return-chasing behavior among FIIs –
indicators that can help us estimate the probability of sudden Mexico-type reversals of
these FII flows which now account for a significant part of the capital account balance in
our balance of payments. The extent to which FII participation in Indian markets has
helped lower cost of capital to Indian industries is also an important issue to investigate.
Broader and more long-term issues involving foreign portfolio investment in India and
their economy-wide implications have not been addressed in this paper. Such issues
would invariably require an estimation of the societal costs of the volatility and
uncertainty associated with FII flows. A detailed understanding of the nature and
determinants of FII flows to India would help us address such questions in a more
informed manner and allow us to better evaluate the risks and benefits of foreign
portfolio investment in India.
93

CHAPTER – 5
SUGESTIONS AND CONCLUSION
94

SUGGESTIONS
Countries with higher levels of economic development tend to have more developed capital markets and are believed to have greater ability to obtain foreign capital. However, our results suggest that the availability of foreign capital also depends on factors other than the country’s economic development and the firm’s financial attributes. After controlling for the country effect, firms with better accounting quality and corporate governance attract more foreign capital.
Our results suggest that steps can be taken both at the country and the firm level to create an environment conducive to foreign portfolio investment. The analysis is based on a unique dataset consisting of 10,688 equity positions of U.S. mutual funds in emerging markets.
Our findings on emerging markets extend the growing literature on the determinants of global investment flows and allocations. Prior research focuses on international portfolio flows and examines the relationship between portfolio flows and stock returns. These studies have analyzed the global, regional and local factors that influence portfolio flows. A few studies have also examined allocations but they have generally focused only on a specific country. We extend this analysis and undertake a comprehensive analysis of all emerging markets and provide more detailed analysis of country and firm-level factors that influence investment allocations by U.S. funds.
Dahlquist and Robertsson (2001) undertake a detailed analysis of foreign ownership and firm characteristics for the Swedish market. They find that foreigners have a preference for large firms, firms paying low dividends, and firms with large cash holdings. The finding on firm size is driven by liquidity and international presence as measured by foreign listings and export sales.
Foreigners tend to underweight firms with a dominant owner. Brennan and Cao (1997) develop a theoretical model that accounts for information asymmetry between domestic and foreign investors. Their empirical analysis shows that domestic investors have informational advantages.
Covrig, Lau, and Ng (2002) also conclude that foreign fund managers have less information about domestic stocks than do domestic fund managers. They find that ownership by foreign funds is related to size of foreign sales, index memberships, and stocks with foreign listing. These findings are attributed to information asymmetries between foreign and domestic investors.
Similarly, Kang and Stulz (1994) report that foreign investment in Japan is concentrated in large firms and in firms that have a larger proportion of export
95

sales. The findings suggest that foreigners invest in firms that they are better informed about.
The FIIs investments, though shown an increasing trend over time, are still far
below the permissible limits. This means, the convergence of the sectoral cap for
FIIs and FDI investments alone may not really help bring in more funds unless
some specific measures are taken up.
One such measure in this line could be the newly announced INDONEXT, the
platform for trading the small and mid-cap companies that might bring some
focus on these companies and hopefully add some liquidity and volume to their
trading, which may attract some further investments in them by FIIs. However,
the real answers to the questions on how to attract more FIIs investments lies to
some extent on finding the basis of selection of companies for investment by FIIs
which the author is pursuing currently.
Given the necessity of boosting agricultural growth through development of agro
processing, and expanding industry by at least 10 per cent per year to integrate not
only the surplus labour in agriculture but also the unprecedented number of
women and teenagers joining the labour force every year, there is an urgent need
to scale up investment in the economy. FII inflows can help in augmenting the
investible resources in the economy.
Similarly, gambling, betting, lottery, which are areas of dubious value added and
where FDI is prohibited, may also be kept out of bounds for FII investments.
In retail trading currently FDI is prohibited. FII investments, however, are
permitted up to 24 per cent in all listed companies, except in print media
companies. Accordingly, FII investments in retail trading cannot exceed 24 per
cent as no FDI is permitted. This restriction may continue, as it will help develop
supply chains in a wide range of products, including that of agriculture.
96

CONCLUSIONS
A number of studies in the past have observed that investments by FIIs and the
movements of Sensex are quite closely correlated in India and FIIs wield significant
influence on the movement of sensex. There is little doubt that FII inflows have
significantly grown in importance over the last few years. In the absence of any other
substantial form of capital inflows, the potential ill effects of a reduction in the FII flows
into the Indian economy can be severe. From the point of attracting foreign capital,the
initial expectations have not been realised.Investment by FIIs directly in the Indian stock
market did not bring significantly large amount compared to the GDR issues. GDR
issues,unlike FII investments, have the additional advantage of being project specific and
thus can contribute directly to productive investments.FII investments, seem to have
influenced the Indian stock market to a considerable extent.
Results of this study show that not only the FIIs are the major players in the domestic
stock market in India, but their influence on the domestic markets is also growing. Data
on trading activity of FIIs and domestic stock market turnover suggest that FII’s are
becoming more important at the margin as an increasingly higher share of stock market
turnover is accounted for by FII trading. Moreover, the findings of this study also indicate
that Foreign Institutional Investors have emerged as the most dominant investor group in
the domestic stock market in India. Particularly, in the companies that constitute the
Bombay Stock Market Sensitivity Index (Sensex), their level of control is very high. Data
on shareholding pattern show that the FIIs are currently the most dominant non-promoter
shareholder in most of the Sensex companies and they also control more tradable shares
of Sensex companies than any other investor groups.
97

BIBLIOGRAPHY
BOOKS REFERRED:
Indian securities market – AJAY SHAH AND TADASHI ENDO
The stock market dictionary - PRAVEEN N. SHROFF
Marketing Research – HARPER BOYD.
Portfolio and investment management – FRANK J. FABOZZI
JOURNALS REFERRED:
Annual Journal of SEBI
Annual Journal of RBI
Journal of ISMR
Journal of finance
WEBSITES VISITED:
www.nic.in/finmin/ (Finance Ministry)
www.sebi.com (SEBI)
www.reservbank.com
www.nseindia.com
www.bseindia.com
www.moneycontrol.com
www.investopedia.com
www.equiymaster.com
NEWSPAPER AND MAGAZINES
The financial express
The economics times
Business standard
Business today
Outlook business
Outlook money
98

REFERENCES
Agarwal, R. N. 1997. “Foreign Portfolio Investment in
Some Developing Countries: A Studyof Determinants
and Macroeconomic Impact.” Indian Economic Review
32, no. 2: 217–29.
Chakrabarti, Rajesh. 2001. “FII Flows to India: Nature
and Causes.” Money and Finance 2,no. 7.
Glosten, Lawrence R.; Ravi Jaganathan; and David E.
Runkle. 1993. “On the Relation between the Expected
Value and the Volatility of the Normal Excess Return on
Stocks.” Journal of Finance 48, no. 5: 1779–801.
Gordon, James, and Poonam Gupta. 2003. “Portfolio
Flows into India: Do Domestic Fundamentals Matter?”
IMF Working Paper no. 03/02. Washington, D.C.:
International Monetary Fund.
Perron, Pierre. 1997. “Further Evidence on Breaking
Trend Function in Macroeconomic Variables.” Journal of
Econometrics 80: 355–85.
Trivedi, Pushpa, and Abhilash Nair. 2003.
“Determinants of FII Investment Inflow to India.” Paper
presented at the Fifth Annual Conference on Money &
Finance in the Indian Economy, held by Indira Gandhi
Institute of Development Research, Mumbai, January
30–February 1.
99

100

ANNEXURE
101