Embed Size (px)
Citation preview

Impact of Flow Regulation and Powerplant Effluents on the Flow and Temperature Regimes of the Chattahoochee River Atlanta to Whitesburg, Georgia
Impact of Flow Regulation and Powerplant Effluents on the Flow and Temperature Regimes of the Chattahoochee River Atlanta to Whitesburg, Georgia
By R. E. FAYE, H. E. JOBSON, and L. F. LAND
GEOLOGICAL SURVEY PROFESSIONAL PAPER 1108
UNITED STATES GOVERNMENT PRINTING OFFICE, WASHINGTON : 1979

UNITED STATES DEPARTMENT OF THE INTERIOR
CECIL D. ANDRUS, Secretary
GEOLOGICAL SURVEY
H. William Menard, Director
Library of Congress Cataloging in Publication Data
Faye, Robert EImpact of flow regulation and powerplant effluents on the flow and temperature regimes of the Chattahooehee
River, Atlanta to Whitesburg, Georgia.(Geological Survey professional paper 1108)Supt. of Docs. no. : I 19.16:1108"Open-file report 78-528."Bibliography: p.1. Thermal pollution of rivers, lakes, etc. Chattahooehee River. 2. Chattahooehee River Regulation. I. Job-
son, Harvey E., joint author. II. Land, Larry F., joint author. III. Title. IV. Series: United States. Geological Survey. Professional paper 1108.
TD225.C35F39 614.7'72 78-27042
For sale by the Superintendent of Documents, U.S. Government Printing Office
Washington, D.C. 20402
Stock Number 024-001-03244-9
CONTENTS
Metric conversion table Abstract _________.Introduction ____________________________________
Description of the problem __________________________Scope of the study ______________________________________
Description of the study area __________________________________Stream network and channel description _________________________Streamflow and temperature characteristics _______________________Flow and temperature models ___________________________Calibration and verification ____________________________________
Flow model ________________________________________Temperature model ________________________________
Impact of powerplant effluents on river temperatures August 1-8, 1976 ______Computation of natural river temperatures __________________________Computed river temperatures using year 2000 and critical drought flow conditions Summary and conclusions ___.____________________________________Selected references ______________________________________Tables summarizing data ______________________________________
Page
V
1
1
1
3455
16171718252635374547
ILLUSTRATIONS
FIGURE 1. Map of study area showing data-col lection sites _____________
2. Diagrams showing selected channel cross sections of the Chata- hoochee River from Atlanta to Whitesburg. A, River mile 302.97. B, River mile 259.87. C, River mile 281.79. D, River mile 293.92. E, River mile 268.34. F, River mile 298.77 _______________
3. Graph showing thalweg and low-flow profile of the Chattahoochee River Atlanta to Whitesburg__
4-6. Graphs showing mean daily stream- flow in the Chattahoochee River during water year 1976:
4. At Atlanta ________________5. Near Fairburn _________6. Near Whitesburg _________
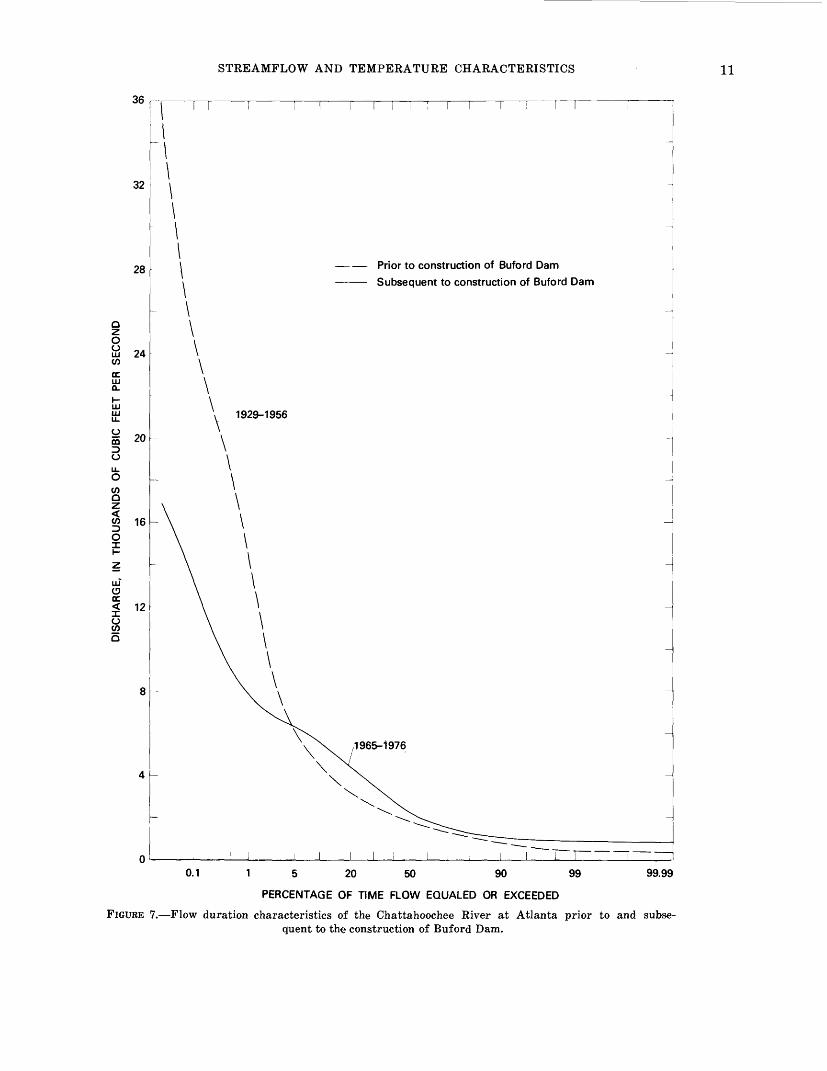
7. Flow duration characteristics of the Chattahoochee River at Atlanta prior to and subsequent to the construction of Buford Dam ___
Page
91010
11
Page
FIGURE 8-12. Graphs showing observed mean daily temperature of the Chatta hoochee River and mean monthly air temperature at Atlanta during water year 1976:
8. At Buford Dam ________9. At Atlanta ____________
10. At the Plant McDonough intake ______ __ _______
11. At Georgia Highway 280 __12. Near Fairburn ___ ___ _
13. Graph showing observed mean daily temperature of the Chatta hoochee River and mean monthly air temperature at Atlanta, July 1937-May 1938 _______________
14. Graphs showing observed and com puted stages of the Chattahoo chee River during the period July 12-19, 1976. A, At Atlanta. B, At the Atlanta water-supply facility. C, At the Plant Mc Donough outfall. D, Near Fair- burn. E, Near Whitesburg ___
1212
131314
15
19
ill

IV CONTENTS
PageFIGURE 15. Graph showing rated and computed
discharge at the Chattahoochee River near Fairburn, July 12-18. 1976 _______________ 21
16. Diagram showing computed stage- discharge relations for the Chat tahoochee River near Fairburn, July 13, 1976 ____________ 22
17. Graph showing rated and computed discharge at the Chattahoochee River near Whitesburg, July 12-19. 1976 _______________ 2,2
18. Diagram showing computed stage- discharge relation for the Chat tahoochee River near Whites- burg, July 13-14, 1976 _____ 22
19. Graphs showing observed and com puted stages of the Chattahoo chee River during the period August 1-8, 1976. A, At Atlanta. B, At the Atlanta water-supply facility. C, Near Fairburn. D, Near Whitesburg _______ 24
20. Graphs showing observed and com puted temperatures of the Chat tahoochee River during the peri od August 1-8, 1976. A, At At lanta. B, At the Plant Mc- Donough intake. C, At Georgia Highway 280. D, Near Fairburn E, Near Whitesburg ______ 26
21. Graphs showing observed and com puted temperatures of the Chat- tahooche© River during the peri od July 12-19, 1976. A, At At lanta. B, At the Plant Me- Donough intake. C, At Georgia Highway 280. D, Near Fairburn E, Near Whitesburg _____ 30
22. Graph showing heat added to the Chattahoochee River from Plants Atkinson-McDonough, August 1- 8, 1976 _______________ 32
23. Graphs showing temperature of the Chattahoochee River with and without heat loads from Plants Atkinson-McDonough during the period August 1-8, 1976. A, At Georgia Highway 280. B, Near Fairburn. C, Near Whitesburg._ 33
24. Graph showing computed longitudinal temperature profiles in the study reach with and without heat loads from Plants Atkinson-Mc Donough, 0000 e.s.t, August 8, 1976 __________________ 34
Page
FIGURE 25. Graph showing observed temperature of the Chattahoochee River at Georgia Highway 280 and the ob served temperature of the same water upon arrival at the Fair- burn gage _____________ 34
26. Graph showing 8-day mean natural and thermally altered tempera tures of the Chattahoochee River from Atlanta to Whitesburg, August 1-8, 1976 _________ 35
27. Graph showing computed natural and observed temperatures of the Chattahoochee River, August 1- 8, 1976 _______________ 36
28. Graphs showing computed tempera tures of the Chattahoochee River using flows representing year 2000 peak water-supply demands, year 2000 average wastewater returns, and August 1976 tribu tary flows. A, At the Plant Mc- Donough intake. B, At Georgia Highway 280. C, Near Fairburn. D, Near Whitesburg _______ 38
29. Graphs showing computed tempera tures of the Chattahoochee River using flows representing year 2000 peak water-supply demands, year 2000 average wastewater returns, and 1954 drought tribu tary flows. A, At the Plant Mc- Donough intake. B, At Georgia Highway 280. C, Near Fairburn. D, Near Whitesburg _______ 40
30. Graphs showing computed tempera tures of the Chattahoochee River using flows representing year 2000 average water-supply de mands, year 2000 average waste- water returns, and August 1976 tributary flows, A, At the Plant McDonough intake. B, At Georgia Highway 280. C, Near Fairburn. D, Near Whitesburg _______ 42
31. Graphs showing computed tempera tures of the Chattahoochee River using flows representing year 2000 average water-supply de mands, year 2000 average waste- water returns, and 1954 drought tributary flows. A, At the Plant McDonough intake. B, At Geor gia Highway 280. C, Near Fair- burn. D, Near Whitesburg 44

TABLE 1. Periodic data-collection sites ______2. Summary of climatologic data for
Atlanta, 1941-70 _______________3. Tributary network and daily mean
discharges during specified periods4. Mean monthly air temperatures at
Atlanta for the period of record and for specified months during 1937-38 and 1975-76, in degrees Celsius _______________
5. Mean monthly water temperatures during 1937-38 and 1975-76, in de grees Celsius ________________
CONTENTS
TABLES
Page 3
14
15
TABLE 6. Estimated water-supply demands and wastewater flows for the year 2000
7. Estimated discharge at the Atlanta and Whitesburg gages using se lected tributary and year 2000 water-supply demands and waste- water flows ________ _ _
8. Cross section coordinates __________9. Channel roughness coefficients and
barrier heights ___________ __
10. Summary of meteorologic data July 12-19 and August 1-8, 1976 _____
Page
35
37
48
50
51
CONVERSION FACTORS
[Factors for converting inch-pound units to metric units are shown to four significant figures. However, in the text, the metric equivalents are shown only to the number of significant figures consistent with the values for the inch-pound]
Inch-pound units Multiply by
ft (foot) 3.048X10⁻¹ft (foot) 3.048xlOaft/s (foot per second) 3.048X10"1 ft:! /s (cubic foot per second) 2.832X10'3in. (inch) 2.540xlO~2in. (inch) 2.540X101mi (mile) 1.609mi2 (square mile) 2.590tons (tons, short) 9.072xlO"1tons/d (tons per day) 9.072xlO'1 tons/ft3 (tons per cubic foot) 3.204X10'1tons/yr (tons per year) 9.072xlO-1°F (degrees Fahrenheit) 5/9 (F-32)
Metric
m (meter)mm (millimeter)m/s (meter per second)m7s (cubic meter per second)m (meter)mm (millimeter)km (kilometer)km" (square kilometer)t (metric tons)t/d (metric tons per day)t/m3 (metric tons per cubic meter)t/yr (metric tons per years)°C (degrees Celsius)

IMPACT OF FLOW REGULATION AND POWERPLANT EFFLUENTS ON THE FLOW AND TEMPERATURE REGIMES OF THE CHATTAHOOCHEE RIVER
ATLANTA TO WHITESBURG, GEORGIA
By R. E. FAYE, H. E. JOBSON, and L. F. LAND
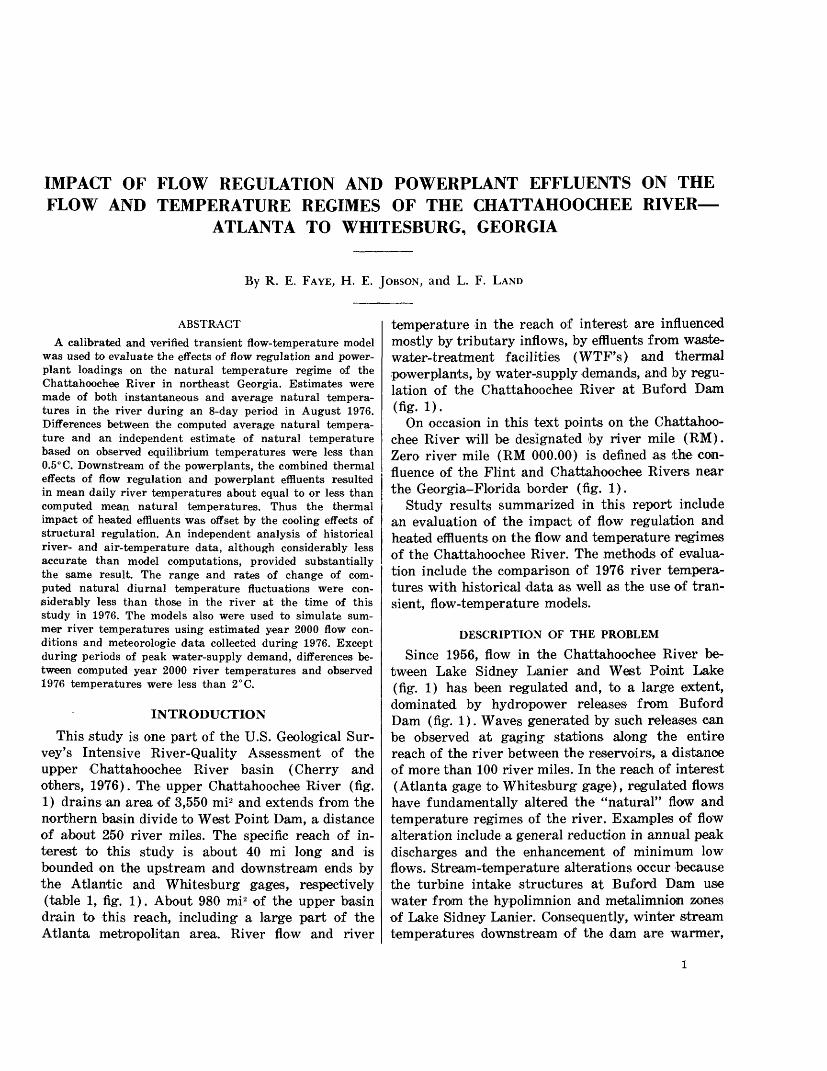
ABSTRACT
A calibrated and verified transient flow-temperature model was used to evaluate the effects of flow regulation and power- plant loadings on the natural temperature regime of the Chattahoochee River in northeast Georgia. Estimates were made of both instantaneous and average natural tempera tures in the river during an 8-day period in August 1976. Differences between the computed average natural tempera ture and an independent estimate of natural temperature based on observed equilibrium temperatures were less than 0.5° C. Downstream of the powerplants, the combined thermal effects of flow regulation and powerplant effluents resulted in mean daily river temperatures about equal to or less than computed mean natural temperatures. Thus the thermal impact of heated effluents was offset by the cooling effects of structural regulation. An independent analysis of historical river- and air-temperature data, although considerably less accurate than model computations, provided substantially the same result. The range and rates of change of com puted natural diurnal temperature fluctuations were con- isiderably less than those in the river at the time of this study in 1976. The models also were used to simulate sum mer river temperatures using estimated year 2000 flow con ditions and meteorologic data collected during 1976. Except during periods of peak water-supply demand, differences be tween computed year 2000 river temperatures and observed 1976 temperatures were less than 2°C.
INTRODUCTION
This study is one part of the U.S. Geological Sur vey's Intensive River-Quality Assessment of the upper Chattahoochee River basin (Cherry and others, 1976). The upper Chattahoochee River (fig. 1) drains an area of 3,550 mi2 and extends from the northern basin divide to West Point Dam, a distance of about 250 river miles. The specific reach of in terest to this study is about 40 mi long and is bounded on the upstream and downstream ends by the Atlantic and Whitesburg gages, respectively (table 1, fig. 1). About 980 mi 2 of the upper basin drain to this reach, including a large part of the Atlanta metropolitan area. River flow and river
temperature in the reach of interest are influenced mostly by tributary inflows, by effluents from waste- water-treatment facilities (WTF's) and thermal powerplants, by water-supply demands, and by regu lation of the Chattahoochee River at Buford Dam (ng. 1).
On occasion in this text points on the Chattahoo chee River will be designated by river mile (RM). Zero river mile (RM 000.00) is defined as the con fluence of the Flint and Chattahoochee Rivers near the Georgia-Florida border (fig. 1).
Study results summarized in this report include an evaluation of the impact of flow regulation and heated effluents on the flow and temperature regimes of the Chattahoochee River. The methods of evalua tion include the comparison of 1976 river tempera tures with historical data as well as the use of tran sient, flow-temperature models.
DESCRIPTION OF THE PROBLEM
Since 1956, flow in the Chattahoochee River be tween Lake Sidney Lanier and West Point Lake (fig. 1) has been regulated and, to a large extent, dominated by hydropower releases from Buford Dam (fig. 1). Waves generated by such releases can be observed at gaging stations along the entire reach of the river between the reservoirs, a distance of more than 100 river miles. In the reach of interest (Atlanta gage to Whitesburg gage), regulated flows have fundamentally altered the "natural" flow and temperature regimes of the river. Examples of flow alteration include a general reduction in annual peak discharges and the enhancement of minimum low flows. Stream-temperature alterations occur because the turbine intake structures at Buford Dam use water from the hypolimnion and metalimnion zones of Lake Sidney Lanier. Consequently, winter stream temperatures downstream of the dam are warmer,

35°
FLOW REGULATION AND POWERPLANT EFFLUENTS—CHATTAHOOCHEE RIVER, GEORGIA
85° 84° 83°
EXPLANATION
10 Water-data station
«— Hydrologfc boundary
34°
33°
7Lake
Sidney Lanier
——— -. __TENNESSEE^ . NORTH CAR^ ALABAMA ! GEORGIA " ———
UPPERCHATTAHOOCHEE^i
RIVER BASIN. v%••' FairbumCAPPS FERRY BRIDGE
Whitesbug FLINT RIVER BASIN
INDEX MAP
Base from U.S Geological Survey Greater Atlanta Region 1 100,000, 1974 Pheonix City 1 250,000, 1963 Greanville 1 250,000, 1964 Rome 1 250,000,1972
0 10 20 30 40 50 60 70 80 KILOMETERS
10 20 30 40 50 MILES
FIGURE 1.—Study area showing data-collection sites.
and summer temepratures are cooler than corre sponding "natural" temperatures.
Morgan Falls Dam and Georgia Power's Plants Atkinsion-McDonough (table 1, fig. 1) also effect river flows and river temperatures in the study reach. Morgan Falls Dam, located about 40 mi down
stream of Buford Dam, is a "run-of-the-river" hydropower facility that partially regulates river flows. The impact of such regulation on flow and stream temperatures in the study reach, however, is minimal. The Plants Atkinson-McDonough are thermal electric power facilities, that utilize river

INTRODUCTION
water in their operations. Heated effluents from boilers at the plants can raise stream temperatures by as much as 8°'C immediately downstream of their outfalls. In addition, quantities of river water are consumed in plant operation. The amounts con sumed, however, are small and river flows down stream of the plants are not noticably effected.
Water-resource managers and regulatory agencies are concerned with stream temperatures under present (1976) and future conditions of water-sup ply and waste-load allocations and the impact of such temperatures on stream quality. Of particular interest to resource managers are stream tempera tures during the late spring and summer months when tributary flows are low and ambient air tem peratures are highest. Any negative impact of high stream temperatures on stream quality would be most evident during such periods. Also of interest are stream temperatures during a critical drought period when tributary contributions to the Chatta hoochee River would be extremely low and the pro portion of waste discharges in the total streamflow correspondingly high.
Of interest to regulatory agencies are comparisons of 1976 stream temperatures with "natural" tem peratures; that is, temperatures occurring prior to construction of the powerplants and Buford Dam. On the one hand, the combined effects of stream
regulation and powerplant heat loads may presently produce lower than "natural" stream temperatures; even during the critical spring and summer months. On the other hand, heated effluents from the power- plants could be increasing stream temperatures ex cessively above "natural" conditions. The degree of future regulation of powerplant effluents may de pend on which situation prevails.
The objectives of this study are to provide some insight into these problems and to investigate the relationship between transient flows and stream temperatures in the Chattahoochee River. Specific study objectives apply only to the reach between the Atlanta and Whitesburg gages and include:1. The calibration and verification of deterministic,
transient, flow and temperature models.2. Use of the transient models to determine the im
pact of flow regulation and powerplant heat loadings on river temperatures using present (1976), future, and critical drought flow condi tions.
3. A comparison of 1976 and computed "natural" stream temperatures.
SCOPE OF THE STUDYMost of the data used in this study were collected
by the U.S. Geological Survey and other agencies as part of routine data-collection programs. Such
TABLE 1.—Periodic data-collection sites
usesstation No. Station name
Map referenceNo. River mile
(fig. 1)Data
02334430. 02336000. 02336020-
02336021_
02336300- 02336380- 02336450.
02336479.
02336480.
02336490.02336526.02336610.02336651.
02336653.
02337070.02337073.
02337170.
02337500.02338000.
-Chattahoochee River at Buford Dam ______. .Chattahoochee River at Atlanta (Atlanta gage).-Chattahoochee River at the Atlanta water-
supply facility..Chattahoochee River at the Cobb County
wastewater-treatment facility outfall..Peachtree Creek at Atlanta __________..Nancy Creek at Atlanta _____________..Chattahoochee River at the R. M. Clayton
wastewater-treatment facility outfall.-Chattahoochee River at the Plant McDonough
intake.-Chattahoochee River at the Plant McDonough
outfall.-Chattahoochee River at Georgia Highway 280 _. .Proctor Creek at Atlanta _____________. .Nickajack Creek near Mableton ____________-Chattahoochee River at the South Cobb County
wastewater-treatment facility outfall.-Chattahoochee River at the Utoy Creek waste-
water-treatment facility outfall. .Sweetwater Creek near Austell _______.-Chattahoochee River at the Camp Creek waste-
water-treatment facility outfall.-Chattahoochee River near Fairburn (Fair-
burn gage).-Snake Creek near Whitesburg _________.-Chattahoochee River near Whitesburg
(Whitesburg gage).
1__ 348.ia__.2__ 302.97__.3__ 300.62__.
TemperatureStage, temperatureStage, mean daily withdrawal
4____
5__ _____ .6__ _____ .7__ 300.24_.
8__ 299.23_.
9__ 299.15__.
10__ 298.77_.11__ _____.12__ _____.13__ 294.28__.
300.56__ Mean daily discharge
Mean daily discharge Mean daily discharge Mean daily discharge
Temperature
Stage
Temperature Mean daily discharge Mean daily discharge Mean daily discharge
291.48__ Mean daily discharge
15 __ ________16 __ 283.78
17 __ 281.79 ___
19 __ 259.85 __
Mean daily discharge Mean daily discharge
Stage, temperature
Mean daily discharge Stage
FLOW REGULATION AND POWERPLANT EFFLUENTS—CHATTAHOOCHEE RIVER, GEORGIA
data are listed by type and station in table 1. Time series data were obtained for two 8-day periods in July and August 1976. These data include: (1) Hourly stage and stream temperatures at several stations on the Chattahoochee River; (2) hourly meteorologic data at one station; (3) mean daily effluent discharges at five wastewater-treatment facilities; (4) mean daily discharge at several gaged tributary streams; and (5) mean daily withdrawals from the Chattahoochee River at the Atlanta water- supply facility. Hourly meteorlogic data were col lected at the R. M. Clayton WTF (table 1 and fig. 1) and include wet and dry bulb air temperatures, long and short wave radiation, wind speed and direc tion, and rainfall. Meteorologic data used in this study are listed by parameter in the Summary of Data Section at the end of this report (table 10). Mean daily flows at the various WTF outfalls and at the water-supply facility were treated as tribu tary contributions and diversions, respectively. Measurements of streamflow in the larger tribu taries draining to the study reach were made on July 12, 1976.
River cross-section and bed-elevation data at 36 locations were obtained originally from the U.S. Army Corps of Engineers (1973). Channel widths and bed elevations at most of these locations were corrected using data collected during a field recon naissance in May 1977 when flow conditions were low and generally steady. Cross-section data at five additional locations were collected during this recon naissance along with the shading or barrier heights of the river banks and the trees lining the banks. Coordinates and barrier heights for all cross sections used in this study are listed in the Summary of Data Section at the end of this publication.
In general, data used in this report are dimen sioned according to the units in which the data were reported or collected. Thus, river temperatures and most meteorologic data are expressed in metric unite, and channel, stages, and discharge data are given in inch-pound units. A list of metric to inch- pound conversion factors is provided at the front of this report.
Symbols in this report are defined where they first appear in the text.
DESCRIPTION OF THE STUDY AREA
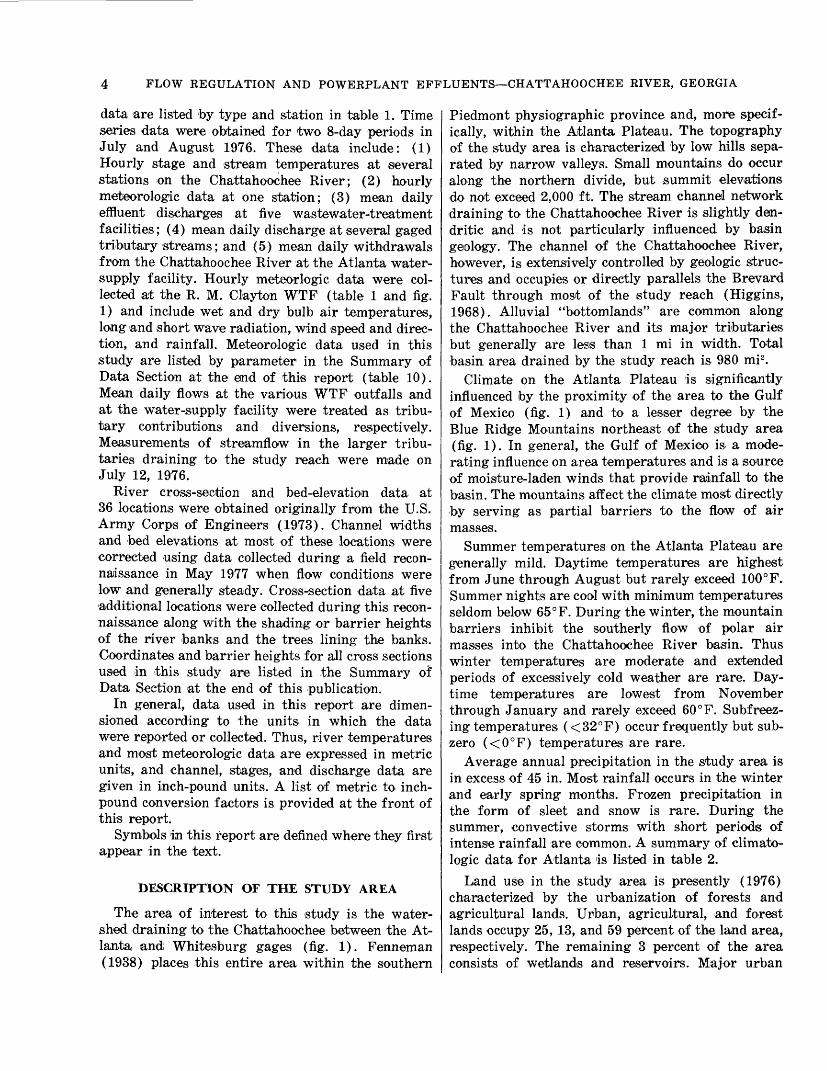
The area of interest to this study is the water shed draining to the Chattahoochee between the At lanta and; Whitesburg gages (fig. 1). Fenneman (1938) places this entire area within the southern
Piedmont physiographic province and, more specif ically, within the Atlanta Plateau. The topography of the study area is characterized by low hills sepa rated by narrow valleys. Small mountains do occur along the northern divide, but summit elevations do not exceed 2,000 ft. The stream channel network draining to the Chattahoochee River is slightly den dritic and is not particularly influenced by basin geology. The channel of the Chattahoochee River, however, is extensively controlled by geologic struc tures and occupies or directly parallels the Brevard Fault through most of the study reach (Higgins, 1968). Alluvial "bottomlands" are common along the Chattahoochee River and its major tributaries but generally are less than 1 mi in width. Total basin area drained by the study reach is 980 mi2 .
Climate on the Atlanta Plateau is significantly influenced by the proximity of the area to the Gulf of Mexico (fig. 1) and to a lesser degree by the Blue Ridge Mountains northeast of the study area (fig. 1). In general, the Gulf of Mexico is a mode rating influence on area temperatures and is a source of moisture-laden winds that provide rainfall to the basin. The mountains affect the climate most directly by serving as partial barriers to the flow of air masses.
Summer temperatures on the Atlanta Plateau are generally mild. Daytime temperatures are highest from June through August but rarely exceed 100°F. Summer nights are cool with minimum temperatures seldom below 65°F. During the winter, the mountain barriers inhibit the southerly flow of polar air masses into the Chattahoochee River basin. Thus winter temperatures are moderate and extended periods of excessively cold weather are rare. Day time temperatures are lowest from November through January and rarely exceed 60 °F. Subfreez- ing temperatures (<32°F) occur frequently but sub zero (<0°F) temperatures are rare.
Average annual precipitation in the study area is in excess of 45 in. Most rainfall occurs in the winter and early spring months. Frozen precipitation in the form of sleet and snow is rare. During the summer, convective storms with short period® of intense rainfall are common. A summary of climato- logic data for Atlanta is listed in table 2.
Land use in the study area is presently (1976) characterized by the urbanization of forests and agricultural lands. Urban, agricultural, and forest lands occupy 25, 13, and 59 percent of the land area, respectively. The remaining 3 percent of the area consists of wetlands and reservoirs. Major urban
DESCRIPTION OF THE STUDY AREA
TABLE 2.—Summary of climatologic data for Atlanta, 1941-70
Temperature <°F)
Month
April ... __ ... _ ..May . __ . —— _______ June ______--.______ July _ — -———.-August --_--. __ -_ _
October _--__--._ _ November .___ _ ._. December _ . _ __
Record totals _ Yearly
Averages.
Mean daily maxi mum
51.4 __54.5--..61.1 ——71.4--..79.0- __ 84.6 __ 86.5 __ 86.4---. 81.2. .72.5 .... 61.9--.. 52.7 __
70.3- ...
Mean daily mini mum
33.4 __35.5 __41.1 __50.7 __59.2 ____ 66.6 ____ 69.4 __ . 68.6 ____ 63.4. ___52.3 ____ 40.8 ____ 34.3 __
.51.3 __
Record high
72 __79 __85——88 __93 __98 ____ 98____ 98_...93. ...88 __ 84, __ 77 - -98_...
Record low
— 3 __8 __
21 ____26. ..37 .... 48 __ 53--. 56--- 36- -.29 __ 14 __ I....
— 3 __
Precipitation (in)
Aver age daily mean
4.34 __
5.84 __4.61. __3.71 ____ 3.67 — — 4.90 __ 3.54 ____ 3.15--..2.50 __ 3.43 __ 4.24 __
48.34 __
Record daily high
3 915.67 __5.08 __4.26 __5.13 __ 3.41 __ 5.44 __ 5.05 __ 5.46.-..3.27 .___ 4.11 __ 3.85. —5.67 __
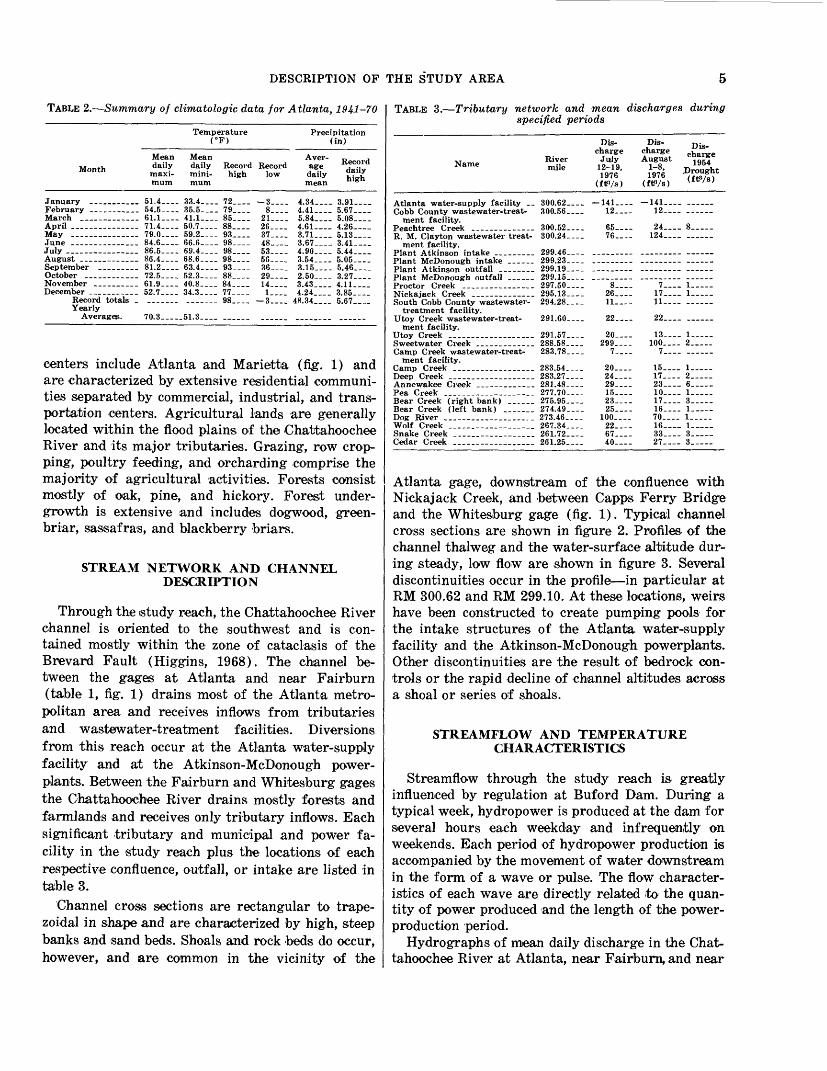
centers include Atlanta and Marietta (fig. 1) and are characterized by extensive residential communi ties separated by commercial, industrial, and trans portation centers. Agricultural lands are generally located within the flood plains of the Chattahoochee River and its major tributaries. Grazing, row crop ping, poultry feeding, and orcharding comprise the majority of agricultural activities. Forests consist mostly of oak, pine, and hickory. Forest under growth is extensive and includes dogwood, green- briar, sassafras, and blackberry briars.
STREAM NETWORK AND CHANNEL DESCRIPTION
Throug-h the study reach, the Chattahoochee River channel is oriented to the southwest and is con tained mostly within the zone of cataclasis of the Brevard Fault (Higgins, 1968). The channel be tween the gages at Atlanta and near Fairburn (table 1, fig. 1) drains most of the Atlanta metro politan area and receives inflows from tributaries and wastewater-treatment facilities. Diversions from this reach occur at the Atlanta water-supply facility and at the Atkinson-McDonoug-h power- plants. Between the Fairburn and Whitesburg gages the Chattahoochee River drains mostly forests and farmlands and receives only tributary inflows. Each significant tributary and municipal and power fa cility in the study reach plus the locations of each respective confluence, outfall, or intake are listed in table 3.
Channel cross sections are rectangular to trape zoidal in shape and are characterized by high, steep banks and sand beds. Shoals and rock beds do occur, however, and are common in the vicinity of the
TABLE 3.—Tributary network and mean discharges during specified periods
Name
Atlanta water-supply facility .. Cobb County wastewater-treat
ment facility.
ment facility.
South Cobb County wastewater- treatment facility.
ment facility.
Sweetwater Creek _____________
ment facility. Camp Creek __________________
Pea Creek
Bear Creek (left bank) ... .___
Wolf Creek . __ _ . .Snake Creek ...... — ._ — _-_.. Cedar Creek _ ...__--- _______
River mile
300.62 __ 300.56 ____
300.52 __300.24 ____
299.46299.23 _-._299.19 ..299.15 __._297.50 ____295.13 ____294.28.-..
291.57 __._288.58 ____
283.54 ____ 283.27 ...281.4897C QC
274.49 __._ 273.46.--.267.34...261.72 -.-. 261.25 ____
Dis charge July
12-19, 1976
(ftVs)
— 141 ——12 ____
65——76..--
8 ____26 __11 ___.
22 ——
20 —— _299 _ ——
7——
20 ____ 24. ..29 ...
91
25 __ — 100.. .
22 ——67 ____ 40 __—
Dis charge August
1-8, 1976
(fWs)
— 141 ____ 12 ——
24——124 __._
7 ___.17 ____11——
22 ——
13 ——100 ____
7 _—
15 ____ 17. ..23 __10 — .17 ____16 ____ 70 ——16 __33 ——27 __ -
Dis charge
1954 Drought (ftf/s)
8 _____
1 ___1 _____
1 _____2 _____
1 _____ 2 _____6 __ _1 _____3— —1 __ _ I. ...1 ____3 _____3.——
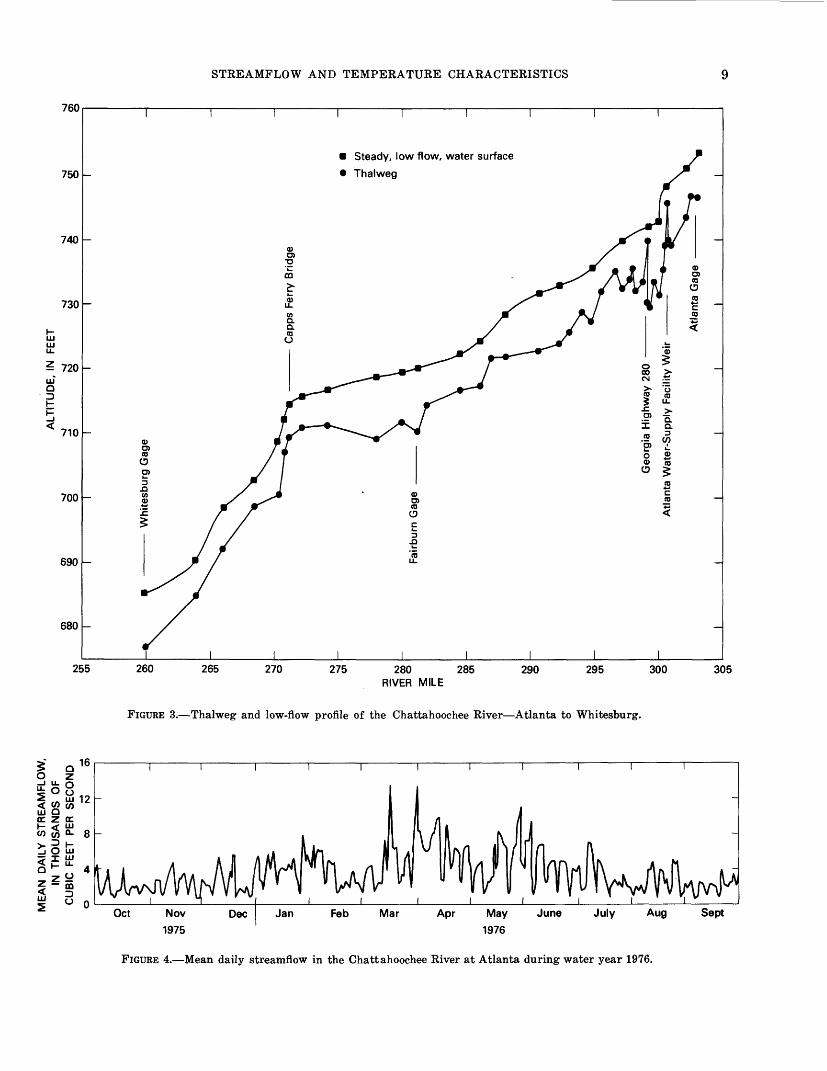
Atlanta gage, downstream of the confluence with Nickajack Creek, and between Capps Ferry Bridge and the Whitesburg gage (fig. 1). Typical channel cross sections are shown in figure 2. Profiles of the channel thalweg and the water-surface altitude dur ing steady, low flow are shown in figure 3. Several discontinuities occur in the profile—in particular at RM 300.62 and RM 299.10. At these locations, weirs have been constructed to create pumping pools for the intake structures of the Atlanta water-supply facility and the Atkinson-McDonough powerplants. Other discontinuities are the result of bedrock con trols or the rapid decline of channel altitudes across a shoal or series of shoals.
STREAMFLOW AND TEMPERATURE CHARACTERISTICS
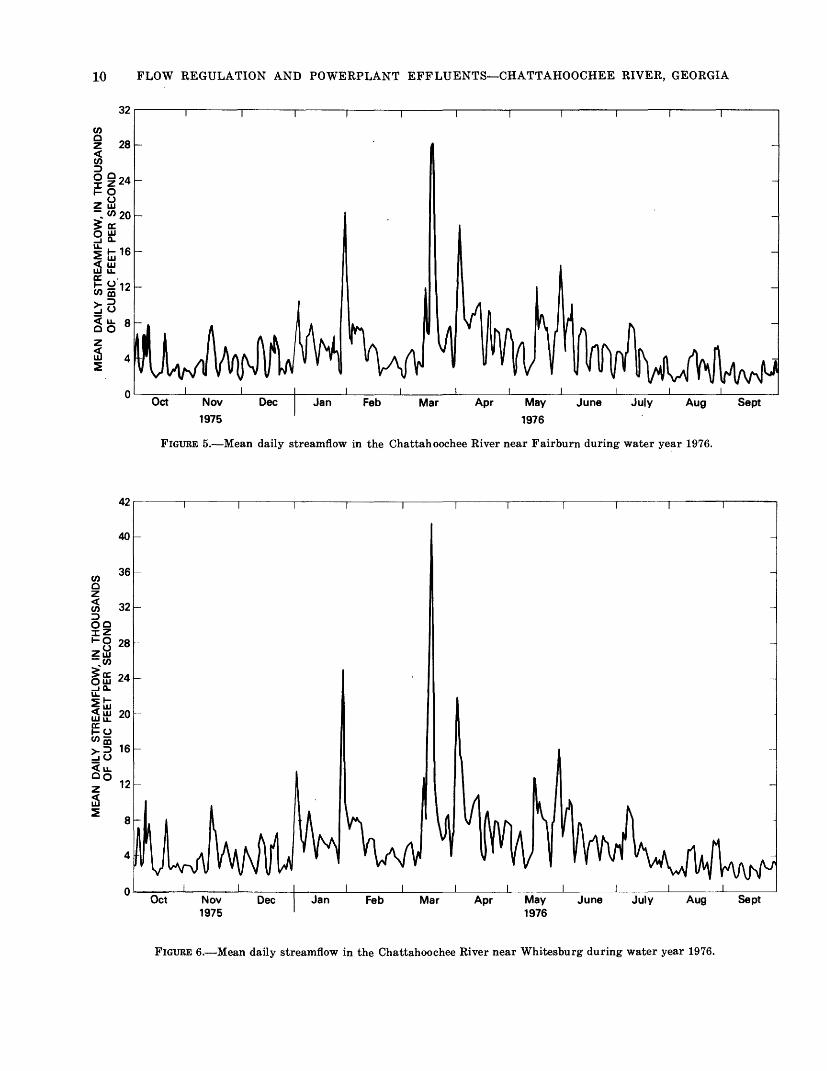
Streamflow through the study reach is greatly influenced by regulation at Buford Dam. During1 a typical week, hydropower is produced at the dam for several hours each weekday and infrequently on weekends. Each period of hydropower production is accompanied by the movement of water downstream in the form of a wave or pulse. The flow character istics of each wave are directly related to the quan tity of power produced and the length of the power- production period.
Hydrographs of mean daily discharge in the Chat tahoochee River at Atlanta, near Fairburn, and near

FLOW REGULATION AND POWERPLANT EFFLUENTS—CHATTAHOOCHEE RIVER, GEORGIA
770
760
ujQD
Q ill 00
750
740100 200
CHANNEL WIDTH, IN FEET
A
300
700
690
Q ill 00
680
670
RM 259.87 Whitesburg Gage
100 200 CHANNEL WIDTH, IN FEET
B
300
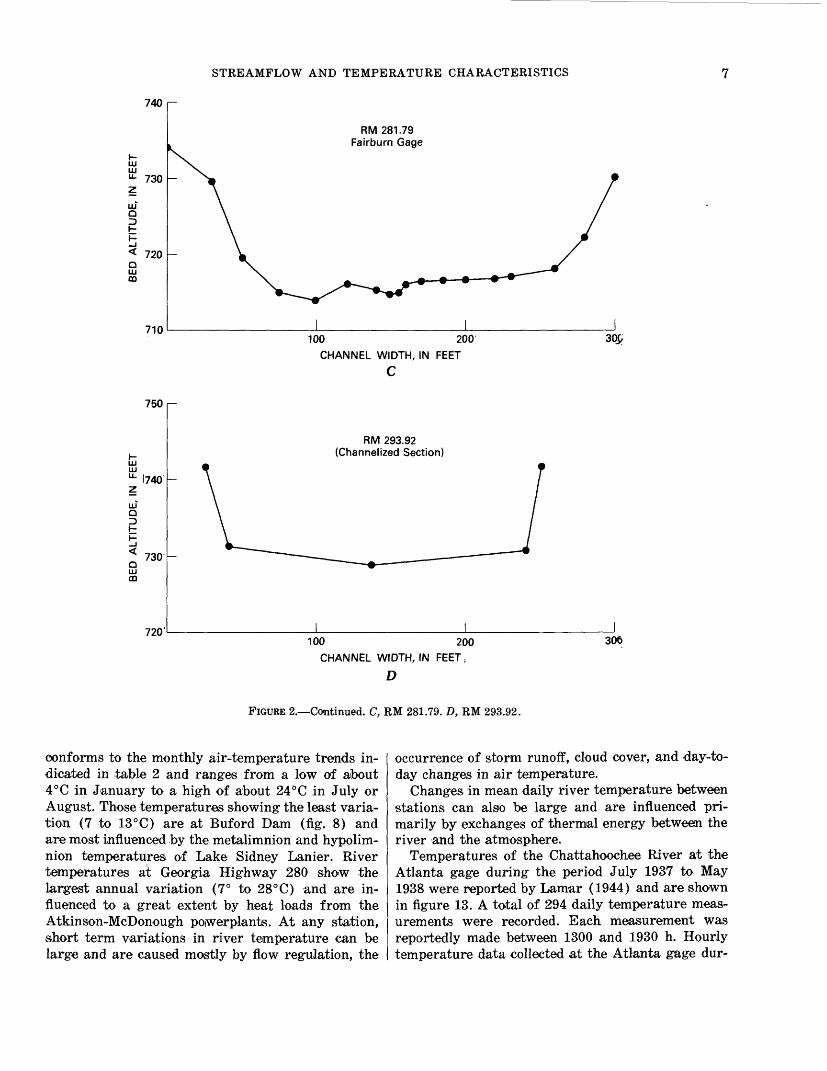
FIGURE 2.—Selected channel cross sections of the Chattahoochee River from Atlanta to Whitesburg. A, RM 302.97. B, RM 259.87.
Whitesburg1 are shown in figures 4 through 6. The cyclic nature of the flows is apparent and reflects the weekly (7-day) period characterized by 5 days of power production at Buford Dam followed by 2 days with little or no production. Anomalously high peaks on the hydrographs correspond to periods of high rainfall runoff.
The long term effects of regulation on streamflow are indicated by the flow duration curves in figure
7. Since regulation, peak flows are smaller in both magnitude and duration, and minimum, flows are larger.
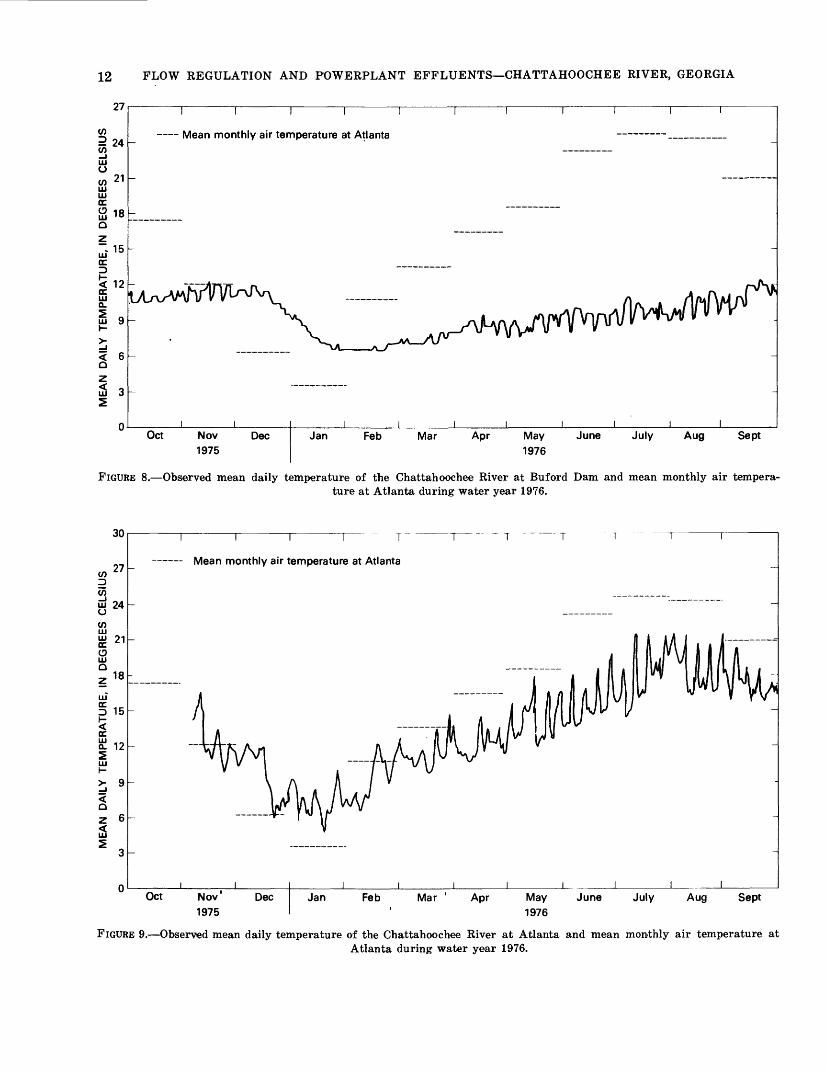
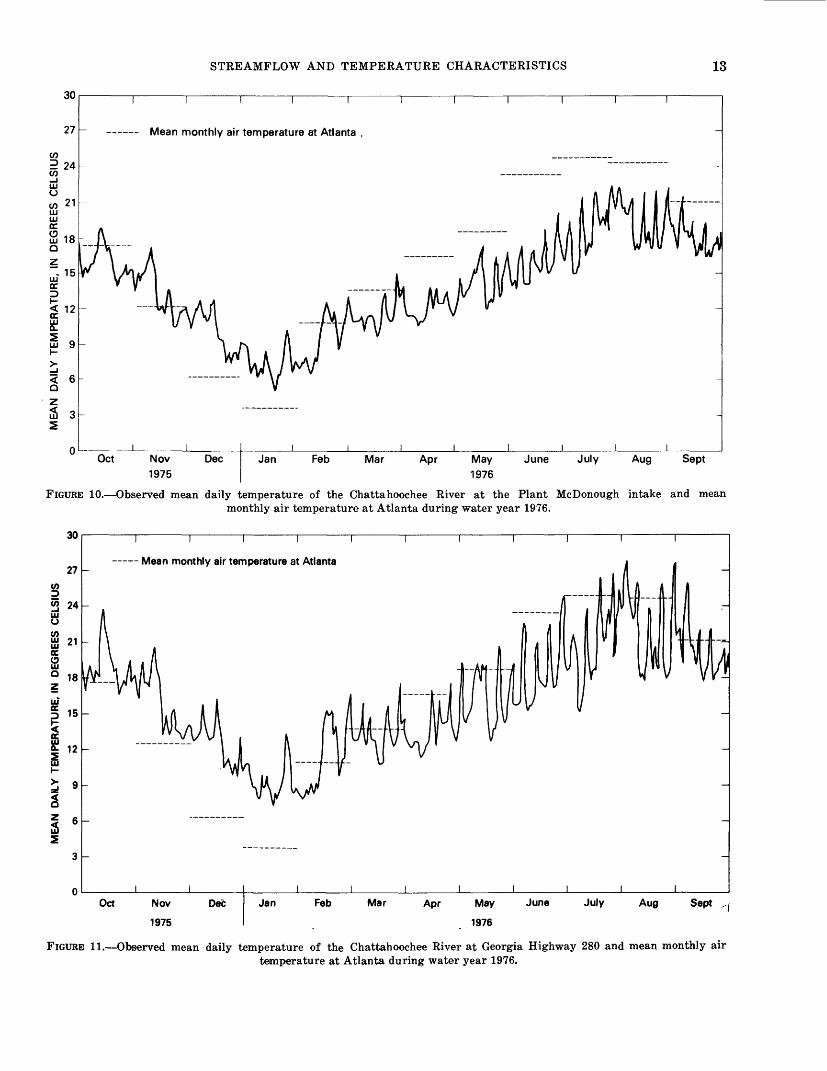
Mean daily river temperatures at several stations on the Chattahoochee River are shown in figures 8 through 12. Each graph represents mean daily river temperature computed from hourly measurements recorded during water year 1976. At most stations, the annual variation of river temperatures generally
STREAMFLOW AND TEMPERATURE CHARACTERISTICS
740
730
< 720QLLJ CO
710
RM 281.79 Fairburn Gage
100 200
CHANNEL WIDTH, IN FEET
c
305;
750
t740
QLU QQ
730
720'
RM 293.92 (Channelized Section)
100 200
CHANNEL WIDTH, IN FEET,
D
306
FIGURE 2.—Continued. C, RM 281.79. D, RM 293.92.
conforms to the monthly air-temperature trends in dicated in table 2 and ranges from a low of about 4°C in January to a high of about 24°C in July or August. Those temperatures showing the least varia tion (7 to 13°C) are at Buford Dam (fig. 8) and are most influenced by the metalimnion and hypolim- nion temperatures, of Lake Sidney Lanier. River temperatures at Georgia Highway 280 show the largest annual variation (7° to 28°C) and are in fluenced to a great extent by heat loads from the Atkinson-McDonough powerplants. At any station, short term variations in river temperature can be large and are caused mostly by flow regulation, the
occurrence of storm runoff, cloud cover, and day-to day changes in air temperature.
Changes in mean daily river temperature between stations can also be large and are influenced pri marily by exchanges of thermal energy between the river and the atmosphere.
Temperatures of the Chattahoochee River at the Atlanta gage during the period July 1937 to May 1938 were reported by Lamar (1944) and are shown in figure 13. A total of 294 daily temperature meas urements were recorded. Each measurement was reportedly made between 1300 and 1930 h. Hourly temperature data collected at the Atlanta gage dur-

FLOW REGULATION AND POWERPLANT EFFLUENTS—CHATTAHOOCHEE RIVER, GEORGIA
720
710
< 700OLU GO
690
RM 268.34
100 200 300CHANNEL WIDTH, IN FEET
£
400
760
750
oD
QLU GO
740
730
100 200 CHANNEL WIDTH, IN FEET
300
FIGURE 2.—Continued. E, RM 268.14. F, RM 298.77.
ing water year 1976 indicate that stream tempera tures during- the afternoon and early evening depart from mean daily stream temeprature by 1.5°C or less. The same criterion applied to the 1937-38 temperatures indicates that these data are represen tative of mean daily stream temperature within an error of 1.5 °C and, for comparative purposes, are treated accordingly in this text.
The comparision of river-temperature data at the Atlanta gage collected before (fig. 13) and after (fig. 9) the construction of Buford Dam provides some insight into the impact of flow regulation on river temperatures. During water years 1937-38, annual variations in river temperature at Atlanta
were considerably greater than those measured in water year 1976—ranging from 1.5 to 31 °C com pared to 4.5 to 21.5°C. Also, annual extremes oc curred at different times of the year. During water year 1976, the annual low and high temperatures occurred in January and August, respectively; cor responding months for the 1937-38 temperature ex tremes were December and July.
Some of the variability in river temperature at tributed to flow regulation could also be caused by differences in meteorologic conditions. The actual meteorologic contribution to river temperatures can not be determined; however, estimates can be made by comparing mean monthly air temperatures at At-
STREAMFLOW AND TEMPERATURE CHARACTERISTICS
760
750
740
730
fcLLJ LL.
? 720LU O
< 710
700
690
680
• Steady, low flow, water surface• Thalweg
255 260 265 270 275 280 285RIVER MILE
290 295 300 305
FIGURE 3.—Thalweg and low-flow profile of the Chattahoochee River—Atlanta to Whitesburg.
Jan Feb Mar Apr May June July Aug SeptOct Nov 1975
FIGURE 4.—Mean daily streamflow in the Chattahoochee River at Atlanta during water year 1976.
ME
AN
D
AILY
STR
EAM
FLO
W,
IN T
HO
US
AN
DS
O
F C
UBI
C F
EET
PER
SEC
ON
D
g o> £0 a
2. «<T en ? So 3 3s
1 a> O cr £0 cr 8 o cr » S' ^ a> fo
^ | g" A CL
C
2 W3
^ ! «< «o
-<I os
ME
AN
DA
ILY
STR
EA
MFL
OW
, IN
TH
OU
SA
ND
S
OF
CU
BIC
FEE
T PE
R SE
CO
ND
-»
-»
M
CO
CO
GO
O
^
00
ISJ
O)
O
^
00
ISJ
1 I
I I
T
O r* o o d o o o w •53 ^ r cj w SS
H w l> H
H
l>
W
O
O
O w W
W w Jfl o w o » o
STREAMFLOW AND TEMPERATURE CHARACTERISTICS 11
36
32
28
oz oLU 24
ECLU Q.
LU LU LL
5 20 o
o
O16
o00o
12
— — Prior to construction of Buford Dam——— Subsequent to construction of Buford Dam
0.1 5 20 50 90 99
PERCENTAGE OF TIME FLOW EQUALED OR EXCEEDED
99.99
FIGURE 7.—Flow duration characteristics of the Chattahoochee River at Atlanta prior to and subse quent to the construction of Buford Dam.
12 FLOW REGULATION AND POWERPLANT EFFLUENTS—CHATTAHOOCHEE RIVER, GEORGIA
27
24
21UJO u>UJ UJ<r O
UJccDiffuj 9
< 6Q
12
—— Mean monthly air temperature at Atlanta
Oct Nov 1975
Dec Jan Feb Mar Apr May 1976
June July Aug Sept
FIGURE 8.—Observed mean daily temperature of the Chattahoochee River at Buford Dam and mean monthly air tempera ture at Atlanta during water year 1976.
30
GJ24
LLJ UJ OC O UJQ
QCUJ „-a. 12
OZ 6
I I————————— ~ T
Mean monthly air temperature at Atlanta
Oct Nov'
1975Dec Jan Feb Mar ' Apr May
1976June July Aug Sept
FIGURE 9.—Observed mean daily temperature of the Chattahoochee River at Atlanta and mean monthly air temperature atAtlanta during water year 1976.
STREAMFLOW AND TEMPERATURE CHARACTERISTICS 13
Mean monthly air temperature at Atlanta ,
O 1—Oct Nov
1975
FIGURE 10.—Observed mean daily temperature of the Chattahoochee River at the Plant McDonough intakemonthly air temperature at Atlanta during water year 1976.
30
27
I I I I
—— Mean monthly air temperature at Atlanta
1 1Oct Nov
1975
DecI I I
Jan Feb Mar AprI
May
1976
I I IJune July Aug
iSept „
FIGURE 11.—Observed mean daily temperature of the Chattahoochee River at Georgia Highway 280 and mean monthly airtemperature at Atlanta during water year 1976.

14 FLOW REGULATION AND POWERPLANT EFFLUENTS—CHATTAHOOCHEE RIVER, GEORGIA
——— Mean monthly air temperature at Atlanta
Aug Sept
FIGURE 12.—Observed mean daily temperature of the Chattahoochee River near Fairburn and mean monthly air tempera ture at Atlanta during water year 1976.
lanta for the periods 1937-38 and 1975-76 (NOAA, 1976). These data are listed in table 4 for the coin cident months of river-temperature record. Winter air temperatures during 1975-76 were generally colder than corresponding temperatures for the period 1937-38 and summer and fall air tempera tures were about the same or warmer. River temper atures at the Atlanta gage, however, show nearly op posite trends—being warmer during the winter of 1975-76 and cooler during the summer and early fall. Thus, observed differences in river temperature at Atlanta during the periods 1937-38 and 1975-76 would at best have been dampened or minimized by the prevailing meteorologic conditions and have for the most part been correctly attributed to flow regu lation at Buford Dam.
For purposes of this study, "natural" river tem peratures at a station are defined as those tempera tures resulting from the combined thermal effect of atmospheric exchange and tributary inflow on stream waters between the headwaters and the sta tion. Thus, by definition, "natural" temperatures cannot be significantly affected by upstream arti ficial heat sources or sinks. Application of this defini tion to the observed river-temperature data de scribed previously (figs. 8-13) indicates that the 1937-38 stream temepratures at the Atlanta gage (fig. 13) probably closely approximate natural tem peratures and are considered as such in this text.
Mean monthly air temperatures at Atlanta are listed in table 4 and are shown graphically by hori zontal lines on figures 8 to 13. Corresponding mean
TABLE 4.—Mean monthly air temperatures at Atlanta for the period of record and for specified months during 1937-38 and1975-76, in degrees Celsius
Year ——
1937 _ _. _1938 _ _ __1975 _ _____1976 _ _ _1879-1975 __
Month
Jan.
6.1
3.6 6.3
Feb.
10.8
10.87.6
Mar.
14.7
13.6 11.4
Apr.
16.3
16.5 16.3
May
18.6 20.8
June
——
23.2 24.6
July
26.4
24.7 25.8
Aug.
26.4
24.4 25.4
Sept.
21.8
21.0 22.8
Oct.
14.9
17.4
17.1
Nov.
8.6
12.2
11.1
Dec.
6.2 ~6~3
7.0

STREAMFLOW AND TEMPERATURE CHARACTERISTICS 15
36
33
27
-—— Mean monthly air temperature at Atlanta
0
LLJiu 24 <r
D 18
DCS 15
LU
> 12
Z 9
5 6
July Aug Sept Oct 1937
Nov Dec Jan Feb Mar Apr 1938
May June
FIGURE 13.—Observed mean daily temperature of the Chattahoochee River and mean monthly air temperature at Atlanta—July 1937 to May 1938.
TABLE 5.—Mean monthly water temperatures during 1937- 38 and 1975-76, in degrees Celsius
Month
October _____ November _ _ December _ __ January _ _ _FebruaryMarch _ ____
May ________ June _______July __ ____August _ _September
Q«1*<3S oa~
11.0__ 11.5— 11.0—
7.5__6.5 _7.58.58.5__ 9.5 _9.5_
10.5 _11.5_
Atlanta gage (1937-38)
17.7— 10.2 —
7.2__ 7.4 _
11.3—14.4 _17.4—
29.427.624.7 _
Atlanta gage (1975-76)
13.0— 10.0—
7.0—9.0 —
11.5—12.014.0— 15.518.0 _18.517.5 _
Ifo£ 32sr<u •£•* §5 E-S
16.0— 13.5__ 10.5—
7.5 _9.5
11.5 _12.0 _14.5__ 16.018.5-19.518.0
Georgia Highway
280 (1975-76)
18.5— 15.5__ 12.5—
9.0__11.013.013.516.5— 18.521.022.020.0
Fairbum gage
(1975-76)
18.5— 15.0__ 11.0—
11.0 _13.0
1~8~6"
22.023.521.5
monthly river temperatures are listed by location and period of record in taible 5. Comparison of mean monthly air and water temperatures at the Atlanta gage during 1937-38 (fig. 9, tables 4 and 5) indi
cates that mean monthly natural stream tempera tures are within ±3°C of mean monthly air tempera tures. Similar relations have also been observed for the Severn River in England and for the Illinois River in data presented by Langford (1970) and Kothandaraman and Evens (1972), respectively. Application of this relation to the temperature data collected during 1975-76 implies that differences be tween mean monthly air and river temperatures in excess of 3°C result partly from artificial thermal alteration; that is from flow regulation and power- plant effluents. Thus, hydropower production ap pears to have a significant cooling effect on river temperatures at Buford Dam, especially through the period March to September, and warms the river significantly during the months of December and January (fig. 8). At the Atlanta gage (fig. 9), much of the cooling effect noted at Buford Dam has been dissipated, and the river temperatures more closely approximate a natural, annual pattern. The cooling effects of hydropower production are still noticable,
16 FLOW REGULATION AND POWERPLANT EFFLUENTS—CHATTAHOOCHEE RIVER. GEORGIA
however, especially during the period April through September. Only slight differences in mean monthly river temperatures were noted between the Atlanta gage and the Plant McDonough intake (figs. 9 and 10). These differences should be expected given the short distance between the stations and the absence of significant heat sources or sinks in the intervening reach. Comparison of mean monthly air and river temperatures at Georgia Highway 280 (fig. 11, tables 4 and 5) indicates that the combined effect of flow regulation and powerplant effluents results in mean river temperatures approximately equal to mean natural temperatures throughout most of the period February to October and greater than natural temperatures during December and January. Similar results were noted at the Fairburn gage (fig. 12).
Thus, in summary, comparisons of mean monthly air and river temperatures have indicated both the occurrence and magnitude of river temperature al terations that result from flow regulation at Buford Dam and heat loadings from the Atkinson-Mc- Donough powerplants. Significant cooling below natural temperatures was noted downstream of Bu ford Dam, at the Atlanta gage, and at the Plant McDonough intake during the spring and summer months. Flow regulation produced warmer than natural river temperatures at the same stations dur ing the winter. Downstream from the powerplants, the combined effect of flow regulation and power- plant heat loads was shown to produce river temper atures approximating natural conditions during much of the spring and summer and warmer than natural temperatures during the early winter months.
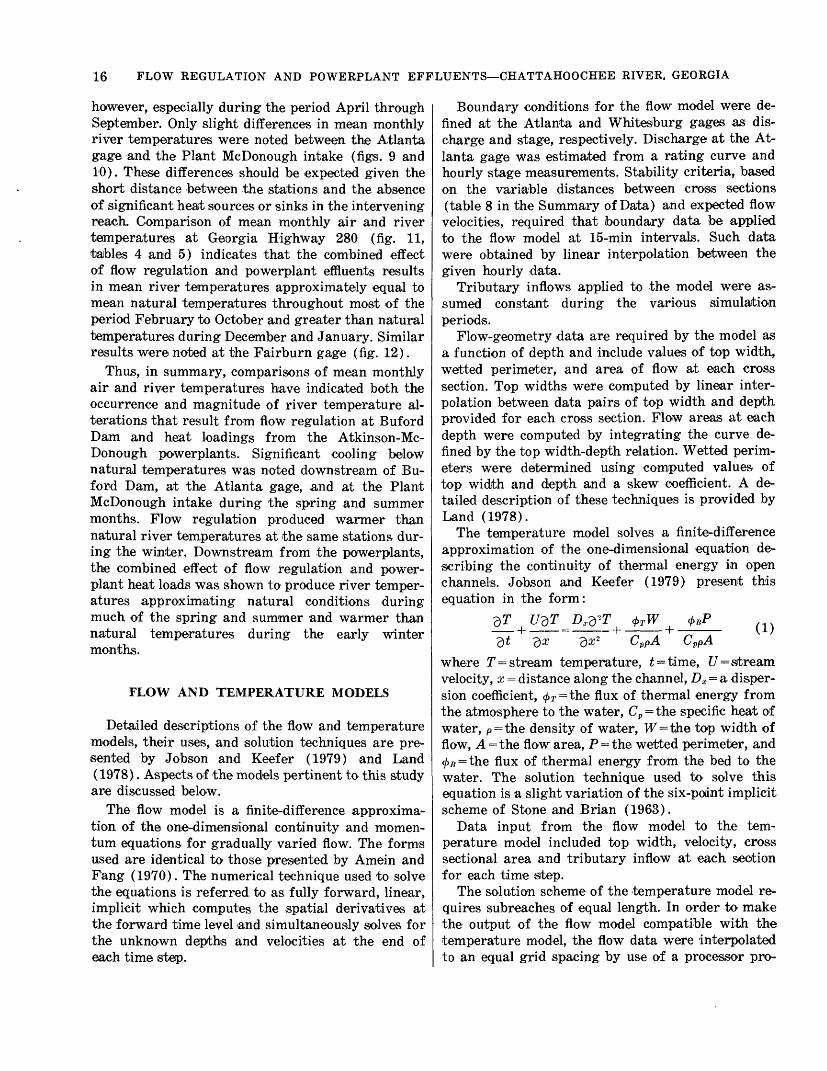
FLOW AND TEMPERATURE MODELS
Detailed descriptions of the flow and temperature models, their uses, and solution techniques are pre sented by Jobson and Keefer (1979) and Land (1978). Aspects of the models pertinent to this study are discussed below.
The flow model is a finite-difference approxima tion of the one-dimensional continuity and momen tum equations for gradually varied flow. The forms used are identical to those presented by Amein and Fang (1970). The numerical technique used to solve the equations is referred to as fully forward, linear, implicit which computes the spatial derivatives at the forward time level and simultaneously solves for the unknown depths and velocities at the end of each time step.
Boundary conditions for the flow model were de fined at the Atlanta and Whitesburg gages as dis charge and stage, respectively. Discharge at the At lanta gage was estimated from a rating curve and hourly stage measurements. Stability criteria, based on the variable distances between cross sections (table 8 in the Summary of Data) and expected flow velocities, required that boundary data be applied to the flow model at 15-min intervals. Such data were obtained by linear interpolation between the given hourly data.
Tributary inflows applied to the model were as sumed constant during the various simulation periods.
Flow-geometry data are required by the model as a function of depth and include values of top width, wetted perimeter, and area of flow at each cross section. Top widths were computed by linear inter polation between data pairs of top width and depth provided for each cross section. Flow areas at each depth were computed by integrating the curve de fined by the top width-depth relation. Wetted perim eters were determined using computed values of top width and depth and a skew coefficient. A de tailed description of these techniques is provided by Land (1978).
The temperature model solves a finite-difference approximation of the one-dimensional equation de scribing the continuity of thermal energy in open channels. Jobson and Keefer (1979) present this equation in the form:
-&T VdT Dx-d"-T $T W faP ,.,.—— + —— = ——~ + -^—7 + r A (1)QV Q& QX" \^> ppA. \sppA.
where T = stream temperature, £ = time, U = stream velocity, x = distance along the channel, Dx = a disper sion coefficient, </> r = the flux of thermal energy from the atmosphere to the water, Cp = the specific heat of water, p = the density of water, T^ = the top width of flow, A = the flow area, P = the wetted perimeter, and <£/} = the flux of thermal energy from the bed to the water. The solution technique used to solve this equation is a slight variation of the six-point implicit scheme of Stone and Brian (1963).
Data input from the flow model to the tem perature model included top width, velocity, cross sectional area and tributary inflow at each section for each time step.
The solution scheme of the temperature model re quires subreaches of equal length. In order to make the output of the flow model compatible with the temperature model, the flow data were interpolated to an equal grid spacing by use of a processor pro-

CALIBRATION AND VERIFICATION 17
gram. The logic of this program assured that the total instantaneous volume of water within any subreach was the same for both models.
Observed river temperatures at the Atlanta gage served as the necessary boundary condition for the temperature model. Temperatures of the tributary inflows were unavailable but were estimated by re gression from the equation:
-12.25 (2)
where 2\=instantaneous tributary temperature, Tw& = instantaneous wet bulb temperature, and i is a time step indicator. Development of this equation was based on 41 instantaneous tributary tempera ture measurements made in the study area during the summer of 1976. Standard error of estimate of this regression is 3.2°C.
The flux of thermal energy between the bed and the water is small compared to other heat flux and was computed using the procedure outlined by Jobson and Keefer (1979).
The flux of thermal energy from the atmosphere to the water, $T, is the result of several processes and is generally described by the relation:
i _ i i ; i i , i . fO\tyT — OAT — *Pb — >V — fyh ~"~ 0/»* ~"~ fy</ \*J /
where <£A- = net heat flux caused by incoming radia tion from the sun and atmosphere, ^> 6 = heat flux caused by longwave radiation emitted by the water, <t> c = heat utilized by evaporation, <£/, = heat conducted from the water as sensible heat, <£/. = heat added by rain falling directly on the surface, and ^^heat added to the river by tributary inflow. Only the flux of incoming .solar radiation could be measured directly by meteorologic instruments. The flux of in coming atmospheric radiation was computed using the procedure outlined by Koberg (1964). The radi ation flux emitted by the water surface (t£ b ) was computed using the Steffan-Boltzman equation (Job- son and Keefer, 1979). Three percent of the incom ing atmospheric radiation was assumed to be re flected while the percentage of solar radiation re flected was estimated from a complex relation be tween the azimuth and height of the sun, the azi muth of the subreach, width of the subreach, and the effective shading height of the riverbanks and trees along the banks (Jobson and Keefer, 1979). The heat flux caused by evaporation and conduction was computed using meteorologic data, Dalton's Law, and the analog of mass and heat transfer as explained by Bowen's ratio (Jobson and Keefer, 1979). The wind function used in Dalton's Law is proportional to the wind function derived by Jobson
(1977a and b) from thermal data collected on the San Diego Aqueduct in southern California.
The combined heat load from the Atkinson-Mc- Donough powerplants to the Chattahoochee River was not measured directly. Computation of instan taneous loads was originally accomplished using the observed temperature differential across the outfalls (Plant McDonough intake and Georgia Highway 280) and corresponding instantaneous river flows computed by the flow model. Unfortunately, at low flow, it was determined that the recorded tempera tures at the Plant McDonough intake were affected, to some extent, by the hot water discharges. The heat loads applied to the temperature model, there fore, were computed using the difference between the observed temepratures at Georgia Highway 280 and the model computed temperatures at the Plant Mc Donough intake.
CALIBRATION AND VERIFICATION
Flow, temperature, and meteorologic data col lected during two 8-day periods beginning July 12, 1976, and August 1, 1976, respectfully, were used to calibrate and verify the flow and temperature models.
FLOW MODEL
Calibration of the flow model was accomplished in two steps using stage data for the period July 12-19, 1976, and discharge and flow-depth data col lected during the May 1977 reconnaissance. The first step utilized the discharge and flow-depth data col lected during the reconnaissance. The maximum measured depth at each cross section was added to the "known" thalweg altitude (U.S. Army Corps of Engineers, 1973) to form an "observed" water- surface profile. A smooth curve was then drawn through the plotted points matching the observed water-surface altitudes at bridges and gages where accurate altitude measurements were available. The measured depths were then subtracted from the smoothed profile to determine corrected bed alti tudes. Starting at the downstream end of the study reach, individual Manning's roughness coefficients were selected on a trial and error basis at each cross section such that the flow model, run to steady state, accurately reproduced the observed depths and the "smoothed" water-surface profile. The roughness co efficients obtained in this way insured that the model computed realistic depths and velocities at low flow and provided a basis for computing corresponding coefficients during transient flow.

18 FLOW REGULATION AND POWERPLANT EFFLUENTS—CHATTAHOOCHEE RIVER, GEORGIA
The second step of the calibration process was the development of a linear rate of change of roughness with stage at each cross section, which would allow the model to best predict the observed July 12-19 stages in the river. Such rates were determined by trial and error. The range of computed Manning's n values for each cross section is listed in Table 9 in the Summary of data.
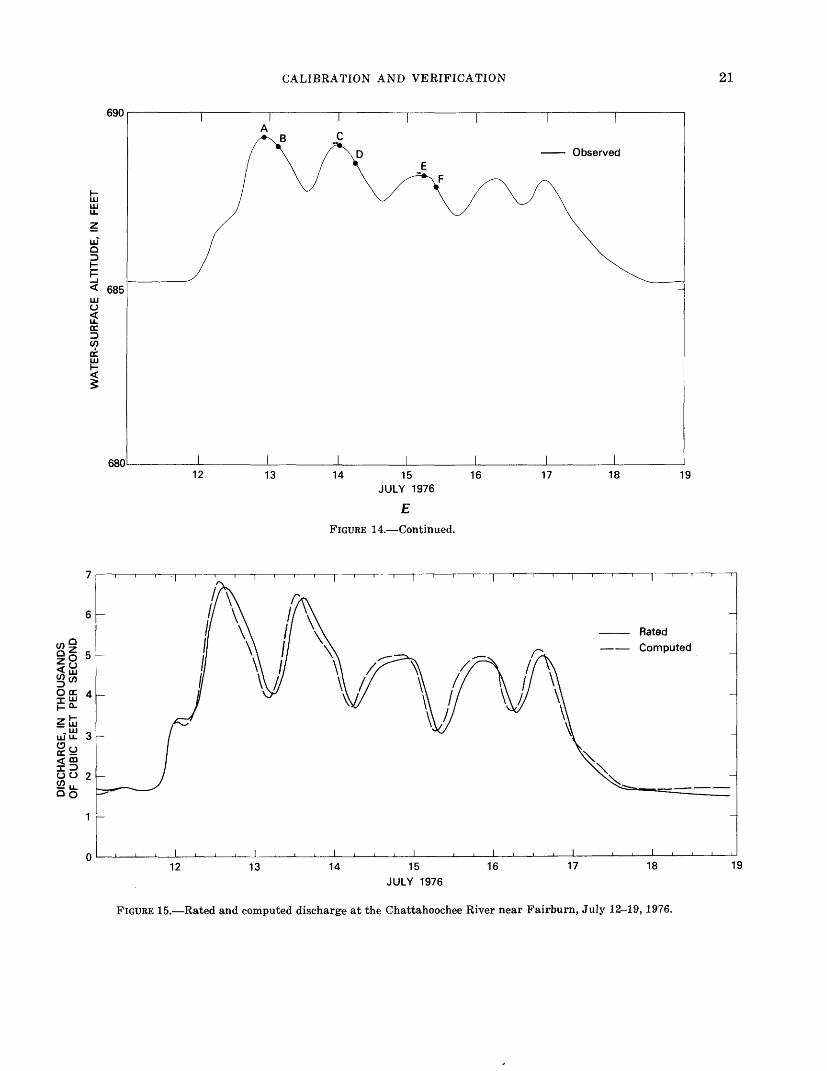
The results of the flow-model calibration are illus trated in figure 14. Computed and observed stages are plotted at the Atlanta gage, the Atlanta water- supply facility, the Plant McDonough outfall, the Fainburn gage, and the Whitesburg gage. Phase dif ferences between computed and observed stages are minimal and stage values are closely matched at both high and low flow. The model consistently overpre- dicts intermediate stage values at all stations, which suggests that the rate of change of roughness with stage is not linear as originally assumed. This error is largest at the Atlanta water-supply facility (0.5 ft) and progressively decreases downstream to the Fairburn gage (0.2 ft).
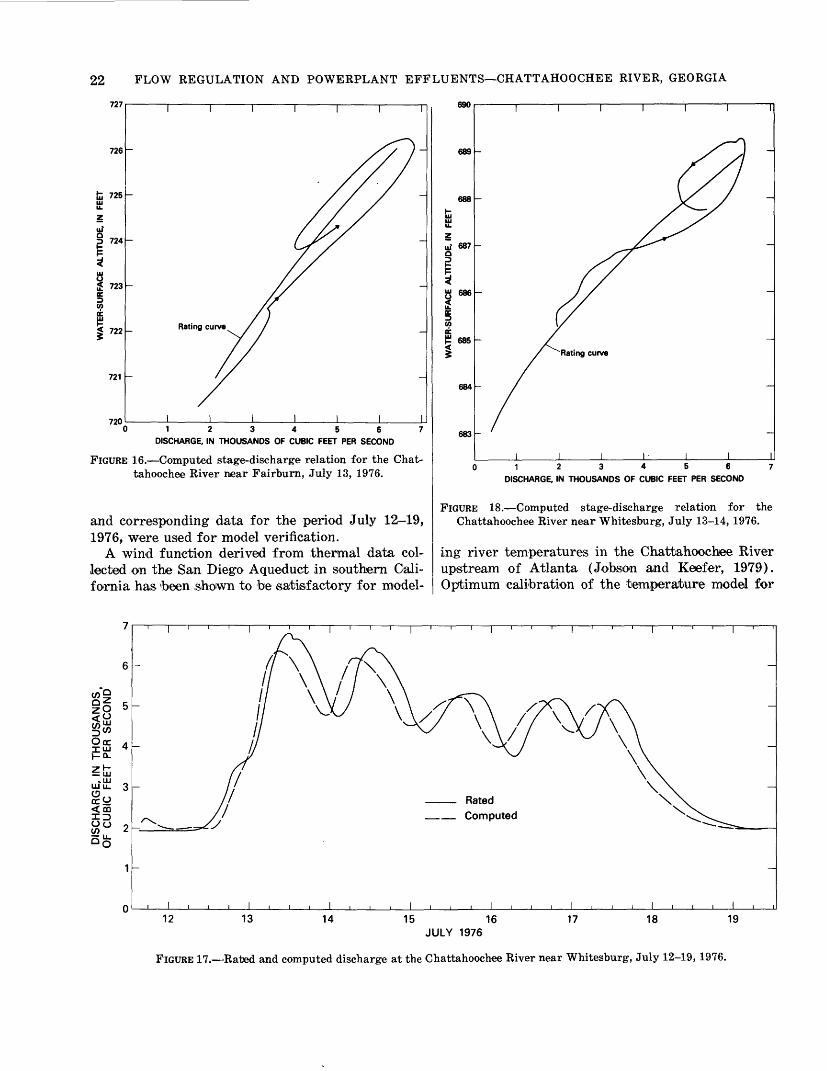
Both rated and computed discharges at the Fair- burn gage are shown in figure 15. In general, the agreement is good but the two discharges appear to be out of phase by about 2 h. In evaluating this ap parent phase shift, it is well to remember that a rated discharge is dependent on an assumed unique relation between stage and discharge. For unsteady flow, such relations do not generally exist. For ex ample, figure 16 shows the rating curve and the simulated stage-discharge relation at the Fairburn gage for the hydropulse of July 13, 1976. The model predicts greater discharges than the rating curve on the rising limb and smaller discharges on the falling limb, just as one would expect. The phase shift be tween rated and computed discharge at the river gage near Whitesburg is shown in figure 17. A shift of about 5 h is noted and at a given instant, can re sult in discharge differences of nearly 20 percent. Arbitrary manipulation of geometry and Manning's n data at several sections upstream of the Whites burg gage indicated that the size of the phase shift is insensitive to changes in both channel volume and roughness. The simulated stage-discharge relation for flow at the Whitesburg gage during July 13-14, 1976, is shown on figure 18.
Tributary inflows during the calibration period are listed in table 3 and were based on measured discharges obtained on July 12, 1976, adjusted to a weekly average using records at gaged streams.
The calibrated flow model was verified using meas ured stage data for the period August 1-8, 1976.
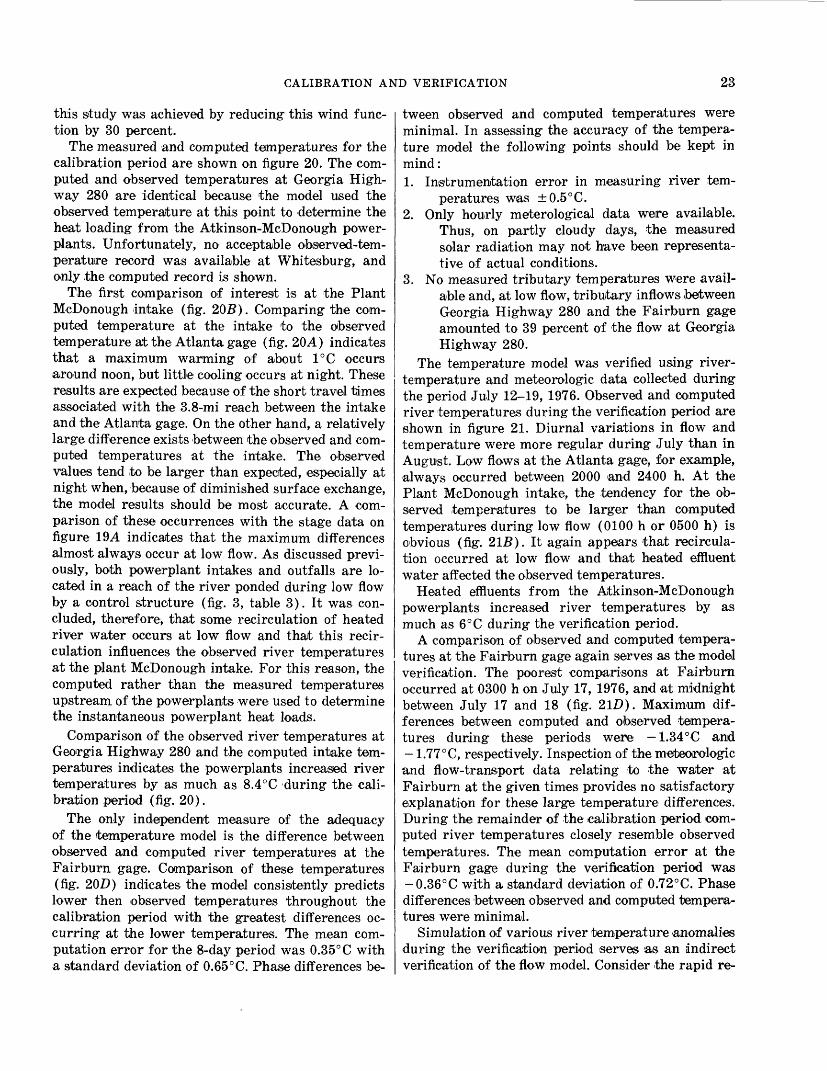
Simulated and observed stages are shown on figure 19. Flow variations were less extreme in August than in July, and no stage data were available at the Plant McDonough outfall. A maximum error of 0.7 ft between computed and observed stages oc curred at the Atlanta water-supply facility on August 7. Differences between observed and com puted stages at the Atlanta and Fairburn gages were less than 0.4 ft.
Plots of simulated and rated discharge for the verification period were similar to those presented for model calibration and are not shown in this text. A phase shift of about 2 h was observed at the Fairburn gage with a maximum difference between simulated and rated discharge of about 8 percent. The phase shift at Whitesburg was also about 2 h with a corresponding maximum difference between discharge of about 13 percent. The reduction in phase shift between the calibration and verification periods is not unexpected because the hysteretic na ture of the stage-discharge relation usually decreases in proportion to the dynamic nature of the flow.
Although phase shifts occurred between compari sons of instantaneous computed and rated discharge at both the Fairburn and Whitesburg gages, compu tation of the total volume of water passing by each station using both the model and the raiting curve produced nearly equal values for both the calibra tion and verification periods.
Roughness relations, bed elevations, and channel geometry data at each cross section were exactly the same for the calibration and verification of the flow model. Tributary inflows during the verification period (table 3) were based on average daily dis charges at the gaged streams and extrapolated dis charges at ungaged streams.
Overall, the results of the calibration and verifica tion of the flow model are considered to be good, and the flow model is considered an adequate predic tive tool.
TEMPERATURE MODEL
The only parameter in the temperature model which could reasonably be varied for calibration purposes is the empirical wind function. The wind function is used in conjunction with the quasi-em pirical Dalton's Law to compute heat flux due to evaporation (Jobson and Keefer, 1979). The effect of the wind function is highly variable but generally is largest for high river temperatures, and low dis charges. Consequently, river-temperature and rnete- orologic data collected for the period August 1-8, 1976, were used to' calibrate the temperature model,

CALIBRATION AND VERIFICATION 19
760
LUa
F <LUo2ccCOccLU
I
755
750
——— Observed——— Computed
12 13 14 15 JULY 1976
16 17 18 19
755
—— Observed— — Computed
LUa
P< 750LUo
74512 13 14 15 16 17 18 19
JULY 1976
BFIGURE 14.—Observed and computed stages of the Chattahoochee River during the period July 12-19, 1976.
A, At Atlanta. B, At Atlanta water-supply facility. C, At the Plant McDonough outfall. D, Near Fair- burn. E, Near Whitesburg. Points A-F on each graph represent water particles traced through the study reach (see p. 24).

to o
O
§ s± 3 c s.
WAT
ER-S
URFA
CE A
LTIT
UDE,
IN
FEET
Ill
o>
(O -J
o>
00
WAT
ER-S
URFA
CE A
LTIT
UDE,
IN
FEET
S 01
I T
--~
I I
I I
1 T
o g 3 H
I I
o
W w o o O w H
H O
M
O O i—i
>
DIS
CH
AR
GE
, IN
T
HO
US
AN
DS
O
F C
UB
IC
FEET
PER
S
EC
ON
D
£*
c r~ _i ^
o>
O
E>
r HH w » > H HH O O <
H »
i— i
^
i— i
O
> H
i— i
O
22 FLOW REGULATION AND POWERPLANT EFFLUENTS—CHATTAHOOCHEE RIVER, GEORGIA
726
725
724
723
722
721
720
Rating curve
1 23456 DISCHARGE, IN THOUSANDS OF CUBIC FEET PER SECOND
FIGURE 16.—Computed stage-discharge relation for the Chat tahoochee River near Fairburn, July 13, 1976.
and corresponding data for the period July 12-19, 1976, were used for model verification.
A wind function derived from thermal data col lected on the San Diego Aqueduct in southern Cali fornia has 'been .shown to be satisfactory for model-
ui 687
686
685
684
683
~ Rating curve
01 234567 DISCHARGE, IN THOUSANDS OF CUBIC FEET PER SECOND
FIGURE 18.—Computed stage-discharge relation for the Chattahoochee River near Whitesburg, July 13-14, 1976.
ing river temperatures in the Chattahoochee River upstream of Atlanta (Jobson and Keefer, 1979). Optimum calibration of the temperature model for
<0 »%
l-o-zfc
-111ui u. 3
<m
2
12 13 14 15 16 JULY 1976
17 18 19
FIGURE 17.—Rated and computed discharge at the Chattahoochee River near Whitesburg, July 12-19, 1976.
CALIBRATION AND VERIFICATION 23
this study was achieved by reducing this wind func tion by 30 percent.
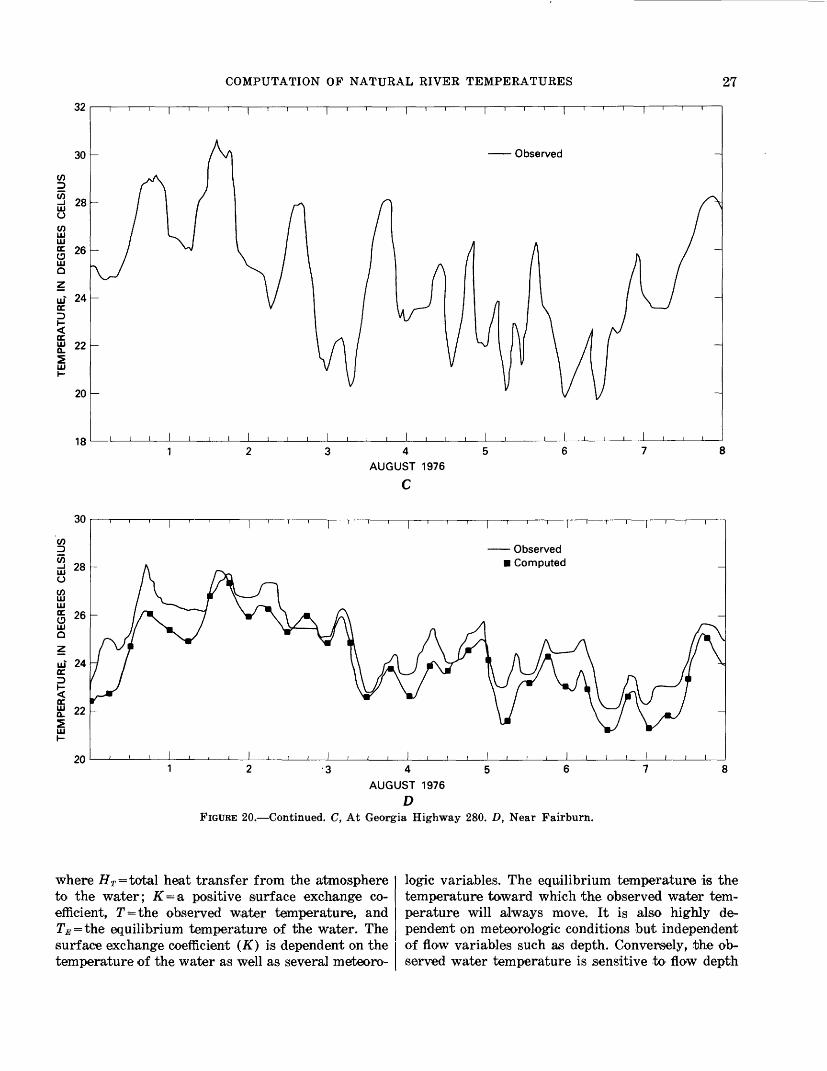
The measured and computed temperatures for the calibration period are shown on figure 20. The com puted and observed temperatures at Georgia High way 280 are identical because the model used the observed temperature at this point to determine the heat loading from the Atkinson-McDonough power- plants. Unfortunately, no acceptable observed-tem perature record was available at Whitesburg, and only the computed record is shown.
The first comparison of interest is at the Plant McDonough Intake (fig. 205). Comparing the com puted temperature at the intake to the observed temperature at the Atlanta gage (fig. 20A) indicates that a maximum warming of about 1°C occurs around noon, but little cooling occurs at night. These results are expected because of the short travel times associated with the 3.8-mi reach between the intake and the Atlanta gage. On the other hand, a relatively large difference exists between the observed and com puted temperatures at the intake. The observed values tend to be larger than expected, especially at night when, 'because of diminished surface exchange, the model results should be most accurate. A com parison of these occurrences with the stage data on figure 19A indicates that the maximum differences almost always occur at low flow. As discussed previ ously, both powerplant intakes and outfalls are lo cated in a reach of the river ponded during low flow by a control structure (fig. 3, table 3). It was con cluded, therefore, that some recirculation of heated river water occurs at low flow and that this recir culation influences the observed river temperatures at the plant McDonough intake. For this reason, the computed rather than the measured temperatures upstream of the powerplants were used to determine the instantaneous powerplant heat loads.
Comparison of the observed river temperatures at Georgia Highway 280 and the computed intake tem peratures indicates the powerplants increased river temperatures by as much as 8.4°C during the cali bration period (fig. 20).
The only independent measure of the adequacy of the temperature model is the difference between observed and computed river temperatures at the Fairburn gage. Comparison of these temperatures (fig. 20Z)) indicates the model consistently predicts lower then observed temperatures throughout the calibration period with the greatest differences oc curring at the lower temperatures. The mean com putation error for the 8-day period was 0.35°C with a standard deviation of 0.65°C. Phase differences be
tween observed and computed temperatures were minimal. In assessing the accuracy of the tempera ture model the following points should be kept in mind:1. Instrumentation error in measuring river tem
peratures was ±0.5°C.2. Only hourly meterological data were available.
Thus, on partly cloudy days, the measured solar radiation may not have been representa tive of actual conditions.
3. No measured tributary temperatures were avail able and, at low flow, tributary inflows between Georgia Highway 280 and the Fairburn gage amounted to 39 percent of the flow at Georgia Highway 280.
The temperature model was verified using river- temperature and meteorologic data collected during the period July 12-19, 1976. Observed and computed river temperatures during the verification period are shown in figure 21. Diurnal variations in flow and temperature were more regular during July than in August. Low flows at the Atlanta gage, for example, always occurred between 2000 and 2400 h. At the Plant McDonough intake, the tendency for the ob served temperatures to be larger than computed temperatures during low flow (0100 h or 0500 h) is obvious (fig. 21B). It again appears that recircula tion occurred at low flow and that heated effluent water affected the observed temperatures.
Heated effluents from the Atkinson-McDonough powerplants increased river temperatures by as much as 6°C during the verification period.
A comparison of observed and computed tempera tures at the Fairburn gage again serves as the model verification. The poorest comparisons at Fairburn occurred at 0300 h on July 17, 1976, and at midnight between July 17 and 18 (fig. 2LD). Maximum dif ferences between computed and observed tempera tures during these periods were — 1.34°C and- 1.77°C, respectively. Inspection of the meteoirologic and flow-transport data relating to the water at Fairburn at the given times provides no satisfactory explanation for these large temperature differences. During the remainder of the calibration period com puted river temperatures closely resemble observed temperatures. The mean computation error at the Fairburn gage during the verification period was-0.36°C with a standard deviation of 0.72°C. Phase differences between observed and computed tempera tures were minimal.
Simulation of various river temperature anomalies during the verification period serves as an indirect verification of the flow model. Consider the rapid re-

24 FLOW REGULATION AND POWERPLANT EFFLUENTS—CHATTAHOOCHEE RIVER, GEORGIA
756
Illffi 755z111§ 754K
< 753ino25 752
cc£ 751
750
——— Observed——— Computed
AUGUST 1976 A
751
inffi 750Z
iiTQ 749
748
cc in
I
747
746
745
—— Observed•— Computed
AUGUST 1976B
FIGURE 19.—Observed and computed stages of the Chattahoochee River during the period August 1-8, 1976. A, At Atlanta.B, At the Atlanta water-supply facility.
ductions in temperature that occurred at the Atlanta gage on July 13-15, 1976, and that are noted on figure 21A by points A-B, C-D, and E-F. These temperature anomalies were traced through the study reach by analytically "tagging" individual fluid particles (points A, B, C, D, E, and F) and by noting the time of arrival of each particle at the various downstream stations. For example, the water that passed the Atlanta gage at 0100 h on July 13 is identified as "A" on figure 21A, and its arrival time at each downstream station (figs. 21A-E) is
similarly identified. The spatial distribution of each particle relative to the given anomaly at the Atlanta gage is shown to be maintained throughout the study reach. Thus travel times are being closely simulated, and velocities computed by the flow model are close to the actual values. For reference purposes, the temporal locations of these water particles are also noted on figure 14. Note that water particles repre sented by points A, B, C, and D traversed the reach under relatively high flow conditions and that water particles represented by points E and F traversed
IMPACT OF POWERPLANT EFFLUENTS ON RIVER TEMPERATURES 25
720
AUGUST 1976 C
688UJO
F 687 *UJ UJ
^ £ 686
tn 685UJ
684
Observed
AUGUST 1976 D
FIGURE 19.—Continued. C, Near Fairburn. D, Near Whitesburg.
the reach when discharge was intermediate and nearly steady.
Given the temperature comparisons discussed previously and the limitations of the flow, meteoro- logic and river temperature data, the temperature model is considered calibrated and verified and suit able for use as a predictive tool.
IMPACT OF POWERPLANT EFFLUENTS ON RIVER TEMPERATURES-AUGUST 1-8, 1976
Heatioads from the Atkinson-McDonough power- plants were determined using computed flows and temperatures from the models and the observed river temperatures at Georgia Highway 280. Figure 22 shows computed, instantaneous powerplant heat loads for the period August 1-8, 1976. Larger heat loads correspond to periods of greater electrical power demand, which for the period of interest in
cludes most of the afternoon and evening hours when peak air-conditioning demands occurred.
River temperatures without heat loads from the powerplants were computed for the period August 1- 8,1976, using the flow-temperature models. Figure 23 shows computed, instantaneous river temperatures, with and without powerplant heat loads, at Georgia Highway 280 and at the Fairburn and Whitesburg gages. As expected, the impact of the heat loads was most severe at Georgia Highway 280 and progres sively decreased downstream with increasing dis tance from the heat source. At Georgia Highway 280, the maximum temperature difference between heated and unheated water was 8°C. 'Corresponding values at the Fairburn and Whitesburg gages were about 6°C and 2°C, respectively. A reach profile of computed river temperatures, with and without powerplant heat loads, is shown in figure 24 for August 8, 1976, at 0000 h. Temperature differences

26 FLOW REGULATION AND POWERPLANT EFFLUENTS—CHATTAHOOCHEE RIVER, GEORGIA
24
22
CO
CO
oCO LU LUg 20LU Q
LU 18
<rLU . c Q. 16
Observed
i i i I i i i I i i i I i i i i i i i ——— l ——— I ——— I ——— l ——— I ——— I
45 AUGUST 1976
A
24
22
COD COLU OCO LU LU
Observed Computed
18
14
AUGUST 1976 B
FIGURE 20.—Observed and computed temperatures of the Chattahoochee River during the period August 1-8, 1976. A,At Atlanta. B, At the Plant McDonough intake.
between, the curves represent the distribution of residual heat in the river at the given time due to powerplant effluents.
COMPUTATION OF NATURAL RIVER TEMPERATURES
Before discussing the computation of natural 'tem perature conditions in the Chattahooohee River, some general relations and concepts important to the interpretation of forthcoming information will be re
viewed. Once a particle of water obtains a given temperature by whatever process, it will remain at that temperature unless energy is transferred to or away from it. The major process by which thermal energy in river water can be gained or lost is through heat exchange with the atmosphere. Several physical processes are involved in this exchange, but the combined effect of all these processes can be ap proximated by the expression:
T =-K (T-TE ) (4)
COMPUTATION OF NATURAL RIVER TEMPERATURES 2732
30
28
n——i——i——i——r
LJJ LJJ§ 26LJJO
uj 24 cc(2cc uj 22
20
18
Observed
AUGUST 1976
C
30
28
uj 24 cc
< § 22
20
Observed Computed
23456 AUGUST 1976
D FIGURE 20.—Continued. C, At Georgia Highway 280. D, Near Fairburn.
where HT = total heat transfer from the atmosphere to the water; K = & positive surface exchange co efficient, T = the observed water temperature, and !T£ =the equilibrium temperature of the water. The surface exchange coefficient (If) is dependent on the temperature of the water as well as several meteoro-
logic variables. The equilibrium temperature is the temperature toward which the observed water tem perature will always move. It is also highly de pendent on meteorologic conditions but independent of flow variables such as depth. Conversely, the ob served water temperature is sensitive to flow depth

28 FLOW REGULATION AND POWERPLANT EFFLUENTS—CHATTAHOOCHEE RIVER, GEORGIA
28
26
24
22
20
O £2UJDC CJLU
LU CC.
Computed
345AUGUST 1976
EFIGURE 20.—Continued. E. Near Whitesburg.
as well as meteorologic conditions. Consequently, equilibrium and observed river temperatures at any instant can be quite different.
Where the stream system is not subject to artifi cial thermal alteration, observed water temperatures equal natural river temperatures. Under these con ditions, mean daily observed and mean daily equilib rium temperatures are nearly equal.
Where a river system is influenced by artificial heat sources or sinks, observed and natural river temperatures differ by some amount that will be called the excess temperature. Under such condi tions, total heat exchange between the water and the atmosphere is a function of the natural heat ex change and the excess temperature. The magnitude of excess temperature at a particular station is a function of the magnitude of the artificial altera tion and the distance to its source. Just as the ob served river temperature always seeks the equilib rium temperature, artifically altered water tempera tures tend to return to natural temperatures. This process is conveniently expressed by the relation :
where jffe = heat exchange between the water and the atmosphere due to excess temperature and 7^ = the natural river temperature.
Natural river temperatures tend to decrease with increasing altitude and latitude so it is probable that the long term natural river temperature at Whites- burg is slightly higher than at Atlanta. The model depends on meteorologic data collected at Atlanta, however, and all meteorologic conditions throughout the study reach are assumed to be uniform. It is also assumed that any variation in natural temperature with distance from Atlanta is negligible.
Direct measurements of natural river tempera tures during the calibration period of August 1-8, 1976, were impossible to obtain. On the other hand, information about natural temperatures can be obtained from available temperature data. Figure 25 shows a plot of the observed river temperatures at Georgia Highway 280. Superimposed on these temperatures are the observed temperatures of the same water particles when they arrived at the Fair- burn gage. Estimates of time of travel between the two stations were obtained from the flow model. The difference between the two curves represents the observed temperature change experienced by a water particle as it traveled the 17.0 mi from Georgia High way 280 to the Fairburn gage. In the 8 days of record, 18 time periods occurred during which the water experienced no net temperature change as it traversed this reach of the river. These points are circled on figure 25. Because no net surface exchange occurred during these periods, the river tempera ture and the equilibrium temperature must have been equal. In other words, each time the curves intersect on figure 25, a direct measurement of the equilibrium temperature is available, averaged over the time of passage through the reach. The mean time of travel for the water particles represented by these intersections was 14.91 h with a standard deviation of 1.83 h. The mean of the equilibrium temperatures was 24.8°C with a standard deviation of 1.37°C.
Except for times of travel, these equilibrium tem peratures were obtained independently of the flow and temperature models. The 18 points of intersec tion (fig. 25) are also more or less randomly distrib uted in time. Thus, the mean of these 18 tempera-

COMPUTATION OF NATURAL RIVER TEMPERATURES 29
tures (24.8°C) is considered a reasonably good esti mate of the mean natural temperature of the Chatta- hoochee River between Atlanta and Whitesburg dur ing the period August 1-8, 1976.
The average impact of flow regulation and power- plant effluents on river temperatures during the period August 1-8, 1976, is shown on figure 26. The sihort-diashed line connects the mean observed 'tem peratures during the 8-day period. The 8-day mean computed river temperatures, which would have occurred without powerplant heat loads, are repre sented by the longer dashes and were computed from data presented in figure 23. The horizontal solid line at the top of the figure represents the mean natural temperature of 24.8°C, estimated from the 18 measurements of equilibrium temperature. Dur ing the given 8-day period, mean observed river temperatures downstream of the powerplants are shown to nearly equal natural temperatures. Thus, on the average, the heat added by the Atkinson-Mc- Donough powerplants almost balanced the cooling effect of flow regulation. The average warming effect of the plants is estimated to have been 0.5°C at the Plant McDonough intake, 4.2 °C at Georgia Highway 280, 2.9°C at the Fairburn gage, and 1.6°C at the Whitesburg gage. Likewise, the average cooling that resulted from flow regulation at Buford Dam is esti mated to have been 4.8°C at the Atlanta gage, 4.4°C at the McDonough intake, 4.3°C at Georgia High way 280, 2.9°C at the Fairburn gage, and 1.9°C at the Whitesburg gage. Note, that excess temperatures resulting from both a heat sink (Lake Sidney Lanier) and a heat source (powerplants) are shown to approach natural temperatures with increasing distance from the point of thermal alteration.
The average combined thermal impact of flow regulation and powerplant effluents on river tem peratures has been shown to be small when com pared to natural temperatures. Equally important, however, are the instantaneous effects. One way to estimate the natural instantaneous temperature through the study reach is by use of the flow and temperature models. Computation of natural tem peratures is complicated, however, by the fact that the upstream boundary condition is unknown and must also be simulated. Simulation of this boundary is accomplished by solving the thermal energy equa tion (equation 1) for a channel of infinite length upstream of the station of interest. Such a solution effectively removes the spatial derivatives from con sideration and computes river temperatures only as a function of depth and surface exchange. Such temperatures are by definition natural temperatures.
These assumptions were used in conjunction with the flow and temperature models to solve the thermal energy equation for a long channel where geometry, flow, and meteorologic conditions at each cross sec tion were identical and equal to observed conditions at the Atlanta gage during the period August 1-8, 1976. Computed instantaneous river temperatures at the downstream end of this long reach were con sidered equal to natural temperatures at the Atlanta gage during the given period.
The set of computed natural river temperatures at the Atlanta gage was used to drive the temperature model and compute instantaneous natural river tem peratures through the study reach for the period August 1-8, 1976. Graphs of natural and observed temperatures at the Atlanta gage, at the Plant Mc Donough intake, at Georgia Highway 280, and at the Fairburn gage are shown in figure 27. Only com puted temperatures are shown for the Whitesburg gage.
The computed mean natural temperature for the entire reach during the 8-day period was 24.9 °C and is considered to be in excellent agreement with the previously determined estimate of 24.8°C. This close agreement between two independently determined mean natural temperatures indicates that the total surface exchange was accurately modeled and that the computed instantaneous temperature values are reasonably accurate.
Based on these comparisons, flow regulation up stream of Atlanta lowered the temperature of the Chattahoochee River by an average 4.8°C during the first 8 days of August 1976. Heated effluents from the Atkinson-McDonough powerplants raised the mean river temperature about 4.2°C during the same period. Thus, the net average combined effect of flow regulation and heat loads was small. On the other hand, dirurnal variations and associated nates of change for both natural and artifically altered water temperatures were large and quite different. In general, the larger variations and rates were as sociated with the altered temperatures and decreased downstream.
These results and conclusions based on model studies compare favorably with the conclusions drawn from previous comparisons of historical river- and air-temperature data. In both cases, sig nificant cooling effects due to flow regulation at Bu ford Dam were noted at the Atlanta gage and the Plant McDonough intake during August 1976 (figs. 9, 10, 27). Also noted, in both cases, was the close approximation of mean natural to mean observed temperatures at Georgia Highway 280 (figs. 11, 27).

30 FLOW REGULATION AND POWERPLANT EFFLUENTS—CHATTAHOOCHEE RIVER, GEORGIA
24 i——i——i——i——|——i——i——i——i——i——i——i——i——i——i——i——i——i——i——r
22
20tv/
"i——i——i——i——i——i——i——i——i——r
UJo
LU QC O UJ
oc
ocLU Q.
16
14
12 I i I i i I I I I I
12 13 14 15 JULY 1976
16 17 18 19
26
24
22
i —— i —— i —— i —— i i —— i —— r-
55LUoLU LU
LUO
LU 18 QCD
2 16
LU
14
1?
i —— i —— i —— i —— i
i i i I i i i I i i i I i i i I i i i I i I i12 13 14 15
JULY 1976
B
16 17 18 19
FIGURE 21.—Observed and computed temperatures of the Chattahoochee River during the period July 12-19, 1976. A, At Atlanta, B, At the Plant McDonough intake. C, At Georgia Highway 280. D, Near Fairburn. E, Near Whitesburg. Points A-F on each graph represent water particles traced through the study reach (see p. 24).

COMPUTATION OF NATURAL RIVER TEMPERATURES 31
30 I——I——i——r
13 14 15 16 JULY 1976
D FIGURE 21.—Continued.
17 18 19

HEA
T FL
OW
, IN
M
ILLI
ON
S O
F C
ALO
RIE
S PE
R SE
CO
ND
-»
-»'
NJ
NJ
O
C71
O
C71
0000

« sTE
MPE
RAT
UR
E, I
N D
EGR
EES
CEL
SIU
STE
MPE
RAT
UR
E, I
N D
EGR
EES
CEL
SIU
STE
MPE
RAT
UR
E, I
N D
EGR
EES
CEL
SIU
S
OKJ §.g* !S3
&
to »
oo C
L co
'
C
O C
s£ -»
</)
> o <Q ^
O o o iz: o W w cc CO
CO

34 FLOW REGULATION AND POWERPLANT EFFLUENTS—CHATTAHOOCHEE RIVER, GEORGIA
oC/>111
O 111Q
24-
22
20
18
16
With powerplant loads Without powerplant loads
10 20 30 DISTANCE DOWNSTREAM, IN MILES
40 50
FIGURE 24.—Computed longitudinal temperature profiles in the study reach with and without heat loads from Plants Atkin-son-McDonough, 0000 e.s.t., August 8, 1976.
32
30
28111 O
111111g 26
ul 24cc.
tr. ffi 22
20
—— Observed water temperature at Georgia Highway 280
—— Temperature upon arrival at Fairburn Gage
18 I——i——i
AUGUST 1976
FIGURE 25.—Observed temperature of the Chattahoochee River at Georgia Highway 280 and the observed temperature ofthe same water upon arrival at the Fairburn gage.

COMPUTED RIVER TEMPERATURES AND CRITICAL DROUGHT FLOW CONDITIONS 35
25
*
Natural temperature
Ill o</> 111111 00 DC 23 CD ill
LU 22 oc
21
Average temperature for August 1-8, 1976
Temperature without powerplant loads, August 1-8, 1976
Observed temperature Computed temperature
CDCO
3 §CO CM*J Nc >.
o ~
Z-lO D)5 o c O
JO Q.
<o05co
CD
CD 05co
CD
D JD
FIGURE 26.—Eight-day mean natural and thermally altered temperatures of the Chattahoochee River from At lanta to Whitesburg, August 1-8, 1976.
Thus, both the analysis of historical data and the model studies, albeit grossly different in accuracy and sophistication, provided similar concluisionis re garding the impact of flow regulation and power- plant loadings on stream temperatures in the study reach.
COMPUTED RIVER TEMPERATURES USINGYEAR 2000 AND CRITICAL DROUGHT FLOW
CONDITIONS
The flow-temperature models were used to predict future river temperatures using year 2000 and critical drought flow conditions. Representative future water-supply demands and wastewater flows were obtained from the Atlanta Regional Commis sion (1976) and are listed in table 6. Additional wastewater treatment facilities to be added to the network by the year 2000 include Sweetwater Creek
TABLE 6.—Estimated water-supply and wastewater flows for the year 2000
Station
Buford Dam to Atlanta gage..Atlanta water-supply facility ..Cobb County wastewater-
treatment facility.R. M.. Clayton wastewater-
treatment facility.South Cobb County waste-
water-treatment facility.Utoy Creek wastewater-
treatment facility.Sweetwater Creek waste-
water-treatment facility.Camp Creek wastewater-
treatment facility.Annewakee Creek waste-
water-treatment facility.Regional interceptor _ _ .Bear Creek wastewater-
treatment facility.
£
300.62 _300.56 __
300.56 __
294.28 _
291.48 ...
288.57 ...
283.78.. .
281.46 __
281.45 ...274.48 ...
g£
3 ...4 __
7 __
13 __
14 __
20_._
16 _
21 _
22 _23 _
ois- 3s- -51-840 __ 560 __ 36.0164 __ 109 __ ._._____ ____ 31
____ ____ 162
____ ____ 49
____ ____ 44
....._ .. __ 2.6
____ ____ 27
____ ...... 6.0
____ ____ 4S.. __ .. __ 7.8
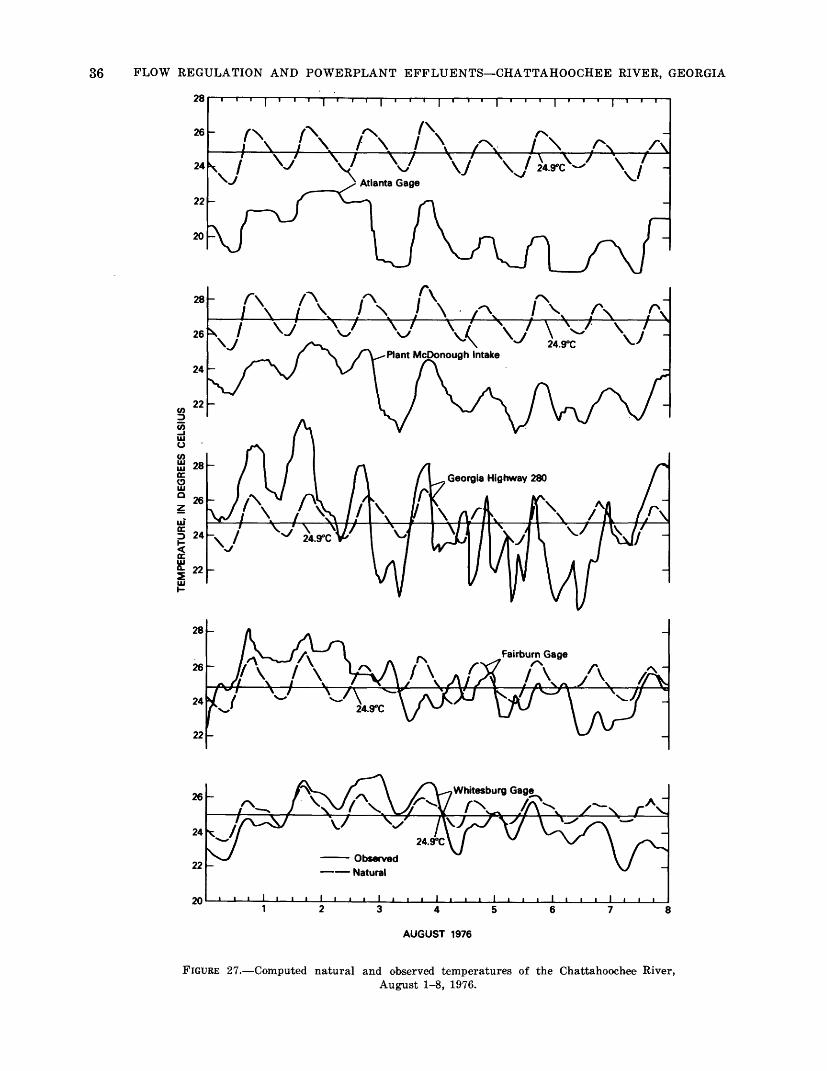
CO
o § •o
TEM
PERA
TURE
, IN
DEG
REES
CEL
SIUS
O 99 o 8 sr
o 13
O ^
H H H O a a o o o a H O
H
O O i—i
>

SUMMARY AND CONCLUSIONS 37
WTF, Annewakee Creek WTF, Bear Creek WTF, and a regional interceptor (fig. 1, table 6). Tribu tary flows used to predict future conditions are those listed in table 3 for the 1954 drought and for the period August 1-8, 1976. Observed tributary dis charges during the 1954 drought were obtained from Thompson and Carter (1955). The various flow con ditions used to simulate year 2000 temperatures in the Chattahooichee River are listed below. The letter designation for each condition is used later in this text to define various flow combinations The average projected wastewater flow for the year 2000 (table 6) was used in each simulation. The letter designa tions are as follows:
Flow conditionLetter
designation1954 drought tributary flows AAugust 1-8, 1976, tributary flows BYear 2000 peak water-supply demand CYear 2000 average water-supply demand D
Boundary conditions used to compute future flow conditions are listed in table 7. Estimated discharges at the Atlanta gage were based on a minimum regu lated discharge from Buford Dam of 1,717 ft3 /s pro posed for the year 2000 (Atlanta Regional Commis sion, 1976). Tributary inflows between the dam and the Atlantic gage of 0 and 25 ft3/a were used and represent 1954 drought and August 1976 flow con ditions, respectively. Discharge at the Whitesburg gage for the various flow combinations (table 7) was based on the given Atlanta gage discharge and a mass balance of tributary and flow diversion data listed in tables 3 and 6. All simulations of year 2000 flows and river temperatures are based on steady- state flow conditions. Such conditions are repre sented, for the most part, by the discharge data in tables 3, 6, and 7 and by the water-surface profile in figure 3. All future river temperatures were pre dicted using temperature and meteorologic data ob served during the period August 1-8, 1976.
Year 2000 river temperatures computed with the various flow combinations listed above are shown in figures 28 to 31. Temperatures at Georgia Highway 280 and at the Fairburn and Whitesburg gages are shown with and without heat loads from Plants Atkinson-McDonough (fig. 22). Heat loadings from
TABLE 7.—Estimated discharge at the Atlanta and Whites burg gages using selected tributary and year 2000 water- supply demands and wastewater flows
Discharge (ft3/s)
Flow combination ___ C-B C-A D-B D-A
Locations:Atlanta gage __ 940 910 1,220 1,190 Whitesburg gage _ 1,590 1,150 1,920 1,490
the powerplants impact river temperatures most sig nificantly when river flows are lowest. Maximum temperature at Georgia Highway 280 is nearly 34°C using powerplant loads, peak water-supply demands, and 1954 drought flow conditions. Temperatures at the same station using the same flow conditions with out powerplant loads are about 10 °C cooler. River temperatures computed using August 1976 tributary inflows, and average water-supply demands are not significantly different from those observed during the period August 1-8, 1976.
SUMMARY AND CONCLUSIONS
Transient flow-temperature models and independ ent comparisons of historical river- and air-tempera ture data were used to evaluate some of the effects of flow regulation and powerplant effluents on Chat- tahoochee River temperatures between Atlanta and Whitesburg, Ga. The flow-temperature models were used to estimate instantaneous and mean natural temperatures in the river during an 8-day period in August 1976. These, in turn, were compared to ob served, thermally altered river temperatures. Such comparisons indicated that the combined thermal effects of flow regulation and powerplant effluents resulted in mean daily river temperatures down stream of the powerplants about equal to or less than computed natural temperatures. An independ ent analysis of historical river and air-temperature data provided the same basic 'Conclusion.
The models were also used to simulate river tem peratures using estimated year 2000 flow conditions and temperature and meteorologic data collected during 1976. Except for periods of peak water-sup ply demand, simulated year 2000 river temperatures were little changed from observed 1976 tempera tures.
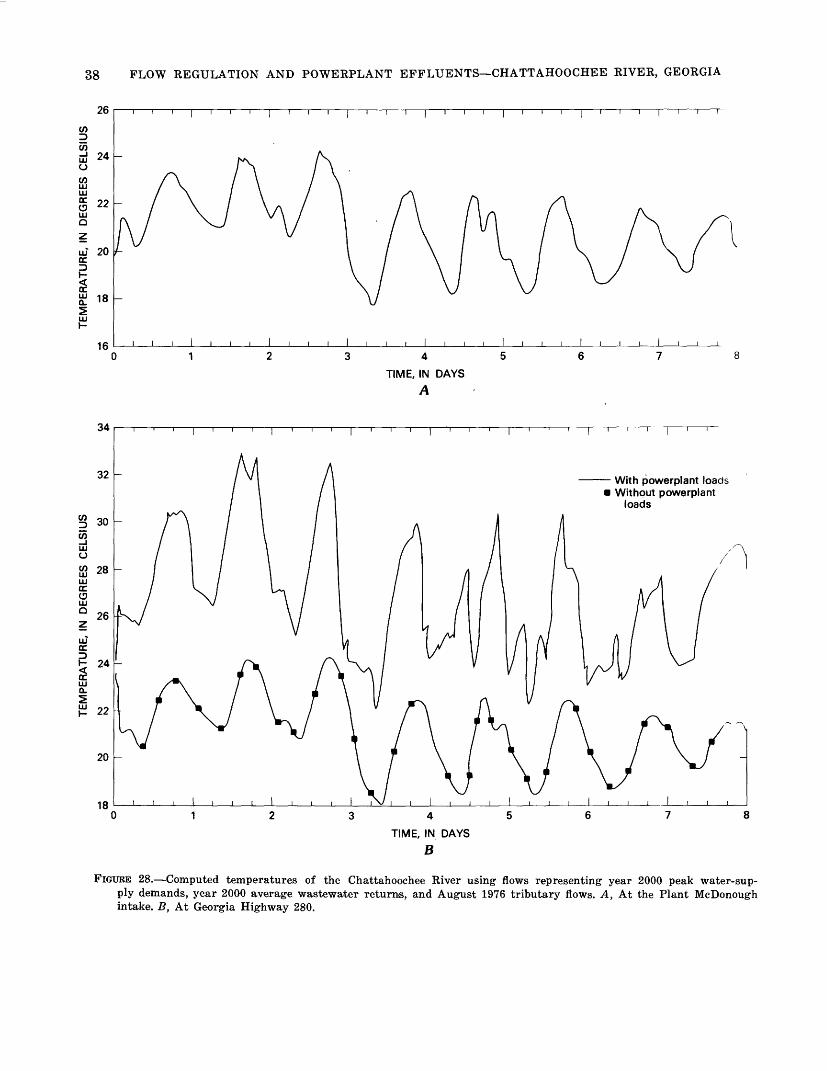
CO
00 o 3 » H O d tr1 E> H
i— i
O r o ffi a o o o a O
M
O
»

SUMMARY AND CONCLUSIONS 39
28
26
With powerplant loads Without powerplant loads
tu <r
22
20
18
TIME, IN DAYSc
w 28
tu O
tuQCD
tuQ.
26
24
22
i i ' 'i ' ''r—— With powerplant loads
• Without powerplant loads
tu 20
TIME, IN DAYS D
FIGURE 28.—Continued. C, Near Fairburn. D, Near Whitesburg.

TEM
PER
ATU
RE,
IN
DEG
REES
CEL
SIUS
^ o
-»
-»
NJ
NJ
NJ
NJ
<7>
00
O
N3
-P»
<7>
H 5
m Z D
> C/)
"d f O O as > as o >tj o cj
H as H CQ i w W
O
O
O
W bd bd bd » o bd o » o

TEM
PER
ATU
RE,
IN
DEG
REE
S C
ELSI
US
TEM
PER
ATU
RE,
IN
D
EGR
EES
CEL
SIU
S
0 s> CL Q 2 2 (T> Sa Hi
| 5T CO cr
H 2
m Z
O '5 O)
O z
*>
o >
C/3
CJ ft) 2,
O O
O C/3
I— I
O
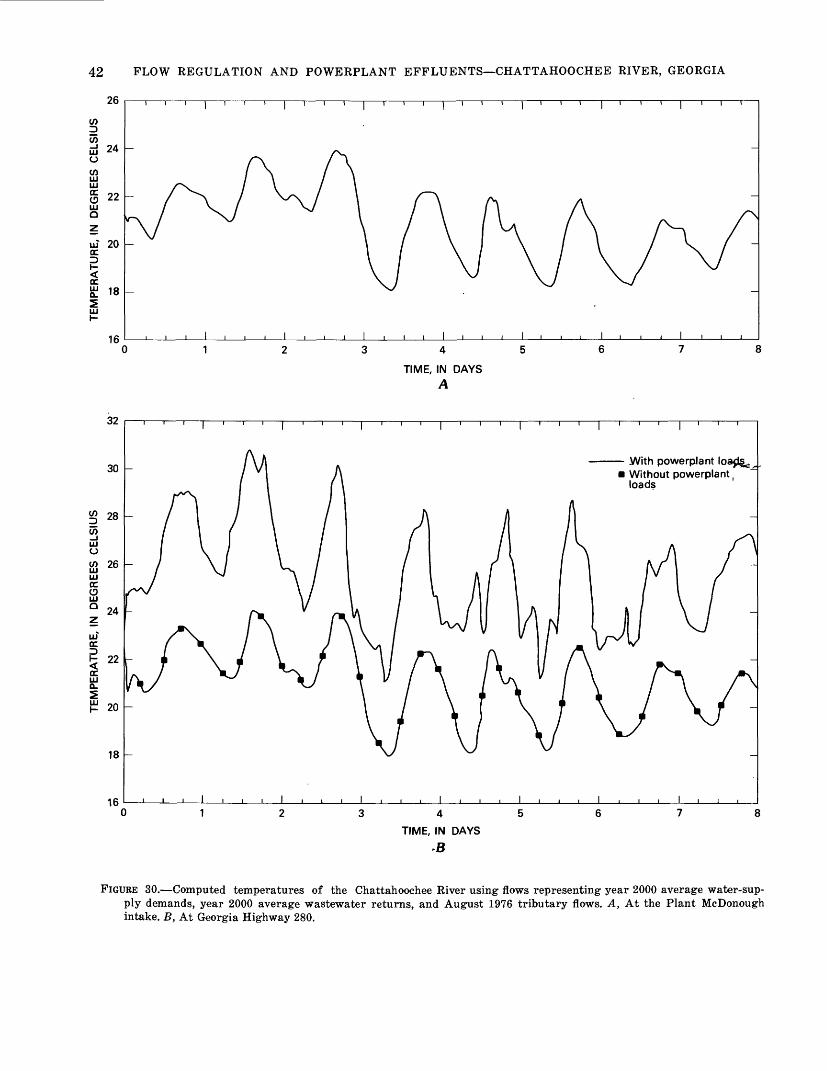
42 FLOW REGULATION AND POWERPLANT EFFLUENTS—CHATTAHOOCHEE RIVER, GEORGIA
26
24
~\——\——i——i——r i——i——i——\——i——i——i——i——i——i——i——i——i——i——I——i——i——i——I——i——I
o
LLJ
g 22LLJ O
uT 20 oc
18
16 I I I I I I I I I I I I I J___L
TIME, IN DAYS A
With powerplant Without powerplant (
TIME, IN DAYS *B
FIGURE 30.—Computed temperatures of the Chattahoochee River using flows representing year 2000 average water-sup ply demands, year 2000 average wastewater returns, and August 1976 tributary flows. A, At the Plant McDonough intake. B, At Georgia Highway 280.

SUMMARY AND CONCLUSIONS 43
With powerplant loads Without powerplant loads
TIME, IN DAYSc
28
UJ O
UJcc
UJcc.
26
24
22
20
With powerplant loads Without powerplant loads
TIME, IN DAYS D
FIGURE 30.—Continued. C, Near Fairburn. D, Near Whitesburg.

44 FLOW REGULATION AND POWERPLANT EFFLUENTS—CHATTAHOOCHEE RIVER, GEORGIA
26
24
22
ul 20 oc
16
TIME, IN DAYS A
With powerplant loads Without powerplant loads
TIME, IN DAYS B
FIGURE 31.—Computed temperatures of the Chattahoochee River using flows representing year 2000 average water- supply demands, year 2000 average wastewater returns, and 1954 drought tributary flows. A, At the Plant Mc- Donough intake. B, At Georgia Highway 280.

SELECTED REFERENCES 45
28 ———
26
oyl 24
~i———i———r ~i———i———r
O
HI HIoc aHIo
HI" 22 oc
<ocHI onQ. ^U
18
~i———i———r
With powerplant loads Without powerplant loads
5TIME, IN DAYS
c
28
26
24
22
20
HIO
HI OCoHI
QCD
' ' I ' ' ' IWith powerplant loads Without powerplant loads
TIME, IN DAYS D
FIGURE 31.—Continued. C, Near Fairburn. D, Near Whitesburg.
SELECTED REFERENCES
Amein, M. M., and Fang, C. S., 1970, Implicit flood routing in natural channels: Journal of the Hydraulics Division, American Society of Civil Engineers, v. 96, no. HY12.
Atlanta Regional Commission, 1976, Metropolitan Atlanta area water-supply review supplement, Appendix M, Water-supply plan for the Atlanta region; Part 1, Needs, sources and policies.
Cherry, R. N., Faye, R. E., Stamer, J. K., McGinty, H. K., 1976, Plan for river quality assessment, upper Chatta- hoochee River basin, Georgia: American Water Works Association River Water Quality Assessment Seminar, proceedings, no. 20133.
Dyar, T. R., and Stokes, W. R., 1973, Water temperatures of Georgia streams: Atlanta, Ga., Georgia Department of Natural Resources 317 p.
Fenneman, N. M., 1938, Physiography of the eastern United States: New York, McGraw-Hill, 714 p.
Higgins, M. W., 1968, Geologic map of the Brevard Fault zone near Atlanta, Georgia: U.S. Geological Survey Miscellaneous Geologic Investigations Map 1-511.
Jobson, Harvey E., 1973, The dissipation of excess heat from water systems: Journal of the Power Division, American Society of Civil Engineers, v. 99, no. Pol, p. 89-103.
———— 1977a, Bed conduction computation for thermal models: Journal of the Hydraulics Division, American Society of Civil Engineers, v. 103, no. HY10, p. 1213-1217.
1977b, Thermal model for evaporation from open channels: Congress of the International Association for Hydraulic Research, 17th, Baden-Baden, Germany, August 14-19, 1977, proceedings, p. 95-102.
Jobson, H. E., 1975, Canal evaporation determined by thermal modeling: American Society of Civil Engineers, San Francisco, Calif., proceedings, p. 729-43.
Jobson, H. E., and Reefer, T. N., 1977, Thermal modeling of highly transient flows in the Chattahoochee River near Atlanta, Georgia: Special Symposium on River Quality

46 FLOW REGULATION AND POWERPLANT EFFLUENTS—CHATTAHOOCHEE RIVER, GEORGIA
Assessments, American Water Works Association, Tueson, Ariz., proceedings,
1979, Modeling highly transient flow, mass and heattransport in the Chattahoochee River near Atlanta, Georgia, U.S. Geological Survey Open-File Report 79- 270, 139 p.
Koberg, G. E., 1964, Methods to compute long-wave radia tion from the atmosphere and reflected solar radiation from a water surface: U.S. Geological Survey Profes sional Paper 272-F, p. 107-136.
Kothandaraman, V., and Evans, R. L,, 1972, Use of air- water relationships for predicting water temperature: Illinois State Water Survey Investigation no. 69, p. 10.
Lamar, W. L., 1944, Chemical character of surface waters of Georgia: U.S. Geological Survey Water Supply Paper 889-E, 327 p.
Land, L. F., 1978, Unsteady streamflow simulation using a
linear-implicit, finite-difference model: U.S. Geological Survey program documentation J879, 69 p.
Langford, T. E., 1970, The temperature of a British river up stream and downstream of a heated discharge from a power station: Hydrolbiologia, Vol. 35, p. 353-375.
National Oceanic and Atmospheric Administration (NOAA), 1976, Local climatological data, Atlanta, Georgia: 5 p.
Stone, H. L., and Brian, P. L. T., 1963, Numerical /solution of covective transport problems: Journal of the Ameri can Institute of Chemical Engineers, v. 9, no. 3, p. 681- 688.
Thomson, M. T., and Carter R. F., 1955, Surface-water re sources of Georgia during the drought of 1954, Part I, Streamflow: Georgia Department of Mines and Geology Information Circular 17, 79 p.
U.S. Army Corps of Engineers, 1973, Flood plain informa tion—Chattahoochee River, Buford Dam to Whitesburg, Georgia: Alabama, Mobile District, 16 p., 50 plates.
SUMMARY OF DATA—TABLES 8-10

48 FLOW REGULATION AND POWERPLANT EFFLUENTS—CHATTAHOOCHEE RIVER, GEORGIA
TABLE 8.—Cross section coordinates[Measurements in feet]
Horizontal distance
RM20.040557085
100115130 1451601701801902002102202302402502602701280 290300310320330
RM0
1020 22 30 50 100 200 300 400 430 500 520 540 560
RM0
14 40100140200220244264
RM0
1421 29 50 70 80
100 150IQflJ-i/V
200236255
Altitude
302.97
767.0762.0760.5755.3751.9750.7750.9749.7 749.5749.6748.1748.4747.4747.4747.8749.4750.3749.7747.9747.7747.9749.Q 750.8751.3753.1756.8766.8
302.38
766761756 752 748 750 747 748 748 751 752 753 756 761 766
302.05
761.5752.6 746.5743.4747.1747.7746.8752.6762.3
300.98
761.4752.0747.1 747.0 746.0 746.0 741.0 739.0 739.674210 744.4752.0762.7
Horizontal distance
RM0
426282
100120160200 240280320340360373386
RM364381409425439 459510559610659687705
RM2366 82 103 118 169| 216 265 309 325 405
RM210 240 £60280300 320340360380400410430
RM2675
125 175 225 256 280 325 425 460
RM-20
0
Altitude
300.62760755750748746745745745 745745746748750755760
300.44762.6760.2748.9748.3740.1 740.8740.8739.3739.0739.0749.7761.8
300.29776.0763.0 761.2 750.9 743.3741.01 1735.01 735.2 750.9 760.2 764.2
299.94 756.8 742.2 734.0731.2731.2 734.7734.9734.5735.7734.1740.27fifi 3 i ou.o
299.56765.7738.1733.7 733.5 733.9 738.5 752.9 754.9 753.9 762.4
299.20754.5741.4
Horizontal distance Altitude
RM 299.20 Continued1555
105125175185210
RM0
203560
100150200214233
RM0
20 354560100150200214233
RM85 130 140 150 160 170 180 190 200 210 220 230 240 250 260270280 290300310322.6332373
RM-40-29
050 107 139 200 218 223 260 290
RM0
15
735.9733.1733.9735.6729.6730.8755.5
299.10754744740739739740741744755
298.93755,1745.5 738.5733.0736.3735.2735,4736.4744.5756.0
298.77
756.7 736.2 741.1 739.8 735.7 734.3 733.4 734.1 734.4 735.4 733.7 733.6 734.4 735.1 735.3737.1737.1 738.3737.7739.1741.1744.2754.7
298.10
762.5757.0755.0731.8 733.4 733.3 735.4 755.8 740.5 760.1 764.4
297.86
753.6743.9
Horizontal distance Altitude
RM 297.86 Continued3050
100150200214222
RM74
130145160180230280300315326347367
RM0
151630507790
100150165 182 183 195
RM 140 152 165 190 240 290 340 355 368388
RM0
2540
100150200240254 285
RM0 45
100 153 165 200 248 299367 398423450
737.9735.4736.9736.0736.2743.9752.2
297.73757.7751.3741.6735.7733.7734.9734.7733.8736.5741.7755.2759.2
297.06754.0745.8739.3734.8734.8734.5732.3735.8734.1736.0 739.3 746.2 751.2
296.60750.3 742.9 735.9 736.4 735.1 735.5 735.2 736.0 743.8751.2
295.30TKO O fO£.O
740.5731.9731.8732.0732.4749.9740.5 74Q QI ~t<y.y
294.70769.5 755.9 752.0 745.0 738.3 738.0 735.8 727.0733.8 755.3757.8768.7

TABLES SUMMARIZING DATA 49
TABLE 8.—Cross section coordinates—Continued[Measurements in feet]
Horizontal distance
RM5586
100197300311330400
RM0
1516303650
100104150167180199200215
RM 400420437450 470 494 510 560 575 586606659
RM -20
0 10 20 30 50
100 153 170 180195
RM -9
216 28 4050
100 150 200 210 216 233 249 270
RM0
152030
Altitude
293.92753.5742.0731.6729.0730.9742.0749.4750.4
293 .10751.9739.3733.3731.1727.8729.2728.1729.3727.6726.6729.2733.2739.3750.3
292.19 751.6737.9729.8728.2 725.2 726.2 726.1 727.4 723.7 729.5737.9 •755.6
290.54746.4 741.7 737.0 730.5 724.7 727.1 725.5 728.0 722.7 730.5744.1
287.86744.6 741.5732.0 725.1 721.8724.6724.8 723.8 724.1 723.8 725.9 732.0 741.9 744.2
286.96742.1729.8727.1725.8
Horizontal distance Altitude
RM 286.96 — Continued50
100150200245255270
RM 220248270320370420435482
RM05
308095
121 150 160190195
RM 20 50 80
110 140170OAAZUv22(0 245 270 290 310 330 334 337 340 355 370 390410430 450 470 500530 565 580
RM0
12 20 40 70
100 150 200227 235
RM05
722.3721.9722.1721.8727.1729.8741.2
286.07 739.9718.0719.9720.8721.1720.0721.0738.9
284.32735.1720.7717.8718.2716.7 718.5 719.2 719.2720.7739.4
281.79743.9 738.2 737.4 736.3 734.6734.3729.8 719.5 715.0 714.1 716.5 715.3 714.7 714.9 716.3 716.8 716.8 716.9 716.8717.1718.0 722.3 730.4 736.5739.2 741.3 743.8
281.07737.9 720.2 722.5 710.2 716.1 714.5 714.8 713.1720.2 735.6
279.99733.6722.1
Horizontal distance Altitude
RM 279.99 — Continued233560
100200210225230
RM0
10203060
180210235240245254264354
RM -65-48
020
100 150 200 260 2,66 271 300
RM-10
3 8
30 80
120 140 180 200 230 250 260
RM0
3044 enou 51 69 80
100150 200 250 300 330 352 353 365376 406
RM0
20
714.3711.7714.7715.5715.6716.2722.1735.1
277.95734.0720.8710.8708.3710.8710.8711.7711.8713.8714.7720.8727.8729.3
274.12 732.0 728.5725.4713.7713.3 712.9 712.7 711.2 719.9 726.8 732.2
272.20727.2 713.2 710.5 712.1 710.9 711.1 710.8 711.3 712.5 712.8 713.2 727.5
271.22740.5 728.5 728.371 Q q1 lO.O
713.5 710.7 710.5709.7711.5 712.4 711.0 710.2 709.3 713.5 718.3 724.8725.7 739.5
270.86716.5712.5
Horizontal distance Altitude
RM 270.86 — Continued406080
100120140160180200 220240260280286291
RM-86
0102576
125165 240 246 253
RM800 900 910 925 975
1,000 1,0501,1001,150 1,210 1,215 1,235 1,275
RM 0
14 30 80
120 170210222244
RM0
10 33
110200 224 229 250 264
RM -20
0 2040576180
708.0709.5710.0710.0710.0710.5711.5709.0707.3 700.5710.0710.0710.5711.0716.5
27043719.3715.5707.8701.5702.4701.5700.9 700.4 707.8 716.6
268.34710.8 707.3 704.1 701.8 701.6 700.6 698.3698.6699.7 702.4 704.1 708.2 712.7
266.02 702.5 698.1 692.1 692.7 693.1 693.4692.9698.1 704.6
263.62700.2 690.2 684.9687.2686.4 684.9 686.4 690.1 697.6
259.87 699.6692.6 684.1684.0684.4681.6683.8
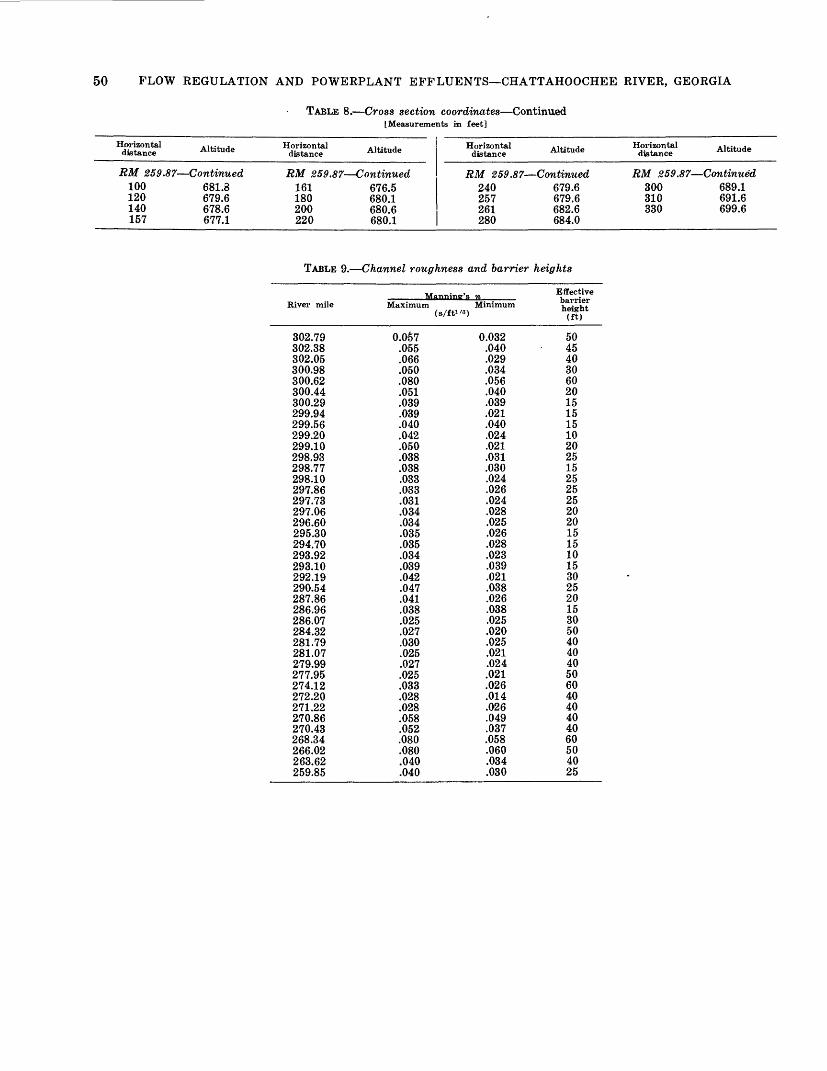
50 PLOW REGULATION AND POWERPLANT EFFLUENTS—CHATTAHOOCHEE RIVER, GEORGIA
TABLE 8.—Cross section coordinates—Continued[Measurements in feet]
Horizontal distance Altitude
RM 259.87— Continued100120140157
681.3679.6678.6677.1
Horizontal distance Altitude
RM 259.87 — Continued161180200220
676.5680.1680.6680.1
Horizontal distance Altitude
RM 259.87 — Continued240257261280
679.6679.6682.6684.0
Horizontal distance Altitude
RM 259.87 — Continued300310330
689.1691.6699.6
TABLE 9.—Channel roughness and barrier heights
River mile
302.79302.38302.05300.98300.62300.44300.29299.94299.56299.20299.10298.93298.77298.10297.86297.73297.06296.60295.30294.70293.92293.10292.19290.54287.86286.96286.07284.32281.79281.07279.99277.95274.12272.20271.22270.86270.43268.34266.02263.62259.85
Manninor'sMaximum
(S/W'3)
0.057.055.066.050.080.051.039.039.040.042.050.038.038.033.033.031.034.034.035.035.034.039.042.047.041.038.025.027.030.025.027.025.033.028.028.058.052.080.080.040.040
nMinimum
0.032.040.029.034.056.040.039.021.040.024.021.031.030.024.026.024.028.025.026.028.023.039.021.038.026.038.025.020.025.021.024.021.026.014.026.049.037.058.060.034.030
Effective barrier height (ft)
5045403060201515151020251525252520201515101530252015305040404050604040404060504025

TABLES SUMMARIZING DATA 51
TABLE 10.—Summary of meteorologic data, July 12-19 and August 1-8,1976[Precipitation = 0.0 mm for entire period]
TimeWindspeed(m/s)
Short waveradiation(W/m^)
Long waveradiation<W/mB)
Air temperaturedry bulb<°C) wet bulb<°C)
Vaporpressure
(KPa)
July 12, 1976000001000200030004000500060007000800090010001100120013001400150016001700180019002000210022002300
0.28.30.30.30
1.331.89
.523.471.474.576.473.706.344.403.003.935.934.113.392.44
.812.482.172.52
0.00.00.00.00.0
24.2141.8344.0558.2727.5860.4
1,023.1906.6905.5769.2647.3438.5224.267.0
0.00.00.00.00.0
372.5372.5372.5372.5372.5372.5372.5375.5372.5372.5372.5372.5372.5372.5372.5372.5372.5372.5372.5372.5372.5372.5372.5372.5
22.621.821.820.520.821.022.023.325.726.828.129.329.529.931.129.629.429.428.727.125.825.023.723.2
21.020.920.519.719.719.920.421.021.722.322.322.321.221.422.421.322.122.422.222.022.021.921.121.0
2.462.452.392.282.272.302.372.452.532.622.602.582.382.412.572.402.542.592.572.562.582.572.462.45
July 13, 1976000001000200030004000500060007000800090010001100120013001400150016001700180019002000210022002300
2.191.041.121.62
.30
.28
.673.602.814.594.733.003.412.194.735.893.742.75
.50
.57
.73
.28
.28
.59
0.00.00.00.00.0
26.498.9
302.2526.4738.5913.2951.6989.0286.8253.8611.0415.4254.9
83.50.00.00.00.00.0
371.8371.8371.8371.8371.8371.8371.8371.8371.8371.8371.8371.8371.8371.8371.8371.8371.8371.8371.8371.8371.8371.8371.8371.8
22.321.821.221.020.620.521.923.525.226.627.328.029.229.830.129.630.430.329.425.424.122.021.019.1
20.419.819.920.019.719.319.921.221.421.721.622.122.221.3 .21.021.521.020.520.319.618.418.417.616.7
2.362.272.302.322.282.212.292.482.482.512.482.562.562.392.342.432.332.252.232.182.022.051.951.89
July 14, 1976000001000200030004000500060007000800090010001100120013001400150016001700
0.30.90.71
1.18.79.28
1.04.96.28.59.30
2.832.571.80
.904.651.042.61
0.00.00.00.00.09.9
201.1301.1558.2693.4853.8934.1964.8925.3786.8649.5453.8258.2
349.6349.6349.6349.6349.6349.6349.6349.6349.6349.6349.6349.6349.6349.6349.6349.6349.6349.6
18.117.817.416.516.415.917.320.224.024.127.626.728.430.830.730.130.630.4
16.515.715.215.214.514.215.215.116.216.016.816.717.317.017.817.718.318.5
1.851.751.691.701.621.591.691.631.711.691.741.741.801.721.831.831.901.94

52 FLOW REGULATION AND POWERPLANT EFFLUENTS—CHATTAHOOCHEE RIVER, GEORGIA
TABLE 10.—Summary of meteorologic data, July 12-19 and August 1-8, 1976—Continued[Precipitation = 0.0 mm for entire period]
Time
180019002000210022002300
Windspeed(m/s)
.36
.54
.28
.28
.28
.28
Short waveradiation(W/mP)
July70.3
0.00.00.00.00.0
Lone waveradiation<W/m2)
14, 1976 — Continued349.6349.6349.6349.6349.6349.6
Air temperaturedry bulb<°C)
29.325.523.422.322.020.4
wet bulb<°C)
19.919.719.719.819.318.9
Vaporpressure
(KPa)
2.172.202.232.262.192.15
July 15, 1976000001000200030004000500060007000800090010001100120013001400150016001700180019002000210022002300
0.28.28.28.28.28.57.28.92
2.13.59
3.101.912.791.204.036.962.282.831.911.37
.631.781.20
.87
0.00.00.00.00.0
16.5149.5325.3500.0579.1769.2880.2893.4627.5407.7656.0235.2146.2111.0
0.00.00.00.00.0
371.8371.8371.8371.8371.8371.8371.8371.8371.8371.8371.8371.8371.8371.8371.8371.8371.8371.8371.8371.8371.8371.8371.8371.8
20.320.719.518.718.118.320.424.126.027.529.229.630.131.130.129.829.528.328.925.724.924.923.822.9
18.619.0
. 18.018.017.517.818.821.021.922.423.122.622.622.422.521.522.021.321.922.321.920.720.119.6
2.112.162.032.051.982.022.142.432.562.622.722.632.622.572.602.432.522.422.512.632.572.372.292.22
July 16, 1976000001000200030004000500060007000800090010001100120013001400150016001700180019002000210022002300
1.93.54.28
1.561.491.391.452.612.924.116.495.895.765.043.145.433.621.99
.302.81
.302.481.511.08
0.00.00.00.00.07.7
157.1350.5549.5709.9868.1307.7
1,003.3985.7844.0237.4182.4130.8
23.10.00.00.00.00.0
363.5363.5363.5363.5363.5363.5363.5363.5363.5363.5363.5363.5363.5363.5363.5363.5363.5363.5363.5363.5363.5363.5363.5363.5
22.421.720.820.720.620.321.323.825.026.527.728.329.529.629.730.120.722.422.420.920.319.619.319.6
19.619.919.819.519.619.519.821.020.621.021.221.320.920.621.521.018.219.319.418.218.218.318.218.4
2.232.292.292.242.262.252.282.442.352.392.412.422.332.282.432.342.052.182.202.042.052.082.072.09
July 17, 1976000001000200030004000500060007000800
1.29.85.30
1.861.35
.281.08
.342.34
0.00.00.00.00.06.6
83.5127.5311.0
361.43G1.4361.4361.4361.4361.4361.4361.4361.4
19.819.119.418.819.719.619.720.221.9
18.418.018.517.918.619.019.019.419.6
2.092.042.112.032.122.182.182.232.24

TABLES SUMMARIZING DATA 53
TABLE 10.—Summary of meteorologic data, July 12-19 and August 1-8, 1976—Continued[Precipitation = 0.0 mm for entire period]
Time
090010001100120013001400150016001700180019002000210022002300
Windspeed(m/s)
1.27.28
2.851.004.034.051.354.862.40
.28
.28
.28
.28
.30
.30
Short waveradiation(W/m2)
July319.8764.8912.1236.3760.4427.5565.9214.3
42.924.2
1.10.00.00.00.0
Long waveradiation(W/mS)
17, 1976 — Continued361.4361.4361.4361.4361.4361.4361.4361.4361.4361.4361.4361.4361.4361.4361.4
Air temperaturedry bulb<°C)
23.925.726.930.128.927.830.527.525.824.623.122.220.419.819.1
wet bulb(°C)
21.021.120.721.319.919.621.420.319.719.619.919.518.718.718.2
Vaporpressure
(KPa)
2.442.422.342.392.182.152.402.262.192.202.272.222.122.132.07
July 18, 1976000001000200030004000500060007000800090010001100120013001400150016001700180019002000210022002300
0.32.28.28.73.28.28.30.83.75
1.00.38.28.67.87
2.05.52
1.061.411.12
.61
.28
.46
.28.28
0.00.00.00.00.06.6
74.7290.1380.2475.8827.5887.9926.4924.2823.1330.8469.2137.4
63.70.00.00.00.00.0
377.0377.0377.0377.0377.0377.0377.0377.0377.0377.0377.0377.0377.0377.0377.0377.0377.0377.0377.0377.0377.0377.0377.0377.0
18.418.718.217.517.317.117.620.023.126.128.331.733.435.131.334.333.231.027.825.123.521.920.920.4
17.717.217.116.416.316.216.917.518.519.619.920.721.622.420.722.422.422.021.021.120.219.819.319.3
2.011.931.931.841.831.821.911.962.0-52.172.192.262.392.502.272.522.532.502.372.432.312.272.212.22
July 19, 1976000001000200030004000500060007000800090010001100120013001400150016001700180019002000210022002300
0.28.28.79.40.67.30.90.28.38
1.371.16
.36
.961.434.533.721.68
.541.72
.81
.67
.54
.28
.28
0.00.00.00.00.0
12.1130.8301.1494.5667.0818.7906.6970.3960.4803.3275.8419.8250.5
18.70.00.00.00.00.0
373.2373.2373.2373.2373.2373.2373.2373.2373.2373.2373.2373.2373.2373.2373.2373.2373.2373.2373.2373.2373.2373.2373.2373.2
20.119.618.717.918.318.519.422.925.327.930.431.432.931.632.332.832.032.728.526.925.223.522.221.8
18.918.118.117.017.017.218.119.621.021.422.121.922.421.221.421.421.823.222.121.521.720.620.220.1
2.162.052.061.921.911.942.052.222.412.442.522.472.542.352.372.362.452.692.552.472.572.382.332.32
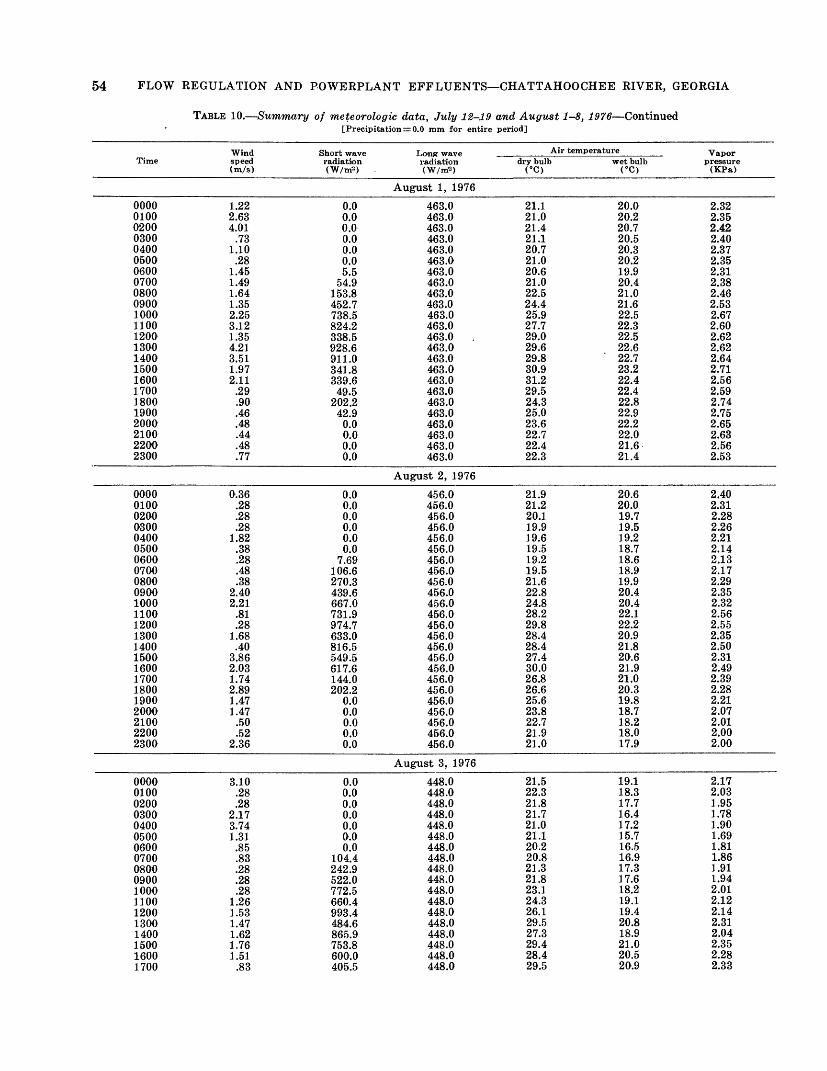
54 FLOW REGULATION AND POWERPLANT EFFLUENTS—CHATTAHOOCHEE RIVER, GEORGIA
TABLE 10.—Summary of meteorologic data, July 12-19 and August 1-8, 1976—Continued[Precipitation = 0.0 mm for entire period]
TimeWindspeed(m/s)
Short waveradiation(W/nv*) .
Long waveradiation<W/rri2)
Air temperaturedry bulb(°C) wet bulb<°C)
Vaporpressure
(KPa)
August 1, 1976000001000200030004000500060007000800090010001100120013001400150016001700180019002000210022002300
1.222.634.01
.731.10
.281.451.491.641.352.253.121.354.213.511.972.11
.29.90.46.48.44.48.77
0.00.00.00.00.00.05.5
54.9153.8452.7738.5824.2338.5928.6911.0341.8339.649.5
202.242.9
0.00.00.00.0
463.0463.0463.0463.0463.0463.0463.0463.0463.0463.0463.0463.0463.0 .463.0463.0463.0463.0463.0463.0463.0463.0463.0463.0463.0
21.121.021.421.120.721.020.621.022.524.425.927.729.029.629.830.931.229.524.325.023.622.722.422.3
20.020.220.720.520.320.219.920.421.021.622.522.322.522.6
" 22.723.222.422.422.822.922.222.021.621.4
2.322.352.422.402.372.352.312.382.462.532.672.602.622.622.642.712.562.592.742.752.652.632.562.53
August 2, 1976000001000200030004000500060007000800090010001100120013001400150016001700180019002000210022002300
0.36.28.28.28
1.82.38.28.48.38
2.402.21
.81
.281.68.40
3.862.031.742.891.471.47
.50
.522.36
0.00.00.00.00.00.0
7.69106.6270.3439.6667.0731.9974.7633.0816.5549.5617.6144.0202.2
0.00.00.00.00.0
456.0456.0456.0456.0456.0456.0456.0456.0456.0456.0456.0456.0456.0456.0456.0456.0456.0456.0456.0456.0456.0456.0456.0456.0
21.921.220.119.919.619.519.219.521.622.824.828.229.828.428.427.430.026.826.625.623.822.721.921.0
20.620.019.719.519.218.718.618.919.920.420.422.122.220.921.820.621.921.020.319.818.718.218.017.9
2.402.312.282.262.212.142.132.172.292.352.322.562.552.352.502.312.492.392.282.212.072.012.002.00
August 3, 1976000001000200030004000500060007000800090010001100120013001400150016001700
3.10.28.28
2.173.741.31
.85
.83
.28
.28
.281.261.531.471.621.761.51
.83
0.00.00.00.00.00.00.0
104.4242.9522.0772.5660.4993.4484.6865.9753.8600.0405.5
448.0448.0448.0448.0448.0448.0448.0448.0448.0448.0448.0448.0448.0448.0448.0448.0448.0448.0
21.522.321.821.721.021.120.220.821.321.823.124.326.129.527.329.428.429.5
19.118.317.716.417.215.716.516.917.317.618.219.119.420.818.921.020.520.9
2.172.031.951.781.901.691.811.861.911.942.012.122.142.312.042.352.282.33
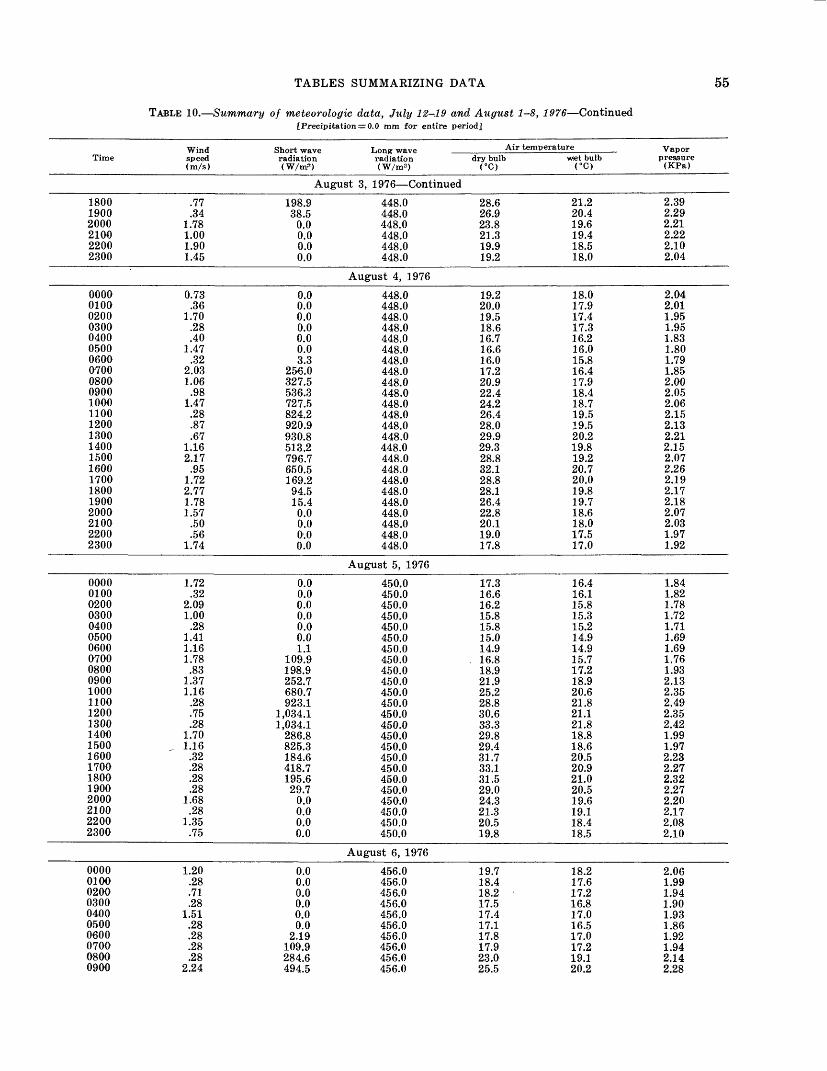
TABLES SUMMARIZING DATA 55
TABLE 10.—Summary of meteorologic data, July 12-19 and August 1-8, 1976—Continued[Precipitation = 0.0 mm for entire period]
TimeWindspeed(m/s)
Short wave Long waveradiation radiation(W/mS) (W/m^)
Air temperaturedry bulb<°C) wet bulb<°C)
Vaporpressure
(KPa)
August 3, 1976 — Continued180019002000210022002300
.77
.341.781.001.901.45
198.938.5
0.00.00.00.0
448.0448.0448.0448.0448.0448.0
28.626.923.821.319.919.2
21.220.419.619.418.518.0
2.392.292.212.222.102.04
August 4, 1976000001000200030004000500060007000800090010001100120013001400150016001700180019002000210022002300
0.73.36
1.70.28.40
1.47.32
2.031.06
.981.47.28.87.67
1.162.17
.951.722.771.781.57
.50
.561.74
0.00.00.00.00.00.03.3
256.0327.5536.3727.5824.2920.9930.8513.2796.7650.5169.294.515.40.00.00.00.0
448.0448.0448.0448.0448.0448.0448.0448.0448.0448.0448.0448.0448.0448.0448.0448.0448.0448.0448.0448.0448.0448.0448.0448.0
19.220.019.518.616.716.616.017.220.922.424.226.428.029.929.328.832.128.828.126.422.820.119.017.8
18.017.917.417.316.216.015.816.417.918.418.719.519.520.219.819.220.720.019.819.718.618.017.517.0
2.042.011.951.951.831.801.791.852.002.052.062.152.132.212.152.072.262.192.172.182.072.031.971.92
August 5, 1976000001000200030004000500060007000800090010001100120013001400150016001700180019002000210022002300
1.72.32
2.091.00
.281.411.161.78.83
1.371.16
.28
.75
.281.70
. 1.16.32.28.28.28
1.68.28
1.35.75
0.00.00.00.00.00.01.1
109.9198.9252.7680.7923.1
1,034.11,034.1
286.8825.3184.6418.7195.629.7
0.00.00.00.0
450.0450.0450.0450.0450.0450.0450.0450.0450.0450.0450.0450.0450.0450.0450.0450.0450.0450.0450.0450.0450.0450.0450.0450.0
17.316.616.215.815.815.014.9
. 16.818.921.925.228.830.633.329.829.431.733.131.529.024.321.320.519.8
16.416.115.815.315.214.914.915.717.218.920.621.821.121.818.818.620.520.921.020.519.619.118.418.5
1.841.821.781.721.711.691.691.761.932.132.352.492.352.421.991.972.232.272.322.272.202.172.082.10
August 6, 19760000010002000300040005000600070008000900
1.20.28.71.28
1.51.28.28.28.28
2.24
0.00.00.00.00.00.0
2.19109.9284.6494.5
456.0456.0456.0456.0456.0456.0456.0456.0456.0456.0
19.718.418.2 -17.517.417.117.817.923.025.5
18.217.617.216.817.016.517.017.219.120.2
2.061.991.941.901.931.861.921.942.142.28
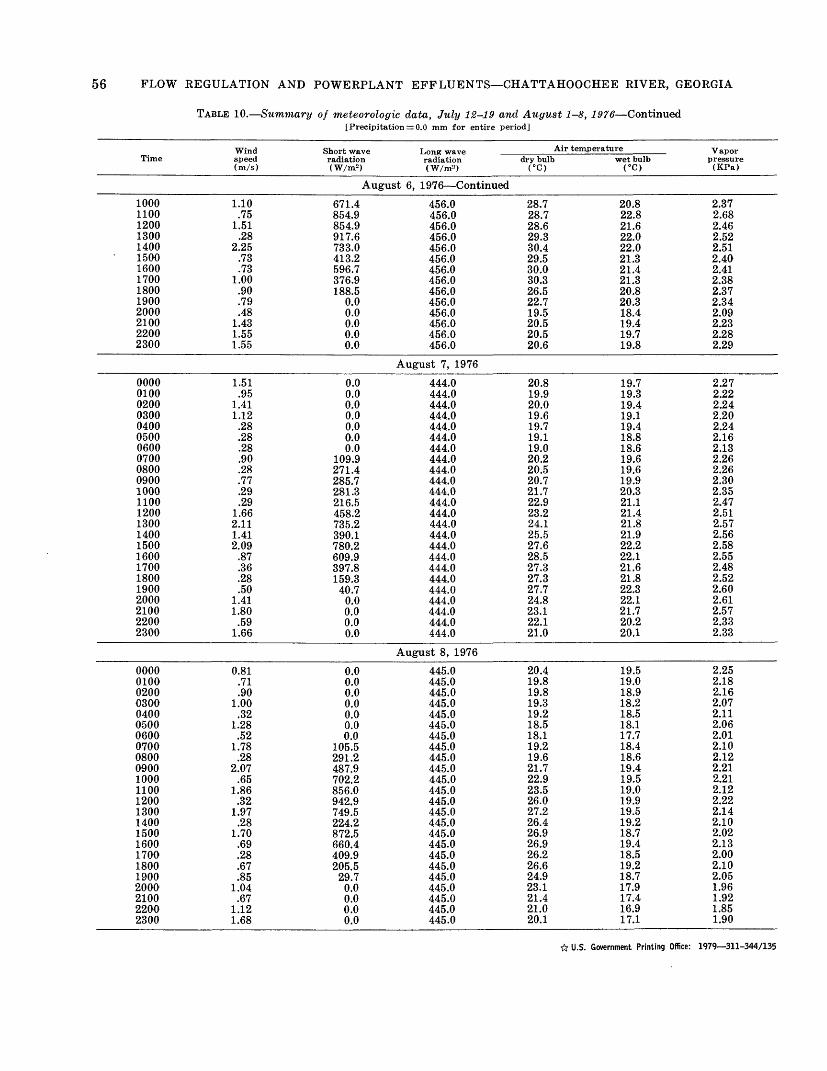
56 FLOW REGULATION AND POWERPLANT EFFLUENTS—CHATTAHOOCHEE RIVER, GEORGIA
TABLE 10.—Summary of meteorologic data, July 12-19 and August 1-8, 1976—Continued[Precipitation = 0.0 mm for entire period]
TimeWindspeed(m/s)
Short waveradiation(W/m2 )
Long waveradiation(W/m2)
Air temperaturedry bulb<°C) wet bulb(°C)
Vaporpressure(KPa)
August 6, 1976 — Continued10001100120013001400150016001700180019002000210022002300
1.10.75
1.51.28
2.25.73.73
1.00.90.79.48
1.431.551.55
671.4854.9854.9917.6733.0413.2596.7376.9188.5
0.00.00.00.00.0
456.0456.0456.0456.0456.0456.0456.0456.0456.0456.0456.0456.0456.0456.0
28.728.728.629.330.429.530.030.326.522.719.520.520.520.6
20.822.821.622.022.021.321.421.320.820.318.419.419.719.8
2.372.682.462.522.512.402.412.382.372.342.092.232.282.29
August 7, 1976000001000200030004000500060007000800090010001100120013001400150016001700180019002000210022002300
1.51.95
1.411.12
.28
.28
.28
.90
.28
.77
.29
.291.662.111.412.09
.87
.36
.28
.501.411.80
.591.66
0.00.00.00.00.00.00.0
109.9271.4285.7281.3216.5458.2735.2390.1780.2609.9397.8159.3
40.70.00.00.00.0
444.0444.0444.0444.0444.0444.0444.0444.0444.0444.0444.0444.0444.0444.0444.0444.0444.0444.0444.0444.0444.0444.0444.0444.0
20.819.920.019.619.719.119.020.220.520.721.722.923.224.125.527.628.527.327.327.724.823.122.121.0
19.719.319.419.119.418.818.619.619.619.920.321.121.421.821.922.222.121.621.822.322.121.720.220.1
2.272.222.242.202.242.162.132.262.262.302.352.472.512.572.562.582.552.482.522.602.612.572.332.33
August 8, 1976000001000200030004000500060007000800090010001100120013001400150016001700180019002000210022002300
0.81.71.90
1.00.32
1.28.52
1.78.28
2.07.65
1.86.32
1.97.28
1.70.69.28.67.85
1.04.67
1.121.68
0.00.00.00.00.00.00.0
105.5291.2487.9702.2856.0942.9749.5224.2872.5660.4409.9205.5
29.70.00.00.00.0
445.0445.0445.0445.0445.0445.0445.0445.0445.0445.0445.0445.0445.0445.0445.0445.0445.0445.0445.0445.0445.0445.0445.0445.0
20.419.819.819.319.218.518.119.219.621.722.923.526.027.226.426.926.926.226.624.923.121.421.020.1
19.519.018.918.218.518.117.718.418.619.419.519.019.919.519.218.719.418.519.218.717.917.416.917.1
2.252.182.162.072.112.062.012.102.122.212.212.122.222.142.102.022.132.002.102.051.961.921.851.90
ft U.S. Government Printing Office: 1979—311-344/135