Embed Size (px)
Citation preview

Science for conServation 291
Impact of fire on tussock grassland invertebrate populations

Impact of fire on tussock grassland invertebrate populations
B.I.P. Barratt, C.M. Ferguson, D.M. Barton and P.D. Johnstone
Science for conServation 291
Published by
Publishing Team
Department of Conservation
PO Box 10420, The Terrace
Wellington 6143, New Zealand

Cover: A smouldering summer burn plot at Mount Benger. Photo: Barbara Barratt.
Science for Conservation is a scientific monograph series presenting research funded by New Zealand
Department of Conservation (DOC). Manuscripts are internally and externally peer-reviewed; resulting
publications are considered part of the formal international scientific literature.
Individual copies are printed, and are also available from the departmental website in pdf form. Titles
are listed in our catalogue on the website, refer www.doc.govt.nz under Publications, then Science &
technical.
© Copyright March 2009, New Zealand Department of Conservation
ISSN 1173–2946 (hardcopy)
ISSN 1177–9241 (web PDF)
ISBN 978–0–478–14577–9 (hardcopy)
ISBN 978–0–478–14578–6 (web PDF)
This report was prepared for publication by the Publishing Team; editing by Helen O’Leary and layout
by Amanda Todd. Publication was approved by the General Manager, Research and Development Group,
Department of Conservation, Wellington, New Zealand.
In the interest of forest conservation, we support paperless electronic publishing. When printing,
recycled paper is used wherever possible.

CONTeNTS
Abstract 5
1. Introduction 6
1.1 Background 7
1.2 Objectives 9
2. Methods 10
2.1 Sites 10
2.2 Treatments 11
2.3 Invertebrate sampling 13
2.4 Invertebrate extraction and processing 13
2.5 Statistical analyses 14
3. Results 16
3.1 Deep Stream versus Mount Benger invertebrate communities 16
3.1.1 Taxonomic composition 16
3.1.2 Trophic composition 17
3.2 effect of burning treatments on invertebrate density 18
3.2.1 Deep Stream 19
3.2.2 Mount Benger 22
3.2.3 Summary 24
3.3 effect of burning treatments on community trophic structure 25
3.3.1 2–3 months post-burn 25
3.3.2 3 years post-burn 25
3.4 Coleoptera: a detailed study 28
3.4.1 Density, species composition and effect of burn treatments 28
3.4.2 Species richness 30
3.4.3 Species diversity 31
3.4.4 Rank-abundance patterns 33
3.4.5 Community trophic structure and response to treatments 35
3.4.6 exotic component of the community 36
4. Discussion 39
4.1 Comparisons between Deep Stream and Mount Benger
invertebrate communities 39
4.1.1 Taxonomic composition 39
4.1.2 Trophic composition 40
4.2 Invertebrate responses to burning 40
4.3 Seasonal effect of burning on invertebrates 42

4.4 effect of burning treatments on community trophic structure 43
4.4.1 Herbivore response 43
4.4.2 Carnivore response 44
4.4.3 Detritivore response 44
4.4.4 Fungivore response 44
4.5 Coleoptera: a detailed study 44
4.5.1 effect of treatments on species richness 45
4.5.2 Species diversity and rank abundance patterns 46
4.5.3 Trophic structure and response to treatments 46
4.5.4 exotic component of the community 47
4.6 Limitations of this study 47
5. Conclusions 48
6. Recommendations 49
7. Acknowledgements 49
8. References 50
Appendix 1
Taxonomic groups and common names of invertebrates identified 55
Appendix 2
Coleoptera taxa found at Deep Stream and Mount Benger 57
Appendix 3
Notes on identification and ecology of some species 63
Appendix 4
Mean density of invertebrate groups at Deep Stream 65
Appendix 5
Mean density of invertebrate groups at Mount Benger 70
Appendix 6
Summary of Coleoptera taxa recorded at Deep Stream (DS) and Mount
Benger (MB) 75

5Science for Conservation 291
© Copyright March 2009, Department of Conservation. This paper may be cited as:
Barratt, B.I.P.; Ferguson, C.M.; Barton, D.M.; Johnstone, P.D. 2009: Impact of fire on tussock
grassland invertebrate populations. Science for Conservation 291. Department of
Conservation, Wellington. 75 p.
Impact of fire on tussock grassland invertebrate populations
B.I.P. Barratt, C.M. Ferguson, D.M. Barton and P.D. Johnstone
AgResearch Invermay, Private Bag 50034, Mosgiel 9053, New Zealand
email: [email protected]
A B S T R A C T
The invertebrate fauna of tussock grassland in New Zealand has not been
well studied, and the effect of burning on the biodiversity of the ecosystem is
poorly understood by land managers. The impacts of burning on two tussock
grassland invertebrate communities in Otago, New Zealand, were investigated
between 1998 and 2006. At each site, three replicate 1-ha plots that were
unburned (control), or burned in spring or summer were sampled. Pre- and
post-burn sampling compared invertebrate densities and trophic group structure
in inter-tussock (turf) and tussock samples, and recovery after treatment. Most
groups were initially reduced in density post-burn. In the 1–2 year period
following treatment, Thysanoptera and Hemiptera ‘rebounded’ and reached
significantly higher population densities than before the fires. By the end of the
study, Amphipoda had not recovered to pre-burn densities. In general, herbivore
population densities recovered over a 2–3 year period, and litter-dwelling
invertebrate population densities were most negatively impacted. Season of
treatment had no major impact on invertebrate responses. Coleoptera were
chosen as a representative group for more detailed investigations of responses
at species level. Coleoptera species richness was reduced by about 50% at
2–3 months post-burn, but recovered to pre-burn levels 3 years later. There
was no evidence of a change in the density of exotic Coleoptera following the
burning treatments. Invertebrate data from these sites should be considered as
case studies, rather than applicable to tussock grassland in general. However,
these findings have several implications for the management of tussock grassland:
fire treatments that remove the litter layer are likely to reduce litter-dwelling
invertebrate populations for 3 years or more; summer fires do not appear to be
more detrimental to the invertebrate community than burning in spring, based
upon the limited seasonal data available to us; and the exotic component of the
fauna does not increase in response to fire in the first 3–4 years after burning.
Keywords: tussock grassland, invertebrates, Coleoptera species, burning, fire,
diversity, recovery, exotic species, New Zealand

6 Barratt et al.—Impact of fire on tussock invertebrates
1. Introduction
Grasslands of indigenous tussock species are characteristic of the lower rainfall
hill and high country areas in the South Island of New Zealand, and are used
for extensive pastoralism (Floate 1992). Since european settlement in the
late 19th century, fire has been used extensively to facilitate movement of
grazing animals and to convert tussock grassland into improved pasture. Burning
promotes new tussock growth, which is palatable to stock. It also removes litter
to increase the success of aerial over-sowing with introduced legumes and grasses
(Lowther & Douglas 1992). For pasture management, burning is usually carried
out in spring, when conditions are relatively cool and the soil and vegetation are
moist. Accidental fires tend to occur in late summer, when conditions are usually
drier, and hence the damage to vegetation and litter would be expected to have
a more severe impact on invertebrates.
There are concerns that fire damages native biota, allows weeds to establish
and promotes soil erosion (Payton & Pearce 2001). Overuse of fire in tussock
grassland has been recognised as causing loss of tall tussock species, with their
replacement by short tussock species or invasive weeds such as Hieracium
(Aspinal 2001). Local agencies with responsibility for promoting sustainable
land use have pointed out that the burning of tussock grassland can accelerate
soil erosion and reduce soil quality, change vegetation characteristics, reduce
conservation values and habitats for flora and fauna, and reduce water yield
(Otago Regional Council 2002).
Since 1983, considerable areas of tussock grassland have been retired from grazing
and formally protected as a result of the Protected Natural Area Programme,
which sought to protect representative vegetation types from 85 biogeographic
areas (ecological regions) across the country (Mcewen 1987). As a result of the
crown pastoral tenure review under the Crown Pastoral Land Act 1998, areas of
rangeland, particularly at higher altitudes, are currently being retired from grazing
and managed so that their natural character and the indigenous biodiversity will
be retained, and in some cases restored. In order to maintain conservation values
of these areas, an improved understanding of the biodiversity and dynamics of
grassland ecosystems is required.
Land managers need information about the impact of fire on the conservation
values of tussock grassland to make appropriate management decisions for these
areas. Hunt (2007) expressed the view that the Department of Conservation
(DOC) needs to improve monitoring of changes to ecosystems after fire. Hunt’s
report acknowledged the research outlined in this study, but recommended that
continued research on impacts of fire on ecosystems and biodiversity be given a
high priority, ‘especially invertebrates before and after fires’.

7Science for Conservation 291
1 . 1 B A C K G R O u N D
Worldwide, research into the impacts of fire on invertebrates in grassland
environments have shown few consistent patterns (Tscharntke & Greiler 1995;
Friend 1996; Blanche et al. 2001). Responses to fire depend upon seasonal and
environmental factors and their interaction with the micro-habitat requirements
of the fauna. Warren et al. (1987) and Webb (1994) attributed reductions
in densities of some arthropods to the reduced levels of soil moisture and
changes in microclimate that follow removal of the litter layer. Fire intensity
is important in determining impacts on invertebrates (Swengel 2001), and
this is influenced by several factors, including fuel load, vegetation moisture
content, weather conditions and topography. However, even after very hot and
‘complete’ burns, mortality of invertebrates has rarely been reported to be 100%
(Swengel 2001). The size and uniformity of the burnt area naturally influences
the rate of recolonisation from surrounding unburnt areas, or unburnt patches
within the burnt area. The impact of fire can also vary for different invertebrate
life-cycle stages; for example, a soil-dwelling stage is likely to be less immediately
affected by fire than a surface-dwelling stage.
Warren et al. (1987) reviewed literature on the impact of fire on each major
taxonomic group found in grassland. Studies investigating the effect of fire on
invertebrates are full of conflicting and variable data. This is partly because the
studies have been carried out using different methods, with widely differing
treatment intensities and regularities, and in areas with different climates.
Furthermore, many studies reported in the literature have been carried out in
ecosystems that are fire-adapted, and thus are likely to have different responses
from essentially non-fire-adapted environments such as New Zealand tussock
grassland. Warren et al. (1987) found that litter-dwelling invertebrates such
as mites and Collembola are generally adversely affected by fire as a result of
loss of the litter layer where they live and feed. Miriapods, such as millipedes
and centipedes, were less susceptible to acute impacts because of their cryptic
behaviour, but it was found that post-burn habitat modification could reduce
populations. Impacts on some of the larger groups, such as Coleoptera, Diptera
and Hemiptera, were found to be very variable, depending upon their trophic
group and the seasonal characteristics of the fire. Ants, which are common in
most grassland environments, usually survived the acute impacts of fires, and
generally recolonised burnt areas rapidly.
Several studies in New Zealand have investigated the impact of tussock burning
on plant communities (e.g. O’Connor & Powell 1963; Mark 1965; Payton et al.
1986), but comparatively little has been published on the effect of indigenous
grassland burning on invertebrates. Yeates & Lee (1997) found that 18 months
after a spring burn densities of both mites and Collembola in litter and in up to
2 cm soil depth were about 50% of those in an adjacent unburnt area; however,
after 30 months, the densities of these groups in the burnt areas were < 10% of
the unburnt areas. Henig-Sever et al. (2001) found, not unexpectedly, that litter-
dwelling invertebrates are more severely affected by fire than those living deeper
in the soil profile and suggested that inhabitants of the litter layer might be useful
ecological indicators of fire intensity on ecosystems.

8 Barratt et al.—Impact of fire on tussock invertebrates
In 1960, the Tussock Grasslands and Mountain Lands Institute (TGMLI) was set
up to assist farming in tussock grassland, and Graeme White, employed by the
TGMLI, emphasised the importance of understanding insect population dynamics
if management was to be successful (White 1972). Invertebrate biodiversity
and ecology in tussock grassland in Otago is not well known, although the
body of knowledge is steadily increasing. As for the New Zealand invertebrate
fauna in general, studies have indicated that the fauna exhibits a high degree
of endemism. One of the earliest papers on tussock grassland insects reported
on a study in Canterbury, where damage to tussock plants from noctuids and
other Lepidoptera was described, and Odontria (Coleoptera: Scarabaeidae)
larvae were found to be killing patches of grasses (Dick 1940). The author noted
that run-holders believed that burning tussock in spring reduced the numbers of
caterpillars found in tussock plants.
In 1978, the senior author was appointed to work on tussock grassland
entomology in Otago. The work, as in Canterbury, was mainly applied with
emphases on the ecology and management of the striped chafer (Odontria
striata White), and pests of white clover (Trifolium repens L.) seedlings
oversown into tussock. Research on these two topics was prompted by the
concerns of farmers and researchers, respectively, and the studies resulted
in a series of publications (Barratt 1982a, b, 1983; Barratt & Campbell 1982;
Barratt & Johnstone 1984; Barratt & Lauren 1984). However, it was Brian Patrick,
a well-known lepidopterist, who really laid the foundation for our current
knowledge of tussock grassland insect biodiversity and ecology, by instigating
a series of collecting trips with colleagues to tussock grassland sites throughout
Otago and Southland, which resulted in a series of reports and publications
(Patrick et al. 1984, 1985a, b, 1986, 1993a, b, 1987; Barratt & Patrick 1987;
Patrick & Barratt 1988, 1989; Patrick 1991, 1994; Dickinson et al. 1998).
Since then, there have been a number of students at the university of Otago,
Dunedin, under the guidance of Prof. Katherine Dickinson, who have focussed
their ecological studies on tussock grassland, some of whom have used the sites
that are the topic of this report (Derraik et al. 2001, 2002, 2003; Murray 2001;
Goodman 2002; Murray et al. 2003, 2006; Dixon 2004; Rate 2005; Scott 2007).
Recently, a student at Lincoln university, Christchurch, has initiated a PhD study
of spiders at the Deep Stream site.
Since we still know so little about the composition of tussock grassland
invertebrate communities, we use Coleoptera as a surrogate group in this
report. Coleoptera are a suitable group for this because they are speciose, they
include representatives of all trophic groups and they are reasonably well known
taxonomically (Hutcheson et al. 1999). Furthermore, Bulan & Barrett (1971),
working in cereal plots in Ohio, uSA, found that the responses of Coleoptera to
fire were representative of the rest of the arthropod community, and reported
that changes in biomass and species diversity were good measures for evaluating
the impact of fire.

9Science for Conservation 291
1 . 2 O B J e C T I v e S
The objective of the project was to provide information to assist in the future
management of natural grassland ecosystems. This included information on:
The short- to medium-term (3 months up to 4 years) impacts of burning on •
the density of tussock grassland invertebrates
The short- to medium-term impacts of burning on Coleoptera species density, •
species richness, species diversity and trophic structure
The time frame over which the invertebrate fauna in tussock grassland is able •
to recover to an equilibrium density after burning
The time frame over which the Coleoptera fauna is able to recover to pre-burn •
species densities, species richness and species diversity after burning
The comparative short- to medium-term impact of tussock burning in moist •
spring conditions compared with those in hot, dry summer conditions
The extent to which exotic Coleoptera species have established in native •
tussock grassland and their responses to burning

10 Barratt et al.—Impact of fire on tussock invertebrates
2. Methods
2 . 1 S I T e S
Two sites in the Otago region of the South Island of New Zealand were chosen
for this study: Deep Stream (DS) and Mount Benger (MB) (Fig. 1). These sites
are part of a multi-disciplinary study of fire modelling (Scion study), and the
impacts of tussock burning on plant (Payton & Pearce 2009) and invertebrate
(present study) communities. They were chosen as representatives of higher
(MB) and lower (DS) altitude tussock grassland environments in Otago. They
were selected on the basis of their relatively undisturbed soils (no history of
cultivation) and relatively unmodified vegetation. Both sites had experienced
fires since european settlement, but had not been burned for at least 10 years
before these experimental burns. Site details are given in Table 1.
TABLe 1. A. S ITe AND B. SOIL CHARACTeRISTICS AT DeeP STReAM AND
MOuNT BeNGeR STuDY SITeS.
SOIL CHARACTeRISTIC* DeeP STReAM MOuNT BeNGeR
TuRF TuSSOCK TuRF TuSSOCK
% organic C 7.1 7.9 7.7 7.3
% organic matter 12.2 13.6 13.3 12.6
Total % N 0.38 0.42 0.43 0.47
C:N ratio 19 19 18 16
pH 4.6 4.6 4.6 4.5
Ca (me/100g)† 125 125 125 125
P (μg/g) 8 8 7 8
K (me/100g)† 80 100 60 60
Mg (me/100g)† 45 55 35 40
Na (me/100g)† 15 20 15 15
B
* Sarathchandra et al. (2005). † Milli equivalents per 100 g soil.
ASITe DeeP STReAM MOuNT BeNGeR
CHARACTeRISTIC
Tenure Dunedin City Council water reserve Benger Pastoral Lease
Altitude 640–700 m a.s.l. 1100–1180 m a.s.l.
Map reference 45°44′S 169°54′e 45º58′S 169º26′e
Dominant vegetation* Chionochloa rigida Chionochloa rigida
Gaultheria nana Poa colensoi
Poa pratensis Polytrichum juniperinum
Poa colensoi Agrostis capillaris
Slope and aspect < 10o predominantly N 2 plots flat; 1 plot < 20o S
Mean annual rainfall† 993 mm 1264 mm
Soil type‡ Wehenga silt loam Carrick
Allophanic brown soils Allophanic brown soils
* espie & Barratt (2006).† Payton & Pearce (2009).
‡ Hewitt (1992).

11Science for Conservation 291
2 . 2 T R e A T M e N T S
At each site, nine 1-ha plots were randomly allocated to three replicates of three
treatments: control (unburnt), burned in spring or burned in summer/autumn
(these will be referred to as spring-burnt and summer-burnt plots, respectively).
each plot was marked out into twenty-five 20 × 20 m sub-plots. One of these
sub-plots in each main plot was randomly selected for invertebrate sampling,
excluding the outer sub-plots, which served as a buffer to reduce ‘edge effects’.
For simplicity, the sub-plots designated for invertebrate sampling will henceforth
be called invertebrate plots.
Fire treatments were coordinated, carried out and supervised by DOC staff
according to best practice guidelines. Timing was based on information from the
national Rural Fire Authority network of fire weather stations. Data from these
stations were used to calculate a number of indices using the New Zealand Fire
Weather Index System (van Wagner 1987), which were then used to determine
optimum times for burns. The burn dates, between November 2000 and
April 2006, are shown in Table 2. More details of the indices used in relation to
the fires for this trial are given in a report by Forest Research (NZ Fire Research
2001). The summer burn treatment at MB was delayed until March 2006 because
of restrictions on burning in a prohibited fire season. The data from this treatment
are not included in this report.
���������������
�������������
��������������
����������
���������������
�����������
����
���������
�������������
���
���
���
��
����
��
�����
���
�
������������ ���������
�����
�������������
�����
��������
�������
Figure 1. Map of the study sites at Deep Stream and
Mount Benger (from Payton & Pearce 2009).

12 Barratt et al.—Impact of fire on tussock invertebrates
TReATMeNT/ DATe PLOT
SAMPLe 1 2 3 4 5 6 7 8 9
Deep Stream
Control × × ×
Spring burn 2 Oct 2001 × × ×
Summer burn 7 Mar 2001 × × ×
Samples 3 Apr 1998 × × × × × × × × ×
19 Aug 1998 × × × × × ×
11 Jan 1999 × × × × × × × × ×
14 Sept 1999 × × × × × ×
6 Jan 2000 × × × × × × × × ×
18 Sept 2000 × × × × × ×
12 Jan 2001 × × × × × × × × ×
9 Mar 2001 × × × × × × 24 Sept 2001 × × × × × ×
5 Oct 2001 × × × × × ×
11 Jan 2002 × × × × × × × × × 17 Jan 2003 × × × × × × × × × 6 Jan 2004 × × × × × × × × × 11 Jan 2005 × × × × × × × × ×Mount Benger
Control × × ×
Spring burn 3 Nov 2000 × × ×
Summer burn 31 Mar 2006 × × ×
Samples 15 Apr 1998 × × × × × × × × ×
26 May 1998 × × × × × × × × ×
13 Jan 1999 × × × × × × × × ×
20 Sept 1999 × × × × × ×
7 Jan 2000 × × × × × × × × ×
20 Sept 2000 × × × × × ×
10 Nov 2000 × × × × × × 15 Jan 2001 × × × × × × × × × 14 Jan 2002 × × × × × × × × × 8 Jan 2003 × × × × × × × × × 16 Jan 2004 × × × × × × × × × Jan 2005 × × × × × × × × × Apr 2006 × × × × × ×
TABLe 2. TReATMeNT AND SAMPLING DATeS AT DeeP STReAM AND MOuNT BeNGeR.
× = pre-burn sample; × = post-burn sample.

13Science for Conservation 291
2 . 3 I N v e R T e B R A T e S A M P L I N G
Invertebrate sampling dates for each site are shown in Table 2. Not all invertebrate
plots were sampled on each sampling date; for example, where a spring burn
had been carried out, only the control and spring-burnt plots were sampled, and
not the plots to be burned in summer. Invertebrates were sampled quantitatively
using a 320 × 320 mm quadrat (0.1 m2) as a guide and cutting turves with a spade to
a depth of approximately 50 mm. The invertebrates extracted from these samples
(see below) provided a measure of density (number/m2). For each sample date
(Table 2), twenty 0.1-m2 inter-tussock (‘turf’) samples were taken by throwing
the quadrat and cutting turves in a general pattern of four rows of five turves
from within the invertebrate plots. In addition, in each invertebrate plot, nine
samples (three rows of three) were taken as above, but which included a tussock
(Chionochloa rigida) plant (‘tussock samples’). Thus, on a date when all plots
were sampled, a total of 180 turf samples and 81 tussock samples were taken
from each site. Care was taken to avoid resampling areas that had been sampled
previously.
All samples were individually bagged, transported to AgResearch Invermay, and
stored at 4°C for a maximum of 3 weeks before processing (Bremner 1988).
2 . 4 I N v e R T e B R A T e e x T R A C T I O N A N D P R O C e S S I N G
In the laboratory, invertebrates were extracted from each turf sample over a
7-day period using modified Tullgren funnel heat extractors (Crook et al. 2004).
Sample extraction was arranged to avoid differential storage of treatments and
plots. After extraction from turves, the invertebrates were stored in 70% ethanol
at 4°C until sorting.
Samples were washed through fine muslin, which retained all invertebrates
but allowed fine silt to pass though. The ‘cleared’ samples were then sorted
and invertebrates counted under a 6.3–40× binocular microscope. A list of
the 55 taxonomic groups into which invertebrates were identified is shown in
Appendix 1, which also gives common names where possible. The only groups
not identified and counted for each sampling date were Collembola and Acari,
although for some dates these have been further subsampled and identified to
family (Barratt et al. 2006); the Collembola and Acari from all other dates have
been retained for future study.
Coleoptera were identified to species, so that further analysis at species level
(species richness/diversity) could be carried out on a representative insect group.
Adult Coleoptera were identified to morphospecies (recognisable taxonomic
units) or, where possible, to species level. Larval Coleoptera were identified
to family, but identification beyond this was rarely possible. In the Coleoptera
species analyses, larval morphospecies are included as separate taxa even though
this is likely to over-estimate species numbers. This is because it is impossible in
most cases to match larvae with adults, and this also allows for the fact that larvae
and adults are sometimes in different trophic groups, occupying different niches
and in general performing different functions in the community.

14 Barratt et al.—Impact of fire on tussock invertebrates
The higher taxonomic groups were allocated to the functional categories of
herbivores, carnivores, fungivores and detritivores. Carrion-feeders (Coleoptera:
Dermestidae) were also present, but at densities too low to be worthwhile
including in the analyses. In some cases where taxa comprised either sub-groups
that varied in feeding characteristics (e.g. Lepidoptera larvae can be herbivores
or detritivores), or where adults and larvae belonged in different groups (e.g.
Lepidoptera again, where adults are often nectar feeders), a judgement was made
on the predominant function for the particular taxon. Trophic group could not
always be allocated with complete confidence, but the literature was consulted
as far as possible to assist (e.g. Klimaszewski & Watt 1997).
A species list for Coleoptera from both sites is shown in Appendix 2, along
with their native/adventive status and allocation to trophic group. The higher
taxonomic classification of Leschen et al. (2003) was used for guidance on
native/exotic status, although this was not available at the species level.
The January 2001 tussock Coleoptera samples for DS were identified for the
spring-burnt plots but not for the control and summer-burnt plots. Regrettably,
this omission was discovered too late to be rectified and limits our scope for data
analysis for that date.
All invertebrate material has been stored fully labelled in 70% ethanol. The material
identified to major groups has been separated and stored in vials. Collembola
(springtails) and Acari have been stored together with the material retained by
the muslin after filtering.
2 . 5 S T A T I S T I C A L A N A L Y S e S
Invertebrate density data and the proportion of individuals in each trophic group
were analysed for each site using restricted maximum likelihood (ReML, which
is a method for fitting linear mixed models producing unbiased estimates of
variance) to model the effect of treatments and dates and their interactions on
the loge counts of number of individuals (Payne et al. 2006).
For the more detailed analyses of coleopteran species density data, a similarity
matrix for the nine plots from DS and six plots (three replicates of control and
spring-burnt plots) from MB was calculated using a euclidean metric (which was
considered appropriate since distance measures are on a continuous rather than
a discontinuous scale). From this, a distance matrix (using distances between
the individual plot data points) was obtained as (2(1 – similarity))0.5. This was
used for non-metric multidimensional scaling (MDS) using two dimensions
(Payne et al. 2006) for Coleoptera species density data to obtain a visual
assessment of the degree of similarity between the sites, and the treatment plots
within the sites.
Coleopteran species richness (number of species present per plot) was calculated
for the turf and tussock samples for each plot at each site on each date. Restricted
maximum likelihood was used to model the effect of site, treatment and date and
their interactions on the loge species richness counts (Payne et al. 2006).

15Science for Conservation 291
Coleopteran species diversity was examined by calculating Shannon-Wiener
indices of diversity (H) for each plot at each site on each date. This index is
probably the most commonly used measure of biodiversity, and takes into
account the number of species and the number of individuals of each species
in the sample. Restricted maximum likelihood was used to model the effect of
site, treatment and date and their interactions on the indices (Payne et al. 2006).
Changes in coleopteran species diversity following burning treatments were also
investigated using k-dominance plots. These plots were used in addition to the
Shannon-Wiener index because they give a good visual appreciation of the data
showing all data points and the shape of the curve provides an indication of
dominance (steep plots) or evenness (shallow curves) of species assemblages.
Log10 density was ranked for Coleoptera species and plotted against cumulative
percentage density. This produced curves in which the most diverse samples
appear on the lower part of the plot. The pre-burn and post-burn data were
compared for the same plots for DS and MB spring-burnt turf plots and for DS
summer-burnt turf plots. Comparisons were not possible for DS summer-burnt
tussock plots, as the pre-burn data were not available. There are no pre-burn and
post-burn comparisons for the MB summer-burnt plots because of the late date
(31 March 2006) of the MB summer burn.
The percentage of Coleoptera in each of five trophic groups and the percentage of
exotic Coleoptera species were calculated for each plot at each site on each date.
Restricted maximum likelihood was used to model the effect of site, treatment
and date and their interactions.

16 Barratt et al.—Impact of fire on tussock invertebrates
3. Results
Between April 1998 and April 2006, a total of 6177 0.1-m2 samples were
taken from the nine 1-ha treatment plots at DS and MB. Approximately
1.26 million invertebrates were extracted, identified and counted from the
samples collected.
Two burn treatments were successfully undertaken on treatment plots at DS
in March (summer burn) and October (spring burn) 2001. At MB, the spring
burning treatment was carried out in November 2000. However, as noted above,
it was not possible to conduct the summer burn at MB until March 2006.
3 . 1 D e e P S T R e A M v e R S u S M O u N T B e N G e R I N v e R T e B R A T e C O M M u N I T I e S
At DS, the mean density of all invertebrates in control plots over the study period
was 4018 individuals/m2 in turf samples and 3059 individuals/m2 in tussock
samples. The equivalent mean values at MB were 2309 individuals/m2 and
2644 individuals/m2, respectively.
3.1.1 Taxonomic composition
At the higher taxonomic levels (i.e. order and above), the composition of the
communities at the two sites was similar, with the exception of Hymenoptera
(mainly ants), which were present at a higher density at DS than at MB (Fig. 2).
Hymenoptera occurred at a higher density than any other group at DS, with
their mean density in turf samples (averaged across all control plot samples
throughout the study) reaching > 1100 individuals/m2. This was almost 30% of
all the invertebrates present in the DS turf samples. At MB, the hymenopteran
population was ranked at the fifth highest density; the Myriapoda were recorded
at the highest density (348 individuals/m2), although densities here were lower
than at DS (Fig. 2).
At DS, turf and tussock samples contained similar densities of the different
invertebrate groups, with the exception of Hymenoptera, which were present
at a far greater density in the turf than the tussock samples. Myriapoda densities
were higher than other groups in tussock samples at DS. At MB, the greatest
difference between turf and tussock samples was in the density of Hemiptera;
the Pseudococcidae was by far the largest family in this group in terms of number
of individuals, and their density was higher in the tussock samples than in turf
samples.
Notes on a few of the taxa collected and their ecology are given in Appendix 3.

17Science for Conservation 291
3.1.2 Trophic composition
The mean density of each of the four recognised trophic groups was calculated
for each site and vegetation sample type for control plots as an average of all
sample dates. Formicidae (ants) were excluded from this analysis because they
are generalist feeders. For each site and vegetation type, herbivores comprised
30–40% of the total invertebrate density, carnivores 20–25%, detritivores
30–40%, and fungivores about 5% (see section 3.3).
Figure 2. Mean density of invertebrates (no. individuals/
m2) at Order level or above in control plots for all sample
dates shown for turf and tussock samples.
A. Deep Stream; B. Mount Benger. error bars represent
2 SeMs.
0 200 400 600 800 1000 1200
HymenopteraMyriapodaHemipteraCrustaceaArachnida
AnnelidaColeoptera
ProturaThysanoptera
DipteraLepidopteraPsocoptera
Mollusca Orthoptera
PlatyhelminthesDiplura
NeuropteraTrichopteraDermaptera
DS turf DS tussock
Mean density in control plots (no. individuals/m2)
A
0 200 400 600 800 1000 1200
MyriapodaColeopteraCrustaceaHemiptera
HymenopteraArachnida
ThysanopteraAnnelida
DipteraLepidoptera
ProturaDermapteraOrthopteraNeuropteraMollusca
PlatyhelminthesPsocoptera
DipluraTrichoptera
MB turfMB tussock
B

18 Barratt et al.—Impact of fire on tussock invertebrates
3 . 2 e F F e C T O F B u R N I N G T R e A T M e N T S O N I N v e R T e B R A T e D e N S I T Y
The effect of the spring and summer tussock fires on total invertebrate density and
on Coleoptera density is shown in Fig. 3 (DS) and Fig. 5 (MB) in the sections that
follow. effects on other taxa that were present at high densities and are discussed
in the sections below can be found in Appendices 4 and 5. The probabilities
calculated for the restricted maximum likelihood model for treatment effects
(Chi P) are shown in Table 3, and comments on significant differences for
individual dates are provided where they occurred. Data for Platyhelminthes,
Neuroptera, Mollusca, Trichoptera and Dermaptera are not shown in Table 3
because in most cases densities were too low (< 1/m2) for reliable analysis in the
CLASS ORDeR DeeP STReAM MOuNT BeNGeR TReATMeNT DIFFeReNCeS
TuRF TuSSOCK TuRF TuSSOCK FOR INDIvIDuAL DATeS
Platyhelminthes 0.385 0.411 0.231 0.832
Annelida Oligochaeta < 0.001 0.003 0.177 0.217
Mollusca 0.251 0.555 0.018 0.620
Arachnida Total < 0.001 0.01 0.002 0.074
Arachnida Araneae < 0.001 0.055 0.012 0.143
Arachnida Opiliones < 0.001 0.001 < 0.001 < 0.001
Crustacea Total < 0.001 < 0.001 < 0.001 0.009
Crustacea Amphipoda < 0.001 < 0.001 < 0.001 0.004
Crustacea Isopoda < 0.001 < 0.001 0.426 0.803
Myriapoda Total < 0.001 0.011 < 0.001 0.934
Myriapoda Chilopoda < 0.001 0.022 0.046 0.239
Myriapoda Diplopoda 0.028 0.418 < 0.001 < 0.001
Myriapoda Symphyla < 0.001 0.022 0.019 0.465
Insecta Diplura id id id id
Insecta Protura 0.062 0.745 0.537 0.902
Insecta Orthoptera (total) 0.051 < 0.001 0.169 0.001
Insecta Dermaptera id id < 0.001 0.721
Insecta Psocoptera < 0.001 0.087 – –
Insecta Hemiptera (total) 0.007 0.044 0.208 0.279 MB turf post-burn < pre-burn
Insecta Hemiptera 0.002 0.508 0.027 0.174 DS tussock spring and summer
(Pseudococcidae) post-burn < pre-burn
Insecta Hymenoptera < 0.001 0.409 < 0.001 0.135
Insecta Lepidoptera 0.734 0.05 < 0.001 0.012 DS turf spring and summer
post-burn < pre-burn
Insecta Neuroptera id id id id
Insecta Trichoptera id id id id
Insecta Coleoptera (total) < 0.001 0.064 < 0.001 0.677 DS tussock spring and summer
post-burn < pre-burn
Insecta Diptera 0.467 0.400 0.032 0.062 DS turf spring and summer
post-burn < pre-burn
Insecta Thysanoptera < 0.001 < 0.001 0.029 0.072
Total invertebrates 0.002 0.175 < 0.001 0.244 DS tussock spring and summer
post-burn < pre-burn
TABLe 3. PROBABILITIeS (CHI P ) FOR TReATMeNT eFFeCTS FOR DeeP STReAM (DS) AND MOuNT BeNGeR (MB)
TuRF AND TuSSOCK SAMPLeS FOR MAIN INveRTeBRATe TAxA.
Where main effects were not significant, differences for individual dates are shown. ‘id’ = insufficient data for analyses.

19Science for Conservation 291
study area in both turf and tussock samples. Table 4, which is presented at the
end of this section, summarises the findings for each invertebrate group reported
below.
3.2.1 Deep Stream
Total invertebrate density in control plots remained quite consistent throughout
the sampling period for both turf and tussock samples (Fig. 3A & B). The immediate
effect of the spring and summer burns in 2001 was to reduce the number of
invertebrates to about 8% and 5%, respectively, of pre-burn densities in turf samples
(Fig. 3A), and to about 12% and 18% of pre-burn densities in tussock samples
(Fig. 3B). The treatment effects were significant for turf samples (Table 3).
Coleoptera densities were less variable between replicate plots than many other
taxa, and remained quite consistent in control plots throughout the study period
in both turf and tussock samples (Fig. 3C & D). There were significant reductions
in density after both burn treatments in turf samples, but not in tussock samples
(Table 3). Recovery was evident for the family as a whole within 1 year after the
burn.
Annelid densities in control plots varied considerably between dates, but the
treatment effects were significant for both turf and tussock samples (Table 3).
In both treatments, there was some recovery of annelid numbers during the year
following treatment, but they then declined substantially in January 2003. By
2005, the population had recovered to levels similar to the control plots.
Figure 3. Mean density (no. individuals/m2) of A. total invertebrates in turf; B. total invertebrates in tussock; C. Coleoptera in turf; and D. Coleoptera in tussock at Deep Stream in control, spring-burnt (SprB) and summer-burnt (SumB) plots. Density is expressed as loge mean density throughout the study period. error bars represent 2 SeMs. Arrows indicate summer (black arrow) and spring (grey arrow) burn dates.
0123456789
1011
Jan-
99A
pr-9
9Ju
l-99
Oct
-99
Jan-
00A
pr-0
0Ju
l-00
Oct
-00
Jan-
01A
pr-0
1Ju
l-01
Oct
-01
Jan-
02A
pr-0
2Ju
l-02
Oct
-02
Jan-
03A
pr-0
3Ju
l-03
Oct
-03
Jan-
04A
pr-0
4Ju
l-04
Oct
-04
Jan-
05
Total invertebrates, tussock samples
0123456789
10
Jan-
99Ap
r-99
Jul-9
9O
ct-9
9Ja
n-00
Apr-0
0Ju
l-00
Oct
-00
Jan-
01Ap
r-01
Jul-0
1O
ct-0
1Ja
n-02
Apr-0
2Ju
l-02
Oct
-02
Jan-
03Ap
r-03
Jul-0
3O
ct-0
3Ja
n-04
Apr-0
4Ju
l-04
Oct
-04
Jan-
05
Coleoptera, tussock samples
0123456789
10
Jan-
99A
pr-9
9Ju
l-99
Oct
-99
Jan-
00A
pr-0
0Ju
l-00
Oct
-00
Jan-
01A
pr-0
1Ju
l-01
Oct
-01
Jan-
02A
pr-0
2Ju
l-02
Oct
-02
Jan-
03A
pr-0
3Ju
l-03
Oct
-03
Jan-
04A
pr-0
4Ju
l-04
Oct
-04
Jan-
05
Coleoptera, turf samples
Loge
mea
n de
nsity
0123456789
1011
Jan-
99A
pr-9
9Ju
l-99
Oct
-99
Jan-
00A
pr-0
0Ju
l-00
Oct
-00
Jan-
01A
pr-0
1Ju
l-01
Oct
-01
Jan-
02A
pr-0
2Ju
l-02
Oct
-02
Jan-
03A
pr-0
3Ju
l-03
Oct
-03
Jan-
04A
pr-0
4Ju
l-04
Oct
-04
Jan-
05
ControlSprBSumB
Total invertebrates, turf samples
Loge
mea
n de
nsity
B
C D
A

20 Barratt et al.—Impact of fire on tussock invertebrates
Arachnid densities were reduced significantly in both turf and tussock samples
(Table 3). Burn treatments reduced density in turf samples for Araneae, and in
turf and tussock samples for Opiliones. Recovery of the Araneae appeared to
be more rapid than for the Opiliones. Opiliones densities became very low in
January 2003, but showed signs of recovery in the following years.
Crustacea were represented mainly by Amphipoda and Isopoda. Amphipoda
densities were dramatically reduced by the burning treatments in both turf and
tussock samples (Table 3). In the spring-burnt plots, there was no evidence
of recovery by the 2005 sample date. Control plot densities remained quite
consistent over the sampling period. Isopoda were also significantly reduced
in density by the burning treatments in turf and tussock samples and, like the
Amphipoda, the spring-burnt plot densities remained low to 2005.
Myriapoda were represented by Chilopoda, Diplopoda and Symphyla. Overall,
Myriapoda density was reduced significantly in turf and tussock samples at both
sites (Table 3), but this reduction was observed mainly during the 2–3 years
after the burns. Chilopoda were significantly reduced in density in both turf
and tussock samples for all treatments when sampled in 2003 and 2004, but
recovery was evident by 2005. Diplopoda densities were very variable between
the replicate plots, but there was a significant reduction in density in turf samples
immediately post-burn. Symphyla densities declined in turf samples in the
2–3 years post-burn.
Orthoptera were present at low density at DS, although higher densities were
observed in the tussock samples than in the turf samples. Densities in turf samples
were very variable, but in tussock samples the densities after the spring burn
remained very low compared with control plots and pre-burn densities.
Following burning, densities of Psocoptera (detritivores that did not occur at
MB) were significantly reduced in the turf samples (Table 3), where their density
was initially higher than in tussock. In both turf and tussock samples, densities
post-burn remained very low.
Hemiptera densities were dominated by Pseudococcidae. Numbers of individuals
in 0.1-m2 samples ranged from 0 to over 1000, which suggested that these are
very aggregated in the field. A significant reduction was found only in post-burn
turf samples (Table 3). Mean density was very variable even in control plots,
but both spring and summer burns reduced densities to low levels. There was
evidence of recovery by January 2003.
Hymenoptera densities were dominated by Formicidae. Densities were very
high and consistent in control turf samples for all sample dates, and there was a
significant treatment effect (Table 3). Hymenoptera density was lower and more
variable in tussock samples, and there were no significant treatment effects.
Lepidoptera, present mainly as larvae in samples, were significantly reduced in
density in tussock samples post-burn (Table 3), but populations had recovered
by 2003, and appeared to exceed densities in the control plots by 2004. This
increase was not significant, but occurred in both turf and tussock samples.
Diptera, present mainly as larvae in the samples, showed no significant treatment
effects (Table 3).

21Science for Conservation 291
Thysanoptera density was dramatically reduced after spring and summer
burns in both turf and tussock samples. However, for both vegetation types,
the densities in the summer-burnt plots recovered to densities that were
substantially higher than those in the control plots. For example, in the summer-
burnt plots, pre-burn density (January 2001) in turf samples was approximately
70 individuals/m2, which was reduced to less than 1 individual/m2 immediately
post-burn, but reached about 5000 individuals/m2 by January 2003. A similar
pattern was observed in tussock samples.
Spring versus summer burn at Deep Stream
The mean density of invertebrates per plot for each January sampling date is
shown in Fig. 4. Densities in control plots were consistent from year to year until
2005, when they increased significantly, largely as a result of greatly increased
densities of Protura.
For the 3 years pre-burn (1999–2001), there was no significant difference in
invertebrate density between plots, although the variability in 2001 was higher
than previous years. In January 2002, 3 months after the spring burn and
10 months after the summer burn, the density of invertebrates in both treatments
was significantly reduced compared with the control plots. However, compared
with means from the same plots in the previous year, invertebrate densities
were significantly reduced for only the spring-burnt plots, as the large variability
between the summer-burnt plots in 2001 obscured any differences.
By 2003, invertebrate densities in the spring-burnt plots had returned to levels
similar to those before treatment, and those in the summer-burnt plots had
increased significantly. In 2004, invertebrate densities in both burnt plots
significantly exceeded those in control plots, and this was still the case in
2005. This reflects the increased densities of some of the herbivorous taxa (see
section 3.3).
Figure 4. Mean (± SeM) total density (no. individuals/m2) per plot of invertebrates in
each treatment from 1999 to 2005 at Deep Stream. Arrow
indicates sampling dates between which the burning
treatments occurred. SprB = spring-burnt plots;
SumB = summer-burnt plots.
0
5000
10000
15000
20000
25000
30000
35000
1999 2000 2001 2002 2003 2004 2005
Year
CSprBSumB
Mea
n de
nsity
(no.
/m2 )
per p
lot
Control
SprB
SumB

22 Barratt et al.—Impact of fire on tussock invertebrates
3.2.2 Mount Benger
As for DS, total invertebrate density in control plots at MB remained quite
consistent throughout the sampling period for both turf and tussock samples
(Fig. 5A & B). The immediate effect of the spring burn in 2000 was less pronounced
than at DS, although invertebrate density was still significantly reduced by 40%
and 19% of pre-burn densities in 2001 and 2002, respectively.
For total invertebrate density, the generalised linear model showed that there
was a significant interaction between treatment and vegetation type. The density
of invertebrates (c. 2000 individuals/m2 before the spring burn) was reduced to
about 400 individuals/m2 in January 2002, just over 1 year after the spring burn
(Fig. 5A). No such reduction was observed in the tussock samples (Fig. 5B).
Coleoptera densities were quite consistent between replicate control plots and
between dates throughout the study period (Fig. 5C & D). After the spring burn,
numbers were reduced significantly in turf samples (Fig. 5C), but there were no
significant changes in density in the tussock samples (Fig. 5D).
Annelid density was variable over the study period. There were no significant
effects of the spring fire treatment.
Total Arachnida were significantly reduced only in turf samples in January 2002.
Araneae densities showed a significant treatment effect only in turf samples
(Table 3), but the density of Opiliones was substantially reduced in both turf and
tussock samples (Table 3).
A significant treatment effect was found for total Crustacea in turf and tussock
samples (Table 3). The fauna was dominated by Amphipoda, which were
significantly reduced by the spring burn in both sample types in January 2002;
as at DS, there was no evidence of recovery of the population by the end of the
study. Isopoda at MB were not significantly affected by the burning treatment,
whereas they were at DS.
Total Myriapoda were significantly reduced in density by the spring burn,
particularly Diplopoda, which showed no sign of recovery by the end of the study
in either turf or tussock samples. Symphyla and Chilopoda showed significant
treatment effects in turf samples only (Table 3).
Orthoptera densities were significantly reduced in tussock samples from
immediately post-burn to the end of the study period. As at DS, this reduction
was mainly attributable to Blattidae densities being reduced to almost zero in
tussock samples after the burn.
Hemiptera densities were dominated by Pseudococcidae, as they were at DS.
However, at MB the spring burn reduced densities significantly only in turf

23Science for Conservation 291
Figure 5. Mean density (no. individuals/m2) of A. total invertebrates in turf; B. total invertebrates in tussock; C. Coleoptera in turf; and D. Coleoptera in tussock at Mount Benger in control and spring-burnt (SprB) plots. Density is expressed as loge mean density throughout the study period. error bars represent 2 SeMs. The grey arrow indicates the spring burn date.
0123456789
101112
Jan-
99A
pr-9
9Ju
l-99
Oct
-99
Jan-
00A
pr-0
0Ju
l-00
Oct
-00
Jan-
01A
pr-0
1Ju
l-01
Oct
-01
Jan-
02A
pr-0
2Ju
l-02
Oct
-02
Jan-
03A
pr-0
3Ju
l-03
Oct
-03
Jan-
04
ControlSprB
Total invertebrates, turf samplesLo
ge m
ean
dens
ity
0123456789
101112
Jan-
99A
pr-9
9Ju
l-99
Oct
-99
Jan-
00A
pr-0
0Ju
l-00
Oct
-00
Jan-
01A
pr-0
1Ju
l-01
Oct
-01
Jan-
02A
pr-0
2Ju
l-02
Oct
-02
Jan-
03A
pr-0
3Ju
l-03
Oct
-03
Jan-
04
Total invertebrates, tussock samples
0123456789
10
Jan-
99A
pr-9
9Ju
l-99
Oct
-99
Jan-
00A
pr-0
0Ju
l-00
Oct
-00
Jan-
01A
pr-0
1Ju
l-01
Oct
-01
Jan-
02A
pr-0
2Ju
l-02
Oct
-02
Jan-
03A
pr-0
3Ju
l-03
Oct
-03
Jan-
04
Coleoptera, turf samples
Loge
mea
n de
nsity
0123456789
10
Jan-
99A
pr-9
9Ju
l-99
Oct
-99
Jan-
00A
pr-0
0Ju
l-00
Oct
-00
Jan-
01A
pr-0
1Ju
l-01
Oct
-01
Jan-
02A
pr-0
2Ju
l-02
Oct
-02
Jan-
03A
pr-0
3Ju
l-03
Oct
-03
Jan-
04
Coleoptera, tussock samplesDC
A B
samples. At this site there was also a large post-burn increase in numbers of
Aphididae (not shown) observed in January 2003.
Hymenoptera densities, dominated by Formicidae, were very variable in turf
samples, but there was a significant treatment effect (Table 3). Densities were
less variable in tussock samples, but there was no significant treatment effect.
Lepidoptera densities were significantly reduced in 2001 after the spring fire in
both turf and tussock samples, but populations appeared to have recovered by
January 2003.
Thysanoptera densities were significantly reduced only in turf samples (Table 3),
but recovered rapidly. In both sample types, densities in January 2003 exceeded
pre-burn and control densities, although variability between plots was high.

24 Barratt et al.—Impact of fire on tussock invertebrates
ReSPONSe TAxA WHeRe APPLICABLe
No significant treatment effect Platyhelminthes Both sites and sample types
Protura Both sites and sample types
Coleoptera Both sites tussock
Pseudococcidae Both sites tussock
Hymenoptera Both sites tussock
Isopoda Both sites tussock
Orthoptera Both sites turf
Diptera DS both sample types
Mollusca DS both sample types
Araneae MB both sample types
Annelida MB both sample types
Density reduced but recovered Pseudococcidae Both sites and sample types
rapidly Coleoptera Both sites turf
Diptera DS
Density reduced but recovered Annelida DS turf
by Jan 2005 Isopoda DS turf
Chilopoda DS turf
Araneae DS turf
Symphyla DS turf
Lepidoptera MB
Density reduced and little if Amphipoda Both sites and sample types
any recovery by Jan 2005 Psocoptera DS turf
Hymenoptera DS turf
Orthoptera (Blattidae) DS spring burn and MB tussock
Diplopoda MB
Density reduced but then Thysanoptera DS in particular
‘rebounded’ Lepidoptera DS summer burn
Differences between sites Annelida Greater impact DS turf than MB turf
Myriopoda Greater impact DS turf than MB turf
Hemiptera Faster recovery MB than DS both
sample types
Coleoptera Greater impact DS than MB both
sample types
Differences between vegetation Myriopoda Main effects in turf
sample types Orthoptera (Blattidae) Main effects in tussock
Hymenoptera Main effects in turf
TABLe 4. SuMMARY OF ReSPONSeS OF INveRTeBRATe TAxA TO BuRNING
TReATMeNTS AT DeeP STReAM (DS) AND MOuNT BeNGeR (MB).
3.2.3 Summary
The responses of invertebrate taxa found at Deep Stream and Mount Benger to
burning treatments are summarised in Table 4.

25Science for Conservation 291
3 . 3 e F F e C T O F B u R N I N G T R e A T M e N T S O N C O M M u N I T Y T R O P H I C S T R u C T u R e
Short-term (2–3 months post-burn) and medium-term (36 months post-burn)
changes in the trophic group composition of the invertebrate fauna are discussed
below. The trophic structure of the invertebrate communities was similar for
the two sites and vegetation types pre-burn (Fig. 6A), with herbivores and
detritivores present at similar densities and comprising similar proportions of the
invertebrate fauna. Carnivores were slightly less well represented and fungivores
comprised a small proportion of the invertebrate fauna. However, as mentioned
previously, Collembola, which are primarily fungivores, have not been included
in this study.
3.3.1 2–3 months post-burn
Figure 6B suggests that 2–3 months post-burn, densities were reduced for all groups
and the proportional structure of the community had changed, particularly at DS.
At DS, the data indicate that the proportion of herbivores in the community
was reduced to about 10% of the total, whereas the proportion of detritivores
increased to 70% (turf) and 55% (tussock). A comparison of Fig. 6A and 6B suggests
that these proportional changes were attributable mainly to the substantial
decline in the density of herbivores (mainly Pseudococcidae, Curculionidae and
Thysanoptera) and a lesser decline in detritivore densities after burning.
At MB, the community trophic structure was little changed following burning,
except that fungivores were almost totally removed (Fig. 6B). This may have
mainly been due to reductions in the density of Protura in the spring-burnt
plots. unlike at DS, by the January following the spring burn, the density of
Pseudococcidae in the tussock plots at MB had already recovered almost to
pre-burn densities.
3.3.2 3 years post-burn
After 3 years, the picture in the burnt plots was even more different from the long-
term averages of the control plots, with much greater densities of herbivores,
largely resulting from the huge ‘rebound’ response of Pseudococcidae and other
Hemiptera, and Thysanoptera (Fig. 6C). At DS, the increase in the proportion
of carnivores in turf samples was a result mainly of the recovery of Araneae
(Appendix 4). At MB, the reappearance of fungivores was represented mainly by
Protura and Pauropoda (data not presented).
Figure 7 shows the mean densities of invertebrates in the major trophic groups
(excluding Hymenoptera) each year for the years preceding and following the
spring-burn treatments at DS and MB (Fig. 7A & C); and for the years preceding
and following the summer-burn treatment at DS (Fig. 7B). The figure shows that
the density of some of the functional groups was quite variable between years
before treatments were applied. For example, there were higher densities of
detritivores (mainly Annelida, Amphipoda and Diptera larvae) in turf (but not
tussock) at MB in January 2000 compared with 1999; conversely, there was a
greater density of herbivores in tussock at MB in January 1999 compared with
2000, almost entirely due to a greater density of Pseudococcidae. Generally
however, apart from these exceptions, the pre-treatment densities of each of the
trophic groups were quite similar.

26 Barratt et al.—Impact of fire on tussock invertebrates
Figure 6. Mean density (no. individuals/m2) and proportion (%) of invertebrate fauna in each trophic group A. in control plots; B. 2–3 months post-burn; and C. 36 months post-burn.
0%
10%
20%
30%
40%
50%
60%
70%
80%
90%
100%
DS turf DS tussock MB turf MB tussock
Pro
porti
on
0
1000
2000
3000
4000
5000
6000
7000
8000
9000
10000
DS turf DS tussock MB turf MB tussock
detritivoresfungivorescarnivoresherbivores
Den
sity
(no.
/m2)
Detritivores
Fungivores
Carnivores
Herbivores
A Control
0
1000
2000
3000
4000
5000
6000
7000
8000
9000
10000
DS turf DStussock
MB turf MBtussock
Den
sity
(no.
/m2 )
0%
10%
20%
30%
40%
50%
60%
70%
80%
90%
100%
DS turf DS tussock MB turf MB tussock
Prop
ortio
n
B 2–3 months post-burn
0
1000
2000
3000
4000
5000
6000
7000
8000
9000
10000
DS turf DS tussock MB turf MB tussock
Den
sity
(no.
/m2 )
0%
10%
20%
30%
40%
50%
60%
70%
80%
90%
100%
DS turf DS tussock MB turf MB tussock
Pro
porti
on
C 36 months post-burn

27Science for Conservation 291
After treatment, herbivores were most severely and immediately reduced in
abundance at both sites and vegetation types, but particularly at DS for both spring
and summer-burns. However, in the subsequent years, the abundance of herbivores
increased and in most cases exceeded pre-burn densities, attributable mainly to
Hemiptera (especially Pseudococcidae) and Thysanoptera, as discussed above.
The post-burn response in detritivore density differed between the two sites,
particularly for the fourth year. At DS, detritivore densities in turf and tussock
samples exceeded pre-burn levels by 2005. In the spring-burnt turf samples,
detritivores comprised mainly Diptera larvae, Annelida and Symphyla. However,
in the summer-burnt tussock samples, it comprised mainly Annelida and
Diplopoda (data not presented). Detritivores exhibited a delayed response to
burning, suggesting that environmental change rather than the direct effects of
the fire precipitated their decline; e.g. it may have been caused by a reduction
in litter, which provides a food source, habitat and insulation from temperature
and humidity changes.
The density of fungivores at MB appeared to increase progressively following
the spring fire (Fig. 7C). This response also occurred at DS, but less significantly
(Fig. 7A). As noted above, this was attributable mainly to Pauropoda and Protura
(data not presented).
Figure 7. Mean density of invertebrates (excluding
Hymenoptera) in each trophic group shown for
consecutive January samples. A. Deep Stream—spring
burn (1999–2005); B. Deep Stream—summer
burn (1999–2005); and C. Mount Benger—spring
burn (1999–2004). Open bars are
pre-burn (all plots) and grey bars are post-burn in
consecutive January samples.
0100020003000400050006000700080009000
10000
Turf
carn
ivor
e
Tuss
ock
Turf
detri
tivor
e
Tuss
ock
Turf
fung
ivor
e
Tuss
ock
Turf
herb
ivor
e
Tuss
ock
Jan-99 Jan-00 Jan-01 Jan-02 Jan-03 Jan-04 Jan-05
Mea
n de
nsity
(no.
/m2 )
0100020003000400050006000700080009000
10000
Turf
carn
ivor
e
Tuss
ock
Turf
detri
tivor
e
Tuss
ock
Turf
fung
ivor
e
Tuss
ock
Turf
herb
ivor
e
Tuss
ock
Mea
n de
nsity
(no.
/m2 )
0
1000
2000
3000
4000
Turf
carn
ivor
e
Tuss
ock
Turf
detri
tivor
e
Tuss
ock
Turf
fung
ivor
e
Tuss
ock
Turf
herb
ivor
e
Tuss
ock
Mea
n de
nsity
(no.
/m2 )
B
C
A
carn
ivor
e
detri
tivor
e
fung
ivor
e
herb
ivor
e

28 Barratt et al.—Impact of fire on tussock invertebrates
3 . 4 C O L e O P T e R A : A D e T A I L e D S T u D Y
3.4.1 Density, species composition and effect of burn treatments
The mean density (no. individuals/m2) of Coleoptera in control plots is
shown in Fig. 2. At DS, the mean density for control plots for all sample
dates was 221 ± 23 individuals/m2 in turf samples and 203 ± 34 individuals/m2
in tussock samples. At MB, the equivalent densities were 325 ± 32 and
344 ± 30 individuals/m2.
The taxonomic composition of the Coleoptera communities at DS and MB is
summarised in Appendix 6. Overall, 24 families of Coleoptera were represented
at DS and 28 familes at MB, and in total 111 genera and 202 species were found,
excluding larvae. The number of Coleoptera species in each genus and family
was similar for both sites, although species richness (excluding larvae) was a
little higher at DS (142 species) compared with MB (135 species). If larvae are
included, 270 taxa in total were identified. However, since some larvae would
also be represented by adults this is certainly an overestimate.
The overlap of species between the two sites was about 40%. exactly 33% of all
species were found only at DS, and slightly fewer (25–29%) were found only at
MB (Table 5). To assess the similarity of Coleoptera communities between sites
and between plots within sites, non-metric MDS ordinations were carried out
for coleopteran data pre-burn and 2–3 month post-burn (Fig. 8A & B). Both MDS
ordinations show complete faunal separation between the two sites, suggesting
that the coleopteran species abundance patterns were quite different at DS and
MB. For the pre-burn data, the replicate plots within sites varied from close
faunal similarity (DS control plots) to wide variability (MB spring-burnt plots)
(Fig. 8A). For the post-burn data, there is very close faunal similarity between
the DS spring- and summer-burnt plots, and the MB spring-burnt plots were also
quite closely clustered in comparison with the control plots (Fig. 8B). The stress
values (a measure of ‘goodness of fit’) for the coordinates for both pre- and
post-burn MDS ordinations indicated a high level of confidence; it is generally
SITe SAMPLe NuMBeR OF SPeCIeS/MORPHOSPeCIeS (%)
INCLuDING LARvAe exCLuDING LARvAe
DS only Turf only 42 (15.5) 32 (15.8)
Tussock only 22 (8.2) 17 (8.4)
Total 89 (33.0) 67 (33.2)
MB only Turf only 41 (15.2) 34 (16.8)
Tussock only 17 (6.3) 13 (6.4)
Total 68 (25.2) 59 (29.2)
Both DS and MB Turf only 6 (2.2) 5 (2.5)
Tussock only 1 (0.4) 1 (0.5)
Total 113 (41.9) 76 (37.6)
Total DS 202 (74.8) 142 (70.3)
Total MB 181 (67.0) 135 (66.8)
Total DS and MB 270 202
TABLe 5. SuMMARY OF NuMBeR (AND %) OF COLeOPTeRA SPeCIeS AT
DeeP STReAM (DS) AND MOuNT BeNGeR (MB) IN DIFFeReNT SAMPLe TYPeS.

29Science for Conservation 291
accepted that values below 0.1 suggest an excellent fit, whereas values above
0.15 are unacceptable.
Non-metric MDS ordinations using species presence-absence data also gave
complete separation of points for the two sites (Fig. 9). For the pre-burn data,
there was a similar degree of spread across plots designated for the treatments at
DS, but more clustering of plots at MB (Fig. 9A). Post-burn, the DS plots clustered
more closely, especially the spring-burnt plots, suggesting that Coleoptera species
composition was more similar after treatment than before (Fig. 9B).
Figure 8. Multidimensional scaling (MDS) ordinations for Coleoptera species density for each of the replicate field plots at each site. A. Pre-burn samples and B. 2–3 months post-burn samples for Deep Stream (DS; circles) and Mount Benger (MB; squares), showing control, spring-burnt (SprB) and summer-burnt (SumB) plots. The closer the points, the more similar are the densities of each species.
-2
-1.5
-1
-0.5
0
0.5
1
1.5
2
-2 -1.5 -1 -0.5 0 0.5 1 1.5 2
DS Control
MB Control
Stress 0.1001
DS SprBDS SumB
MB SprB
Pre-burnDS ControlDS SprBDS SumBMB ControlMB SprB
A
-2
-1.5
-1
-0.5
0
0.5
1
1.5
2
-2 -1.5 -1 -0.5 0 0.5 1 1.5 2
Stress 0.0763
Post-burnB
Figure 9. Multidimensional scaling (MDS) ordinations for Coleoptera species presence/absence data for each of the replicate field plots at each site. A. Pre-burn samples and B. 2–3 months post-burn samples for Deep Stream (DS; circles) and Mount Benger (MB; squares), showing control, spring-burnt (SprB) and summer-burnt (SumB) plots. The closer the points, the more similar the species composition of each plot.
-0.15
-0.05
0.05
0.15
-1.5 -1 -0.5 0 0.5 1 1.5
Stress 0.0098
Pre-burn
-0.15
-0.1
-0.05
0
0.05
0.1
0.15
-1.5 -1 -0.5 0 0.5 1 1.5
Stress 0.0089
Post-burnBA
-2
-1.5
-1
-0.5
0
0.5
1
1.5
2
-2 -1.5 -1 -0.5 0 0.5 1 1.5 2
DS Control
MB Control
Stress 0.1001
DS SprBDS SumB
MB SprB
Pre-burnDS ControlDS SprBDS SumBMB ControlMB SprB

30 Barratt et al.—Impact of fire on tussock invertebrates
3.4.2 Species richness
Analysis of species richness data (number of species) for total Coleoptera species
(i.e. pooled for all turf plus tussock samples) showed that site and treatment had
significant effects on species richness. Over the study period, species richness
in control plots at DS and MB was significantly different (Wald statistic = 11.69,
df = 1, P < 0.001), with means of 51 species and 71 species, respectively
(back-transformed loge values).
The effect of the burning treatments on species richness is illustrated in Fig. 10,
which shows mean species richness loge-transformed with the back-transformed
means (i.e. no. species/m2) superimposed.
For turf samples at DS, there was no significant difference between the
control and treatment plots prior to treatment in January 2001, with a range of
31–39 species/m2 recorded (Fig. 10A). In January 2002, species richness dropped
significantly by about 50% in spring- and summer-burnt plots to a mean of about
15 and 12 species, respectively, while species richness in control plot species
richness remained at 33 species. By the following year, species richness in spring-
and summer-burnt plots had recovered to 26 and 24 species, respectively, and by
January 2004, no significant differences remained between treatments.
Tussock samples at DS (Fig. 10B) are missing data for the control and summer-
burnt plots in 2001 (see section 2.4). However, estimates of species richness
in control plots were consistent between 2002 and 2003, increasing in 2004.
In the spring-burnt plots, a similar pattern was observed in turf and tussock
samples, with a reduction from pre-burn species richness in 2002, which then
recovered over the following 2 years. The summer-burnt plots followed a very
similar pattern to the spring-burnt plots between 2002 and 2004.
For turf samples at MB, estimates of species richness in January 2000 was about
56 species in control plots and 57 species in plots allocated to be burned in
spring (Fig. 10A). Two months after the spring burn, mean species richness in the
spring-burnt plots was 32 species, and subsequently rose to about 50 species in
2003 and 2004.
Tussock samples at MB followed a similar pattern to turf samples, with an initial
reduction in species richness, followed by recovery by January 2003 (Fig. 10B).

31Science for Conservation 291
3.4.3 Species diversity
Shannon-Wiener indices of coleopteran species diversity were calculated for
each site, sample date, sample type (turf and tussock) and treatment. These data
are shown in Fig. 11. The Shannon-Wiener indices calculated for overall species
diversity in control plots and combining both vegetation types was significantly
higher at MB than DS (H = 3.245 and 2.769, respectively; F = 15.3, df = 11.8,
P < 0.002).
At DS in January 2001 (pre-treatment), there was no significant difference in the
Shannon-Wiener indices between the plots selected for the three treatments as
calculated for turf samples (Fig. 11A). For DS control turf samples, there was
some variability in species diversity from year to year. However, there was a clear
decrease in species diversity in the burnt plots in the January following both the
spring and summer fire treatments (January 2002). There was an indication of
some recovery in the burnt plots in 2003, and there was no significant difference
between the control and burnt plots by 2004.
0
0.5
1
1.5
2
2.5
3
3.5
4
4.5
2001 2002 2003 2004 2000 2001 2003 2004
DS MB
0
10
20
30
40
50
60
70
Control LN SprB LN SumB LNControl mean no. SprB mean no. SumB mean no.
Mea
n sp
ecie
s ric
hnes
s (lo
ge n
o. s
peci
es)
Spe
cies
rich
ness
(mea
n no
. spe
cies
)
Control loge no.Control mean no.
SprB loge no.SprB mean no.
SumB loge no.SumB mean no.
A
0
0.5
1
1.5
2
2.5
3
3.5
4
4.5
2001 2002 2003 2004 2000 2001 2003 2004
DS MB
0
5
10
15
20
25
30
35
40
45
50
Spe
cies
rich
ness
(mea
n no
. spe
cies
)
Mea
n sp
ecie
s ric
hnes
s (lo
ge n
o. s
peci
es)
Deep Stream Mount Benger
B
Figure 10. Coleoptera species richness in A. turf
and B. tussock samples from both sites each year. The
histograms show loge mean number of species ± SeM on the left y-axis. The
superimposed lines show back-transformed mean
numbers of species on the right y-axis. Data for 2000
and 2001 are pre-burn for Mount
Benger and Deep Stream, respectively. The arrows
indicate dates between which the burning treatments were carried out. 2001 data for the
burnt tussock treatments at Deep Stream were
unavailable.

32 Barratt et al.—Impact of fire on tussock invertebrates
The index values for the tussock samples from the control plots at DS were
consistent between 2002 and 2004, whereas values were significantly lower for
the burnt plots in 2002 (Fig. 11B). The Shannon-Wiener indices calculated in
subsequent years indicated recovery of species diversity. This recovery was more
rapid during 2003–2004 in the summer-burnt tussock samples; index values for
the spring-burnt plots remained significantly lower than those of the control
plots in 2004 (F = 15.6, df = 2, 8, P < 0.05), although was not significantly lower
than the pre-burn index.
For the turf samples at MB, the Shannon-Wiener indices were a little higher
(but more variable) than at DS (Fig. 11A). In January 2000, the mean values for
the control and the intended spring-burnt plots were similar, but in 2001 there
was a significant reduction in the Shannon-Wiener index for the spring-burnt
turf samples. However, by 2003 and 2004 no differences remained between
treatments.
The indices for the tussock samples at MB were very similar for both treatments
pre-burn in 2000, but reduced significantly in the burnt plots in 2001 and 2003
(Fig. 11B). By 2004, species diversity has recovered to a similar level to that of
control plots.
Figure 11. Mean (per plot ± SeM) Shannon-Wiener
indices for Coleoptera for both sites and January sampling dates in A. turf and B. tussock samples.
The arrows indicate dates between which the burning
treatments were carried out. 2001 data for the burnt tussock treatments at Deep
Stream were unavailable.
1.5
2
2.5
3
3.5
4
2001 2002 2003 2004 2000 2001 2002 2003 2004
DS MB
Mea
n S
hann
on-W
iene
r ind
ex
B
Deep Stream Mount Benger
1.5
2
2.5
3
3.5
4
2001 2002 2003 2004 2000 2001 2002 2003 2004
DS MB
ControlSprBSumB
Mea
n S
hann
on-W
iene
r ind
ex
A

33Science for Conservation 291
Figure 12. k-dominance curves for Coleoptera at Deep Stream (DS) and Mount Benger (MB) in A. turf and B. tussock samples.
0102030405060708090
100
1 10 100 1000
DS MB
Cum
ulat
ive
abu
ndan
ce (%
)
Log10 species rank
A
0102030405060708090
100
1 10 100 1000Log10 species rank
B
3.4.4 Rank-abundance patterns
The k-dominance curves for DS and MB control plots (averaged across years)
give an indication of the inherent species diversity at the two sites for turf and
tussock (Fig. 12A & B). The lower the curves on the plot, the more diverse are
the species assemblages. The k-dominance curves indicate that species diversity
is generally higher at MB than DS, but this is more pronounced for the turf
Coleoptera community than for tussock. This supports the Shannon-Wiener
index data (section 3.4.3). Curves for each site, date and sample vegetation type
have been plotted in Fig. 13.
For DS spring-burnt plots, the k-dominance curves for turf samples indicate that
the Coleoptera species assemblage was more diverse in the pre-burn samples
taken in 2001 than in any of the post-burn samples (Fig. 13A). For the tussock
samples, the curves are less spread and show a similar pattern to each other in
successive years (Fig. 13B). For the summer burn treatment, the k-dominance
curves for turf samples show a similar pattern to the spring burn data, except that
the pre-burn and 2004 curves are almost superimposed (Fig. 13C), suggesting that
the Coleoptera species assemblage recovered to a greater extent following the
summer burn treatment than following the spring burn treatment. The tussock
data for summer-burnt plots in 2001 were not available, but the 2002 curve
indicates a large reduction in diversity compared with the 2003 and 2004 curves,
which were very similar (Fig. 13D).
For MB spring-burnt plots, the k-dominance curves for turf samples in 2001
(2 months post-burn) is clearly separated out; however, the 2003 and 2004
curves are very close to the pre-burn curve (Fig. 13e). As at DS, the curves for the
tussock samples are less separated between sample dates (Fig. 13F).

34 Barratt et al.—Impact of fire on tussock invertebrates
Figure 13. k-dominance curves for Coleoptera for each sampling date at Deep Stream (DS) and Mount Benger (MB) pre- and post-burn. A. Deep Stream spring-burnt plots, turf samples; B. Deep Stream spring-burnt plots, tussock samples; C. Deep Stream summer-burnt plots, turf samples; D. Deep Stream summer-burnt plots, tussock samples; e. Mount Benger spring-burnt plots, turf samples; and F. Mount Benger spring-burnt plots, tussock samples.
A DS, spring-burnt, turf B DS, spring-burnt, tussock
0102030405060708090
100
1 10 100 1000
DS Jan 01 (pre-SprB) DS Jan 02DS Jan 03DS Jan 04
Cum
ulat
ive
abu
ndan
ce (%
)
0102030405060708090
100
1 10 100 1000
DS Jan 01 (pre-SprB)DS Jan 02DS Jan 03DS Jan 04
C DS, summer-burnt, turf D DS, summer-burnt, tussock
0102030405060708090
100
1 10 100 1000
DS Jan 01 (pre-SumB) DS Jan 02DS Jan 03DS Jan 04
Cum
ulat
ive
abu
ndan
ce (%
)
0102030405060708090
100
1 10 100 1000
DS Jan 02 DS Jan 03DS Jan 04
E MB, spring-burnt, turf F MB, spring-burnt, tussock
0102030405060708090
100
1 10 100 1000
MB Jan 00 (pre-SprB)MB Jan 01MB Jan 03MB Jan 04
Cum
ulat
ive
abu
ndan
ce (%
)
Log10 species rank
0102030405060708090
100
1 10 100 1000
MB Jan 00 (pre-SprB)MB Jan 01MB Jan 03MB Jan 04
Log10 species rank

35Science for Conservation 291
3.4.5 Community trophic structure and response to treatments
The proportion of Coleoptera species and individuals in each trophic group for
both sites, all dates and all treatments is shown in Fig. 14. The most noticeable
difference between these findings and those reported in section 3.3 for the
invertebrate fauna in general is that the Coleoptera were dominated by carnivores
(mainly Staphylinidae), comprising 50% or more of all individuals in most cases.
In contrast, there was a more even distribution of herbivores, carnivores and
detritivores for the total invertebrates, as indicated in Fig. 6A.
The proportion of species in each trophic group appeared to change little
between years and burning treatments, except for the initial (2002) decrease in
the proportion of herbivore species in turf and tussock samples from spring-burnt
plots at DS (Fig. 14). Similarly, there was little difference between treatments in
the proportion of Coleoptera individuals in each trophic group. A restricted
maximum likelihood analysis of Coleoptera individuals from both sites (turf
and tussock treatments combined) showed that control plots had a significantly
lower proportion of carnivores (control = 45%; burnt = 65%; F = 4.87, df = 2, 10,
P = 0.033) and a higher proportion of herbivores (control = 47%, burnt = 27%;
F = 6.92, df = 2, 10, P = 0.013). However, since there was no significant treatment
× date interaction, these differences were likely to have been present pre-burn,
as indicated by Fig. 14.
Figure 14. Percentage of Coleoptera species and individuals in each trophic group for each treatment and January sampling date in A. turf and B. tussock samples. The arrows indicate dates between which the burning treatments were carried out. SprB = spring-burnt plots; SumB = summer-burnt plots.
0%
20%
40%
60%
80%
100%
2001
2002
2003
2004
2001
2002
2003
2004
2001
2002
2003
2004
2000
2001
2003
2004
2000
2001
2003
2004
Control SprB SumB Control SprB
DS MB
Col
eopt
era
spec
ies
(%)
0%
20%
40%
60%
80%
100%
2001
2002
2003
2004
2001
2002
2003
2004
2001
2002
2003
2004
2000
2001
2003
2004
2000
2001
2003
2004
Control SprB SumB Control SprB
DS MB
herbivores carnivores fungivores detritivores
Col
eopt
era
indi
vidu
als
(%)
Herbivores Carnivores Fungivores Detritivores
Deep StreamDeep Stream Mount BengerMount Benger
0%
20%
40%
60%
80%
100%
2001
2002
2003
2004
2001
2002
2003
2004
2001
2002
2003
2004
2000
2001
2003
2004
2000
2001
2003
2004
Control SprB SumB Control SprB
DS MB
Col
eopt
era
spec
ies
(%)
0%
20%
40%
60%
80%
100%
2001
2002
2003
2004
2001
2002
2003
2004
2001
2002
2003
2004
2000
2001
2003
2004
2000
2001
2003
2004
Control SprB SumB Control SprB
DS MB
Col
eopt
era
indi
vidu
als
(%)
Deep StreamDeep Stream Mount BengerMount Benger
A Turf
0%
20%
40%
60%
80%
100%
2001Control
DS
2001SprB
2001SumB
2004 2004
Col
eopt
era
spec
ies
(%)
0%
20%
40%
60%
80%
100%
2001Control
DS
2001SprB
2001SumB
2004 2004
Col
eopt
era
indi
vidu
als
(%)
0%
20%
40%
60%
80%
100%
2001Control
DS
2004 2003 2002 2003 2001
Col
eopt
era
spec
ies
(%)
0%
20%
40%
60%
80%
100%
2001
2003
2001
2003
2001
2003
2001
2004
2001
2004
herbivores carnivores fungivores detritivores
Coleo
pter
a ind
ividu
als (%
)
0%
20%
40%
60%
80%
100%
2001
2003
2001
2003
2001
2003
2001
2004
2001
2004
herbivores carnivores fungivores detritivores
Cole
opte
ra in
div
iduals
(%
)
Herbivores Carnivores Fungivores Detritivores
B Tussock

36 Barratt et al.—Impact of fire on tussock invertebrates
There was a higher proportion of coleopteran fungivores in the MB tussock
samples than in the DS tussock samples or the turf samples from both sites
(Fig. 14). This group was dominated by the Family Ptiliidae. This family, comprising
three species, was present in spring-burnt tussock plots at MB in January 2003
in densities of over 200 individuals/m2, but was far less abundant in turf samples
or DS tussock samples. Reasons for this positive response to burning in spring
are unclear. The small proportion of fungivores that were present in MB turf
samples (mainly Ptiliidae and Corylophidae) declined to a very low proportion
of the fauna after the spring burn treatment.
The proportion of individual herbivores and carnivores in DS turf and tussock
samples in control plots was quite consistent between years, with 55–65% of the
fauna comprising herbivores and the majority of the balance being carnivores
(Fig. 14). The proportions found in the spring-burnt plots, however, were
quite different from the control plots, even pre-treatment, with a much greater
proportion of carnivores, attributable mainly to by far the most abundant family,
the Staphylinidae. For example, in 2001, the mean density of Staphylinidae
individuals in control plot turf samples was 43.3 ± 0.33 individuals/m2, compared
with 208.7 ± 1.8 individuals/m2 in the plots allocated to be burned in spring.
3.4.6 Exotic component of the community
In total, 22 Coleoptera species/morphospecies were classified as exotic
(Table 6); five of these were only found at DS, nine at MB, and eight were found
at both sites. The proportion of the Coleoptera fauna of exotic origin was 9.2%
at DS and 12.6% at MB. Two of the species present were deliberately introduced
as biological control agents (Table 6).
At DS, the proportion of species and individuals that were exotic appeared
to increase successively between 2001 and 2004 (Fig. 15A & B). However, the
proportions increased in both control and burnt plots, suggesting that this was
not a treatment effect. At MB, the proportion of exotic species and individuals
was generally consistent between years and treatments (Fig. 15A & B).
At both sites, more exotic species were found in turf compared with tussock
samples (Table 6), but the mean density of exotic species did not exceed
6 individuals/m2 in either sample type (Fig. 15C). The generalised linear model
found no significant effects of treatment on the proportion of exotic species or
individuals present.

37Science for Conservation 291
* Deliberate introductions for biological control.
FAMILY SPeCIeS DeeP STReAM MOuNT BeNGeR
TuRF TuSSOCK TuRF TuSSOCK
Anthribidae Euciodes suturalis 0.5 – 0.5 –
Archeocryptidae Archeocrypticus topali – – 0.5 –
Coccinellidae Coccinella 11-punctata* 2.0 3.3 0.5 4.4
Coccinellidae Coccinella leonina 0.5 1.1 0.5 –
Cryptophagidae Cryptophagus DS sp. 1 0.5 1.1 – –
Cryptophagidae Cryptophagus DS sp. 2 – 6.7 0.5 1.1
Curculionidae Listronotus bonariensis 0.5 – 5.5 3.3
Curculionidae Otiorhynchus ovatus – – 0.5 –
Curculionidae Sitona discoideus 0.5 – – –
Curculionidae Trichosirocalus horridus* – – 0.5 1.1
Dermestidae Anthrenocerus australis 0.5 – – –
Dermestidae Reesa vespulae 0.5 1.1 1.5 –
Latridiidae Aridius bifasciatus 0.5 1.1 – 1.1
Latridiidae Cartodere DS sp. 1 2.0 1.1 – –
Latridiidae Corticaria serrata 1.0 1.1 0.5 –
Mycetophagidae Typhaea sterocorea – – 0.5 1.1
Scolytidae Hylastes ater – – 0.5 –
Staphylinidae Pselaphophus atriventris – – – 1.1
Staphylinidae Pselaphophus MB sp. 1 – – – 1.1
Staphylinidae ‘Quedius’ DS sp. 1 – – 0.5 1.1
Staphylinidae ‘Quedius’ MB sp. 1 – – 2.5 2.2
Staphylinidae Tachyporus nitidulus 0.5 1.1 – –
TABLe 6. MAxIMuM DeNSITY (NO. INDIvIDuALS/m2) OF exOTIC COLeOPTeRA
SPeCIeS FOuND AT eACH SITe AND SAMPLe TYPe.
‘–’ = not present.
The exotic species that reached highest densities in individual samples at DS were
Cartodere DS sp. 1 (Latridiidae) and Coccinella 11-punctata (Coccinellidae) in
turf samples; and Crytptophagus DS sp. 2 (Cryptophagidae) and C. 11-punctata
in tussock samples. At MB, the exotic species that reached highest densities were
Listronotus bonariensis (Curculionidae) and ‘Quedius’ MB sp. 1 (Staphylinidae)
in turf samples; and C. 11-punctata and L. bonariensis in tussock samples. Of
the herbivores, L. bonariensis (Argentine stem weevil) was the most commonly
found, with 11 being collected from a single turf sample at MB in January 2000.

38 Barratt et al.—Impact of fire on tussock invertebrates
Figure 15. Composition of Coleoptera community for both sites and treatments across all annual January sampling dates. A. Proportion of species that were exotic; B. proportion of individuals that were exotic; and C. mean density of exotic species. SumB = summer-burnt plots; SprB = spring-burnt plots.
0
0.05
0.1
0.15
0.2
0.25
2001DS
2002 2003 2004 2000MB
2001 2003 2004
Pro
porti
on o
f spe
cies
exo
ticA
0
0.005
0.01
0.015
0.02
0.025
0.03
2001DS
2002 2003 2004 2000MB
2001 2003 2004
Pro
porti
on o
f ind
ivid
uals
exo
tic
B
Deep Stream Deep StreamMount Benger Mount Benger
0
1
2
3
4
5
6
7
2001turfDS
2003 2001tussock
2003 2000turfMB
2003 2000tussock
2003
SumB SprB control
Den
sity
(no.
/m2 )
turf tussock turf tussockDeep Stream Mount Benger
ControlSumB SprB
C

39Science for Conservation 291
4. Discussion
4 . 1 C O M P A R I S O N S B e T W e e N D e e P S T R e A M A N D M O u N T B e N G e R I N v e R T e B R A T e C O M M u N I T I e S
The two sites at DS and MB, which were chosen to represent examples of lower
and higher altitude tall tussock grassland, respectively, were both dominated by
Chionochloa rigida. Soil types are similar, although geological history of the
areas is probably quite different, with evidence of glaciation at higher altitudes
in the MB area (Mcewen 1987). At the time of this study, both areas had been
retired from grazing and had not been burned for 10 years or more. DS has a
higher average temperature (6.8 oC cf. 4.9oC) and lower rainfall (993 mm/year cf.
1264 mm/year) than MB (Payton & Pearce 2009).
The composition of the invertebrate communities at these sites has been influenced
by combinations of physical and biotic factors. However, our understanding of
these relationships is currently insufficiently advanced to be able to explain
spatial differences in density and community composition. Previous management
history (burning and grazing) for these sites is poorly known further back than
10–20 years, and this will certainly have influenced the invertebrate faunas that
we see today.
The total density of the invertebrate fauna (excluding the microarthropods)
was considerably higher at DS than at MB, which might be attributable to the
higher altitude and cooler average temperature at MB. However, this needs
to be considered in the context of the total invertebrate fauna (including
microarthropods). Barratt et al. (2006) found that microarthropod (Collembola
and Acari) densities in control turf plots at DS and MB averaged over 2001–2003
were 18 579 and 20 413 individuals/m2, respectively, comprising about 80–90%
of the total invertebrate fauna.
4.1.1 Taxonomic composition
At both sites, over 75% of the invertebrate community (in terms of density)
comprised Hymenoptera (mainly Formicidae), Myriapoda (mainly Chilopoda),
Hemiptera (mainly Pseudococcidae), Crustacea (mainly Amphipoda), Coleoptera
(mainly Curculionidae and Staphylinidae beetles) and Arachnida (mainly
Araneae). In a previous study, the taxonomic structure of the invertebrate
communities at DS and MB were compared with two other tussock grassland
sites at Cass (Canterbury) and Tukino (central North Island) (Barratt et al. 2005).
Barratt et al. (2005) found that the mean rank of the most abundant taxa
(Formicidae (Hymenoptera), Coleoptera and Pseudococcidae (Hemiptera)) were
consistent at all sites. These data suggest that, in general, these taxa are amongst
the dominant invertebrate components of tussock grassland environments in
New Zealand.
The far greater density of Formicidae at DS compared with MB, particularly in turf
samples, was one of the most striking differences in the taxonomic composition
of the invertebrate fauna between the two sites. Reasons for this are not clear,
but it could be the result of altitude-related climatic or biotic variables. Support

40 Barratt et al.—Impact of fire on tussock invertebrates
for this comes from a study carried out at a higher altitude (about 1600 m a.s.l.)
on the Old Man Range (part of the same mountain massif as MB), where ants were
found to be very scarce (Scott 2007).
4.1.2 Trophic composition
Despite differences in the density of invertebrates at DS and MB, the trophic
structure of the communities at the two sites was quite similar. However, the
proportions reported (Fig. 6A) apply only to meso- and macroinvertebrates,
and exclude the soil and litter-dwelling microarthropods, such as Collembola
and Acari, where fungivores predominate (Barratt et al. 2006). If biomass had
been measured, yet another picture would emerge (Saint-Germain et al. 2007).
A summary of studies of trophic composition of invertebrates in grassland based
on biomass was presented by Curry (1994). Three different studies showed
that decomposers comprised 40–96%, herbivores up to 52% and carnivores
up to 19%. In general, Curry (1994) found that decomposers (fungivores and
detritivores) were the dominant trophic group in grassland, except in very arid
environments. These findings are comparable to those from the current study—
approximately 42% decomposers (detritivores and fungivores), 35% herbivores
and 22% carnivores (Fig. 6A).
4 . 2 I N v e R T e B R A T e R e S P O N S e S T O B u R N I N G
As expected, most invertebrate groups were initially adversely affected by the
burning treatments, with often significant reductions in population density.
Some of the groups most severely affected were those dependent upon the
litter layer for feeding and for the habitat that it provides. Removal of the litter
layer by fire at these sites was reported by Payton & Pearce (2009). The pre-
burn above-ground vegetation biomass was similar at DS and MB, at about
27 000–29 000 kg/ha, of which about 60% and 68%, respectively, was litter
(Payton & Pearce 2001). The spring burn (November 2000) at MB removed an
average of 32% of the above-ground biomass and left much of the ground-cover
vegetation intact. However, the spring burn at DS removed 70% of the above-
ground biomass, including most of the litter and ground-cover vegetation. This
difference was attributed to the lower moisture content of tussock bases and
upper soil layers at DS compared with MB (Payton & Pearce 2001). The summer
burn at DS caused a similar amount of damage as the spring burn, removing 74%
of the above-ground biomass and most of the litter; however, the recovering
vegetation was also exposed to winter frosts soon after the burning treatment
(Payton 2003).
The Duff Moisture Code (DMC) is one of the Fire Weather Index measurements
(van Wagner 1987) of particular significance to litter-dwelling invertebrates. It is
an index of the moisture content of the layer of partially and fully decomposed
organic materials lying below the undecomposed litter layer and immediately
above the mineral soil. A DMC range of 0–30 denotes minimal to high fire risk.
The DMC for the MB spring burn was 6, compared with 14 for the DS spring
burn and 26 for the DS summer burn. The greater loss of ground cover at DS
following both burns and the higher DMC at DS probably contributed to the
more significant impacts of the fires on litter-dwelling invertebrate densities at

41Science for Conservation 291
DS than at MB. Henig-Sever et al. (2001) found a negative correlation between
fire intensity and microarthropod density and community composition. A
more intense fire would be expected during summer than spring at DS (and in
comparison with the MB spring burn), using plant biomass removal and DMC as
indicators; however, it appears that the spring burn at DS was probably more
intense than would generally be expected at this time of year.
Table 4 shows that the effects of burning were most prolonged for five taxa
and were probably most pronounced for the Amphipoda. These ‘land-hoppers’
were substantially reduced in density at both sites and vegetation types, and
little recovery was observed by January 2005. Terrestrial amphipods are litter
dwellers, feeding on decaying organic material and dependent upon a moist,
humid habitat. Duncan (1969) found a relationship between litter thickness
and amphipod density. Similar burning experiments in Tasmania in button grass
vegetation showed a very similar effect, with substantial reductions in density
and very slow recovery of Amphipoda (M. Driessen, Department of Primary
Industries, Tasmania, pers. comm. 2007). In the current study, the destruction
of the litter layer is likely to have caused a collapse in amphipod populations,
and it is likely that previous densities would not be restored until the litter layer
has had time to re-establish. Psocoptera (at DS) and Diplopoda (at MB) are other
litter-feeding invertebrates that also suffered longer-term population density
reductions after fire.
Densities of Hymenoptera (mainly ants) declined after burning, particularly
in DS turf samples, and densities remained low. In grassland ecosystems that
are well adapted to fire, the ant fauna appears to be comparatively resilient to
burning. For example, in African savannah, Parr et al. (2004) found that 8 months
after a fire there was no significant change in relative ant abundance measured
by pitfall trapping; and harvester ants (Pogonomyrmex rugosus) appear to be
well-adapted to cope with wildfires in the desert grassland of New Mexico, with
no measurable change in abundance (Zimmer & Parmenter 1998). It would be
expected that in the event of fire, population survival in subterranean nests (to
which the highly mobile individuals would most likely retreat) might be quite
high. Therefore, the post-burn population density reduction measured in the
current study could be attributable to reduced prey and seed availability.
Invertebrate groups that were negatively impacted by fire but recovered by
January 2005 were represented mainly in DS turf samples. These included the
myriapod orders Symphyla and Chilopoda. The latter are carnivorous, probably
feeding on microarthropods such as Collembola and Acari, which were reduced
in density after the fire but mostly recovered in the following 2–3 years (Barratt
et al. 2006). Post-burn reductions in chilopod densities have also been observed
in Illinois prairie (Rice 1932) and in grassland in Spain (Garcia-Ruiz 2001).
Annelid densities were also significantly reduced by fire, but had recovered in DS
turf by January 2005. Lumbricidae in tallgrass prairie in Kansas (Callaham Jr. et
al. 2003) and prairie in Illinois (Rice 1932) also exhibited declines in density in
0.1-m2 turf samples after burning. The annelid fauna in this study was dominated
by enchytraeidae. Yeates & Lee (1997) recorded reductions in density of
enchytraeidae in a tussock grassland similar to that reported here 16 months
after fire, but the differences were not significant, possibly because of lower
sample replication.

42 Barratt et al.—Impact of fire on tussock invertebrates
Lepidoptera densities at MB were reduced after the spring burn, but recovered
to pre-burn and control densities between 2001 and 2003 (Appendix 5).
Lepidoptera larvae are either herbivores or litter-feeders, and are probably very
susceptible to the high temperatures and acute effects of fire. However, adults
are relatively mobile and likely to recolonise quite quickly, especially once plant
regrowth occurs and the litter layer re-establishes. In a review of impacts of fire
on invertebrates, Warren et al. (1987) found that impacts of fire on Lepidoptera
were varied and dependent on habitat and food source, and the way in which
these resources were affected by fire (host plant decline, litter removal, etc.).
Invertebrate groups that demonstrated immediate post-burn population impacts
followed by rapid recovery were Coleoptera, Pseudococcidae, Diptera and
Thysanoptera. Coleoptera will be discussed in more detail below. Declines in
pseudococcid (mealybug) densities after burning may have resulted from their
generally soft-bodied structure, and hence susceptibility to increased temperature,
as well as their immobility and inability to move quickly away from the higher
temperatures. However, many mealybugs are found on plant roots in the soil and
would have been protected; therefore, other environmental changes following
the fires may have resulted in population reduction. Thysanoptera were initially
reduced in density but then recovered quite rapidly to achieve densities that were
higher than found pre-burn, especially at DS (Table 4). This group is not only
very mobile, but has the capacity to increase population density quite quickly.
Changes in invertebrate community structure in the longer term will be influenced
by changes in plant species composition. The vegetation in the DS burnt plots
became browntop (Agrostis capillaris L.) dominant after burning (Payton
& Pearce 2001) and native plant species diversity was reduced by about 50%
3 years post-burn (espie & Barratt 2006).
Substantial loss of litter is likely to delay recovery of litter-dwelling species
through altered food and habitat conditions. Loss of tussocks will also potentially
reduce biodiversity, since 6–8% of the species at the sites were found only in
samples containing Chionochloa rigida. The spring burn at DS killed 21–70% of
tussock plants (Payton & Pearce 2009).
4 . 3 S e A S O N A L e F F e C T O F B u R N I N G O N I N v e R T e B R A T e S
In general, seasonality of the burning treatments, which could only be compared
at DS, did not appear to be a major factor influencing the immediate and longer-
term recovery of most invertebrate groups. Irrespective of season, the immediate
impact of fire on invertebrate faunas depends upon the intensity and duration
of the fire (Curry 1994). At DS, the spring burn was more intense than would
be expected, since both spring and summer burns removed much of the litter
(Payton & Pearce 2009). Other factors that are likely to result in seasonal
difference in invertebrate responses to fire include seasonal diapause, presence
of different stages of the life cycle (e.g. surface-dwelling cf. soil-dwelling stages)
and differential removal of vegetation (Swengel 2001).

43Science for Conservation 291
4 . 4 e F F e C T O F B u R N I N G T R e A T M e N T S O N C O M M u N I T Y T R O P H I C S T R u C T u R e
It is well recognised that management practices such as grazing, burning, etc. that
change the composition of the sward will inevitably change invertebrate species
composition in grassland (Curry 1987). Change in botanical composition can
potentially have the most profound effects on monophagous herbivore species
(those that eat only one species of plant). However, herbivores in general are
dependent upon the standing crop of vegetation, which was severely depleted
in the first few months after the fire (NZ Fire Research 2001). The changes
that occurred in invertebrate abundance 2–3 months after burning are likely
to have been responses to the changed environment of reduced litter and drier
soil surface conditions. After 3 years, however, botanical changes had probably
influenced the community structure. A discussion of trophic structure and changes
brought about by a disturbance such as burning can at best be superficial without
data on biomass and energy flow (which was beyond the scope of this study).
Nevertheless, our speculative interpretations of some of the major responses
seen are discussed in the following sections.
4.4.1 Herbivore response
The massive reduction in herbivore densities 2–3 months after treatment
(Fig. 7), especially at DS, probably resulted from the direct effect of the fire
causing mortality of invertebrates, as well as indirect effects as a result of
the large reduction in available plant material. The relationship between
plant biomass and invertebrate biomass was demonstrated by Andrzejewska
(1979a). From data collected in Polish grasslands, he calculated that for every
1000 kg DM (dry matter)/ha there is an increase of 20 kg DM/ha of invertebrates.
While this clearly cannot be directly applied to New Zealand tussock grassland,
especially since invertebrate biomass data are not available for our sites, it could
be indicative of the scale of invertebrate biomass loss that might accompany the
large plant biomass losses of approximately 13 600 and 25 500 kg DM/ha that
were calculated after the spring burns at MB and DS, respectively (Payton &
Pearce 2009).
The ‘rebound’ in herbivore densities measured for Thysanoptera and Lepidoptera
(Table 4) following an initial dramatic decline was almost certainly related to the
flush of vegetation regrowth. A study carried out close to the MB site showed that
1.5 years after a tussock fire, the level of phosphorus in burnt plots was twice the
value of that in control plots, and 2 years after the fire, higher concentrations of
nitrogen and phosphorus were available to plants (Ross et al. 2001). In addition,
the level of total nitrogen and phosphorus in Chionochloa rigida leaves was
significantly higher in burnt plots than control plots after 2 years. These increased
nutrient levels would contribute to improved plant growth and the nutrient value
of vegetation for herbivorous invertebrates.

44 Barratt et al.—Impact of fire on tussock invertebrates
4.4.2 Carnivore response
Although there was a reduction in carnivore densities in the 1–2 years after spring
burning, especially at DS in turf samples (Fig. 7), the response was not large.
This perhaps reflects the ability of carnivores to switch to alternative prey items
when there are fluctuations in density of the other trophic groups. There was no
evidence of a ‘rebound’ in numbers as the carnivore populations recovered.
4.4.3 Detritivore response
At MB, there was no evidence of a reduction in detritivore densities following
burning. However, at DS there was a pronounced decline and then ‘rebound’ in
detritivore densities in both turf and tussock samples after the spring burn, and
in tussock samples after the spring and summer burns (Fig. 7). The initial decline
could have resulted from reduced litter and more variable temperatures and
humidity. The increase in January 2005, however, is more difficult to interpret.
Andrzejewska (1979b) emphasised the importance of herbivore faeces as a highly
nutritious substrate for saprophagous feeders (here called detritivores), affecting
the fecundity of this group. It is conceivable, therefore, that the large increase
in herbivore density recorded in January 2004 and 2005 in particular provided
the mechanism for the recovery; indeed the observed ‘rebound’ was mirrored
by herbivore densities, despite the herbivores largely comprising Thysanoptera
and Pseudococcidae.
4.4.4 Fungivore response
Fungivore densities were very low at both sites and vegetation types (Fig. 7). This
is somewhat misleading, since microarthropods, which were not included in this
investigation, contribute a large component of the fungivore fauna. However,
the ‘rebound’ of fungivore densities at MB, especially in tussock samples, might
be explained by their response to a possible flush of fungal activity on dead
organic material and litter that had begun to accumulate in the system after being
removed by fire. This effect was far less pronounced at DS, where litter removal
by the spring and summer burns was more complete.
4 . 5 C O L e O P T e R A : A D e T A I L e D S T u D Y
Coleoptera were identified to species/morphospecies in this study with an
endeavour to include larval stages. However, this presented some major
challenges. In all cases, identification to family at least was attempted for larvae.
Inevitably, there will have been some errors in our taxonomy for immature
stages, which it may be possible to correct in the future, since all specimens have
been retained in storage. Taxonomic assignment was particularly demanding
for Staphylinidae in the subfamily Aleocharinae, where several species were
distinguished as adults but species-level diagnostic characters could not readily
be assigned to larvae with the available resources. This subfamily would lend
itself well to a molecular approach to linking larvae with adults.
The coleopteran families with the highest recorded number of species were the
Curculionidae and Staphylinidae at both sites. This was also found to be the case
at 1600 m a.s.l. on the Old Man Range, close to MB (Scott 2007).

45Science for Conservation 291
The pre-treatment MDS ordination data (Fig. 8A) illustrated the variability in
density of individual species between the treatment replicates, varying from
close agreement in DS control plots to widely variable in MB plots designated to
be burned in spring. This illustrates the heterogenous nature of the Coleoptera
population densities at the sites.
4.5.1 Effect of treatments on species richness
Pre-treatment Coleoptera species richness was higher at MB than at DS, and in
both cases was higher in turf than tussock samples, possibly as a result of greater
plant species diversity in turf samples. Burning reduced coleopteran species
richness substantially in turf samples, especially at DS, where it did not recover
to pre-burn levels until 2004 for both spring and summer burn treatments. A
similar pattern was observed for tussock samples. The similarity of impact for
the spring and summer burn treatments probably resulted from the similarity of
intensity of the two fires. Both fires removed much of the ground cover layer
of plants and the litter layer (Payton & Pearce 2009), reducing food resources
for herbivorous families such as Curculionidae, and shelter for many litter-
dwelling families such as the Staphylinidae. Furthermore, the spring burn at DS
was followed by a period of dry weather (Payton & Pearce 2009), which would
have further reduced survival of litter-dwelling species. Conditions following
the spring burn at MB were more favourable to Coleoptera species survival, as
snow covered the sites a few days after treatment (Payton & Pearce 2009), which
would have buffered communities against frost, from which they would have
found difficulty in sheltering, and against dehydration.
Fadda et al. (2007) found that species richness of Coleoptera was higher in
disturbed sites than undisturbed steppe in southern France because the vegetation
contained more early colonising plant species, which supplied vegetation of a
higher nutritive value to herbivores and a more diverse supply of prey items
for carnivores. They argued that cultivation created soil conditions that were
beneficial for Coleoptera with soil-dwelling stages. Although disturbance
by burning is unlikely to alter the soil environment substantially, it is known
to produce a ‘flush’ of vegetative regrowth as a result of increased levels of
phosphorus and nitrogen available to plants after fire (Ross et al. 2001), which is
likely to be beneficial to herbivorous invertebrates.
In a semi-arid shortgrass steppe in New Mexico, uSA, Ford (2007) recovered
29 families of Coleoptera (by pitfall trapping) and identified 115 species. Ford
(2007) investigated the effect of burning on Coleoptera by comparing 2-ha plots
burned in spring with plots burned in summer and unburnt plots. Coleoptera
species ‘abundance’ was not significantly changed 1 year after burning, but
species richness significantly increased in the spring-burnt plots; the summer
fire treatment had no effect on species richness. This contrasts with our data,
where Coleoptera species richness declined significantly at both sites and after
both treatments. However, the sampling method used by Ford (2007) might
have influenced the results in his study: pitfall traps are a better measure of
activity than abundance, and burnt plots with less vegetation and litter might
have allowed increased activity of Coleoptera.

46 Barratt et al.—Impact of fire on tussock invertebrates
4.5.2 Species diversity and rank abundance patterns
The Shannon-Wiener species diversity indices calculated were found to mirror
to some extent the decline in Coleoptera species richness and density. This
might be expected, since the Shannon-Wiener index takes account of both these
variables. However, k-dominance curves for the coleopteran community under
different treatments encompass species richness and evenness of spread of
individuals between species (Platt et al. 1984). If the k-dominance curves intersect
(e.g. as seen for the curves for January 2002 and January 2003 DS spring-burnt
turf samples in Fig. 13A), this suggests that the Coleoptera species assemblages
are not comparable in terms of intrinsic diversity and that Shannon-Wiener is not
necessarily reliable (Platt et al. 1984). Furthermore, the difference in the shape
(steepness) of the curves for the pre-spring-burn treatment in the two vegetation
types at DS suggests that the evenness of spread of individuals between species
is greater for the turf samples than the tussock samples.
If the Shannon-Wiener plots (Fig. 11) are compared with the k-dominance curves
for DS spring- and summer-burnt plots for turf samples (Fig. 13A & C), then both
indicate a substantial reduction in species diversity in 2002 (3 months post-
burn), and to a lesser extent in 2003 (1 year later). However, the Shannon-Wiener
indices for 2004 have returned to pre-burn values for both treatments, whereas
the k-dominance curve remained distinctly separated, at least for the spring-
burnt plots.
For the DS tussock samples, the pattern suggested by the k-dominance curves
closely reflects the Shannon-Wiener index values, with diversity decreasing from
2002 to 2003, then returning further towards the pre-burn values by 2004. The
summer burn tussock k-dominance curves (Fig. 13D) indicate a large reduction
in diversity in 2002 (as do the Shannon-Wiener indices, although the pre-burn
values are not available). For the following years, a substantial increase in diversity
is indicated by both methods.
For MB, there was generally good agreement between the two methods of species
diversity assessment. Apart from a clear separation of the k-dominance curves for
2001 turf samples (Fig. 13e) and significant reduction in Shannon-Wiener values,
there is little difference in the following years. The tussock data also suggest little
difference in Coleoptera species assemblages (Fig. 13F).
With the exception of a single inconsistency noted above, the Shannon-Wiener
and k-dominance approaches give consistent findings, providing a reasonable
degree of confidence in the comparative assessment of spring and summer
burning treatments on Coleoptera species diversity.
4.5.3 Trophic structure and response to treatments
The trophic structure in the Coleoptera community observed in our study was
similar to that found by Fadda et al. (2007) in steppe grassland in southern France,
with herbivores comprising about 35% of species in both studies, carnivores
about 50% (cf. 30% in France) and the remaining 15% fungivores, detritivores and
coprophagous species (cf. 35% in France).
Burning brought about few changes in the trophic structure of the coleopteran
community, either in proportion of species or individuals (Fig. 14). However,
the analysis of these data did highlight the differences in the proportions of

47Science for Conservation 291
herbivores and carnivores that occurred between the DS plots before the spring
burns took place, particularly with regard to the dominance of carnivores. The
effect of burning was, however, evident in MB tussock samples, where the
proportion of fungivores increased in 2003, 2 years after treatment.
4.5.4 Exotic component of the community
A large number of exotic organisms have become established in New Zealand,
and some represent a threat to native ecosystems. In a recent international review
of literature, it was found that about 20% of all exotic insects accidentally or
deliberately introduced into semi-natural or natural ecosystems are Coleoptera
(C.B. Phillips, AgResearch, unpubl. data 2008).
exotic Coleoptera have become established in the relatively undisturbed tussock
grassland environments at both DS and MB, although at both sites the proportion
of exotic species (and individuals) was low. There was no significant or consistent
effect from the burning treatments at the two sites. While it might be expected
that disturbance by burning would lead to an increase in the exotic component
of the fauna, especially if the diversity and abundance of exotic plants increases,
the time scale of this study was probably too short to measure such changes.
There is very little, if any, comparable data from New Zealand with which to
compare these findings.
4 . 6 L I M I T A T I O N S O F T H I S S T u D Y
The delay in carrying out the MB summer burn treatment reduced the potential
for a robust analysis of the effect of season (spring or summer) on the impact
of fire and recovery of invertebrate populations and community structure.
However, annual sampling of all plots has continued, so further analysis will be
possible in the future. Similarly, the discontinuation of processing samples after
2005 has limited our ability in this report to discuss recovery of some taxa that
had not returned to pre-burn population densities. Furthermore, the absence of
invertebrate data from the DS January 2001 tussock control and summer-burnt
plots has limited our ability to fully analyse these data, but again this could be
addressed in the future. Finally, it must be remembered that the treated plots
were 1 ha in size, and so recolonisation from the surrounding unburnt vegetation
is likely to have occurred more rapidly that it would from a large-scale burning
programme or from a wild fire. This recolonisation is also likely to occur
differentially amongst invertebrates, depending upon their relative mobility.

48 Barratt et al.—Impact of fire on tussock invertebrates
5. Conclusions
This research has provided data on invertebrate density and trophic structure
using two case studies in Otago tussock grassland. For Coleoptera, it was possible
to make additional measurements of species richness and diversity, trophic
structure and the exotic component.
Since the study reported here was limited by a lack of site replication, the DS and
MB sites need to be considered as case studies, limiting the ability to extrapolate
the findings to other sites. The study was also limited by the relatively short time
scale for post-burn analysis of impacts. However, where clear and substantial
short- to medium-term effects have been observed at both sites, it is probably
reasonable to cautiously generalise about effects.
The data obtained for Coleoptera in this study are probably the most informative
for assessing the impacts of fire on biodiversity, assuming that Coleoptera are
a good surrogate for the invertebrate fauna. These data indicate that species
richness was initially substantially reduced, but that this returned to pre-burn
levels 2–3 years post-burn at both sites and treatments, and the exotic component
of the fauna did not change at these sites in the time frame of the study.
Species diversity, measured by the Shannon-Wiener index and also presented
as k-dominance plots, returned to pre-burn levels within the study period, with
the possible exception of the spring-burnt turf samples at DS, as indicated (quite
strongly) by the k-dominance curves.
The rest of the invertebrate fauna was not analysed at the species level, and there
were no indications that entire groups were removed by the fire treatments.
However, there were clear and sometimes severe impacts on elements of the
fauna, some of which did not return to pre-burn status within the study period,
a case in point being the Amphipoda. Given that Coleoptera was not one of the
most severely impacted groups, the impacts on the rest of the fauna need to be
considered. As other higher taxa are further analysed at species level, it will be
valuable to include these in an analysis of the impact of fire on species richness
and diversity.
The comparison of the impact of spring and summer fires on the invertebrate
fauna indicated that there were no major differences, at the level of detail
possible in this investigation, either for the full range of taxa or for Coleoptera
species. Similarly, there were no substantial differences between seasons in the
effect on any of the trophic groups within the community. It is unfortunate that
the MB summer burn data were not available for analysis in this report, so that
the comparison was restricted to a single site. An analysis of individual species
in the future might unearth differential effects on taxa of the timing of burning
treatments.

49Science for Conservation 291
6. Recommendations
The authors make the following recommendations, including topics for further
research:
Continue annual sampling and storage of specimens for at least another •
5 years to develop a resource of collected material. This has been carried out
for 2007, 2008 and 2009. This will allow for longer term effects of burning to
be analysed at some stage in the future.
Store one complete set of unsorted material from both sites (e.g. January •
2008 sample) in deep freeze to preserve DNA for future study. This would
allow DNA extraction to be carried out for taxa where molecular methods
are required to solve taxonomic or systematic problems. Improve standard of
curation of remaining collected material to museum standard.
Integrate invertebrate and plant data, and work towards using data on •
fire characteristics, and effects on the flora and invertebrates to develop a
predictive model that can be tested.
encourage students to make use of the material and the data to add value to •
the information reported so far. Such studies could include:
—estimation of treatment impacts on biomass of invertebrate taxa and
trophic groups, which is often considered more ecologically meaningful
than density.
—Determination of consequences to native flora of post-burn outbreaks of
Pseudococcidae, Thysanoptera and Homoptera, as found in the current
study, and the potential for these taxa to transmit plant pathogens.
—Molecular studies to match larvae with adult stages. This may be limited
by the quality of DNA that can be extracted for longer-term alcohol-
stored specimens unless stored in deep freeze. This would be particularly
valuable for species-rich groups such as Staphylinidae, where morphology
is particularly challenging.
—Testing of consistent results from these case study sites to determine
whether they apply more universally.
7. Acknowledgements
This work was partially funded by the Department of Conservation (Science
Investigation No. 3667) and partially by New Zealand’s Foundation for Research,
Science & Technology (contract CO2x0501, the Better Border Biosecurity (B3)
programme; www.b3nz.org). We thank many AgResearch staff and students
for assistance with sorting samples, especially Rory Logan, Tara Murray,
Peter Tozer and Aliesha Kean. We thank Marcus Simons, eric edwards and Don
Newman (Department of Conservation) and Kath Dickinson (university of Otago)
for their continuing support for the study.

50 Barratt et al.—Impact of fire on tussock invertebrates
8. References
Andrzejewska, L. 1979a: Herbivorous fauna and its role in the economy of grassland ecosystems I.
Herbivores in natural and managed meadows. Polish Ecological Studies 5: 5–44.
Andrzejewska, L. 1979b: Herbivorous fauna and its role in the economy of grassland ecosystems II.
The role of herbivores in trophic relationships. Polish Ecological Studies 5: 45–76.
Aspinal, J.H. 2001: Issues around use of fire as a land management tool in rural New Zealand.
Pp. 237–242 in Pearce, G.; Lester, L. (eds): Bushfire 2001. Joint Bushfire/FRFANZ Conference,
New Zealand Forest Research Institute, Christchurch.
Barratt, B.I.P. 1982a: Biology of the striped chafer, Odontria striata (Coleoptera: Scarabaeidae) II.
Larval development. New Zealand Journal of Zoology 9: 267–278.
Barratt, B.I.P. 1982b: Insect damage to white clover oversown into New Zealand native tussock
grassland. Pp. 25–31 in Lee, K.e. (ed.): Proceedings of the 3rd Australasian Conference on
Grassland Invertebrate ecology, S.A. Government Printer, Adelaide.
Barratt, B.I.P. 1983: Distribution survey of soil insects at Millers Flat, Central Otago. New Zealand
Journal of Experimental Agriculture 11: 83–87.
Barratt, B.I.P.; Campbell, R.A. 1982: Biology of the striped chafer, Odontria striata (Coleoptera:
Scarabaeidae) I. The adult, flight and ground surface activity, female reproductive maturation,
and food plant selection. New Zealand Journal of Zoology 9: 249–266.
Barratt, B.I.P.; Ferguson, C.M.; Logan, R.A.S.; Barton, D.; Bell, N.L.; Sarathchandra, S.u.;
Townsend, R.J. 2005: Biodiversity of indigenous tussock grassland sites in Otago, Canterbury
and the Central North Island of New Zealand I. The macro-invertebrate fauna. Journal of the
Royal Society of New Zealand 35: 287–301.
Barratt, B.I.P.; Johnstone, P.D. 1984: effects of insects, seeding rate, and insecticide seed dressing
on white clover and Maku lotus in tussock grassland. New Zealand Journal of Agricultural
Research 27: 13–18.
Barratt, B.I.P.; Lauren, D.R. 1984: Chemical control of striped chafer, Odontria striata (Col:
Scarabaeidae). Proceedings of the 37th New Zealand Weed and Pest Control Conference:
73–76.
Barratt, B.I.P.; Patrick, B.H. 1987: Insects of snow tussock grassland on the east Otago Plateau. New
Zealand Entomologist 10: 69–98.
Barratt, B.I.P.; Tozer, P.; Wiedemer, R.; Ferguson, C.M.; Johnstone, P.D. 2006: effect of burning on
densities of Acari (Arachnida) and Collembola (Insecta) in New Zealand indigenous tussock
grassland. Rangeland Ecology and Management 59: 383–392.
Blanche, K.R.; Anderson, A.N.; Ludwig, J.A. 2001: Rainfall-contingent detection of fire impacts:
responses of beetles to experimental fire regimes. Ecological Applications 11: 86–96.
Bremner, G. 1988: ecological studies of the insect fauna of the east Otago Plateau. unpublished PhD
thesis, Department of Botany, university of Otago, Dunedin. 211 p.
Bulan, C.A.; Barrett, G.W. 1971: The effects of two acute stresses on the arthropod component of an
experimental grassland ecosystem. Ecology 52: 597–605.
Callaham Jr., M.A.; Blair, J.M.; Kitchen, D.J.; Todd, T.C.; Whiles, M.R.; Callaham Jr., M.A. 2003:
Macroinvertebrates in North American tallgrass prairie soils: effects of fire, mowing, and
fertilization on density and biomass. Soil Biology and Biochemistry 35: 1079–1093.
Crook, K.e.; Ferguson, C.M.; Barratt, B.I.P. 2004: Heat extraction of invertebrates from grassland
turf samples. Pp. 102–106 in Winder, L.M.; Goldson, S.L. (eds): Proceedings of the
8th Australasian Conference on Grassland Invertebrate ecology, AgResearch Ltd, Lincoln,
Christchurch, New Zealand, 1–4 June 2004.

51Science for Conservation 291
Curry, J.P. 1987: The invertebrate fauna of grassland and its influence on productivity. II. Factors
affecting the abundance and composition of the fauna. Grass and Forage Science 42:
197–212.
Curry, J.P. 1994: Grassland invertebrates: ecology, influence on soil fertility and effects on plant
growth. Chapman and Hall, London. 438 p.
Derraik, J.G.B.; Barratt, B.I.P.; Sirvid, P.; Macfarlane, R.P.; Patrick, B.H.; early, J.; eyles, A.C.;
Johns, P.M.; Fraser, P.M.; Barker, G.M.; Henderson, R.; Dale, P.J.; Harvey, M.S.; Fenwick, G.;
McLellan, I.D.; Dickinson, K.J.M.; Closs, J.P. 2001: Invertebrate survey of a modified native
shrubland, Brookdale Covenant, Rock and Pillar Range, Otago, New Zealand. New Zealand
Journal of Zoology 28: 273–290.
Derraik, J.G.B.; Closs, J.P.; Dickinson, K.J.M.; Barratt, B.I.P.; Sirvid, P.J. 2002: Invertebrate species
richness and density in relation to size of the New Zealand shrub Olearia bullata. Journal
of the Royal Society of New Zealand 32: 571–585.
Derraik, J.G.B.; Dickinson, K.J.M.; Closs, G.P. 2003: Invertebrate diversity on Olearia bullata and
Coprosma propinqua in a modified native shrubland, Otago, New Zealand. New Zealand
Journal of Ecology 27: 55–60.
Dick, R.D. 1940: Observation on insect-life in relation to tussock-grassland deterioration.
New Zealand Journal of Science and Technology 22A: 19–29.
Dickinson, K.J.M.; Mark, A.F.; Barratt, B.I.P.; Patrick, B.H. 1998: Rapid ecological survey, inventory
and implementation: a case study from Waikaia ecological Region, New Zealand. Journal of
the Royal Society of New Zealand 28: 83–156.
Dixon, K.M. 2004: Biodiversity along a gradient of modification: plant invertebrate and reptile diversity
in mid-altitude tall tussock (Chionochloa rigida). unpublished PhD thesis, Department of
Botany, university of Otago, Dunedin. 266 p.
Don, W. 2007: Ants of New Zealand. Otago university Press, Dunedin. 239 p.
Duncan, K.W. 1969: The ecology of two species of terrestrial Amphipoda (Crustacea: Family
Talitridae) living in waste grassland. Pedobiologia 9: 323–341.
Duncan, K.W. 1994: Terrestrial Talitridae (Crustacea: Amphipoda). Manaaki Whenua Press, Lincoln,
Canterbury. 128 p.
espie, P.; Barratt, B.I.P. 2006: Biodiversity of indigenous tussock grassland sites in Otago, Canterbury
and the Central North Island of New Zealand Iv. vegetation and the effect of disturbance
by agricultural development and fire. Journal of the Royal Society of New Zealand 36:
69–82.
Fadda, S.; Orgeas, J.; Ponel, P.; Buisson, e.; Torre, F.; Dutoit, T. 2007: Past cultivation is a factor
driving organization of dry grassland ground-active beetle communities. Environmental
Conservation 34: 132–139.
Floate, M.J.S. 1992: Guide to tussock grassland farming. AgResearch, Mosgiel. 127 p.
Ford, P.L. 2007: Shared community patterns following experimental fire in a semiarid grassland. In:
Proceedings of the 4th International Wildland Fire Conference, May 13–17 2007, Seville,
Spain. 9 p.
Friend, G. 1996: Fire ecology of invertebrates—implications for nature conservation, fire management
and future research. Pp. 155–162 in: Proceedings of a conference ‘Fire and Biodiversity: the
effects and effectiveness of fire management’. 8–9 October 1994, Footscray, Melbourne.
Biodiversity unit, Department of the environment, Sport and Territories, Canberra,
Australia.
Friend, G.R.; Williams, M.R. 1996: Impact of fire on invertebrate communities in mallee-heath
shrublands of south-western Australia. Pacific Conservation Biology 2: 244–267.
Friend, J.A.; Richardson, A.M.M. 1986: Biology of the terrestrial amphipods. Annual Review of
Entomology 31: 25–48.
Garcia-Ruiz, A. 2001: Study of the effects of fire on myriapod populations. estudio de los efectos de
un incendio sobre las poblaciones de miriapodos. Ecologia (Madrid) 15: 269–273.
52 Barratt et al.—Impact of fire on tussock invertebrates
Goodman, A.J. 2002: Patterns of beetle diversity in a modified tussock grassland, Otago, New Zealand.
unpublished MSc thesis, Department of Botany, university of Otago, Dunedin. 66 p.
Henig-Sever, N.; Poliakov, D.; Broza, M. 2001: A novel method for estimation of wild fire intensity
based on ash pH and soil microarthropod community. Pedobiologia 45: 98–106.
Hewitt, A.e. 1992: New Zealand Soil Classification. DSIR Land Resources Scientific Report No. 19.
DSIR, upper Hutt. 133 p.
Hunt, D. 2007: Department of Conservation fire research needs analysis: report on a project to
implement Recommendation 7 of DOC’s Fire Management Systems Audit. Department of
Conservation, Wellington. 95 p.
Hutcheson, J.; Walsh, P.; Given, D. 1999: Potential value of indicator species for conservation
and management of New Zealand terrestrial communities. Science for Conservation 109.
Department of Conservation, Wellington. 90 p.
Johnson, C. 1975: Arthropoda of the subantarctic islands of New Zealand. 8. Coleoptera: Ptiliidae.
New Zealand Journal of Zoology 2: 9–14.
Johnson, C. 1982: An introduction to the Ptiliidae (Coleoptera) of New Zealand. New Zealand
Journal of Zoology 9: 333–376.
Klimaszewski, J.; Watt, J.C. 1997: Coleoptera: family-group review and keys to identification. Manaaki
Whenua Press, Auckland. 199 p.
Lawrence, J.F.; Britton, e.B. 1994: Australian beetles. Melbourne university Press, Melbourne.
192 p.
Leschen, R.A.B.; Lawrence, J.F.; Kuschel, G.; Thorpe, S.; Wang, Q. 2003: Coleoptera genera of
New Zealand. New Zealand Entomologist 26: 15–28.
Lowther, W.L.; Douglas, M.H. 1992: Pasture establishment and development. Pp. 55–60 in Floate,
M.J.S. (ed.): Guide to tussock grassland farming. AgResearch, Mosgiel.
Mark, A.F. 1965: effects of management practices on narrow-leaved snow-tussock. New Zealand
Journal of Botany 3: 300–319.
Mcewen, W.M. 1987: ecological Regions and Districts of New Zealand: third revised edition in four
1:500 000 maps.
Mound, L.A.; Walker, A.K. 1982: Terebrantia (Insecta: Thysanoptera). Science Information Division,
DSIR, Wellington. 113 p.
Murray, T.J. 2001: Plant-animal associations between weevils (Coleoptera: Curculionidae) and the
vegetation in two Otago tussock grasslands. unpublished BSc (Hons.) thesis, Departments of
Zoology and ecology, university of Otago, Dunedin. 53 p.
Murray, T.J.; Barratt, B.I.P.; Dickinson, K.J.M. 2003: Comparison of the weevil fauna (Coleoptera:
Curculionoidea) in two tussock grassland sites in Otago, New Zealand. Journal of the Royal
Society of New Zealand 33: 703–714.
Murray, T.J.; Dickinson, K.J.M.; Barratt, B.I.P. 2006: Associations between weevils (Coleoptera:
Curculionidea) and plants, and conservation values in two tussock grasslands, Otago,
New Zealand. Biodiversity and Conservation 15: 123–137.
NZ Fire Research 2001: Fire research update. Newsletter of the Forest and Rural Fire Research
Programme. New Zealand Forest Research, Christchurch. 8 p.
O’Connor, K.F.; Powell, A.J. 1963: Studies on the management of snow-tussock grassland. I The
effects of burning, cutting and fertiliser on the narrow-leaved snow-tussock at a mid-altitude
site in Canterbury. New Zealand Journal of Agricultural Research 6: 354–367.
Otago Regional Council 2002: Code of Practice for the management of burning in the Otago high
country. Otago Regional Council, Dunedin. 62 p.
Parr, C.L.; Robertson, H.G.; Biggs, H.C.; Chown, S.L. 2004: Response of African savanna ants to long-
term fire regimes. Journal of Applied Ecology 41: 630–642.

53Science for Conservation 291
Patrick, B.H. 1991: Insects of Dansey ecological District. Science & Research Series 32. Department
of Conservation, Wellington. 21 p.
Patrick, B.H. 1994: Hawkdun ecological District invertebrate survey. Science & Research Series 64.
Department of Conservation, Wellington. 17 p.
Patrick, B.H.; Barratt, B.I.P. 1988: Insect surveys of the umbrella ecological District. Department of
Conservation, Wellington. Pp. 32–34 and 129–133.
Patrick, B.H.; Barratt, B.I.P. 1989: Insect surveys of the Nokomai ecological District. Department of
Conservation, Wellington. Pp. 32–37 and 128–138.
Patrick, B.H.; Barratt, B.I.P.; Heads, M.; Child, J. 1984: entomological survey of Mt. Pye - Ajax Bog,
Catlins State Forest. Department of Conservation, Dunedin. 28 p.
Patrick, B.H.; Barratt, B.I.P.; Heads, M. 1985a: entomological survey of the Blue Mountains. Report
for the New Zealand Forest Service, Invercargill. 28 p.
Patrick, B.H.; Barratt, B.I.P.; Heads, M. 1985b: entomological survey of the Garvie Mountains. Otago
Section entomological Society, Dunedin. 28 p.
Patrick, B.H.; Barratt, B.I.P.; Rance, B.; Heads, M.; Tangney, R. 1986: entomological survey of the
Slopedown Range. Report to the New Zealand Forest Service, Invercargill. 39 p.
Patrick, B.H.; Barratt, B.I.P.; Ward, J.B.; McLellan, I.D. 1993a: Insects of the Waipori ecological District:
Lammerlaw ecological Region. Otago Conservancy Miscellaneous Series 16. Department of
Conservation, Dunedin. 42 p.
Patrick, B.H.; Lyford, B.M.; Ward, J.B.; Barratt, B.I.P. 1993b: Lepidoptera and other insects of the
Rastus Burn basin, The Remarkables, Central Otago. Journal of the Royal Society 22:
265–278.
Patrick, B.H.; Rance, B.D.; Barratt, B.I.P.; Tangney, R. 1987: entomological survey of the Longwood
Range, Longwood ecological District, Te Wae Wae ecological Region. Scientific Series.
Department of Conservation, Dunedin. 86 p.
Payne, R.W.; Harding, S.A.; Murray, D.A.; Soutar, D.M.; Baird, D.B.; Welham, S.J.; Kane, A.F.; Gilmour,
A.R.; Thompson, R.; Webster, R.; Tunnicliffe, W.G. 2006: The guide to GenStat release 9,
Part2: Statistics. vSN International, Hemel Hempstead.
Payton, I.J. 2003: What’s new in fire research? Pp. 47–51 in Lough, R. (ed.): High Country Seminar,
Otago Regional Council, Cromwell, Otago.
Payton, I.J.; Lee, W.G.; Dolby, R.; Mark, A.F. 1986: Nutrient concentrations in narrow-leaved snow
tussock (Chionochloa rigida) after spring burning. New Zealand Journal of Botany 24:
529–537.
Payton, I.J.; Pearce, G. 2001: Does fire deplete the physical and biological resources of tall-tussock
(Chionochloa) grasslands? The latest attempt at some answers. Pp. 243–249 in Pearce, G.;
Lester, L. (eds): Bushfire 2001. Joint Bushfire/FRFANZ Conference, New Zealand Forest
Research Institute, 3–6 July 2001, Christchurch, New Zealand.
Payton, I.J.; Pearce, H.G. 2009: Fire-induced changes to the vegetation of tall-tussock (Chionochloa
rigida) grassland ecosystems. Science for Conservation 290. Department of Conservation,
Wellington. 42 p.
Platt, H.M.; Shaw, K.M.; Lambshead, P.J.D. 1984: Nematode species abundance patterns and their use
in the detection of environmental perturbations. Hydrobiologia 118: 59–66.
Rate, S.R. 2005: Invertebrate diversity and vegetation heterogeneity: plant-invertebrate relationships
in indigenous New Zealand grasslands. unpublished PhD thesis, Department of Botany,
university of Otago, Dunedin. 187 p.
Rice, L.A. 1932: The effect of fire on the prairie animal communities. Ecology 13: 392–401.
Ross, D.J.; Speir, T.W.; Tate, K.R.; Feltham, C.W. 2001: Burning in a New Zealand snow-tussock
grassland: effects on soil microbial biomass and nitrogen and phosphorus availability.
New Zealand Journal of Ecology 21: 63–71.

54 Barratt et al.—Impact of fire on tussock invertebrates
Saint-Germain, M.; Buddle, C.M.; Larrivee, M.; Mercado, A.; Motchula, T.; Reichert, e.; Sackett, T.e.;
Sylvain, Z.; Webb, A. 2007: Should biomass be considered more frequently as a currency in
terrestrial arthropod community analyses? Journal of Applied Ecology 44: 330–339.
Sarathchandra, S.u.; Burch, G.; Sayer, S.T.; Waipara, N.W.; Cox, N.R.; Ghani, A.; Bell, N.L.;
O’Callaghan, M.; Young, S.D.; Barratt, B.I.P.; Ferguson, C.M.; Townsend, R.J. 2005: Biodiversity
of indigenous tussock grassland sites in Otago, Canterbury and the Central North Island of
New Zealand. III Soil microorganisms. Journal of the Royal Society of New Zealand 35:
321–337.
Scott, M. 2007: Fine-scale ecology of alpine patterned ground, Old Man Range, Central Otago,
New Zealand. unpublished PhD thesis, Department of Botany, university of Otago, Dunedin.
338 p.
Swengel, A.B. 2001: A literature review of insect responses to fire, compared to other conservation
managements of open habitat. Biodiversity and Conservation 10: 1141–1169.
Tscharntke, T.; Greiler, H.-J. 1995: Insect communities, grasses, and grasslands. Annual Review of
Entomology 40: 535–558.
van Wagner, C.e. 1987: Development and structure of the Canadian Forest Fire Weather Index
System. Forestry Technical Report. Government of Canada, Canadian Forestry Service,
Ottawa, Ontario. 37 p.
Warren, S.D.; Scifres, C.J.; Teel, P.D. 1987: Response of grassland arthropods to burning: a review.
Agriculture, Ecosystems & Environment 19: 105–130.
Webb, N.R. 1994: Post-fire succession of cryptostigmatid mites (Acari, Cryptostigmata) in a Calluna-
heathland soil. Pedobiologia 38: 138–145.
White, e.G. 1972: Insect pests and management: why study population numbers? Tussock Grassland
and Mountain Lands Institute Review 23: 78–82.
Yeates, G.W.; Lee, W.G. 1997: Burning in a New Zealand snow-tussock grassland: effects on vegetation
and soil fauna. New Zealand Journal of Ecology 21: 73–79.
Zimmer, K.; Parmenter, R.R. 1998: Harvester ants and fire in a desert grassland: ecological responses
of Pogonomyrmex rugosus (Hymenoptera: Formicidae) to experimental wildfires in central
New Mexico. Environmental Entomology 27: 282–287.

55Science for Conservation 291
PHYLuM SuBPHYLuM CLASS ORDeR FAMILY COMMON NAMe
Platyhelminthes Turbellaria Flatworms
Annelida Oligochaeta Clitellata earthworms, potworms
Mollusca Gastropoda Pulmonata Slugs
Mollusca Gastropoda Pulmonata Snails
Arthropoda Chelicerata Arachnida Araneae Spiders
Arthropoda Chelicerata Arachnida Opiliones Harvestmen
Arthropoda Chelicerata Arachnida Pseudoscorpionida Pseudoscorpions
Arthropoda Crustacea Malacostraca Amphipoda Bush hoppers
Arthropoda Crustacea Malacostraca Isopoda Woodlice/slaters
Arthropoda Myriapoda Chilopoda Centipedes
Arthropoda Myriapoda Diplopoda Millipedes
Arthropoda Myriapoda Symphyla
Arthropoda Myriapoda Pauropoda
Arthropoda Hexapoda Diplura
Arthropoda Hexapoda entognatha Protura
Arthropoda Hexapoda Insecta Orthoptera Blattidae Cockroaches
Arthropoda Hexapoda Insecta Orthoptera Stenopelmatidae Weta
Arthropoda Hexapoda Insecta Orthoptera Acrididae Grasshoppers
Arthropoda Hexapoda Insecta Orthoptera Gryllidae Crickets
Arthropoda Hexapoda Insecta Dermaptera earwigs
Arthropoda Hexapoda Insecta Psocoptera Book-lice
Arthropoda Hexapoda Insecta Hemiptera Homoptera Aphids and others
Arthropoda Hexapoda Insecta Hemiptera Pseudococcidae Mealybugs
Arthropoda Hexapoda Insecta Hemiptera Heteroptera True bugs
Arthropoda Hexapoda Insecta Hymenoptera Formicidae Ants
Arthropoda Hexapoda Insecta Hymenoptera Other Hymenoptera Bees, wasps
Arthropoda Hexapoda Insecta Lepidoptera Butterflies, moths
Arthropoda Hexapoda Insecta Neuroptera Lacewings
Arthropoda Hexapoda Insecta Trichoptera Caddis flies
Arthropoda Hexapoda Insecta Coleoptera Anthicidae Ant beetles
Arthropoda Hexapoda Insecta Coleoptera Anthribidae Fungus weevils
Arthropoda Hexapoda Insecta Coleoptera Byrrhidae Moss beetles
Arthropoda Hexapoda Insecta Coleoptera Carabidae Ground beetles
Arthropoda Hexapoda Insecta Coleoptera Cerambycidae Longhorn beetles
Arthropoda Hexapoda Insecta Coleoptera Chrysomelidae Leaf beetles
Arthropoda Hexapoda Insecta Coleoptera Coccinellidae Ladybirds
Arthropoda Hexapoda Insecta Coleoptera Corylophidae Minute fungus beetles
Arthropoda Hexapoda Insecta Coleoptera Cryptophagidae Silken fungus beetles
Arthropoda Hexapoda Insecta Coleoptera Curculionidae Weevils
Arthropoda Hexapoda Insecta Coleoptera Dermestidae Carrion beetles
Arthropoda Hexapoda Insecta Coleoptera elateridae Click beetles
Arthropoda Hexapoda Insecta Coleoptera Latridiidae Mildew beetles
Appendix 1
T A x O N O M I C G R O u P S A N D C O M M O N N A M e S O F I N v e R T e B R A T e S I D e N T I F I e D
Continued on next page

56 Barratt et al.—Impact of fire on tussock invertebrates
Appendix 1—continued
Arthropoda Hexapoda Insecta Coleoptera Leiodidae Small carrion beetles
Arthropoda Hexapoda Insecta Coleoptera Melandryidae False darkling beetles
Arthropoda Hexapoda Insecta Coleoptera Melyridae Leaping beetles
Arthropoda Hexapoda Insecta Coleoptera Mycetophagidae Hairy fungus beetles
Arthropoda Hexapoda Insecta Coleoptera Oedemeridae Lax beetles
Arthropoda Hexapoda Insecta Coleoptera Ptiliidae Feather-winged beetles
Arthropoda Hexapoda Insecta Coleoptera Scarabaeidae Scarabs
Arthropoda Hexapoda Insecta Coleoptera Scirtidae Marsh beetles
Arthropoda Hexapoda Insecta Coleoptera Scydmaenidae Stone beetles
Arthropoda Hexapoda Insecta Coleoptera Staphylinidae Rove beetles
Arthropoda Hexapoda Insecta Coleoptera Tenebrionidae Darkling beetles
Arthropoda Hexapoda Insecta Diptera True flies
Arthropoda Hexapoda Insecta Thysanoptera Thrips
PHYLuM SuBPHYLuM CLASS ORDeR FAMILY COMMON NAMe

57Science for Conservation 291
Appendix 2
C O L e O P T e R A T A x A F O u N D A T D e e P S T R e A M A N D M O u N T B e N G e R
Native/adventive status, trophic group and presence at Deep Stream (DS) and
Mount Benger (MB) are indicated.
FAMILY TAxON NATIve/ TROPHIC PReSeNCe
ADveNTIve GROuP DS MB
Anthicidae Anthicus otagoensis Bates Native Carnivore ×
Anthicidae Anthicus sp. cf. minor Broun Native Carnivore ×
Anthribidae Euciodes suturalis Pascoe Adventive Herbivore ×
Archeocryptidae Archeocrypticus topali Kaszab Adventive Fungivore ×
Byrrhidae Byrrhidae MB larva sp. 1 Native Herbivore × ×
Byrrhidae Byrrhidae MB larva sp. 2 Native Herbivore ×
Byrrhidae Byrrhidae MB larva sp. 3 Native Herbivore × ×
Byrrhidae Byrrhidae MB larva sp. 4 Native Herbivore ×
Byrrhidae Microchaetes DS sp. 1 Native Herbivore × ×
Byrrhidae Microchaetes MB sp. 1 Native Herbivore ×
Byrrhidae Synorthus DS sp. 1 Native Herbivore × ×
Byrrhidae Synorthus MB sp. 1 Native Herbivore ×
Byrrhidae Synorthus MB sp. 2 Native Herbivore ×
Cantharidae Asilis subnuda Broun Native Carnivore ×
Cantharidae Cantharidae DS larva sp. 1 Native Carnivore × ×
Carabidae Anchonemus otagoensis (Bates) Native Carnivore × ×
Carabidae Bembidion MB sp. 1 Native Carnivore ×
Carabidae Carabidae DS larva sp. 1 Native Carnivore ×
Carabidae Carabidae DS larva sp. 2 Native Carnivore × ×
Carabidae Carabidae DS larva sp. 3 Native Carnivore ×
Carabidae Carabidae DS larva sp. 4 Native Carnivore × ×
Carabidae Carabidae DS larva sp. 5 Native Carnivore ×
Carabidae Carabidae MB larva sp. 1 Native Carnivore ×
Carabidae Carabidae MB larva sp. 2 Native Carnivore × ×
Carabidae Carabidae MB larva sp. 3 Native Carnivore × ×
Carabidae Carabidae MB larva sp. 4 Native Carnivore × ×
Carabidae Carabidae MB larva sp. 5 Native Carnivore × ×
Carabidae Demetrida moesta Sharp Native Carnivore × ×
Carabidae Dicrochile novaezelandiae (Fairmaire) Native Carnivore ×
Carabidae Holcaspis placida Broun Native Carnivore ×
Carabidae Holcaspis punctigera Broun Native Carnivore × ×
Carabidae Mecodema minax Britton Native Carnivore ×
Carabidae Mecyclothorax rotundicollis (White) Native Carnivore ×
Carabidae Megadromus fultoni/meritus Native Carnivore ×
Carabidae Notagonum sp. cf. feredayi (Bates) Native Carnivore ×
Carabidae Oopterus DS sp. 1 Native Carnivore ×
Carabidae Oopterus MB sp. 1 Native Carnivore ×
Carabidae Oregus aereus White Native Carnivore × ×
Carabidae Pelodiaetus MB sp. 1 Native Carnivore ×
Continued on next page

58 Barratt et al.—Impact of fire on tussock invertebrates
Carabidae Scopodes cognatus Broun Native Carnivore ×
Carabidae Scopodes edwardsi Bates Native Carnivore ×
Carabidae Scopodes fossulatus (Blanchard) Native Carnivore × ×
Cerambycidae Cerambycidae DS larva sp. 1 Native Herbivore ×
Cerambycidae Ptinosoma spinicolle Broun Native Herbivore ×
Cerambycidae Somatidia DS sp. 1 Native Herbivore ×
Chrysomelidae Adoxia pygidialis (Broun) Native Herbivore × ×
Chrysomelidae Allocharis DS sp. 1 Native Herbivore ×
Chrysomelidae Allocharis limbata Broun Native Herbivore ×
Chrysomelidae Allocharis MB sp. 1 Native Herbivore × ×
Chrysomelidae Chaetocnema DS sp. 1 Native Herbivore × ×
Chrysomelidae Chaetocnema DS sp. 2 Native Herbivore ×
Chrysomelidae Chaetocnema MB sp. 1 Native Herbivore ×
Chrysomelidae Chaetocnema MB sp. 2 Native Herbivore ×
Chrysomelidae Chrysomelidae DS larva sp. 1 Native Herbivore ×
Chrysomelidae Chrysomelidae DS sp. 2 Native Herbivore ×
Chrysomelidae Galerucinae MB larva sp. 1 Native Herbivore × ×
Chrysomelidae Galerucinae MB larva sp. 2 Native Herbivore × ×
Coccinellidae ?Rhizobius MB sp. 2 Native Carnivore ×
Coccinellidae ?Rhizobius MB sp. 3 Native Carnivore ×
Coccinellidae ?Rhizobius MB sp. 4 Native Carnivore ×
Coccinellidae Coccinella 11-punctata L. Adventive Carnivore × ×
Coccinellidae Coccinella leonina F. Adventive Carnivore × ×
Coccinellidae Coccinellidae DS larva sp. 1 Native Carnivore × ×
Coccinellidae Coccinellidae DS larva sp. 2 Native Carnivore × ×
Coccinellidae Coccinellidae DS larva sp. 3 Native Carnivore × ×
Coccinellidae Coccinellidae DS larva sp. 4 Native Carnivore ×
Coccinellidae Coccinellidae DS larva sp. 5 Adventive Carnivore × ×
Coccinellidae Coccinellidae DS sp. 1 Native Carnivore ×
Coccinellidae Coccinellidae DS sp. 2 Native Carnivore × ×
Coccinellidae Coccinellidae DS sp. 3 Native Carnivore ×
Coccinellidae Coccinellidae MB larva sp. 1 Native Carnivore ×
Coccinellidae Coccinellidae MB sp. 1 Native Carnivore ×
Coccinellidae Coccinellidae MB sp. 4 Native Carnivore ×
Coccinellidae Veronicobius sp. cf. tristis Native Carnivore × ×
Corylophidae Corylophidae DS larva sp. 1 Native Fungivore ×
Corylophidae Corylophidae MB larva sp. 1 Native Fungivore ×
Corylophidae Holopsis DS sp. 1 Native Fungivore × ×
Corylophidae Holopsis DS sp. 2 Native Fungivore × ×
Cryptophagidae Antarcticotectus silvanus Native Fungivore × ×
Cryptophagidae Cryptophagidae DS larva sp. 1 Native Fungivore ×
Cryptophagidae Cryptophagus DS sp. 1 Adventive Fungivore ×
Cryptophagidae Cryptophagus DS sp. 2 Adventive Fungivore × ×
Curculionidae ?Crisius MB sp. 2 Native Herbivore ×
Curculionidae Athor arcifer Broun Native Herbivore ×
Curculionidae Baeosomus amplus Broun Native Herbivore × ×
Curculionidae Baeosomus DS sp. 4 Native Herbivore × ×
Curculionidae Baeosomus DS sp. 6 Native Herbivore × ×
Curculionidae Baeosomus MB sp. 1 Native Herbivore × ×
FAMILY TAxON NATIve/ TROPHIC PReSeNCe
ADveNTIve GROuP DS MB
Appendix 2—continued
Continued on next page

59Science for Conservation 291
Curculionidae Baeosomus rugosus Broun Native Herbivore × ×
Curculionidae Baeosomus sp. cf. angustus (Broun) Native Herbivore × ×
Curculionidae Baeosomus sp. cf. crassipes (Broun) Native Herbivore × ×
Curculionidae Catoptes cuspidatus (Broun) Native Herbivore × ×
Curculionidae Catoptes dispar Broun Native Herbivore ×
Curculionidae Catoptes DS sp. 1 Native Herbivore × ×
Curculionidae Catoptes robustus Sharp Native Herbivore ×
Curculionidae Cryptorhynchini MB sp. 1 Native Herbivore ×
Curculionidae Curculionidae DS larva sp. 2 Native Herbivore ×
Curculionidae Curculionidae MB larva sp. 1 Native Herbivore × ×
Curculionidae Curculionidae MB larva sp. 2 Native Herbivore × ×
Curculionidae Curculionidae MB larva sp. 3 Native Herbivore × ×
Curculionidae Curculionidae MB larva sp. 4 Native Herbivore ×
Curculionidae Eugnomus dispar (Broun) Native Herbivore ×
Curculionidae Eugnomus durvillei Schonherr Native Herbivore × ×
Curculionidae Gromilus DS sp. 1 Native Herbivore ×
Curculionidae Gromilus DS sp. 2 Native Herbivore ×
Curculionidae Gromilus impressus (Broun) Native Herbivore ×
Curculionidae Gromilus MB sp. 1 Native Herbivore ×
Curculionidae Gromilus MB sp. 2 Native Herbivore ×
Curculionidae Irenimus curvus Barratt & Kuschel Native Herbivore × ×
Curculionidae Irenimus posticalis (Broun) Native Herbivore ×
Curculionidae Irenimus stolidus Broun Native Herbivore × ×
Curculionidae Listronotus bonariensis (Kuschel) Adventive Herbivore × ×
Curculionidae Nestrius DS sp. 1 Native Herbivore ×
Curculionidae Nestrius MB sp. 1 Native Herbivore ×
Curculionidae Nestrius MB sp. 2 Native Herbivore ×
Curculionidae Nestrius MB sp. 3 Native Herbivore ×
Curculionidae Nestrius MB sp. 4 Native Herbivore ×
Curculionidae Nicaeana cinerea Broun Native Herbivore × ×
Curculionidae Otiorhynchus ovatus L. Adventive Herbivore ×
Curculionidae Peristoreus ?sexmaculatus (Broun) Native Herbivore ×
Curculionidae Peristoreus insignis (Broun) Native Herbivore × ×
Curculionidae Peristoreus MB sp. 2 Native Herbivore ×
Curculionidae Peristoreus veronicae (Broun) Native Herbivore ×
Curculionidae Rhopalomerus alternans (Broun) Native Herbivore ×
Curculionidae Sitona discoideus Gyllenhal Adventive Herbivore ×
Curculionidae Tanysoma angustulum Broun Native Herbivore ×
Curculionidae Trichosirocalus horridus (Panzer) Adventive Herbivore ×
Curculionidae Trinodicalles MB sp. 1 Native Herbivore ×
Dermestidae Anthrenocerus australis (Hope) Adventive Carrion ×
Dermestidae Dermestidae DS larva sp. 2 Native Carrion ×
Dermestidae Dermestidae DS larva sp. 3 Native Carrion ×
Dermestidae Dermestidae MB larva sp. 1 Native Carrion × ×
Dermestidae Reesa vespulae (Milliron) Adventive Carrion × ×
elateridae Betarmonides DS sp. 1 Native Herbivore ×
elateridae elateridae DS larva sp. 1 Native Herbivore ×
elateridae elateridae DS sp. 1 Native Herbivore ×
elateridae elateridae MB larva sp. 1 Native Herbivore × ×
FAMILY TAxON NATIve/ TROPHIC PReSeNCe
ADveNTIve GROuP DS MB
Appendix 2—continued
Continued on next page

60 Barratt et al.—Impact of fire on tussock invertebrates
elateridae elateridae MB larva sp. 2 Native Herbivore × ×
elateridae elateridae MB sp. 1 Native Herbivore × ×
elateridae elateridae MB sp. 2 Native Herbivore ×
elateridae Elatichrosis sp. cf. ‘castanea’ (Broun) Native Herbivore × ×
erotylidae Loberus anthracinus (Broun) Native Fungivore ×
Latridiidae ?Corticaria DS sp. 4 Native Fungivore × ×
Latridiidae Aridius bifasciatus (Reitter) Adventive Fungivore × ×
Latridiidae Cartodere DS sp. 1 Adventive Fungivore ×
Latridiidae Corticaria formicaephila (Broun) Native Fungivore × ×
Latridiidae Corticaria serrata (Paykull) Adventive Fungivore × ×
Latridiidae Latridiidae DS larva sp. 1 Native Fungivore ×
Latridiidae Melanopthalma DS sp. 2 Native Fungivore ×
Latridiidae Melanopthalma gibbosa (Herbst) Native Fungivore × ×
Leiodidae Inocatops compactus (Broun) Native Fungivore × ×
Leiodidae Isocolon modestum Broun Native Fungivore ×
Leiodidae Leiodidae DS larva sp. 1 Native Fungivore ×
Melandryidae Hylobia MB sp. 1 Native Fungivore ×
Melyridae Arthracanthus DS sp. 1 Native Herbivore × ×
Melyridae Melyridae DS larva sp. 1 Native Carnivore × ×
Mycetophagidae Mycetophagidae DS sp. 1 Native Fungivore ×
Mycetophagidae Mycetophagidae MB larva sp. 1 Native Fungivore ×
Mycetophagidae Mycetophagidae MB larva sp. 2 Native Fungivore ×
Mycetophagidae Typhaea sterocorea L. Adventive Fungivore ×
Oedemeridae Thelyphassa nemoralis (Broun) Native Fungivore ×
Ptiliidae Ptinella DS sp. 1 Native Fungivore × ×
Ptiliidae Ptinella DS sp. 2 Native Fungivore × ×
Ptiliidae Ptinella MB sp. 1 Native Fungivore × ×
Scarabaeidae Costelytra zealandica (White) Native Herbivore ×
Scarabaeidae Odontria striata White Native Herbivore ×
Scarabaeidae Odontria striata White larva Native Herbivore × ×
Scarabaeidae Pyronota DS larva sp. 1 Native Herbivore ×
Scarabaeidae Pyronota festiva (F.) Native Herbivore × ×
Scirtidae Scirtidae MB sp. 1 Native Herbivore ×
Scirtidae Scirtidae MB sp. 2 Native Herbivore ×
Scolytidae Hylastes ater (Paykull) Adventive Herbivore ×
Scraptiidae Nothotelus DS sp. 1 Native Herbivore ×
Scydmaenidae Scydmaenidae DS larva sp. 1 Native Carnivore × ×
Scydmaenidae Scydmaenidae DS larva sp. 2 Native Carnivore ×
Scydmaenidae Scydmaenidae DS sp. 1 Native Carnivore ×
Scydmaenidae Scydmaenidae DS sp. 2 Native Carnivore × ×
Scydmaenidae Scydmaenidae DS sp. 3 Native Carnivore ×
Scydmaenidae Scydmaenidae MB larva sp. 1 Native Carnivore ×
Staphylinidae Agnostethus DS sp. 1 Native Carnivore ×
Staphylinidae Agnostethus DS sp. 2 Native Carnivore ×
Staphylinidae Agnostethus MB sp. 1 Native Carnivore ×
Staphylinidae Aleocharinae Cass sp. 1 Native Carnivore × ×
Staphylinidae Aleocharinae DS sp. 1 Native Carnivore × ×
Staphylinidae Aleocharinae DS sp. 10 Native Carnivore ×
Staphylinidae Aleocharinae DS sp. 13 Native Carnivore ×
FAMILY TAxON NATIve/ TROPHIC PReSeNCe
ADveNTIve GROuP DS MB
Appendix 2—continued
Continued on next page

61Science for Conservation 291
Staphylinidae Aleocharinae DS sp. 2 Native Carnivore × ×
Staphylinidae Aleocharinae DS sp. 3 Native Carnivore ×
Staphylinidae Aleocharinae DS sp. 4 Native Carnivore ×
Staphylinidae Aleocharinae DS sp. 5 Native Carnivore ×
Staphylinidae Aleocharinae DS sp. 6 Native Carnivore × ×
Staphylinidae Aleocharinae DS sp. 7 Native Carnivore ×
Staphylinidae Aleocharinae DS sp. 8 Native Carnivore ×
Staphylinidae Aleocharinae DS sp. 9 Native Carnivore × ×
Staphylinidae Aleocharinae MB sp. 1 Native Carnivore × ×
Staphylinidae Aleocharinae MB sp. 2 Native Carnivore ×
Staphylinidae Aleocharinae MB sp. 3 Native Carnivore ×
Staphylinidae Aleocharinae MB sp. 4 Native Carnivore × ×
Staphylinidae Aleocharinae MB sp. 5 Native Carnivore ×
Staphylinidae Aleocharinae MB sp. 6 Native Carnivore ×
Staphylinidae Anabaxis Tukino sp. 1 Native Carnivore × ×
Staphylinidae Eupines DS sp. 1 Native Carnivore × ×
Staphylinidae Eupines MB sp. 1 Native Carnivore ×
Staphylinidae Habrocerinae DS sp. 1 Native Carnivore ×
Staphylinidae Hyperomma DS sp. 1 Native Carnivore × ×
Staphylinidae Maorothius DS sp. 1 Native Carnivore ×
Staphylinidae Microsilpha DS sp. 2 Native Carnivore ×
Staphylinidae Microsilpha DS sp. 3 Native Carnivore ×
Staphylinidae Paraphytopus DS sp. 1 Native Carnivore × ×
Staphylinidae Protopristus DS sp. 1 Native Carnivore × ×
Staphylinidae Protopristus DS sp. 2 Native Carnivore × ×
Staphylinidae Protopristus DS sp. 3 Native Carnivore × ×
Staphylinidae Protopristus MB sp. 1 Native Carnivore × ×
Staphylinidae Pselaphaulax DS sp. 1 Native Carnivore × ×
Staphylinidae Pselaphinae DS larva sp. 1 Native Carnivore × ×
Staphylinidae Pselaphinae DS sp. 1 Native Carnivore × ×
Staphylinidae Pselaphinae DS sp. 2 Native Carnivore × ×
Staphylinidae Pselaphinae DS sp. 3 Native Carnivore ×
Staphylinidae Pselaphinae DS sp. 4 Native Carnivore × ×
Staphylinidae Pselaphinae DS sp. 5 Native Carnivore × ×
Staphylinidae Pselaphinae DS sp. 6 Native Carnivore ×
Staphylinidae Pselaphinae DS sp. 7 Native Carnivore × ×
Staphylinidae Pselaphinae DS sp. 9 Native Carnivore ×
Staphylinidae Pselaphinae MB larva sp. 1 Native Carnivore × ×
Staphylinidae Pselaphinae MB larva sp. 2 Native Carnivore × ×
Staphylinidae Pselaphinae MB sp. 1 Native Carnivore ×
Staphylinidae Pselaphinae MB sp. 2 Native Carnivore ×
Staphylinidae Pselaphinae MB sp. 3 Native Carnivore ×
Staphylinidae Pselaphinae MB sp. 4 Native Carnivore × ×
Staphylinidae Pselaphinae MB sp. 5 Native Carnivore × ×
Staphylinidae Pselaphinae Tukino sp. 2 Native Carnivore ×
Staphylinidae Pselaphophus atriventris (Westwood) Adventive Carnivore ×
Staphylinidae Pselaphophus MB sp. 1 Adventive Carnivore ×
Staphylinidae ‘Quedius’ DS sp. 1 Adventive Carnivore ×
Staphylinidae ‘Quedius’ MB sp. 1 Adventive Carnivore ×
FAMILY TAxON NATIve/ TROPHIC PReSeNCe
ADveNTIve GROuP DS MB
Appendix 2—continued
Continued on next page

62 Barratt et al.—Impact of fire on tussock invertebrates
Staphylinidae Sagola DS sp. 1 Native Carnivore ×
Staphylinidae Staphylinidae DS larva sp. 1 Native Carnivore ×
Staphylinidae Staphylinidae DS larva sp. 2 Native Carnivore ×
Staphylinidae Staphylinidae DS larva sp. 3 Native Carnivore ×
Staphylinidae Staphylinidae DS larva sp. 6 Native Carnivore × ×
Staphylinidae Staphylinidae DS larva sp. 8 Native Carnivore ×
Staphylinidae Staphylinidae MB larva sp. 1 Native Carnivore × ×
Staphylinidae Staphylinidae MB larva sp. 2 Native Carnivore × ×
Staphylinidae Staphylinidae MB larva sp. 3 Native Carnivore × ×
Staphylinidae Staphylinidae MB larva sp. 4 Native Carnivore × ×
Staphylinidae Staphylinidae MB larva sp. 5 Native Carnivore × ×
Staphylinidae Staphylinidae MB larva sp. 6 Native Carnivore × ×
Staphylinidae Staphylinidae MB larva sp. 7 Native Carnivore × ×
Staphylinidae Staphylininae DS sp. 1 Native Carnivore ×
Staphylinidae Staphylininae DS sp. 2 Native Carnivore ×
Staphylinidae Tachyporinae MB sp. 1 Native Carnivore ×
Staphylinidae Tachyporus nitidulus (F.) Adventive Carnivore ×
Staphylinidae Zealandius DS sp. 1 Native Carnivore × ×
Staphylinidae Zealandius DS sp. 2 Native Carnivore × ×
Tenebrionidae Lorelus tarsalis Broun Native Herbivore ×
Tenebrionidae Tenebrionidae DS larva sp. 1 Native Herbivore × ×
Tenebrionidae Tenebrionidae DS larva sp. 2 Native Herbivore × ×
Tenebrionidae Zeadelium aeratum (Broun) Native Herbivore ×
Tenebrionidae Zeadelium chalmeri (Broun) Native Herbivore ×
Tenebrionidae Zeadelium hudsoni (Broun) Native Herbivore × ×
Tenebrionidae Zeadelium senile Watt Native Herbivore × ×
Tenebrionidae Zeadelium sp. cf. nigritulum (Broun) Native Herbivore ×
Trogossitidae Trogossitidae MB sp. 1 Native Fungivore ×
Zopheridae Bitoma morosa (Broun) Native Fungivore ×
Zopheridae Notocoxellus MB sp. 1 Native Fungivore ×
Zopheridae Pristoderus DS sp. 1 Native Fungivore ×
Zopheridae Pristoderus MB sp. 3 Native Fungivore ×
FAMILY TAxON NATIve/ TROPHIC PReSeNCe
ADveNTIve GROuP DS MB
Appendix 2—continued
63Science for Conservation 291
Appendix 3
N O T e S O N I D e N T I F I C A T I O N A N D e C O L O G Y O F S O M e S P e C I e S
A3.1 Mollusca
The snail fauna has been examined by Frank Climo (c/- Te Papa Museum). Despite
being relatively low in abundance, the fauna was of great interest, possibly
because it has been so poorly collected from tussock grassland areas such as
our sites in the past. The collection has extended the range of some species
and added considerably to the quantity of known specimens for some species.
Notably, Flammulina n. sp. (Amphodoxinae) was known previously from only
two specimens from Governor’s Bush, Mt Cook; this species was found to be
well represented in the material from Deep Stream.
A3.2 Amphipoda
Terrestrial amphipods are litter dwellers, feeding on decaying organic material,
and dependent upon a moist, humid habitat. It has been noted by Friend &
Richardson (1986) that only the hardiest groups of terrestrial amphipods have
extended their range from forest into grassland environments. The talitrid Makawe
(= Orchestia) hurleyi (Duncan) is known to have successfully colonised eastern
South Island grassland and can reach densities of 300/m2 in disturbed grassland
(Duncan 1969), although it is limited to areas where rainfall is above about
600 mm per annum. Identification of the species most commonly found in the
current study has not been confirmed, but is likely to be Parorchestia tenuis
(Dana), given the characteristics described by Duncan (1994).
A3.3 Hymenoptera: Formicidae
In our study, the ant fauna was represented by three species, which were present
at both sites. The predominant species found was the widespread endemic
Monomorium antarcticum (Fr. Smith), which is a generalist feeder, preying
on small insects, harvesting small seeds, and ‘milking’ homopterans (Don 2007).
The population density reduction following fire could be attributable to reduced
prey items and seed availability, since it would be expected that in the event
of fire, population survival in subterranean nests (to which the highly mobile
individuals would most likely retreat) might be quite high. The other two species
found were the endemic Huberia striata (Fr. Smith), and the adventive species
Prolasius advena (Fr. Smith), both of which were present in comparatively low
numbers.

64 Barratt et al.—Impact of fire on tussock invertebrates
A3.4 Hemiptera: Pseudococcidae
Although a full identification of all pseudococcid material has not been carried
out, a subsample was examined, within which three species were identified
(Rosa Henderson, Landcare Research, pers. comm. 2000). These were Ventrispina
otagoensis (Brittin), Laminicoccus eastopi Cox, and Balanococcus danthoniae
(Morrison). Ventrispina otagoensis is found throughout New Zealand and has
been associated with Poaceae, Rosaceae and mosses. Laminicoccus eastopi has
been recorded from Chionochloa spp., and B. danthoniae from a number of
grass species where it feeds in the leaf sheaths.
A3.5 Thysanoptera
At Deep Stream, the predominant species of Thysanoptera found was Aptinothrips
rufus (Haliday), an exotic, cosmopolitan species known as the grass thrips. This
species has a wide plant host range (Mound & Walker 1982) and was mainly
responsible for the ‘outbreak’ in thrips densities that occurred 1–2 years
post-burn. Also present but far less abundant were Aptinothrips stylifer Trybom,
which is well known from South Island tussock grassland; Chirothrips manicatus
(Haliday), known as Timothy thrips, which is associated with exotic and native
grasses; the exotic tubuliferan spore-feeding Nesothrips propinquus (Bagnall),
which is also well known from tussock grassland; and the long-tailed tubuliferan
Baenothrips moundi (Stannard), another exotic species from Australia that
feeds on fungal hyphae in leaf litter (Mound & Walker 1982). At Mount Benger,
the same Aptinothrips species were present, as well as two Australian species
that were recorded from sub-alpine tussock grass bases, Carientothrips badius
(Hood) and Emprosthiothrips sp. The New Zealand flower thrips, Thrips
obscuratus (Crawford), was also present; this is a New Zealand native species
found in inflorescences of a wide range of species and sometimes considered
a pest. Lawrence Mound (CSIRO, Canberra), who examined some of the thrips
material from these sites, commented that he was surprised to see so few native
species.
A3.6 Coleoptera: Ptiliidae
Taxonomy of the Ptiliidae, a family of minute beetles commonly known as
feather-wing beetles, was revised in 1982 (Johnson 1982). To date, 56 species
in 13 genera have been recognised from New Zealand. very little information
is given in the revision about the biology or ecology of the group, but they are
believed to be fungivores, feeding on fungal spores and hyphae (Lawrence &
Britton 1994; Klimaszewski & Watt 1997). Published observations have shown
that ptiliids tend to be found in very moist environments (haystack bottoms,
compost, litter, moss, under bark, etc.). One species has been found only in
deeply set pitfall traps, suggesting that it lives in the soil. In the current study,
the species found were mainly present in tussock samples at the two sites and
seem best to fit the genus Ptinella, which is a large genus with species that are
typically difficult to differentiate. No members of this genus seem to have been
associated previously with Chionochloa species. However, Johnson (1975) had
recorded species occurring on Poa tussock bases and extracted from tussock leaf
mould on subantarctic islands.

65Science for Conservation 291
Appendix 4
M e A N D e N S I T Y O F I N v e R T e B R A T e G R O u P S A T D e e P S T R e A M
Graphs show the mean density (number individuals/m2) of invertebrate groups
present in control, spring-burnt (SprB) and summer-burnt (SumB) plots. Density
is expressed as loge mean density throughout the study period. error bars
represent 2 SeMs. Arrows indicate summer (black arrow) and spring (grey arrow)
burn dates.
0123456789
10
Jan-
99A
pr-9
9Ju
l-99
Oct
-99
Jan-
00A
pr-0
0Ju
l-00
Oct
-00
Jan-
01A
pr-0
1Ju
l-01
Oct
-01
Jan-
02A
pr-0
2Ju
l-02
Oct
-02
Jan-
03A
pr-0
3Ju
l-03
Oct
-03
Jan-
04A
pr-0
4Ju
l-04
Oct
-04
Jan-
05
Annelida, turf samples
Loge
mea
n de
nsity
0123456789
10
Jan-
99A
pr-9
9Ju
l-99
Oct
-99
Jan-
00A
pr-0
0Ju
l-00
Oct
-00
Jan-
01A
pr-0
1Ju
l-01
Oct
-01
Jan-
02A
pr-0
2Ju
l-02
Oct
-02
Jan-
03A
pr-0
3Ju
l-03
Oct
-03
Jan-
04A
pr-0
4Ju
l-04
Oct
-04
Jan-
05
Annelida, tussock samples
0123456789
10
Jan-
99A
pr-9
9Ju
l-99
Oct
-99
Jan-
00A
pr-0
0Ju
l-00
Oct
-00
Jan-
01A
pr-0
1Ju
l-01
Oct
-01
Jan-
02A
pr-0
2Ju
l-02
Oct
-02
Jan-
03A
pr-0
3Ju
l-03
Oct
-03
Jan-
04A
pr-0
4Ju
l-04
Oct
-04
Jan-
05
Total Arachnida, tussock samples
0123456789
10
Jan-
99Ap
r-99
Jul-9
9O
ct-9
9Ja
n-00
Apr-0
0Ju
l-00
Oct
-00
Jan-
01Ap
r-01
Jul-0
1O
ct-0
1Ja
n-02
Apr-0
2Ju
l-02
Oct
-02
Jan-
03Ap
r-03
Jul-0
3O
ct-0
3Ja
n-04
Apr-0
4Ju
l-04
Oct
-04
Jan-
05
Total Arachnida, turf samples
Loge
mea
n de
nsity
0123456789
10
Jan-
99A
pr-9
9Ju
l-99
Oct
-99
Jan-
00A
pr-0
0Ju
l-00
Oct
-00
Jan-
01A
pr-0
1Ju
l-01
Oct
-01
Jan-
02A
pr-0
2Ju
l-02
Oct
-02
Jan-
03A
pr-0
3Ju
l-03
Oct
-03
Jan-
04A
pr-0
4Ju
l-04
Oct
-04
Jan-
05
Arachnida: Araneae, tussock samples
0123456789
10
Jan-
99Ap
r-99
Jul-9
9O
ct-9
9Ja
n-00
Apr-0
0Ju
l-00
Oct
-00
Jan-
01Ap
r-01
Jul-0
1O
ct-0
1Ja
n-02
Apr-0
2Ju
l-02
Oct
-02
Jan-
03Ap
r-03
Jul-0
3O
ct-0
3Ja
n-04
Apr-0
4Ju
l-04
Oct
-04
Jan-
05
Arachnida: Araneae, turf samples
Loge
mea
n de
nsity
Control SprB SumB
Continued on next page
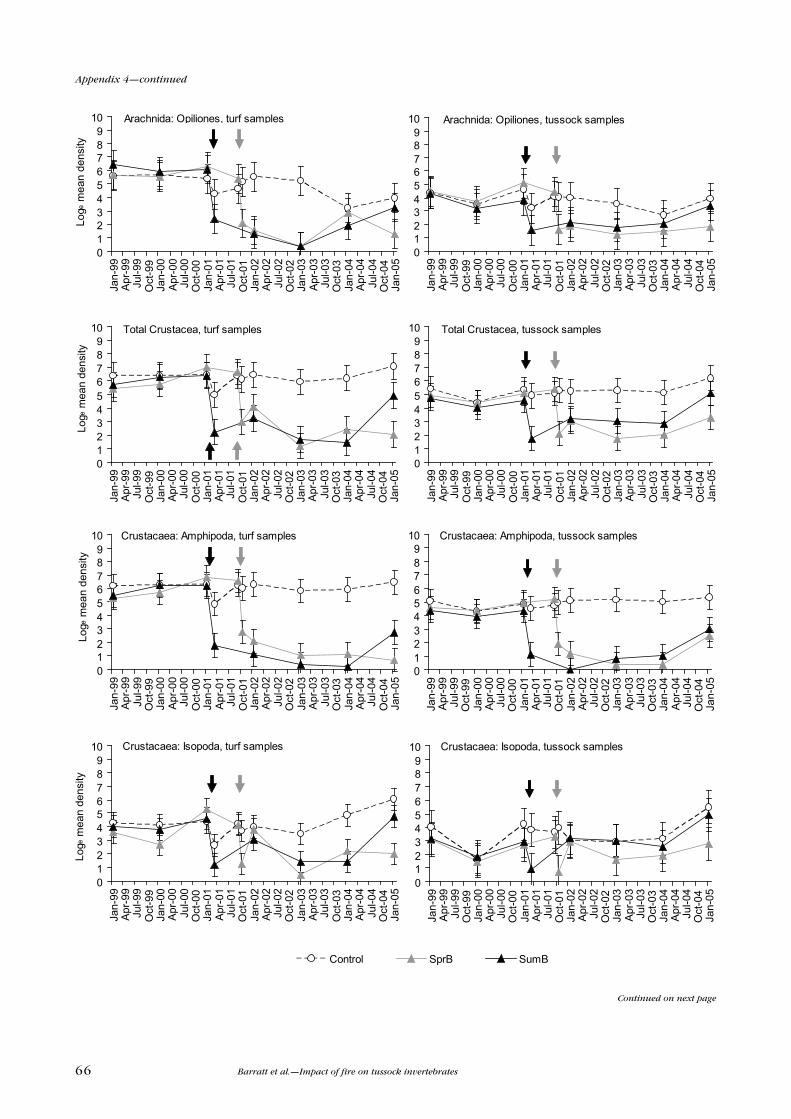
66 Barratt et al.—Impact of fire on tussock invertebrates
0123456789
10
Jan-
99A
pr-9
9Ju
l-99
Oct
-99
Jan-
00A
pr-0
0Ju
l-00
Oct
-00
Jan-
01A
pr-0
1Ju
l-01
Oct
-01
Jan-
02A
pr-0
2Ju
l-02
Oct
-02
Jan-
03A
pr-0
3Ju
l-03
Oct
-03
Jan-
04A
pr-0
4Ju
l-04
Oct
-04
Jan-
05
Arachnida: Opiliones, tussock samples
0123456789
10Ja
n-99
Apr
-99
Jul-9
9O
ct-9
9Ja
n-00
Apr
-00
Jul-0
0O
ct-0
0Ja
n-01
Apr
-01
Jul-0
1O
ct-0
1Ja
n-02
Apr
-02
Jul-0
2O
ct-0
2Ja
n-03
Apr
-03
Jul-0
3O
ct-0
3Ja
n-04
Apr
-04
Jul-0
4O
ct-0
4Ja
n-05
Arachnida: Opiliones, turf samples
Loge
mea
n de
nsity
0123456789
10
Jan-
99Ap
r-99
Jul-9
9O
ct-9
9Ja
n-00
Apr-0
0Ju
l-00
Oct
-00
Jan-
01Ap
r-01
Jul-0
1O
ct-0
1Ja
n-02
Apr-0
2Ju
l-02
Oct
-02
Jan-
03Ap
r-03
Jul-0
3O
ct-0
3Ja
n-04
Apr-0
4Ju
l-04
Oct
-04
Jan-
05
Total Crustacea, turf samples
Loge
mea
n de
nsity
0123456789
10
Jan-
99Ap
r-99
Jul-9
9O
ct-9
9Ja
n-00
Apr-0
0Ju
l-00
Oct
-00
Jan-
01Ap
r-01
Jul-0
1O
ct-0
1Ja
n-02
Apr-0
2Ju
l-02
Oct
-02
Jan-
03Ap
r-03
Jul-0
3O
ct-0
3Ja
n-04
Apr-0
4Ju
l-04
Oct
-04
Jan-
05
Total Crustacea, tussock samples
0123456789
10
Jan-
99A
pr-9
9Ju
l-99
Oct
-99
Jan-
00A
pr-0
0Ju
l-00
Oct
-00
Jan-
01A
pr-0
1Ju
l-01
Oct
-01
Jan-
02A
pr-0
2Ju
l-02
Oct
-02
Jan-
03A
pr-0
3Ju
l-03
Oct
-03
Jan-
04A
pr-0
4Ju
l-04
Oct
-04
Jan-
05
Crustacaea: Amphipoda, turf samples
Loge
mea
n de
nsity
0123456789
10
Jan-
99A
pr-9
9Ju
l-99
Oct
-99
Jan-
00A
pr-0
0Ju
l-00
Oct
-00
Jan-
01A
pr-0
1Ju
l-01
Oct
-01
Jan-
02A
pr-0
2Ju
l-02
Oct
-02
Jan-
03A
pr-0
3Ju
l-03
Oct
-03
Jan-
04A
pr-0
4Ju
l-04
Oct
-04
Jan-
05
Crustacaea: Amphipoda, tussock samples
0123456789
10
Jan-
99A
pr-9
9Ju
l-99
Oct
-99
Jan-
00A
pr-0
0Ju
l-00
Oct
-00
Jan-
01A
pr-0
1Ju
l-01
Oct
-01
Jan-
02A
pr-0
2Ju
l-02
Oct
-02
Jan-
03A
pr-0
3Ju
l-03
Oct
-03
Jan-
04A
pr-0
4Ju
l-04
Oct
-04
Jan-
05
Crustacaea: Isopoda, turf samples
Loge
mea
n de
nsity
0123456789
10
Jan-
99A
pr-9
9Ju
l-99
Oct
-99
Jan-
00A
pr-0
0Ju
l-00
Oct
-00
Jan-
01A
pr-0
1Ju
l-01
Oct
-01
Jan-
02A
pr-0
2Ju
l-02
Oct
-02
Jan-
03A
pr-0
3Ju
l-03
Oct
-03
Jan-
04A
pr-0
4Ju
l-04
Oct
-04
Jan-
05
Crustacaea: Isopoda, tussock samples
Control SprB SumB
Continued on next page
Appendix 4—continued

67Science for Conservation 291
0123456789
10Ja
n-99
Apr-9
9Ju
l-99
Oct
-99
Jan-
00Ap
r-00
Jul-0
0O
ct-0
0Ja
n-01
Apr-0
1Ju
l-01
Oct
-01
Jan-
02Ap
r-02
Jul-0
2O
ct-0
2Ja
n-03
Apr-0
3Ju
l-03
Oct
-03
Jan-
04Ap
r-04
Jul-0
4O
ct-0
4Ja
n-05
Total Myriopoda, turf samples
Loge
mea
n de
nsity
0123456789
10
Jan-
99Ap
r-99
Jul-9
9O
ct-9
9Ja
n-00
Apr-0
0Ju
l-00
Oct
-00
Jan-
01Ap
r-01
Jul-0
1O
ct-0
1Ja
n-02
Apr-0
2Ju
l-02
Oct
-02
Jan-
03Ap
r-03
Jul-0
3O
ct-0
3Ja
n-04
Apr-0
4Ju
l-04
Oct
-04
Jan-
05
Total Myriopoda, tussock samples
0123456789
10
Jan-
99A
pr-9
9Ju
l-99
Oct
-99
Jan-
00A
pr-0
0Ju
l-00
Oct
-00
Jan-
01A
pr-0
1Ju
l-01
Oct
-01
Jan-
02A
pr-0
2Ju
l-02
Oct
-02
Jan-
03A
pr-0
3Ju
l-03
Oct
-03
Jan-
04A
pr-0
4Ju
l-04
Oct
-04
Jan-
05
Myriapoda: Chilopoda, turf samples
Loge
mea
n de
nsity
0123456789
10
Jan-
99A
pr-9
9Ju
l-99
Oct
-99
Jan-
00A
pr-0
0Ju
l-00
Oct
-00
Jan-
01A
pr-0
1Ju
l-01
Oct
-01
Jan-
02A
pr-0
2Ju
l-02
Oct
-02
Jan-
03A
pr-0
3Ju
l-03
Oct
-03
Jan-
04A
pr-0
4Ju
l-04
Oct
-04
Jan-
05
Myriapoda: Chilipoda, tussock samples
0123456789
10
Jan-
99Ap
r-99
Jul-9
9O
ct-9
9Ja
n-00
Apr-0
0Ju
l-00
Oct
-00
Jan-
01Ap
r-01
Jul-0
1O
ct-0
1Ja
n-02
Apr-0
2Ju
l-02
Oct
-02
Jan-
03Ap
r-03
Jul-0
3O
ct-0
3Ja
n-04
Apr-0
4Ju
l-04
Oct
-04
Jan-
05
Myriapoda: Diplopoda, turf samples
Loge
mea
n de
nsity
0123456789
10
Jan-
99Ap
r-99
Jul-9
9O
ct-9
9Ja
n-00
Apr-0
0Ju
l-00
Oct
-00
Jan-
01Ap
r-01
Jul-0
1O
ct-0
1Ja
n-02
Apr-0
2Ju
l-02
Oct
-02
Jan-
03Ap
r-03
Jul-0
3O
ct-0
3Ja
n-04
Apr-0
4Ju
l-04
Oct
-04
Jan-
05
Myriapoda: Diplopoda, tussock samples
0123456789
10
Jan-
99Ap
r-99
Jul-9
9O
ct-9
9Ja
n-00
Apr-0
0Ju
l-00
Oct
-00
Jan-
01Ap
r-01
Jul-0
1O
ct-0
1Ja
n-02
Apr-0
2Ju
l-02
Oct
-02
Jan-
03Ap
r-03
Jul-0
3O
ct-0
3Ja
n-04
Apr-0
4Ju
l-04
Oct
-04
Jan-
05
Myriapoda: Symphyla, turf samples
Loge
mea
n de
nsity
0123456789
10
Jan-
99A
pr-9
9Ju
l-99
Oct
-99
Jan-
00A
pr-0
0Ju
l-00
Oct
-00
Jan-
01A
pr-0
1Ju
l-01
Oct
-01
Jan-
02A
pr-0
2Ju
l-02
Oct
-02
Jan-
03A
pr-0
3Ju
l-03
Oct
-03
Jan-
04A
pr-0
4Ju
l-04
Oct
-04
Jan-
05
Myriapoda: Symphyla, tussock samples
Control SprB SumB
Continued on next page
Appendix 4—continued

68 Barratt et al.—Impact of fire on tussock invertebrates
0123456789
10
Jan-
99A
pr-9
9Ju
l-99
Oct
-99
Jan-
00A
pr-0
0Ju
l-00
Oct
-00
Jan-
01A
pr-0
1Ju
l-01
Oct
-01
Jan-
02A
pr-0
2Ju
l-02
Oct
-02
Jan-
03A
pr-0
3Ju
l-03
Oct
-03
Jan-
04A
pr-0
4Ju
l-04
Oct
-04
Jan-
05
Loge
mea
n de
nsity
Total Hemiptera, turf samples
0123456789
10
Jan-
99A
pr-9
9Ju
l-99
Oct
-99
Jan-
00A
pr-0
0Ju
l-00
Oct
-00
Jan-
01A
pr-0
1Ju
l-01
Oct
-01
Jan-
02A
pr-0
2Ju
l-02
Oct
-02
Jan-
03A
pr-0
3Ju
l-03
Oct
-03
Jan-
04A
pr-0
4Ju
l-04
Oct
-04
Jan-
05
Total Hemiptera, tussock samples
0123456789
10Ja
n-99
Apr
-99
Jul-9
9O
ct-9
9Ja
n-00
Apr
-00
Jul-0
0O
ct-0
0Ja
n-01
Apr
-01
Jul-0
1O
ct-0
1Ja
n-02
Apr
-02
Jul-0
2O
ct-0
2Ja
n-03
Apr
-03
Jul-0
3O
ct-0
3Ja
n-04
Apr
-04
Jul-0
4O
ct-0
4Ja
n-05
Orthoptera, turf samples
Loge
mea
n de
nsity
0123456789
10
Jan-
99Ap
r-99
Jul-9
9O
ct-9
9Ja
n-00
Apr-0
0Ju
l-00
Oct
-00
Jan-
01Ap
r-01
Jul-0
1O
ct-0
1Ja
n-02
Apr-0
2Ju
l-02
Oct
-02
Jan-
03Ap
r-03
Jul-0
3O
ct-0
3Ja
n-04
Apr-0
4Ju
l-04
Oct
-04
Jan-
05
Orthoptera, tussock samples
0123456789
10
Jan-
99A
pr-9
9Ju
l-99
Oct
-99
Jan-
00A
pr-0
0Ju
l-00
Oct
-00
Jan-
01A
pr-0
1Ju
l-01
Oct
-01
Jan-
02A
pr-0
2Ju
l-02
Oct
-02
Jan-
03A
pr-0
3Ju
l-03
Oct
-03
Jan-
04A
pr-0
4Ju
l-04
Oct
-04
Jan-
05
Psocoptera, turf samples
Loge
mea
n de
nsity
0123456789
10
Jan-
99A
pr-9
9Ju
l-99
Oct
-99
Jan-
00A
pr-0
0Ju
l-00
Oct
-00
Jan-
01A
pr-0
1Ju
l-01
Oct
-01
Jan-
02A
pr-0
2Ju
l-02
Oct
-02
Jan-
03A
pr-0
3Ju
l-03
Oct
-03
Jan-
04A
pr-0
4Ju
l-04
Oct
-04
Jan-
05
Psocoptera, tussock samples
0123456789
10
Jan-
99Ap
r-99
Jul-9
9O
ct-9
9Ja
n-00
Apr-0
0Ju
l-00
Oct
-00
Jan-
01Ap
r-01
Jul-0
1O
ct-0
1Ja
n-02
Apr-0
2Ju
l-02
Oct
-02
Jan-
03Ap
r-03
Jul-0
3O
ct-0
3Ja
n-04
Apr-0
4Ju
l-04
Oct
-04
Jan-
05
Loge
mea
n de
nsity
Hemiptera: Pseudococcidae, turf samples
0123456789
10
Jan-
99Ap
r-99
Jul-9
9O
ct-9
9Ja
n-00
Apr-0
0Ju
l-00
Oct
-00
Jan-
01Ap
r-01
Jul-0
1O
ct-0
1Ja
n-02
Apr-0
2Ju
l-02
Oct
-02
Jan-
03Ap
r-03
Jul-0
3O
ct-0
3Ja
n-04
Apr-0
4Ju
l-04
Oct
-04
Jan-
05
Hemiptera: Pseudococcidae, tussock samples
Control SprB SumB
Continued on next page
Appendix 4—continued

69Science for Conservation 291
0123456789
10Ja
n-99
Apr
-99
Jul-9
9O
ct-9
9Ja
n-00
Apr
-00
Jul-0
0O
ct-0
0Ja
n-01
Apr
-01
Jul-0
1O
ct-0
1Ja
n-02
Apr
-02
Jul-0
2O
ct-0
2Ja
n-03
Apr
-03
Jul-0
3O
ct-0
3Ja
n-04
Apr
-04
Jul-0
4O
ct-0
4Ja
n-05
Loge
mea
n de
nsity
Hymenoptera, turf samples
0123456789
10
Jan-
99Ap
r-99
Jul-9
9O
ct-9
9Ja
n-00
Apr-0
0Ju
l-00
Oct
-00
Jan-
01Ap
r-01
Jul-0
1O
ct-0
1Ja
n-02
Apr-0
2Ju
l-02
Oct
-02
Jan-
03Ap
r-03
Jul-0
3O
ct-0
3Ja
n-04
Apr-0
4Ju
l-04
Oct
-04
Jan-
05
Hymenoptera, tussock samples
0123456789
10
Jan-
99A
pr-9
9Ju
l-99
Oct
-99
Jan-
00A
pr-0
0Ju
l-00
Oct
-00
Jan-
01A
pr-0
1Ju
l-01
Oct
-01
Jan-
02A
pr-0
2Ju
l-02
Oct
-02
Jan-
03A
pr-0
3Ju
l-03
Oct
-03
Jan-
04A
pr-0
4Ju
l-04
Oct
-04
Jan-
05
Diptera, turf samples
Loge
mea
n de
nsity
0123456789
10
Jan-
99A
pr-9
9Ju
l-99
Oct
-99
Jan-
00A
pr-0
0Ju
l-00
Oct
-00
Jan-
01A
pr-0
1Ju
l-01
Oct
-01
Jan-
02A
pr-0
2Ju
l-02
Oct
-02
Jan-
03A
pr-0
3Ju
l-03
Oct
-03
Jan-
04A
pr-0
4Ju
l-04
Oct
-04
Jan-
05
Diptera, tussock samples
0123456789
10
Jan-
99A
pr-9
9Ju
l-99
Oct
-99
Jan-
00A
pr-0
0Ju
l-00
Oct
-00
Jan-
01A
pr-0
1Ju
l-01
Oct
-01
Jan-
02A
pr-0
2Ju
l-02
Oct
-02
Jan-
03A
pr-0
3Ju
l-03
Oct
-03
Jan-
04A
pr-0
4Ju
l-04
Oct
-04
Jan-
05
Lepidoptera, turf samples
Loge
mea
n de
nsity
0123456789
10
Jan-
99Ap
r-99
Jul-9
9O
ct-9
9Ja
n-00
Apr-0
0Ju
l-00
Oct
-00
Jan-
01Ap
r-01
Jul-0
1O
ct-0
1Ja
n-02
Apr-0
2Ju
l-02
Oct
-02
Jan-
03Ap
r-03
Jul-0
3O
ct-0
3Ja
n-04
Apr-0
4Ju
l-04
Oct
-04
Jan-
05
Lepidoptera, tussock samples
0123456789
10
Jan-
99A
pr-9
9Ju
l-99
Oct
-99
Jan-
00A
pr-0
0Ju
l-00
Oct
-00
Jan-
01A
pr-0
1Ju
l-01
Oct
-01
Jan-
02A
pr-0
2Ju
l-02
Oct
-02
Jan-
03A
pr-0
3Ju
l-03
Oct
-03
Jan-
04A
pr-0
4Ju
l-04
Oct
-04
Jan-
05
Thysanoptera, turf samples
Loge
mea
n de
nsity
0123456789
10
Jan-
99A
pr-9
9Ju
l-99
Oct
-99
Jan-
00A
pr-0
0Ju
l-00
Oct
-00
Jan-
01A
pr-0
1Ju
l-01
Oct
-01
Jan-
02A
pr-0
2Ju
l-02
Oct
-02
Jan-
03A
pr-0
3Ju
l-03
Oct
-03
Jan-
04A
pr-0
4Ju
l-04
Oct
-04
Jan-
05
Thysanoptera, tussock samples
Control SprB SumB
Appendix 4—continued

70 Barratt et al.—Impact of fire on tussock invertebrates
Appendix 5
M e A N D e N S I T Y O F I N v e R T e B R A T e G R O u P S A T M O u N T B e N G e R
Graphs show the mean density (number individuals/m2) of invertebrate groups
present in control and spring-burnt (SprB) plots. Density is expressed as
loge mean density throughout the study period. error bars represent 2 SeMs.
Arrow indicates the spring burn date.
0123456789
10
Jan-
99A
pr-9
9Ju
l-99
Oct
-99
Jan-
00A
pr-0
0Ju
l-00
Oct
-00
Jan-
01A
pr-0
1Ju
l-01
Oct
-01
Jan-
02A
pr-0
2Ju
l-02
Oct
-02
Jan-
03A
pr-0
3Ju
l-03
Oct
-03
Jan-
04
Annelida, turf samples
Loge
mea
n de
nsity
0123456789
10
Jan-
99Ap
r-99
Jul-9
9O
ct-9
9Ja
n-00
Apr-0
0Ju
l-00
Oct
-00
Jan-
01Ap
r-01
Jul-0
1O
ct-0
1Ja
n-02
Apr-0
2Ju
l-02
Oct
-02
Jan-
03Ap
r-03
Jul-0
3O
ct-0
3Ja
n-04
Annelida, tussock samples
0123456789
10
Jan-
99A
pr-9
9Ju
l-99
Oct
-99
Jan-
00A
pr-0
0Ju
l-00
Oct
-00
Jan-
01A
pr-0
1Ju
l-01
Oct
-01
Jan-
02A
pr-0
2Ju
l-02
Oct
-02
Jan-
03A
pr-0
3Ju
l-03
Oct
-03
Jan-
04
Total Arachnida, turf samples
Loge
mea
n de
nsity
0123456789
10
Jan-
99A
pr-9
9Ju
l-99
Oct
-99
Jan-
00A
pr-0
0Ju
l-00
Oct
-00
Jan-
01A
pr-0
1Ju
l-01
Oct
-01
Jan-
02A
pr-0
2Ju
l-02
Oct
-02
Jan-
03A
pr-0
3Ju
l-03
Oct
-03
Jan-
04
Total Arachnida, tussock samples
0123456789
10
Jan-
99A
pr-9
9Ju
l-99
Oct
-99
Jan-
00A
pr-0
0Ju
l-00
Oct
-00
Jan-
01A
pr-0
1Ju
l-01
Oct
-01
Jan-
02A
pr-0
2Ju
l-02
Oct
-02
Jan-
03A
pr-0
3Ju
l-03
Oct
-03
Jan-
04
Arachnida: Araneae, turf samples
Loge
mea
n de
nsity
0123456789
10
Jan-
99Ap
r-99
Jul-9
9O
ct-9
9Ja
n-00
Apr-0
0Ju
l-00
Oct
-00
Jan-
01Ap
r-01
Jul-0
1O
ct-0
1Ja
n-02
Apr-0
2Ju
l-02
Oct
-02
Jan-
03Ap
r-03
Jul-0
3O
ct-0
3Ja
n-04
Arachnida: Araneae, tussock samples
Control SprB
Continued on next page

71Science for Conservation 291
0123456789
10Ja
n-99
Apr
-99
Jul-9
9O
ct-9
9Ja
n-00
Apr
-00
Jul-0
0O
ct-0
0Ja
n-01
Apr
-01
Jul-0
1O
ct-0
1Ja
n-02
Apr
-02
Jul-0
2O
ct-0
2Ja
n-03
Apr
-03
Jul-0
3O
ct-0
3Ja
n-04
Arachnida: Opiliones, turf samples
Loge
mea
n de
nsity
0123456789
10
Jan-
99Ap
r-99
Jul-9
9O
ct-9
9Ja
n-00
Apr-0
0Ju
l-00
Oct
-00
Jan-
01Ap
r-01
Jul-0
1O
ct-0
1Ja
n-02
Apr-0
2Ju
l-02
Oct
-02
Jan-
03Ap
r-03
Jul-0
3O
ct-0
3Ja
n-04
Arachnida: Opiliones, tussock samples
0123456789
10
Jan-
99A
pr-9
9Ju
l-99
Oct
-99
Jan-
00A
pr-0
0Ju
l-00
Oct
-00
Jan-
01A
pr-0
1Ju
l-01
Oct
-01
Jan-
02A
pr-0
2Ju
l-02
Oct
-02
Jan-
03A
pr-0
3Ju
l-03
Oct
-03
Jan-
04
Total Crustacea, turf samples
Loge
mea
n de
nsity
0123456789
10
Jan-
99A
pr-9
9Ju
l-99
Oct
-99
Jan-
00A
pr-0
0Ju
l-00
Oct
-00
Jan-
01A
pr-0
1Ju
l-01
Oct
-01
Jan-
02A
pr-0
2Ju
l-02
Oct
-02
Jan-
03A
pr-0
3Ju
l-03
Oct
-03
Jan-
04
Total Crustacea, tussock samples
0123456789
10
Jan-
99A
pr-9
9Ju
l-99
Oct
-99
Jan-
00A
pr-0
0Ju
l-00
Oct
-00
Jan-
01A
pr-0
1Ju
l-01
Oct
-01
Jan-
02A
pr-0
2Ju
l-02
Oct
-02
Jan-
03A
pr-0
3Ju
l-03
Oct
-03
Jan-
04
Crustacaea: Amphipoda, turf samples
Loge
mea
n de
nsity
0123456789
10
Jan-
99A
pr-9
9Ju
l-99
Oct
-99
Jan-
00A
pr-0
0Ju
l-00
Oct
-00
Jan-
01A
pr-0
1Ju
l-01
Oct
-01
Jan-
02A
pr-0
2Ju
l-02
Oct
-02
Jan-
03A
pr-0
3Ju
l-03
Oct
-03
Jan-
04
Crustacaea: Amphipoda, tussock samples
Control SprB
Appendix 5—continued
Continued on next page
0123456789
10
Jan-
99A
pr-9
9Ju
l-99
Oct
-99
Jan-
00A
pr-0
0Ju
l-00
Oct
-00
Jan-
01A
pr-0
1Ju
l-01
Oct
-01
Jan-
02A
pr-0
2Ju
l-02
Oct
-02
Jan-
03A
pr-0
3Ju
l-03
Oct
-03
Jan-
04
Crustacaea: Isopoda, turf samples
Loge
mea
n de
nsity
0123456789
10
Jan-
99A
pr-9
9Ju
l-99
Oct
-99
Jan-
00A
pr-0
0Ju
l-00
Oct
-00
Jan-
01A
pr-0
1Ju
l-01
Oct
-01
Jan-
02A
pr-0
2Ju
l-02
Oct
-02
Jan-
03A
pr-0
3Ju
l-03
Oct
-03
Jan-
04
Crustacaea: Isopoda, tussock samples

72 Barratt et al.—Impact of fire on tussock invertebrates
0123456789
10Ja
n-99
Apr
-99
Jul-9
9O
ct-9
9Ja
n-00
Apr
-00
Jul-0
0O
ct-0
0Ja
n-01
Apr
-01
Jul-0
1O
ct-0
1Ja
n-02
Apr
-02
Jul-0
2O
ct-0
2Ja
n-03
Apr
-03
Jul-0
3O
ct-0
3Ja
n-04
Total Myriapoda, turf samples
Loge
mea
n de
nsity
0123456789
10
Jan-
99A
pr-9
9Ju
l-99
Oct
-99
Jan-
00A
pr-0
0Ju
l-00
Oct
-00
Jan-
01A
pr-0
1Ju
l-01
Oct
-01
Jan-
02A
pr-0
2Ju
l-02
Oct
-02
Jan-
03A
pr-0
3Ju
l-03
Oct
-03
Jan-
04
Total Myriapoda, tussock samples
0123456789
10
Jan-
99A
pr-9
9Ju
l-99
Oct
-99
Jan-
00A
pr-0
0Ju
l-00
Oct
-00
Jan-
01A
pr-0
1Ju
l-01
Oct
-01
Jan-
02A
pr-0
2Ju
l-02
Oct
-02
Jan-
03A
pr-0
3Ju
l-03
Oct
-03
Jan-
04
Myriapoda: Chilopoda, turf samples
Loge
mea
n de
nsity
0123456789
10
Jan-
99A
pr-9
9Ju
l-99
Oct
-99
Jan-
00A
pr-0
0Ju
l-00
Oct
-00
Jan-
01A
pr-0
1Ju
l-01
Oct
-01
Jan-
02A
pr-0
2Ju
l-02
Oct
-02
Jan-
03A
pr-0
3Ju
l-03
Oct
-03
Jan-
04
Myriapoda: Chilopoda, tussock samples
0123456789
10
Jan-
99A
pr-9
9Ju
l-99
Oct
-99
Jan-
00A
pr-0
0Ju
l-00
Oct
-00
Jan-
01A
pr-0
1Ju
l-01
Oct
-01
Jan-
02A
pr-0
2Ju
l-02
Oct
-02
Jan-
03A
pr-0
3Ju
l-03
Oct
-03
Jan-
04
Myriapoda: Diplopoda, turf samples
Loge
mea
n de
nsity
0123456789
10
Jan-
99Ap
r-99
Jul-9
9O
ct-9
9Ja
n-00
Apr-0
0Ju
l-00
Oct
-00
Jan-
01Ap
r-01
Jul-0
1O
ct-0
1Ja
n-02
Apr-0
2Ju
l-02
Oct
-02
Jan-
03Ap
r-03
Jul-0
3O
ct-0
3Ja
n-04
Myriapoda: Diplopoda, tussock samples
Control SprB
Continued on next page
Appendix 5—continued
0123456789
10
Jan-
99A
pr-9
9Ju
l-99
Oct
-99
Jan-
00A
pr-0
0Ju
l-00
Oct
-00
Jan-
01A
pr-0
1Ju
l-01
Oct
-01
Jan-
02A
pr-0
2Ju
l-02
Oct
-02
Jan-
03A
pr-0
3Ju
l-03
Oct
-03
Jan-
04
Myriapoda: Symphyla, turf samples
Loge
mea
n de
nsity
0123456789
10
Jan-
99A
pr-9
9Ju
l-99
Oct
-99
Jan-
00A
pr-0
0Ju
l-00
Oct
-00
Jan-
01A
pr-0
1Ju
l-01
Oct
-01
Jan-
02A
pr-0
2Ju
l-02
Oct
-02
Jan-
03A
pr-0
3Ju
l-03
Oct
-03
Jan-
04
Myriapoda: Symphyla, tussock samples

73Science for Conservation 291
Continued on next page
0123456789
10Ja
n-99
Apr
-99
Jul-9
9O
ct-9
9Ja
n-00
Apr
-00
Jul-0
0O
ct-0
0Ja
n-01
Apr
-01
Jul-0
1O
ct-0
1Ja
n-02
Apr
-02
Jul-0
2O
ct-0
2Ja
n-03
Apr
-03
Jul-0
3O
ct-0
3Ja
n-04
Orthoptera, turf samples
Loge
mea
n de
nsity
0123456789
10
Jan-
99A
pr-9
9Ju
l-99
Oct
-99
Jan-
00A
pr-0
0Ju
l-00
Oct
-00
Jan-
01A
pr-0
1Ju
l-01
Oct
-01
Jan-
02A
pr-0
2Ju
l-02
Oct
-02
Jan-
03A
pr-0
3Ju
l-03
Oct
-03
Jan-
04
Orthoptera, tussock samples
0123456789
10
Jan-
99A
pr-9
9Ju
l-99
Oct
-99
Jan-
00A
pr-0
0Ju
l-00
Oct
-00
Jan-
01A
pr-0
1Ju
l-01
Oct
-01
Jan-
02A
pr-0
2Ju
l-02
Oct
-02
Jan-
03A
pr-0
3Ju
l-03
Oct
-03
Jan-
04
Total Hemiptera, turf samples
Loge
mea
n de
nsity
0123456789
10
Jan-
99A
pr-9
9Ju
l-99
Oct
-99
Jan-
00A
pr-0
0Ju
l-00
Oct
-00
Jan-
01A
pr-0
1Ju
l-01
Oct
-01
Jan-
02A
pr-0
2Ju
l-02
Oct
-02
Jan-
03A
pr-0
3Ju
l-03
Oct
-03
Jan-
04
Total Hemiptera, tussock samples
0123456789
10
Jan-
99A
pr-9
9Ju
l-99
Oct
-99
Jan-
00A
pr-0
0Ju
l-00
Oct
-00
Jan-
01A
pr-0
1Ju
l-01
Oct
-01
Jan-
02A
pr-0
2Ju
l-02
Oct
-02
Jan-
03A
pr-0
3Ju
l-03
Oct
-03
Jan-
04
Hemiptera: Pseudococcidae, turf samples
Loge
mea
n de
nsity
v
0123456789
10
Jan-
99A
pr-9
9Ju
l-99
Oct
-99
Jan-
00A
pr-0
0Ju
l-00
Oct
-00
Jan-
01A
pr-0
1Ju
l-01
Oct
-01
Jan-
02A
pr-0
2Ju
l-02
Oct
-02
Jan-
03A
pr-0
3Ju
l-03
Oct
-03
Jan-
04
Hemiptera: Pseudococcidae, tussock samples
Control SprB
Appendix 5—continued
0123456789
10
Jan-
99A
pr-9
9Ju
l-99
Oct
-99
Jan-
00A
pr-0
0Ju
l-00
Oct
-00
Jan-
01A
pr-0
1Ju
l-01
Oct
-01
Jan-
02A
pr-0
2Ju
l-02
Oct
-02
Jan-
03A
pr-0
3Ju
l-03
Oct
-03
Jan-
04
Total Hymenoptera, turf samples
Loge
mea
n de
nsity
0123456789
10
Jan-
99A
pr-9
9Ju
l-99
Oct
-99
Jan-
00A
pr-0
0Ju
l-00
Oct
-00
Jan-
01A
pr-0
1Ju
l-01
Oct
-01
Jan-
02A
pr-0
2Ju
l-02
Oct
-02
Jan-
03A
pr-0
3Ju
l-03
Oct
-03
Jan-
04
Total Hymenoptera, tussock samplesHymenoptera, turf samples Hymenoptera, tussock samples

74 Barratt et al.—Impact of fire on tussock invertebrates
0123456789
10Ja
n-99
Apr
-99
Jul-9
9O
ct-9
9Ja
n-00
Apr
-00
Jul-0
0O
ct-0
0Ja
n-01
Apr
-01
Jul-0
1O
ct-0
1Ja
n-02
Apr
-02
Jul-0
2O
ct-0
2Ja
n-03
Apr
-03
Jul-0
3O
ct-0
3Ja
n-04
Diptera, turf samples
Loge
mea
n de
nsity
0123456789
10
Jan-
99A
pr-9
9Ju
l-99
Oct
-99
Jan-
00A
pr-0
0Ju
l-00
Oct
-00
Jan-
01A
pr-0
1Ju
l-01
Oct
-01
Jan-
02A
pr-0
2Ju
l-02
Oct
-02
Jan-
03A
pr-0
3Ju
l-03
Oct
-03
Jan-
04
Diptera, tussock samples
0123456789
10
Jan-
99A
pr-9
9Ju
l-99
Oct
-99
Jan-
00A
pr-0
0Ju
l-00
Oct
-00
Jan-
01A
pr-0
1Ju
l-01
Oct
-01
Jan-
02A
pr-0
2Ju
l-02
Oct
-02
Jan-
03A
pr-0
3Ju
l-03
Oct
-03
Jan-
04
Lepidoptera, turf samples
Loge
mea
n de
nsity
0123456789
10
Jan-
99A
pr-9
9Ju
l-99
Oct
-99
Jan-
00A
pr-0
0Ju
l-00
Oct
-00
Jan-
01A
pr-0
1Ju
l-01
Oct
-01
Jan-
02A
pr-0
2Ju
l-02
Oct
-02
Jan-
03A
pr-0
3Ju
l-03
Oct
-03
Jan-
04
Lepidoptera, tussock samples
0123456789
10
Jan-
99A
pr-9
9Ju
l-99
Oct
-99
Jan-
00A
pr-0
0Ju
l-00
Oct
-00
Jan-
01A
pr-0
1Ju
l-01
Oct
-01
Jan-
02A
pr-0
2Ju
l-02
Oct
-02
Jan-
03A
pr-0
3Ju
l-03
Oct
-03
Jan-
04
Thysanoptera, turf samples
Loge
mea
n de
nsity
0123456789
10
Jan-
99A
pr-9
9Ju
l-99
Oct
-99
Jan-
00A
pr-0
0Ju
l-00
Oct
-00
Jan-
01A
pr-0
1Ju
l-01
Oct
-01
Jan-
02A
pr-0
2Ju
l-02
Oct
-02
Jan-
03A
pr-0
3Ju
l-03
Oct
-03
Jan-
04
Thysanoptera, tussock samples
Control SprB
Appendix 5—continued

75Science for Conservation 291
Appendix 6
S u M M A R Y O F C O L e O P T e R A T A x A R e C O R D e D A T D e e P S T R e A M ( D S ) A N D M O u N T B e N G e R ( M B )
Families represented (×) and an estimate of the numbers of genera and species
are given. Where genus is not know, the number of genera is an estimate,
particularly for Staphylinidae. Data do not include larvae.
FAMILY PReSeNCe NO. GeNeRA NO. SPeCIeS
DS MB DS MB TOTAL DS MB TOTAL
Anthicidae × 1 0 1 2 0 2
Anthribidae × × 1 1 1 1 1 1
Archeocryptidae × 0 0 1 0 1 1
Byrrhidae × × 2 2 2 2 5 5
Cantharidae × 1 1 1 1 0 1
Carabidae × × 10 9 13 12 10 17
Ceramabycidae × 2 0 2 2 0 2
Chrysomelidae × × 4 3 4 5 7 9
Coccinellidae × × 3 3 3 7 8 11
Corylophidae × × 1 1 1 2 2 2
Cryptophagidae × × 2 2 2 3 2 3
Curculionidae × × 11 15 18 26 30 41
Dermestidae × × 2 2 2 2 1 2
elateridae × × 4 3 5 4 3 5
erotylidae × 0 1 1 0 1 1
Latridiidae × × 5 4 5 7 5 7
Leiodidae × × 2 1 2 2 1 2
Melandryidae × 0 1 1 0 1 1
Melyridae × × 1 1 1 1 1 1
Mycetophagidae × × 1 2 2 1 1 2
Oedemeridae × 0 1 1 0 1 1
Ptiliidae × × 1 1 1 3 3 3
Scarabaeidae × × 3 2 3 3 1 3
Scirtidae × 0 2 2 0 2 2
Scolytidae × 0 1 1 0 1 1
Scraptiidae × 1 0 1 1 0 1
Scydmaenidae × × 2 1 3 3 1 3
Staphylinidae × × 19* 17* 25* 46 40 61
Tenebrionidae × × 2 1 2 4 4 6
Trogossitidae × 0 1 1 0 1 1
Zopheridae × × 1 1 3 3 1 4
Total 24 28 82 80 111 142 135 202
* estimate only.

How does fire affect tussock grassland invertebrates?
The impacts of spring and summer burns on tussock grassland invertebrate communities were investigated at two sites in Otago, New Zealand. The density of most taxa was initially reduced following burning. However, recovery rates in the years following the burning treatments varied between taxa. In general, herbivore populations recovered within 2–3 years of burning, whereas litter-dwelling taxa were most negatively impacted. Using Coleoptera as an indicator group, there was no evidence of an increase in the proportion of exotic species in the community following fire. Contrary to expectation, summer fires did not appear to be any more detrimental to invertebrate communities than spring fires.
Barratt, B.I.P.; Ferguson, C.M.; Barton, D.M.; Johnstone, P.D. 2009: Impact of fire on tussock grassland invertebrate populations. Science for Conservation 291. 75 p.