Embed Size (px)
Citation preview

Ecological Modelling 166 (2003) 147–168
Impact of eutrophication and river managementwithin a framework of ecosystem theories
João C. Marquesa,∗, Søren N. Nielsenb,Miguel A. Pardala, Sven E. Jørgensenb
a Department of Zoology, Faculty of Sciences and Technology, Institute of Marine Research (IMAR),University of Coimbra, 3004-517 Coimbra, Portugal
b Environmental Chemistry Section, Royal Danish School of Pharmacy, Institute A,Universitetsparken 2, DK-2100 Copenhagen, Denmark
Received 22 October 2002; received in revised form 5 March 2003; accepted 7 April 2003
Abstract
Eutrophication became a dominant process in the Mondego estuarine system in the 1980s, presumably as a result of ex-cessive nutrient release into coastal waters. The main symptoms were the occurrence of seasonal blooms ofEnteromorphaspp., green macroalgae, and a drastic reduction of theZostera noltiimeadows. Previous results suggest that this process willdetermine changes in species composition at other trophic levels. This paper aims at integrating the available information toprovide a theoretical interpretation of the recent physicochemical and biological changes in the Mondego estuarine ecosystem,which will be further used as basic framework for the development of a structurally dynamic model. Exergy-based indices,the Exergy Index and Specific Exergy, were applied as ecological indicators (orientors) to describe the state of the ecosys-tem, taking into account different scenarios along a spatial gradient of eutrophication symptoms. This allowed elucidating thepresent conditions along the spatial gradient as representing various stages in the temporal evolution of the system, withinthe framework ofbifurcation, Chaos, and Catastrophe theories. Eutrophication appeared as the major driving force behind thegradual shift in primary producers from a community dominated by rooted macrophytes (Z. noltii) to a community dominatedby green macroalgae. Through time, concomitant changes at other trophic levels will most probably give origin to a new trophicstructure. Moreover, river management emerged as a key question in establishing scenarios in order to determine secondaryeffects in eutrophied systems. Results suggest that a more conservative river management may be used as a powerful tool toremedy affected areas, including the implementation of ecological engineering principles in different possible managementpractices. The recent biological changes in the Mondego estuarine ecosystem were found to comply with the framework ofthe theories considered, while both Exergy-based indices were able to capture the state of the system and distinguish betweendifferent scenarios.© 2003 Elsevier B.V. All rights reserved.
Keywords:Estuary; Biological communities; Stress-induced changes; Ecological indicators; Ecosystem theories
∗ Corresponding author. Tel.:+351-239-836386;fax: +351-239-823603.
E-mail address:[email protected] (J.C. Marques).
1. Introduction
The Mondego River drains a hydrological basinof approximately 6670 km2. Its estuary, located inthe western coast of Portugal, is the location of a
0304-3800/$ – see front matter © 2003 Elsevier B.V. All rights reserved.doi:10.1016/S0304-3800(03)00134-0

148 J.C. Marques et al. / Ecological Modelling 166 (2003) 147–168
mercantile harbour (Figueira da Foz). Besides the har-bour facilities, the estuary supports industrial activi-ties, salt-works, and aquaculture farms. Additionally,the lower Mondego River valley consists of 15,000 haof farming fields (mainly for rice production), whichsupply an important input of nutrients into estuarinewaters (Marques et al., 1993a; Pardal et al., 2000;Martins et al., 2001).
The Mondego estuary is located in a warm temper-ate region with a basic mediterranean temperate cli-mate. It consists of two arms, north and south (Fig. 1).
The two arms become separated by an island at theestuarine upstream area, at about 7 km from the sea,
Fig. 1. Location of the three sampling stations along a spatial gradient of eutrophication in the south arm of the Mondego estuary.
and join again near the mouth. The two arms of theestuary exhibit very different hydrographic character-istics. The north arm is deeper (5–10 m during hightide, tidal range about 2–3 m), while the south arm(2–4 m deep, during high tide) is almost silted up inthe upstream areas, which causes the freshwater of theriver to flow essentially through the north arm. Actu-ally, the water circulation in the south arm is mostlydue to tides and to the freshwater input of a tributary,the Pranto River, which is artificially controlled by asluice, located at 3 km from the confluence with thesouth arm of the estuary (Fig. 1). In addition, due todifferences in depth, the penetration of the tide is faster

J.C. Marques et al. / Ecological Modelling 166 (2003) 147–168 149
in the north arm, causing daily changes in salinity tobe much stronger, whereas daily temperature changesare higher in the south arm (Marques et al., 1993a).
In both arms of the estuary, hard substrates are pri-marily covered byEnteromorphaspp. andFucusspp.,which constitute eulittoral macroalgae belts, althoughin the upper limit of the sublittoral zoneUlva spp. alsooccurs. Hard substrates are essentially due to humanoccupation (e.g. harbour facilities, aquaculture farms,saltworks), and extend at least along 60% of the estuar-ine perimeter. Especially in the north arm, salt marshesof Spartina maritimaandZostera noltiimeadows havebeen gradually replaced by hard substrate habitats pri-marily covered by the brown algaeFucus vesiculosus(personal observation). Nevertheless, in the south arm,most of the intertidal zone still consists of soft sub-strates, from sand to mud, whereS. maritimamarshesandZ. noltii beds could constitute significant popula-tions (Marques et al., 1993b; Flindt et al., 1997).
As in most estuaries all over the world, eutrophica-tion largely increased in the Mondego estuarine systemsince the 1980s, presumably as a result of excessivenutrients release into coastal waters. The most visiblefeature of eutrophication in the Mondego estuary isthe occurrence of seasonal green macroalgae blooms(mainly of Enteromorphaspp.), which have been re-ported in the south arm for several years (Marqueset al., 1993a,b, 1997; Flindt et al., 1997). TheZ. noltiibeds, which represent the richest habitat with regard toproductivity and biodiversity (Marques et al., 1993b,1997), have been drastically reduced in the south armof the Mondego estuary, most likely as a function ofcompetition withEnteromorpha(Raffaelli et al., 1991;Hodgkin and Hamilton, 1993), resulting from the dif-ferent strategies of macroalgae and macrophytes touptake nutrients, and also from the shading effectsof macroalgae on macrophytes (Hardy et al., 1993;Hartog, 1994). Actually, in the beginning of the 1980s,the Z. noltii beds covered a large fraction of the in-tertidal area, extending to the upstream section of thesouth arm, along the Murraceira Island (Fig. 1) (per-sonal observation), while by the end of the 1990s thisspecies distribution was restricted to its downstreamsection.
Usually, macroalgae blooms (especially in the in-ner areas of the south arm of the estuary) occur fromlate winter to an early summer peak when an algaecollapse may take place (Marques et al., 1997; Lillebø
et al., 1999; Pardal et al., 2000). During macroal-gae blooms, the concentration of dissolved oxygen in-creases significantly during the day, which is obviouslyrelated to primary production, becoming extremelylow during the night, due to algae biomass respiration(Martins et al., 1997). This diurnal cycle probably ex-plains the occurrence of the algae crashes describedabove (Flindt et al., 1997; Martins et al., 2001). Never-theless, the annual biomass ofEnteromorphaspp., andtherefore blooms occurrence, appears to be stronglydependent on the amount of freshwater that enters thesouth arm during winter and spring. In turn, the in-put of freshwater is regulated by precipitation and byriver management practices, as a function of the waterneeds of rice crops located upstream from the estuary(Martins et al., 2001).
In general, it has been observed that benthic eu-trophication in estuaries and coastal lagoons maydetermine a shift in the benthic primary producers(Lavery et al., 1991; Hartog, 1994), like the gradualreplacement ofZosteraby Enteromorphaobserved inthe Mondego (Marques et al., 1997). It is obviouslyreasonable to assume, and many results from researchcarried out in the Mondego estuary (Cabral et al.,1999; Lillebø et al., 1999; Lopes et al., 2000; Pardalet al., 2000) comply with it, that this may determinechanges in species composition at other trophic levels,and through time give rise to a new trophic structure.
A recent data set, obtained from January 1993to June 1994 in the scope of a EU research project(MAS2-CT92-0036) provided a suitable descriptionof the temporal variation of physicochemical factorsof water and sediments and of the composition of thebenthic communities along the estuarine gradient ofeutrophication. Such data were already made partiallyavailable in a number of publications (Flindt et al.,1997; Marques et al., 1997; Martins et al., 1997).
The main goal of this paper is to combine pastobservations and more recent data in an integrativemanner, providing an interpretation of the recentbiological modifications in the Mondego estuaryecosystem in the light of ecological theories.
Additionally, we aimed to test the Exergy Index andSpecific Exergy as ecological indicators (orientors), interms of evaluating its capability to capture the state ofthe system, distinguishing between different scenariosalong the spatial gradient of eutrophication symptoms.These two thermodynamically oriented indicators

150 J.C. Marques et al. / Ecological Modelling 166 (2003) 147–168
are derived from ecosystem theory. The applicationof Exergy in ecological systems was proposed in thelate 1970s (Jørgensen and Mejer, 1979). In termsof its spatial and temporal patterns of variation, theproperties of Exergy-based indices, respectively theExergy Index and Specific Exergy, have been ana-lyzed before taking into account the Mondego estuarybiological communities, allowing us to test in whatextent their values could elucidate about the system’scharacteristics (Marques et al., 1997). Nevertheless, itwas concluded that both Exergy-based indices shouldbe applied complementarily, since Specific Exergy isvery sensible to abrupt changes in species composi-tion, for instance the fast decline of green macroalgaefollowing a bloom, while the Exergy Index appearsto capture well slower modifications (Marques et al.,1997). The objective here is to examine if, despitesome differences in their responses, the variations ofthese ecological indicators along the spatial gradientof eutrophication symptoms were consistent with ourtheoretical interpretation of the system’s development.The application of these indicators may be based ona model, see for instanceJørgensen et al. (2002), orbased on empirical observations. In the present case,we will use the later approach. The reason for thischoice is the fact that these data will be further usedto calibrate a structurally dynamic model of the de-velopment of the Mondego estuary benthic communi-ties following an eutrophication process. Structurallydynamic models are able to describe the modifica-tions observed in the systems, namely the shift inthe dominant primary producers, which in the caseare being induced by eutrophication. In this model,these indicators will be used as orientors to the modeldynamics. Therefore, it would be necessary to ver-ify if the Exergy Index and Specific Exergy are ableto capture the system properties before the model isdeveloped. A preliminary version of the model is pre-sented inJørgensen et al. (2002), and further develop-ments must be preceded by the necessary theoreticalassumptions.
One method to implement structurally dynamicmodels is to use goal functions. Goal functions aremathematical algorithms, which act as ecologicalindicators, constituting emergent properties arisingfrom self-organization processes of development. Instructurally dynamic models parameters are allowedto change as a function of forcing functions and state
variables. Exergy-based ecological indicators appearto be very promising goal functions, showing a pos-sible role in expressing shifts in species compositionand trophic structure in shallow lakes ecosystems. Fordetails on this application see for instanceJørgensen(1997).
2. Materials and methods
2.1. Data collection
Physicochemical factors of water and sediments andthe macrobenthic communities were monitored alonga spatial gradient of eutrophication symptoms in thesouth arm of the Mondego estuary during 18 months,from January 1993 to July 1994. Samples of macro-phytes, macroalgae, and associated macrofauna weretaken fortnightly at three different sites, during lowwater, along an estuarine gradient of eutrophication inthe south arm of the estuary (Fig. 1). Sites consideredwere (a) a non-eutrophied zone, where a macrophytescommunity (Z. noltii) is present; (b) an intermediateeutrophied area, where roots can still be found in thesediment, although macrophytes are not present any-more, and where green macroalgae reach a significantdevelopment; and (c) a heavily eutrophied zone, in theinner areas of the estuary, from where vestiges of theformer presence of macrophytes totally disappeared,while Enteromorphaspp. blooms have been observedduring the last decade.
Biological samples were taken by using a man-ual corer. Each time and at each site, 10 replicateswere randomly taken, each replicate corresponding to141 cm2 and approximately 3 l of sediment. All thebiological samples were sieved in situ using a 1 mmmesh size sieve, and then fixed in 4% neutralizedformaldehyde. This mesh size was considered suit-able for this study, regarding the types of sedimentwe expected to find along the estuary. Simultaneously,corresponding to biological samples, water, salinity(g l−1), temperature (◦C), pH, and oxygen dissolvedwere measured in situ. Ammonia, silica, chlorophylla, nitrites, nitrates, and phosphates (mg l−1) were de-termined in the laboratory from water samples. Sed-iment samples were also collected and subsequentlyanalyzed for granulometry and organic matter contents(g m−2 afdw—ash free dry weight).

J.C. Marques et al. / Ecological Modelling 166 (2003) 147–168 151
The organisms collected (macrophytes, macroalgae,and macroinvertebrates) were separated, preserved in70% ethanol or in 4% neutralized formaldehyde, ac-cording to the presence or absence of calcareous parts,further identified, almost always to the species level,and their biomass determined (g m−2 afdw).
To provide a more general description regardingthe variation of the characteristics of macrobenthiccommunities along the spatial gradient of eutrophica-tion symptoms, data on its composition was pooledas a function of higher taxa and functional groups.Six higher taxonomic levels were considered, re-spectively Gastropods, Bivalves, Polychaetes, Am-phipods, Isopods, and others. On the other hand, fourfunctional groups were considered Herbivores, Detri-tivores, Carnivores, and Omnivores, respectively.
In order to analyse the effects of the freshwater dis-charge from mainland on the water quality and to es-timate the nutrients loading into the south arm of theestuary a monitoring program was carried out on atthe Pranto River sluice (Fig. 1) (Flindt et al., 1997). Asexplained above, this sluice is used for water manage-ment, controlling the freshwater discharge from thistributary and avoiding the penetration of tidal saltwaterin rice fields located upstream. During each opening ofthe sluice, the amount of water discharged was quan-tified and the concentration of nutrients determinedeach hour (Flindt et al., 1997).
2.2. Exergy Index and Specific Exergyestimations
Exergy is a concept derived from thermodynamicsthat may be seen as energy with a built in measure ofquality. Exergy is a measure of the distance betweena given state of an ecosystem and what the systemwould be at thermodynamic equilibrium (Jørgensenand Mejer, 1979). In other words, if an ecosystem werein equilibrium with the surrounding environment itsExergy would be zero. This means that, during eco-logical succession, Exergy is used to build up biomass,which in turn stores Exergy.
In thermodynamic terms, taking an ecosystem’strophic structure as a whole, there will be a continuousmodification of the structure as a function of changesin the prevailing environmental conditions, duringwhich Exergy storage will be optimized (Jørgensen,1997). In other words, ecological succession drives
from more simple to more complex ecosystems,which seem at a given point to reach a sort of bal-ance between keeping a given structure, emergingfor the optimal use of the available resources, andmodifying the structure, adapting it to a perma-nently changing environment. For a more detaileddescription of this concept see for instanceJørgensen(1997).
The Exergy of a system compared with the samesystem at the same temperature and pressure but inthe form of an inorganic soup without any life, bi-ological structure, information or organic moleculescan be computed from (Jørgensen and Mejer, 1979;Jørgensen, 1997):
Ex = RTn∑
i=0
Ci lnCi
Cieq
whereR is the gas constant,T is the absolute tem-perature,Ci is the concentration in the system ofcomponenti, Cieq is the corresponding concentra-tion of componenti at thermodynamic equilibrium,n is the number of components, and index 0 indi-cates the inorganic compounds of the consideredelement.Cieq is of course a very small concentration(except fori = 0, which is considered to cover theinorganic compounds), corresponding to a very lowprobability of forming complex organic compoundsspontaneously in an inorganic soup at thermodynamicequilibrium.
In ecological terms, the above formulation is notpractical due to the obvious difficulties in determiningthe reference level for a given compartment of the sys-tem. An approximate estimation of Exergy may never-theless be obtained following the approach proposedby Jørgensen et al. (1995):
Ex =n∑
i=1
βiCi
whereCi is the concentration in the ecosystem of com-ponenti (e.g. biomass of a given taxonomic group orfunctional group) andβi expresses roughly the quan-tity of information embedded in the biomass. Detritusis chosen as reference level, i.e.βi = 1, and Exergy inbiomass of different types of organisms is expressedin detritus energy equivalents.
The outcome of such estimation does not corre-spond anymore to Exergy in the strict thermodynamic

152 J.C. Marques et al. / Ecological Modelling 166 (2003) 147–168
sense, and is therefore called an Exergy Index(Jørgensen, 1997; Marques et al., 1997). This indexhas been tested as ecological indicator byMarqueset al. (1997).
Through time, the variation of Exergy in an ecosys-tem may, therefore, be considered as equal to thevariation of the biomass plus the information builtin one unit of biomass (expressing the quality of thebiomass):
�Extot = �Biomβi + �βi Biom
If the total biomass (Biomtot) in the system remainsconstant through time, then the variation of Exergy(Ex) will be a function of only the structural complex-ity of the biomass or, in other words, of the informa-tion embedded in the biomass, which may be calledSpecific Exergy (SpEx), or Exergy per unit of biomass.
Table 1Values for the weighting factors to estimate Exergy related toorganisms biomass for different groups of organisms
Organisms Weighing factor
Detritus 1Minimal cell 2.7Bacteria 3.0Algae 3.9Yeast 6.4Fungus 10.2Sponges 30Moulds 32Plants, trees 30–87Jellyfish 30Annelid worms 50Insects 70Crustacean Zooplankton 30–46Crustaceans (Decapods) 230Gastropods 450Bivalves 760Echinoderms 260Fish 287–344Amphibians 800Reptiles 1000Birds 1100Mammals 1300
Values of weighting factors are based on the number of infor-mation genes. The Exergy content of the organic matter in thevarious organisms is compared with Exergy contained in detritus.Estimations were carried out according to the method describedby Jørgensen et al. (1995), based on analytical work (Fonsecaet al., 2000) and on literature sources (Lewin, 1994; Li and Grauer,1991).
Specific Exergy represents, therefore, a measure thattakes into account how well an ecosystem uses theavailable resources, independently from the amount ofresources. For each instant, Specific Exergy is givenby:
SpEx= Ex
Biomtot
The Exergy Index and Specific Exergy were calcu-lated from the biomass of the different organisms(g m−2 afdw) through the use of weighting factorsable to discriminate different “qualities” of biomass(Table 1). For this purpose, taking into account theavailable set of weighting factors, data on organism’sbiomass were pooled as a function of higher taxo-nomic levels (e.g. Phylum or Class).
3. Results
Here, we consider only the results relevant to inter-pret the occurrence of macroalgae blooms in relationto river management and its effects on the estuarinemacrobenthic communities.
3.1. Salinity variation
Salinity is an important external factor to controlthe growth of Enteromorpha intestinalis, the mostabundant green macroalgae in the Mondego estuaryin terms of biomass, and therefore in conditioningthe occurrence of blooms (Martins et al., 1999). InFig. 2, we show the fortnightly variation of salinityvalues in the water column during low tide at the threesampling stations along the estuarine gradient of eu-trophication. We relate it to the opening of the PrantoRiver sluice, which controls the water level in ricefields upstream from the estuary. The temporal pat-tern of variation was clearly identical at all stations.Salinity values ranged between 15 and 35‰ duringwinter, spring, and summer 1993, a dry year. All overthis period the sluice was kept closed. From late sum-mer 1993, a rainy period started and the sluice wasopened in order to manage the water level in the ricefields. Salinity values decreased then significantly,ranging approximately between 5 and 20‰ and be-ing lower than 10‰ during a considerable periodin winter.

J.C. Marques et al. / Ecological Modelling 166 (2003) 147–168 153
Fig. 2. Fortnightly variation of salinity at the three stations along the spatial gradient of eutrophication.
3.2. Variation of nutrients concentration inthe water column
Nitrogen is usually considered a limiting factor forestuarine and marine primary production, while phos-phates are normally considered as the limiting nutrientin freshwater systems, namely in mesotrophic lakes.Silica may also constitute a limiting factor for phyto-plankton diatom growth, which might indirectly influ-ence benthic filter feeders. We, therefore, consideredit important to analyse the variation of these nutrientconcentrations in the water column in relation to theopening of the Pranto River sluice. InFig. 3A–E, weshow the fortnightly variation of nutrient concentra-tions in the water column during low tide. Addition-ally, in Fig. 3Fwe show the variation of the N/P ratioin the water column. It is quite clear from the avail-able data that silica nitrites, nitrates and ammoniaconcentrations exhibited a very significant increasein the water column during sluice opening at all thethree sampling stations demonstrating that these nutri-ents, especially nitrogen, proceed from the freshwaterdischarge, and therefore have origin in agriculturalfertilization.
On the other hand, it is also clear that phosphateconcentration in the water column was significantly
higher in the intermediate eutrophied area and in themost strongly eutrophied area of the system when thesluice was kept closed.
Phosphates apparently are much lower and basi-cally similar at all the three stations when the sluicewas opened. In fact, in estuarine systems, phosphatesare apparently mainly released to the water columnin its soluble form from the organic matter in sedi-ments (Lijklema and Hieltjes, 1982; Sfriso et al., 1987;Valiela, 1995), becoming very much diluted in the wa-ter column when the sluice is opened and importantfreshwater discharges occur.
The N/P ratio in the water column also increasedsignificantly in the water column when the sluice wasopened in comparison with the periods when it wasclosed. This was obviously due to the combined ef-fects of nitrogen loading into the estuary and phos-phates dilution, and it is reasonable to hypothesisethat during the opening of the Pranto River sluicephosphorous might become a limiting factor to pri-mary production in the south arm of the Mondegoestuary.
We may, therefore, recognize two different sce-narios with regard to water quality in the system.The first 8–9 months of observations correspondedto the end of a 2-year dry period during which the

154J.C
.M
arq
ue
se
ta
l./Eco
logica
lM
od
ellin
g1
66
(20
03
)1
47
–1
68
Fig. 3. Fortnightly variation of nutrients at the three stations along the gradient of eutrophication: (A) silica; (B) phosphates; (C) nitrites; (D)nitrates; (E) ammonia; (F) N/P ratio.

J.C.
Ma
rqu
es
et
al./E
colog
ical
Mo
de
lling
16
6(2
00
3)
14
7–
16
8155
Fig. 3. (Continued).

156 J.C. Marques et al. / Ecological Modelling 166 (2003) 147–168
Pranto River sluice was rarely opened. The subse-quent period corresponded to an extremely rainyyear, during which the sluice was opened almostdaily. Therefore, due to water management prac-tices, effects from precipitation are not directly re-flected in the south arm of the Mondego estuarinesystem.
Fig. 4. Fortnightly variation of primary producers biomass at the three stations along the gradient of eutrophication: (A)Z. noltii beds;(B) intermediate eutrophied area; (C) most eutrophied area.
3.3. Variation of Z. noltii and macroalgae biomass
With regard to primary producer data, in thenon-eutrophied area the total biomass of macrophytessuffered clear seasonal changes (Fig. 4A). Duringspring of 1993, there was an increase in leaf biomass.This reached a maximum of 328.4 g m−2 afdw in

J.C. Marques et al. / Ecological Modelling 166 (2003) 147–168 157
Fig. 4. (Continued).
April. Nevertheless, during the next spring, leafbiomass did not increase as one would expect. Rhi-zomes consistently presented higher biomass duringfall and winter when they could even present highervalues then the leaves (e.g. 130 g m−2 afdw in Novem-ber 1993).Z. noltii was not found in the other twosampling stations.
With regard to macroalgae,Gracillaria sp. (red al-gae) was the most abundant one in the non-eutrophiedarea (Fig. 4A). The levels peak during spring andsummer (maximum of 110.6 g m−2 afdw in July 1993)but exhibiting always much lower biomass than themacrophytes. Green macroalgae biomass, namelyEn-teromorphaspp., was always very low on theZ. noltiibeds (maximum 16.9 g m−2 afdw in June 1993).
In the intermediate eutrophied area,Gracillariasp. was less abundant than in theZ. noltii beds, whilegreen macroalgae biomass increased substantially,reaching a maximum of 96.9 g m−2 afdw in July 1993(Fig. 4B).
In the most eutrophied area, corresponding to the in-ner areas of the south arm, green macroalgae exhibiteda bloom up to early summer 1993, reaching a max-imum biomass of 413.19 g m−2 afdw in April 1993(Fig. 4C). From June 1993 green macroalgae suffereda collapse and did not recover until the end of the studyperiod. In this area, even during the green macroalgaebloom,Gracillaria sp. biomass was negligible.
3.4. Variation of benthic higher taxa and functionalgroups biomass
To provide a more general description regardingthe variation of the characteristics of macrobenthiccommunities along the spatial gradient, data on itscomposition was pooled as a function of higher taxaand functional groups. Six higher taxonomic levelswere considered, Gastropods, Bivalves, Polychaetes,Amphipods, Isopods, and others, respectively. On theother hand, four functional groups were considered,Herbivores, Detritivores, Carnivores, and Omnivores,respectively.
In the non-eutrophied area, corresponding to theZ. noltii beds (Fig. 5A), we observed a stable macro-fauna composition. The most abundant groups wereGastropods, withHydrobia ulvaeas dominant species,and Bivalves, mainly represented byCerastodermaedule. Amphipods, Isopods and Polychaetes werealways much less abundant and, taking into accountsampling bias, we may say that these groups basi-cally kept their relative proportions through the studyperiod. Others include the Decapods (Crustaceans),basically represented byCarcinus maenas, and theobserved changes in their biomass were basically de-pendent on the casual capture of larger specimens. Infact, although large Decapods are normally includedin what is called benthic macrofauna, they are actually

158 J.C. Marques et al. / Ecological Modelling 166 (2003) 147–168
much bigger than other estuarine macrofaunal organ-isms. The reduction in Gastropod biomass observedin this area by the end of the study period waslikely due to the severe perturbation in this habitat
Fig. 5. Fortnightly variation of higher taxonomic groups biomass at the three stations along the gradient of eutrophication: (A)Z. noltiibeds; (B) intermediate eutrophied area; (C) most eutrophied area.
caused by fishermen scraping the whole area lookingfor bait.
In the intermediate eutrophied area (Fig. 5B),the biomass was generally lower than in the other
J.C. Marques et al. / Ecological Modelling 166 (2003) 147–168 159
Fig. 5. (Continued).
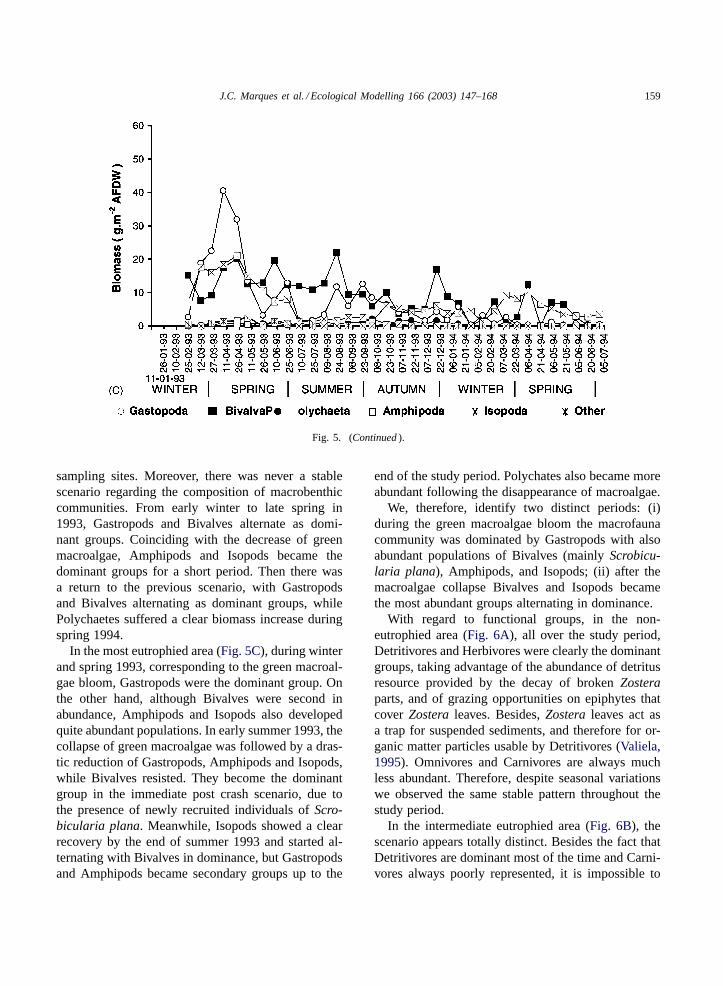
sampling sites. Moreover, there was never a stablescenario regarding the composition of macrobenthiccommunities. From early winter to late spring in1993, Gastropods and Bivalves alternate as domi-nant groups. Coinciding with the decrease of greenmacroalgae, Amphipods and Isopods became thedominant groups for a short period. Then there wasa return to the previous scenario, with Gastropodsand Bivalves alternating as dominant groups, whilePolychaetes suffered a clear biomass increase duringspring 1994.
In the most eutrophied area (Fig. 5C), during winterand spring 1993, corresponding to the green macroal-gae bloom, Gastropods were the dominant group. Onthe other hand, although Bivalves were second inabundance, Amphipods and Isopods also developedquite abundant populations. In early summer 1993, thecollapse of green macroalgae was followed by a dras-tic reduction of Gastropods, Amphipods and Isopods,while Bivalves resisted. They become the dominantgroup in the immediate post crash scenario, due tothe presence of newly recruited individuals ofScro-bicularia plana. Meanwhile, Isopods showed a clearrecovery by the end of summer 1993 and started al-ternating with Bivalves in dominance, but Gastropodsand Amphipods became secondary groups up to the
end of the study period. Polychates also became moreabundant following the disappearance of macroalgae.
We, therefore, identify two distinct periods: (i)during the green macroalgae bloom the macrofaunacommunity was dominated by Gastropods with alsoabundant populations of Bivalves (mainlyScrobicu-laria plana), Amphipods, and Isopods; (ii) after themacroalgae collapse Bivalves and Isopods becamethe most abundant groups alternating in dominance.
With regard to functional groups, in the non-eutrophied area (Fig. 6A), all over the study period,Detritivores and Herbivores were clearly the dominantgroups, taking advantage of the abundance of detritusresource provided by the decay of brokenZosteraparts, and of grazing opportunities on epiphytes thatcover Zosteraleaves. Besides,Zosteraleaves act asa trap for suspended sediments, and therefore for or-ganic matter particles usable by Detritivores (Valiela,1995). Omnivores and Carnivores are always muchless abundant. Therefore, despite seasonal variationswe observed the same stable pattern throughout thestudy period.
In the intermediate eutrophied area (Fig. 6B), thescenario appears totally distinct. Besides the fact thatDetritivores are dominant most of the time and Carni-vores always poorly represented, it is impossible to

160 J.C. Marques et al. / Ecological Modelling 166 (2003) 147–168
Fig. 6. Fortnightly variation of functional groups biomass at the three stations along the gradient of eutrophication: (A)Z. noltii beds; (B)intermediate eutrophied area; (C) most eutrophied area.

J.C. Marques et al. / Ecological Modelling 166 (2003) 147–168 161
Fig. 6. (Continued).
recognize any pattern through the study period, sincefunctional groups alternate very much in dominance(qualitative oscillations), which appear to correspondto a very unstable situation.
Finally, in the most eutrophied area (Fig. 6C),Detritivores are by far the dominant group throughthe study period, followed by Herbivores, althoughthe biomass of both groups suffered a drastic reduc-tion after the green macroalgae disappearance. Asin the other two sampling stations, Carnivores andOmnivores are poorly represented. Therefore, fromthe trophic point of view, besides variations in the
Table 2Exergy Index and Specific Exergy variation in three scenarios identified along the gradient of eutrophicatiom symptoms in the south armof the Mondego estuary
Indicator Z. noltii beds(non-eutrophied area)
Intermediate eutrophiedarea
Most eutrophied area(Enteromorphaspp. dominant)
Average S.D. Range Average S.D. Range Average S.D. Range
Exergy Index 25389 ±2533 (10%) 20143–29530 4802 ±2059 (43%) 1803–7990 8553 ±4485 (52%) 2688–19805Specific Exergy 211 ±28 (13%) 120–270 151 ±132 (87%) 9–373 160 ±95 (59%) 32–255
For each area we provide the average annual value of each indicator, the correspondent standard deviation and the range of values, basedon data collected from January 11, 1993 to July 5, 1994. Exergy is expressed in g m−2 detritus energy equivalents and Specific Exergy isexpressed in Exergy× (Unit of biomass)−1.
total biomass of each group as a function of feed-ing opportunities provided by the macroalgae bloom(quantitative oscillations), the scenario appears moreor less stabilized in this area.
3.5. Spatial variation of the Exergy Index andSpecific Exergy along the spatial gradient ofeutrophication symptoms
In Table 2, we present the Exergy Index and SpecificExergy in the three areas considered along the spatialgradient. Both indicators are consistently higher in the

162 J.C. Marques et al. / Ecological Modelling 166 (2003) 147–168
Z. noltii beds, the non-eutrophied area, followed by theareas where green macroalgae blooms take place, thehigh and mid eutrophied area. The range of variation,for both indicators, is smaller in the non-eutrophiedarea, expressing a more stable situation. Oscillationsare much stronger in the other two areas, as expressedby the standard deviations and the magnitude of thevariations. This is particularly evident if one takes intoaccount Exergy Index and Specific Exergy variationsin the intermediate eutrophied and in the most eutro-phied areas (see alsoFig. 8C and D). Meanwhile, onlythe Exergy Index for theZ. noltii beds was signifi-cantly different from the other two areas. Despite thefact that Specific Exergy variations are rather small intheZosterameadows, significant differences cannot berecognized due the very strong oscillations in the othertwo areas, namely in the intermediate eutrophied one.
4. Discussion and tentative theoreticalinterpretation
Qualitative observations carried out in the Mondegoestuary since the early 1980s (Marques et al., 1984)provide a general idea regarding how the system was atthe time, namely with regard to the benthic communi-ties. How did the system evolve since then and whichwere the driving forces behind the observed changes?
The most evident feature was the increase of eu-trophication symptoms and its impact on the biologi-cal communites, of which the most visible effect wasthe occurrence of green macroalgae blooms and aconcomitant decrease of the area occupied byZ. noltiibeds. From past observations, we know that disap-pearance ofZ. noltii first took place in the inner areasof the south arm of the estuary and went forwardto the downstream section, where the distribution ofrooted macrophytes is presently limited. In fact, some20 years ago (Marques et al., 1984), Z. noltii bedscovered a large part of the intertidal area, extending tothe upstream section of the south arm, correspondingto what is now the most eutrophied area. No remainsof Z. noltii can presently be found here. Nevertheless,in the intermediate eutrophied area, althoughZ. noltiidisappeared some time ago, we could still find restsof its rhizomes in the sediment.
Samples collected during 1993 and 1994 provideda valuable data set on the temporal variation of
physicochemical factors of water and sediments andof the composition of the benthic communities alongthe estuarine spatial gradient, allowing to analyse theongoing process in more detail, since it was possi-ble to monitor the occurrence of a green macroalgalbloom. The way macroalgae extended from upstreamto downstream sections in the south arm of the estu-ary, competing withZ. noltii, and the way this processinfluenced faunal assemblages, illustrated very clearlythe impact of eutrophication, that appeared, beyondany reasonable doubt, to be the main driving forcebehind the ongoing changes in the south arm of theMondego estuary.
On the other hand, it was possible to produce ev-idence that, despite nutrient enrichment of estuarinewaters due to discharges proceeding from mainland,macroalgae blooms, the main eutrophication symp-tom, do not occur each year. River management as afunction of agricultural practices upstream from theestuary explains why in a plausible way. In fact, theannual variation ofEnteromorphaspp. biomass wasshown to be strongly dependent on the amount offreshwater that enters the south arm during winter andspring (Martins et al., 2001). This is thought to happenaccording to the following mechanism: (a) a strongfreshwater discharge will decrease salinity, and lowsalinity will inhibit macroalgae growth (Martins et al.,1999), despite the increase in nitrogen in the water col-umn; (b) additionally, dissolved nitrogen dischargedfrom mainland with freshwater will increase N/P ra-tios, since phosphorous appears to be mostly releasedfrom estuarine sediments and becomes diluted in thewater column (Martins et al., 2001), which may de-termine phosphorous limitation in the system. Rivermanagement emerged, therefore, as a key questionin determining secondary scenarios in this eutrophiedsystem, and it appears reasonable to assume that thesame might occur in other estuarine systems as well.
One should logically expect that a shift in primaryproducers could determine changes in other trophiclevels (Marques et al., 1997). To a certain extent, thishas been illustrated for instance by changes in the pop-ulation structure of abundant species along the gradi-ent of eutrophication symptoms (Lillebø et al., 1999;Pardal et al., 2000), and by a number of observationsand a field experiment on waders carried out in thestudy area (Cabral et al., 1999; Lopes et al., 2000). Butthe present results reinforce this notion and indicate

J.C. Marques et al. / Ecological Modelling 166 (2003) 147–168 163
that, through time, the ongoing changes will probablyinitiate a new trophic structure.
The recent biological changes in the system weretentatively interpreted in the scope of a broad theo-retical framework. For that, we enlist the followingbasic assumption: sinceZ. noltii disappearance in thesouth arm of the estuary started in the inner areas andprogressed downstream, spatial changes in the systemmay represent temporal changes. In other words, thenon-eutrophied area, withZ. noltii beds, may repre-sent what the system was two decades ago, the inter-mediate eutrophied area may represent changing areasduring the process, and the most eutrophied area mayrepresent the most advanced stage in the observed shiftbetween primary producers, where the macroalgae hastotally ousted macrophytes.
If one accepts this assumption, then the recent modi-fication in primary producers and its related food chainmay be seen as a dynamic shift between species. Asa consequence, the ecosystem network structure haschanged, which may be illustrated byFig. 7.
In the prevailing conditions two decades ago, rootedmacrophytes,Z. noltii and related epiphytic grazersdominated byHydrobia ulvaewere selected. An im-portant detrital food web was also present.
As eutrophication affected an increasing area of theestuary, green macroalgae, likeEnteromorphaspp. andUlva spp. replaced the rooted macrophytes. The highturnover of these macroalgae, and the alternation be-tween periods where algae develop high biomasseswith periods where bottom sediments are basicallybare but rich in organic matter determine an increas-ing importance of the detritus pathway.
We can now interpret the Mondego estuary pro-cesses from a more general viewpoint. Ecosystemsexhibit systematic changes in certain parameters asthey evolve over a longer time scale, a process knownas succession. This term should be reserved to de-scribe the gradual modification of the communitiesin a relatively undisturbed environment or at least anenvironment that is imposing only a limited numberor size of perturbations on the ecosystem. In suchcases the ecosystem will follow a succession duringwhich organisms, populations, and thus the ecosystemas a whole is adapted to meet the long-term averagecondition of the environment.
More and more often it happens that ecosystems areexposed to disturbances other than the natural ones,
which adds an extra stress to the system on top of thenatural disturbance level. Such disturbances are oftenrelated to human activities and may vary drastically infrequency or orders of magnitude.
The long-term development, succession and modifi-cation, of an ecosystem exposed to various degrees ofdisturbances, natural as well as human caused, may bedemonstrated byFig. 8A. The relation between possi-ble ways of development and concepts from ecologi-cal theory are indicated on the corresponding part ofthe curve. On the left part, at a relatively low level ofstress corresponding to normal fluctuations in environ-mental conditions, we represent a normal successiontowards aclimax society, corresponding to an increaseand finally stabilization of the biomass in the systemand also its complexity. During this period, the sys-tem will follow the traditional developmental patternsas described for instance in the24 Principles of E.P.Odum, such as development from r- to K-stragetists,increased cycling, and importance of the network, etc.(Odum, 1971).
With increased stress, often represented by a morefrequent occurrence of abnormal events, literature ex-ists that reports an additional stimulation of biomassand diversity, demonstrated by a “hump” on the curve.This may be observed for instance in areas of estu-arine systems affected by a certain level of organicpollution and is what is usually referred to as theintermediate disturbance hypothesis(Connel, 1978)(Fig. 8A). Meanwhile, this developmental pattern isonly thought to be realized in systems with a certaincapacity to absorb changing environmental conditionsin a constructive manner, i.e. the system has to pos-sess a cache in diversity that is able to react, bufferingthe disturbances at a larger time scale. This is not al-ways the situation. In case the system has lost or ex-ploited most of its overhead already, either due to nat-ural succession or long-term stress, the possibilities toreact properly may be limited or not exist at all. If thisis the case, then the system will react with the sameresponse as to an even higher perturbation. In otherwords, natural succession and/or higher stress forceswill lead to “real” macroscopic modification, whichtakes place through other mechanisms. First of all,continuous adaptation and fine-tuning of parametersleads to a system of highly fitted highly specialized or-ganisms. This in turn will reduce on organism’s abil-ity to respond in a sufficient manner to meet changes

164 J.C. Marques et al. / Ecological Modelling 166 (2003) 147–168
Fig. 7. Structural changes in the trophic network in the south arm of the Mondego estuary as a function of the shift in primary producersinduced by eutrophication. (A) Situation at theZ. noltii beds, at the non-eutrophied area, assumed to represent the original state of thesystem. (B) Situation at the most eutrophied area, where macroalgae blooms take place, assumed to represent the new state of the system.Boxes represent species or species aggregations according to their function in the trophic network. White boxes represent the dominantspecies in each situation, and dark boxes represent species poorly represented. Arrows represent matter fluxes. The width of the arrowsreflects the relative importance of the path.

J.C.
Ma
rqu
es
et
al./E
colog
ical
Mo
de
lling
16
6(2
00
3)
14
7–
16
8165
Fig. 8. Orientors (e.g. many of the ecological indicators referred in the literature) development during stress (see for instanceMarques et al., 1997). (A) Relation betweenpossible ways of development and concepts from ecological theory are indicated on the corresponding part of the curve. (B) Possible interpretation of changes ongoing inthe Mondego estuary in the frame of ecological theory. (C) Spatial variation of the Exergy Index, considering the different areas along the gradient of eutrophication in theMondego estuary as correspondent to successive stages of the system’s recent modifications. Average and standard deviation are indicated, based on data collected fromJanuary 1993 to July 1994. (D) Spatial variation of Specific Exergy, considering the different areas along the studied gradient in the Mondego estuaryas correspondent tosuccessive stages of the system’s recent change. Average and standard deviation are indicated, based on data collected from January 1993 to July 1994.
166 J.C. Marques et al. / Ecological Modelling 166 (2003) 147–168
in environmental conditions. As a result, it is believedthat the system as a whole becomes very unstable andbrittle (Jørgensen and Johnsen, 1989), which may beexpected to correspond to a large short-term fluctua-tion of an ecological indicators we may use to capturethe state of the system (Fig. 8B). Second, adaptation ofthe network leads to a development where the ecosys-tem has decreased as much as possible its conditionalentropy, or overhead in the sense ofUlanowicz (1986,1997), i.e. maximizing the utilization of the availableresources (energy) through a more and more special-ized (efficient) species composition. Such specializa-tion also means a decrease in the possibility of thesystem to cope with environmental changes, whicheventually leads to change through a type of Hollingcycle (Holling, 1986; Ulanowicz, 1997).
Moreover, the modification of systems is innon-linear, and as time passes instability gives rise toa bifurcation to new stability points (Glansdorf andPrigogine, 1971) (Fig. 8A and B). In other words,the instability of the system will thus lead it to abreakdown—acatastrophe—with possibilities of neworganisms and combinations hereof to take over andbe selected because the new constellation is betterable to meet the prevailing conditions. Catastrophe ishere not necessarily used in its narrow mathematicalsense and may also not be mathematically as such(Zeeman, 1976). Beyond the point ofbifurcation,whatever we prefer as interpretation, several possibil-ities are allowed: (a) A total recovery of the system toan almost identical state can take place, which wouldcorrespond to a “normal” understanding and interpre-tation of the Holling cycle. This of course providedthat the perturbation somehow has been stopped,and sufficient biodiversity has been conserved duringthe stress period to allow the system to return to aquasi-original state. (b) In a case where these condi-tions are not fulfilled, the system will evolve to oneor more stability points, or maybe even continuousinstability. The shift to other stability points may alsobe viewed as if the system is leaving one Hollingcycle (Holling, 1986) and entering into another.
Once again, if we accept the above assumption asreasonable, several of these “states” of developmentcan be identified in time and space along the southarm of the Mondego estuary. The recent biologicalmodifications in the estuary and especially its rela-tions to changes in the Pranto River management prac-
tices, combined with changes in exploitation of thewatershed in agricultural areas upstream from the estu-ary, introduced additional disturbance and stress to thesystem.
The following descriptions allow us to understandthe present state of each sampling station along thesouth arm and interpret the situation in accordancewith a broader theoretical frame:
(a) The Z. noltii beds may be considered as corre-sponding to the more or less original state of thesystem, performing with the highest thermody-namic efficiency (Fig. 8C and D), i.e. identicalto the climax society demonstrated by the curve(Fig. 8B). Meanwhile, these areas are in regres-sion, showing that they are highly vulnerable tothe present conditions.
(b) The most eutrophied area has undergone a tran-sition and, through a bifurcation, found anotherstability point (Fig. 8B), corresponding to a dom-inance of green macroalgae, which may or notpresent blooms as a function of precipitation andriver management. This represents a shift from aK- to r-strategy and, in that sense, may be con-sidered as a return of the system to a more imma-ture level. Lower values of the indicators (Fig. 8Cand D) appear to support this assumption.
(c) In the intermediate eutrophied area changes ex-ceed the natural variation to a degree where thesystem is never able to find a new stability point,and the scenario may be placed in the chaoticregime (Fig. 8B). This interpretation is very muchconsistent to the fact that the highest variationsof the indicators are found in this area (Fig. 8Cand D). In other words, hydrological conditionsact to facilitate in principle colonization by organ-isms proceeding from both upstream and down-stream, but the continuous variation in the distur-bances do not allow anymore the system to returnto a previous state, whenZ. noltii was present, nei-ther to reach yet a new equilibrium, like the oneobserved in the most eutrophied area.
5. Conclusion
Eutrophication appeared, beyond any reasonabledoubt, as the major driving force behind the ongoing

J.C. Marques et al. / Ecological Modelling 166 (2003) 147–168 167
changes observed in the south arm of the Mondegoestuary, namely the gradual shift in primary produc-ers from a community dominated by rooted macro-phytes (Z. noltii) to a community dominated by greenmacroalgae. Concomitant changes at other trophiclevels, through time, will likely give rise to a newtrophic structure.
River management emerged as a key factor in deter-mining secondary effects in systems already affectedby human activities, namely eutrophied systems. Re-sults indicate that much can be done to remediatesuch areas through more conservative management.We suggest that the cheapest and more realistic wayof remediation may the implementation of ecologicalengineering principles (see for instanceMitsch andJørgensen, 1989; Jørgensen and Johnsen, 1989) in dif-ferent possible management practices.
Based on the above knowledge about the system it isclear that two factors play a major role in determiningthe state(s) of the system. Salinity seems to controlthe occurrence of macroalgal blooms, whereas nutrientinput determines the overall eutrophication state of thesystem.
To recover the system, i.e. bring it back to its orig-inal state ofZosteradominance, it seems mandatoryto take measures that will improve the present condi-tions, especially with regard to nutrient level and alsowater circulation.
Two ecological engineering principles could beimplemented fairly easily and at very little costs thatwould help to improve the present situation and,additionally, in harmonizing two activities that arepresently in conflict, respectively aquaculture, in theestuary, and rice production, upstream fish farms. Thefirst would be to exploit the pulsing of the system bysynchronizing outlet of freshwater and intake of waterfor aquaculture with the tides. Second, the establish-ment of buffering zones, ecotones, in the catchmentarea should help diminishing the nutrient loads on thesystem.
In the first case, output of freshwater during outwardtidal movement should help to decrease the retentiontime of nutrients in the estuary. Intake of saltwater foraquaculture necessarily takes place during high tide.Differences in salinity and the resulting density of theoverlying water would help to pump out nutrients ofthe sediments. In the second case, both aquacultureand agricultural activities have to be planned so that
nutrient rich waters pass through “constructed” wet-lands before entering the estuary directly or via thePranto River system. For the aquacultures the aban-doned Salinas adjacent to the estuary might be usedfor this purpose and being able to capture most of theorganic materials and nutrients of aquaculture origin,and at the same time serve as important habitats to thewildlife, in particular birds. In the case of the rice fieldsin the Pranto River catchment area, the rice fields,which could be considered constructed wetlands them-selves, closest to the river and channels should receiveno fertilizers directly but just benefit from the nutrientsalready in excess in the out flowing surface waters.
The above changes will of course need carefulplanning, some simple feasibility studies allowing toestimate a dimensioning of the system and plans formanagement. These measures at the end will mostprobably turn out to be beneficial to both the socio-economical situation of the farmers and to the envi-ronmental state of the Mondego River estuary as well.
From a more general viewpoint, the recent biolog-ical modification in the south arm of the estuary maybe interpreted in compliance with a broader ecologicaltheoretical framework. Further research will be neces-sary to understand in a more detailed way processesinvolved. The development of a structurally dynamicmodel able to describe the shift in the communities asa function of environmental changes will represent astrong tool with regard to this purpose.
Acknowledgements
The data set used in the present paper was ob-tained in the scope of the EU project MUST—MAS2-CT92-0036, and of the Portuguese FCTProject DYNAMOD—(POCTI/MGS/37431/2001).S.N. Nielsen was supported by a grant allowed in thescope of a cooperation program between Portugal andDenmark. The authors are indebted to all colleaguesthat assisted in field and laboratory work and espe-cially to Maria Gabriel Fontes for her restless supportin producing graphical illustrations.
References
Cabral, J.A., Pardal, M.A., Lopes, R.J., Múrias, T., Marques, J.C.,1999. The impact of macroalgal blooms on the use of the

168 J.C. Marques et al. / Ecological Modelling 166 (2003) 147–168
intertidal area and feeding behaviour of waders (Charadrii) inthe Mondego estuary (West Portugal). Acta Oecol. 20 (4), 417–428.
Connel, J., 1978. Diversity in tropical rain forests and coral reefs.Science 199, 1304–1310.
Flindt, M.R., Kamp-Nielsen, L., Marques, J.C., Pardal, M.A.,Bocci, M., Bendoricchio, G., Nielsen, S.N., Jørgensen, S.E.,1997. Description and comparison of three shallow estuaries:Mondego River (Portugal), Roskield Fjord (Denmark) and thelagoon of Venice (Italy). Ecol. Model. 102, 17–31.
Fonseca, J.C., Marques, J.C., Paiva, A.A., Freitas, A.M.,Madeira, V.M.C., Jørgensen, S.E., 2000. Nuclear DNA in thedetermination of weighing factors to estimate Exergy fromorganisms biomass. Ecol. Model. 126, 179–189.
Glansdorf, P., Prigogine, I., 1971. Thermodynamic Theory ofStructure, Stability and Fluctuations. John Wiley & Sons, NewYork.
Hardy, F.G., Evans, S.M., Tremaine, M.A., 1993. Long-termchanges in the marine macroalgae of three polluted estuariesin North-East England. J. Exp. Mar. Biol. Ecol. 172, 81–92.
Hartog, C., 1994. Suffocation of a littoralZostera bed byEnteromorpha radiata. Aquat. Bot. 47, 21–28.
Hodgkin, E.P., Hamilton, B.H., 1993. Fertilizers and eutrophicationin southwestern Australia: setting the scene. Fertil. Res. 36,95–103.
Holling, C.S., 1986. The resilience of terrestrial ecosystems: localsurprise and global change. In: Clark, S.C., Munn, R.E. (Eds.),Sustainable Development of the Biosphere. IIASA, CambridgeUniversity Press, pp. 292–317.
Jørgensen, S.E., 1997. Integration of Ecosystem Theories: APattern. Kluwer Academic Publishers, Dordrecht, 388 pp.
Jørgensen, S.E., Johnsen, I., 1989. Principles of EnvironmentalScience and Technology. Elsevier, Amsterdam, 627 pp.
Jørgensen, S.E., Mejer, H., 1979. A holistic approach to ecologicalmodelling. Ecol. Model. 7, 169–189.
Jørgensen, S.E., Nielsen, S.N., Mejer, H., 1995. Emergy, environ,Exergy and ecological modelling. Ecol. Model. 77, 99–109.
Jørgensen, S.E., Marques, J.C., Nielsen, S.N., 2002. Structuralchanges in an estuary, described by models and using Exergyas orientor. Ecol. Model. 158, 233–240.
Lavery, P.S., Lukatelich, R.J., McComb, A.J., 1991. Changes in thebiomass and species composition of macroalgae in a eutrophicestuary. Estuarine Coastal Shelf Sci. 33, 1–22.
Lewin, B., 1994. Genes. V. Oxford University Press, Oxford,620 pp.
Li, W.-H., Grauer, D., 1991. Fundamentals of Molecular Evolution.Sinauer, Sunderland, Massachusetts, 430 pp.
Lijklema, L., Hieltjes, A.H.M., 1982. A dynamic phosphate budgetmodel for a eutrophic lake. Hydrobiologia 91, 227–233.
Lillebø, A.I., Flindt, M.R., Pardal, M.A., Marques, J.C., 1999.The effect of macrofauna, meiofauna and microfauna on thedegradation ofSpartina maritimadetritus from a salt marsharea. Acta Oecol. 20 (4), 249–258.
Lopes, R.J., Pardal, M.A., Marques, J.C., 2000. Impact of macro-algae blooms and wader predation on intertidal macroin-
vertebrates—experimental evidence in the Mondego estuary(Portugal). J. Exp. Mar. Biol. Ecol. 249, 165–179.
Marques, J.C., André, J., Girão, R., Gonçalves, F., Guilhermino,L., Mortágua, A., 1984. Estudo bionómico dos povoamentosbentónicos do estuário do Mondego (Portugal). Resultadospreliminares. In: Actas do 4◦ Simpósio Ibérico de Estudos deBenthos Marinho, vol. I, Lisboa, 21–25 Maio, pp. 147–157.
Marques, J.C., Maranhão, P., Pardal, M.A., 1993a. Human impactassessment on the subtidal macrobenthic community structurein the Mondego estuary (Western Portugal). Estuarine CoastalShelf Sci. 37, 403–419.
Marques, J.C., Rodrigues, L.B., Nogueira, A.J.A., 1993b. Intertidalbenthic communities structure in the Mondego estuary (WesternPortugal): reference situation. Vie Milieu 43 (2/3), 177–187.
Marques, J.C., Pardal, M.A., Nielsen, S.N., Jørgensen, S.E., 1997.Analysis of the properties of Exergy and biodiversity along anestuarine gradient of eutrophication. Ecol. Model. 102, 155–167.
Martins, I., Marques, J.C., Jørgensen, S.E., Nielsen, S.N., 1997.Modelling the effects of green macroalgae blooms on thepopulation dynamicsCyathura carinata(Crustacea: Isopoda)in an eutrophicated estuary. Ecol. Model. 102, 33–53.
Martins, I., Oliveira, J.M., Flindt, M.R., Marques, J.C., 1999.The effect of salinity on the growth rate of the macroalgaeEnteromorpha intestinalis(Chlorophyta) in the MondegoEstuary (West Portugal). Acta Oecol. 20 (4), 259–266.
Martins, I., Pardal, M.A., Lillebø, A.I., Flindt, M.R., Marques,J.C., 2001. Hydrodynamics as a major factor controlling theoccurrence of green macroalgae blooms in an eutrophic estuary:a case study. Estuarine Coastal Shelf Sci. 52, 165–177.
Mitsch, W.J., Jørgensen, S.E. (Eds.), 1989. Ecological Engineering.An Introduction to Ecoechnology. John Wiley & Sons, NewYork, 472 pp.
Odum, E.P., 1971. Fundamentals of Ecology, 3rd ed. Saunders,Philadelphia.
Pardal, M.A., Marques, J.C., Metelo, I., Lillebø, A.I., Flindt, M.R.,2000. Impact of eutrophication on the life cycle, populationdynamics and production ofAmpithoe valida(Amphipoda)along an estuarine spatial gradient (Mondego estuary, Portugal).Mar. Ecol. Prog. Ser. 196, 207–219.
Raffaelli, D., Limia, J., Hull, S., Pont, S., 1991. Interactionsbetween the AmphipodCorophium volutatorand macroalgalmats on estuarine mudflats. J. Mar. Ass. U.K. 71, 899–908.
Sfriso, A., Marcomini, B.A., Pavoni, B., 1987. Relationshipsbetween macroalgae biomass and nutrient concentrations in ahypertrophic area of the Venice lagoon. Mar. Environ. Res. 22,297–312.
Ulanowicz, R.E., 1986. Growth and Development. EcosystemsPhenomenology. Springer-Verlag, New York, 203 pp.
Ulanowicz, R.E., 1997. Ecology—The Ascendent Perspective.Columbia University Press, 201 pp.
Valiela, I., 1995. Marine Ecological Processes, 2nd ed. Springer-Verlag, New York, 686 pp.
Zeeman, E.C., 1976. Catastrophe theory. Sci. Am. 234, 65–83.