Embed Size (px)
Citation preview

Technical Report NREL/TP-550-46273 July 2009
Impact of Electric Industry Structure on High Wind Penetration Potential M. Milligan and B. Kirby National Renewable Energy Laboratory
R. Gramlich and M. Goggin American Wind Energy Association

National Renewable Energy Laboratory 1617 Cole Boulevard, Golden, Colorado 80401-3393 303-275-3000 • www.nrel.gov
NREL is a national laboratory of the U.S. Department of Energy Office of Energy Efficiency and Renewable Energy Operated by the Alliance for Sustainable Energy, LLC
Contract No. DE-AC36-08-GO28308
Technical Report NREL/TP-550-46273 July 2009
Impact of Electric Industry Structure on High Wind Penetration Potential M. Milligan and B. Kirby National Renewable Energy Laboratory
R. Gramlich and M. Goggin American Wind Energy Association
Prepared under Task No. WER95501
NOTICE
This report was prepared as an account of work sponsored by an agency of the United States government. Neither the United States government nor any agency thereof, nor any of their employees, makes any warranty, express or implied, or assumes any legal liability or responsibility for the accuracy, completeness, or usefulness of any information, apparatus, product, or process disclosed, or represents that its use would not infringe privately owned rights. Reference herein to any specific commercial product, process, or service by trade name, trademark, manufacturer, or otherwise does not necessarily constitute or imply its endorsement, recommendation, or favoring by the United States government or any agency thereof. The views and opinions of authors expressed herein do not necessarily state or reflect those of the United States government or any agency thereof.
Available electronically at http://www.osti.gov/bridge
Available for a processing fee to U.S. Department of Energy and its contractors, in paper, from:
U.S. Department of Energy Office of Scientific and Technical Information P.O. Box 62 Oak Ridge, TN 37831-0062 phone: 865.576.8401 fax: 865.576.5728 email: mailto:[email protected]
Available for sale to the public, in paper, from: U.S. Department of Commerce National Technical Information Service 5285 Port Royal Road Springfield, VA 22161 phone: 800.553.6847 fax: 703.605.6900 email: [email protected] online ordering: http://www.ntis.gov/ordering.htm
Printed on paper containing at least 50% wastepaper, including 20% postconsumer waste
1
The Impact of Electric Industry Structure on High Wind Penetration Potential
Michael Milligan
National Renewable Energy Laboratory [email protected]
Brendan Kirby, Consultant
National Renewable Energy Laboratory [email protected]
Robert Gramlich, Policy Director
American Wind Energy Association [email protected]
Michael Goggin, Electric Industry Analyst
American Wind Energy Association [email protected]
Introduction Wind is an abundant renewable resource that provides a host of environmental and economic benefits. A record 8,358 megawatts (MW) of new wind generation was installed in the United States last year, bringing the total wind generation fleet capacity to 25,170 MW. No longer a research novelty, wind is now a competitive mainstream generation technology. Along with the environmental benefits of reducing CO2, SOx, NOx and mercury emissions, wind is a domestic resource that increases energy security and reduces electricity price volatility. Because wind generator output varies with the wind itself rather than responding to operator dispatch commands to burn fuel or release water, it is a different type of resource than most conventional generators. Extracting the maximum benefit from wind requires understanding and accommodating its unique characteristics. This is actually a familiar process that the power industry goes through every time a new generation or transmission technology is introduced. For example, power systems must accommodate conventional generators’ startup times, minimum run times, minimum off times, and minimum loads. Guaranteeing the availability and reliability of off-site power to nuclear units also constrains current utility operations. Power system characteristics that mitigate and accommodate variability make it easier to integrate wind into grid operations. Wind-friendly physical characteristics include geographically and electrically large balancing areas, as well as generator characteristics such as fast-ramping, load-following capability.i They also include generation and transmission market structures that provide access to conventional generation flexibility and maneuverability; the ability of a generator to ramp up and down quickly and

2
accurately, to turn on and off quickly and at low cost, and the ability to operate at low minimum loads. Advanced wind forecasting, integrated into the power system control room, can also help wind integration costs by providing the power system operator with a reliable look at the near future balancing requirements. This paper attempts to evaluate which balancing area (BA) characteristics best accommodate wind energy. Market structures are naturally dependent upon the physical and regulatory characteristics of the region they operate in and both physical and market characteristics are important. We find that open market structures with large geographic scope, along with day-ahead, hour-ahead, and sub-hourly market clearing accommodate wind integration by rewarding the maneuvering capability of conventional generators. Such markets are operated by Independent System Operators (ISOs) and Regional Transmission Organizations (RTOs), which also offer many of the characteristics necessary to effectively incorporate large amounts of wind generation. Today, these regions host a disproportionately large share of the wind generation in America. We also find that regional transmission planning, and implementing transmission expansion plans so that load and generation can be aggregated throughout a region, reduces the total amount of variability introduced by wind generation and further reduces wind integration costs. Lastly, in this paper we expand on a tool for evaluating a BA or region’s structural capabilities to accommodate high levels of wind integration first conceptually introduced by two of us (Gramlich and Goggin) in 2008. The tool allows a reviewer to numerically rate a BA in ten areas that are important for reducing wind integration costs. Comparisons of different BAs are possible as well as evaluating a single BA. Example ratings are provided which demonstrate how the tool might be used.
Relevant Characteristics of Wind Power for System Operators Wind power itself has four principal characteristics important to power system planning and operations: the wind generation is variable because the wind itself is variable, wind generation has a near-zero variable cost, wind and wind generation are difficult to forecast precisely, and the best wind sites are often located far from load centers. Wind is often described as “intermittent,” but since that term implies sudden changes in output and wind output changes vary over a period of hours—longer than the instantaneous outages that affect conventional units—we use the term “variable.” Failure to recognize these characteristics of wind generation will raise the financial and environmental costs of the nation’s overall electricity usage. It is important to note that the characteristics of wind are not unlike those of load. However, the magnitude of wind’s variability is greater than the variability of load on a per-unit basis, and wind is somewhat more difficult to forecast than load. Hence, the primary differences are more of degree than of kind. Wind is a variable and largely non-dispatchable resource. Given the high cost of energy fuels today, wind’s primary value is in supplying energy, not capacity. Wind saves fuel and reduces emissions. It is also a resource with a capital cost, but essentially no variable costs (fuel or operating costs). It almost always saves money to reduce production at fuel-

3
consuming power plants instead, and generate as much as possible at wind plants. It also generally makes more sense to reduce generation at hydro plants if they have a reservoir for storing water. Most reservoir base hydro systems are energy limited so saving water with wind increases the capacity value of the hydro system. Although modern wind turbine technology allows an operator to precisely curtail wind production when necessary, “spilling” free wind is only desirable when it is required for reliability reasons, or in the event that wind could supply ancillary services in the future. While annual wind energy production can be forecast with reasonable accuracy, it is more difficult to predict wind generation output a few hours or a few days in advance. Wind generator operators cannot commit to and follow generation schedules like conventional generation operators. Wind forecasts are getting better, however, and power system costs can be reduced when power system operators have an advanced wind forecast in the control room. The best wind resources are often located far from load centers and are frequently far from existing transmission lines. New wind plants often need significant transmission expansion before the full amount of new wind generation capacity can be accepted onto the grid and delivered to loads. Where new wind capacity precedes transmission expansion, the incremental wind generation may have to compete for transmission access with other generators and be delivered using non-firm capacity; such generation may often be curtailed due to reliability or transmission capacity limitations. A robust transmission system (coupled with sub-hourly scheduling) that allows wind and load variability to be aggregated over large distances further reduce the cost of wind integration. Therefore, wind greatly benefits from a long-term, regional approach to transmission planning. Of course, power system customers benefit from a robust regional transmission network with or without wind.
System Operation with Wind Wind’s characteristics can present challenges to the power system operator. Wind variability in itself is not unique; system operators continuously deal with load variability over all time frames from seconds to seasons. However, because wind is variable, it does add to aggregate variability. While the power system does not need to respond to the variability of each individual wind turbine, it is necessary to meet the North American Electric Reliability Corporation (NERC) reliability standards and balance aggregate load- net wind with aggregate generation. Adding wind to the generation mix will increase the control actions the conventional generators must take. Fortunately wind and load variability tend to be uncorrelated, so they do not add linearly, greatly reducing the net flexibility required from the conventional generators. This is based on the principle of statistical independence, described below. If additional flexibility is not valued by the market or incorporated into system plans, then there may not be sufficient response capability offered, making it more difficult to balance the system. Forecast error is not unique to wind either. System operators regularly deal with load forecast uncertainty. A one-degree weather forecast error, for example, can result in a 1000-MW summer peak-load forecast error for the California ISO. As with variability,

4
wind forecast errors add to load forecast errors, increasing the required conventional generator flexibility. Fortunately, as with variability, wind and load forecast errors tend to be uncorrelated, reducing the total required conventional generation flexibility.
Accommodating Wind Capturing the full environmental and economic benefits of wind generation requires looking at the power system slightly differently than in the past. One important difference is that energy production should be valued as well as capacity. This requires examining total annual fuel requirements (and emissions) as well as peak generation needs. Accommodating wind involves adjusting the power system structure to accept wind energy when and where it is available. This involves a combination of physical attributes and institutional support, along with incentives to achieve the desired physical attributes.
Physical Characteristics that Help Wind Economically dealing with wind’s variability and predictability requires a large, flexible power system. Physical size is important because the correlation between production from multiple wind plants diminishes as those plants are geographically farther apart (Figure 1). In the graph below, correlation between wind farms is lowest (approaches 0) when distances between wind plants are large.
To focus on the impact of geographic diversity impacts within the wind plant, Figure 2 illustrates the per-unit variability from a group of 15 turbines and a nearby group of 200 turbines. The graph is normalized by the average wind output. The lower panel shows the group of 15 turbines, and it is apparent that this grouping has much more variability per unit as compared to the upper panel. The coefficient of variation (standard deviation divided by mean) is 0.184 for the small cluster, and 0.126 for the large cluster.
Figure 1. Wind generator variability loses correlation as the distance between machines increases and as the time frame of interest decreases (Ernst, 1999).
4h Average
12-hour
1h Average30min Average
5min Average
2h Average

5
Figure 2. Geographic smoothing within a wind plant has a considerable smoothing impact using 1-second data for nearly 9 hours.
Preliminary results from the Eastern Wind Integration Study (EWITS) provide dramatic evidence of the benefits of large area aggregation (Figure 3). Enernex studied the wind variability from 71,671 MW of wind generation spread over most of the eastern interconnection. Mesoscale wind modeling was used to generate three years of historic wind data on a ten-minute basis and 2-kilometer grid spacing. Note how the variability of the total wind fleet (red bar) is well below the variability of the same wind resource when dealt with on an individual regional basis. And these are large regions to start with. Total wind is expected to vary by 10% from hour to hour less than 14 times per year. When 300,000 MW of wind are studied a 10% variation is expected less than four times per year. Large geography, coupled with robust transmission and market rules that support sub-hourly transactions allow wind aggregation over great distances and reduce the net variability which must be compensated for.

6
Figure 3. Enernex study performed for the Eastern Wind Integration and Transmission Study (EWITS) shows a dramatic reduction in wind variability when transmission supports aggregation over a large geographic area (Zavadil, 2009, draft results).
As with load, larger geographic and electrical size also makes forecasting easier. Table 1 shows that the wind forecasting error is reduced significantly when wind output from all four regions of Germany are compared with wind output from a single region. (Rohrig, 2005) This conclusion is reinforced by Ahlstrom (2008) – when aggregated over a broad geographic region, wind forecast errors can be reduced by as much as 30% to 50%. Thus, power system operators can more accurately predict and plan for changes in wind output when their systems are larger. Not surprisingly, forecasting accuracy also improves closer to real time. It is easier to forecast for short periods ahead, compared to longer periods in the future. Markets that operate closer to real-time take advantage of the improved forecasting accuracy by allowing more frequent generator schedule changes. Hour-ahead markets better accommodate wind than day-ahead markets. Sub-hourly markets have the least forecast error. A coordinated series of regularly clearing markets provides the best ability for conventional generation to adjust to changing wind conditions at least cost. RTOs and ISOs typically operate sub-hourly markets while other regions do not. This feature is one of the drivers of costs of software systems for RTOs and ISOs.
Hourly Wind Variability By Region Reference Scenario
0
500
1000
1500
2000
2500
3000
3500
4000
4500
-10.0% -7.5% -5.0% -2.5% 0.0% 2.5% 5.0% 7.5% 10.0%
Hourly Production Changes on Nameplate
Hou
rs p
er Y
ear
MAPP
NYISO
ISO-NE
MISO
TOTALPJM
SERC
SPP
TVA

7
Table 1. Wind forecasting accuracy improves when larger geographic areas are considered.
NRMSE Forecasting Error %
Germany (all 4 control zones) ~1000 km
1 German Control Zone ~350 km
Day ahead 5.7 6.8 4 hours ahead 3.6 4.7 2 hours ahead 2.6 3.5
The Principle of Statistical Independence Electric power systems are comprised of a very large number of components. A typical utility service territory (or market area) includes many thousands of individual customers. The behavior of these customers exhibits some statistical correlation over some time periods, but has little correlation over other periods. During the morning load pickup, customers are generally increasing their usage of electrical devices, leading to an overall increase in electric demand. However, during very short periods of time, such as seconds to minutes, some loads are increasing at the same time that other loads are decreasing. There is no correlation between these random events; one customer turns on the lights at the same time as another customer turns off the lights. These events, when they occur simultaneously, have no net impact on electrical demand. Wind turbines have a similar statistical property. During the short time periods of seconds or minutes, one wind turbine may be experiencing an increase in wind speed, resulting in more wind power output from the turbine. At the same moment, another wind turbine may experience a decline in wind speed and power output. The random nature of these events can be captured statistically, and are formally described as uncorrelated events. It is important to note that if wind turbine A always runs counter to wind turbine B, then they are perfectly negatively correlated (correlation coefficient is -1). But if sometimes the turbines move together, and other times move in opposite directions, this lack of correlation has important implications for balancing requirements. The principle of statistical independence is the reason why each increase in customer demand (resulting from a switched on light, for example) does not need to be matched by a corresponding increase in generation. Because other customers are switching off their lights at the same time, statistical methods can be used to calculate the amount of generation required to match the aggregate change in load. This principle of statistical independence over short time frames applies to loads, wind turbines, and to load and wind combined. This article illustrates this concept in several different contexts: load, wind, load and wind, and wind forecasts are all subject to the principle of statistical independence.

8
Aggregation and Large Balancing Area Size Utilities have taken advantage of aggregation for decades. Since each balancing area only has to compensate for the variability in its aggregate load, and since random variations in individual loads partially cancel each other out, larger balancing areas require relatively less system balancing through “regulation” service than smaller balancing areas. As shown above, the same principle applies to integrating wind: larger balancing areas are better able to integrate large amounts of wind because the random variability of individual wind generators and individual loads partially cancel each other out. This is based on the principle of statistical independence. If multiple remote wind plants are grouped and operated together within a single balancing area, their overall variability falls and it costs less to integrate their production into grid operations. Having a deep pool of flexible generation that can respond to variations in wind output helps system operators and reduces the cost of system balancing. Larger balancing areas have larger generation pools. Greater flexibility is a function of the generation mix, but larger pools always provide greater flexibility than smaller pools of the same generation mix. As an example of the benefit of the larger balancing areas, we analyzed the consequences of balancing area consolidation in Minnesota, both with and without wind (Milligan and Kirby, 2007). Neighboring balancing areas will sometimes need to redispatch their generation in different directions at the same time. This happens when the load in one balancing area is increasing during a period when the load is decreasing in another balancing area. During such times, it would be beneficial for both systems to net their load ramping requirements, which would result in less ramping of generation in both balancing areas. Using hourly data, we calculated the ramping that could be eliminated if the four balancing areas in Minnesota were to combine. The graph for one full year of hourly load data is shown in Figure 4. Opposite ramping does not occur in all hours, but it is apparent from the graph that 50 MW/hr or more can be reduced during much of the year, resulting in approximately a 14% reduction in ramping requirements (both up and down) annually if operations are combined. This reduction in load ramping requirements translates into lower cost of serving loads in all affected balancing areas. In Figure 4 below, the top graph shows the load ramping movements that would cancel out and need not be performed if the four Minnesota balancing areas were combined. Cancellation happens whenever one balancing area is ramping up while another is ramping down. Benefits are spread throughout the year, but can be seen to vary from hour to hour. The lower portion of Figure 4 reorganizes the same ramping information into a ramp-duration curve, which shows that, absent balancing area consolidation, there is as much as 75 MW of costly, unnecessary load-following generation in Minnesota attempting to compensate for the net variability of loads. This graph is based on loads only; there is no wind in the system portrayed by this graph.

9
Figure 4. Physical ramping requirements can be reduced by consolidating balancing areas (hourly load data).
Combining balancing areas provides multiple benefits for loads, as seen in Figure 4. Because wind is also subject to the principle of statistical independence, wind variability declines on a per unit basis when more wind is added to the system. An example of this benefit for a large wind penetration is shown in Figure 5, where the benefits of consolidated operations, such as would be provided by an RTO or ISO, is more significant than portrayed for load alone in Figure 4. What these figures show is that excess ramping, which is unneeded and costly, is significant when balancing areas operate independently. Some balancing areas must ramp generation up at the same time that other balancing areas are ramping down. If operations could be coordinated, much of this ramping, and the associated costs, could be eliminated. The figure shows that, with wind, the maximum unnecessary ramp is approximately 400 MW, and is matched by a -400 MW ramp. This bi-directional ramp requirement could be eliminated if the balancing areas would combine operations. Balancing areas can be consolidated either physically or virtually. Physically combining balancing areas is straightforward, but may not always be desirable. Two or more balancing areas can retain their autonomy and still capture much of the aggregation benefit by electronically combining their Area Control Errors (ACE). Each can control to an allocated portion of the combined ACE, assuring that reliability is met at lower cost.ii
Sub-hourly scheduling can provide fast access to neighboring markets, allowing trading of opposite ramping requirements.

10
Figure 5. Combining balancing areas can reduce ramping requirements for systems that have significant wind and load.
Additional work by Milligan and Kirby (2008, An Analysis of Sub-Hourly Ramping Impacts of Wind Energy and Balancing Area Size: http://www.nrel.gov/docs/fy08osti/43434.pdf) found that large, infrequent 5-minute ramps can be avoided when BA’s are combined. Figure 6 shows this impact does not only apply to regions with large wind penetrations, but also may apply to loads only.

11
Figure 6. Large infrequent ramps can be significantly reduced by combining balancing areas.
These results are corroborated by the New York State wind integration study which found that combined operation of the eleven zones in the New York State power system reduces hourly load variability by 5% and five-minute load variability by 55%.iii
Figure 4
(GE Energy, 2005). Hourly wind variability is reduced by 33% and five-minute wind variability is reduced by 53% with state-wide operations. Hourly system variability is further reduced by 10% and five-minute system variability is reduced by 15% when wind and load are considered together. Note that while operating large balancing areas helps reduce the cost of wind integration, it also helps reduce the cost of serving load with or without wind (as pointed out in for the no-wind case). The benefits of large electricity markets apply to systems around the world. In a recent report for the International Energy Agency (Holttinen et al, 2007), the authors conclude “Larger balancing area size and wind aggregation: both load and generation benefit from the statistics of large numbers as they are aggregated over larger geographical areas. Larger balancing areas make wind plant aggregation possible. The forecasting accuracy improves as the geographic scope of the forecast increases; due to the decrease in correlation of wind plant output with distance, the variability of the output decreases as more plants are aggregated. On a shorter time scale, this translates into a reduction in reserve requirements;

12
on a longer time scale, it produces some smoothing effect on the capacity value. Larger balancing areas also give access to more balancing units.” (page 107).
The Value of Energy Markets Markets help economically and reliably integrate wind both in how they treat wind generators and in how they treat conventional generators. Markets that allow variable resources to sell excess energy or purchase shortages at transparent and fair prices accommodate the natural characteristics of wind while reflecting the true real-time cost of maintaining reliability. More generally, generation scheduling rules and the energy market structure itself are the most important factors in tapping the physical flexibility of the conventional generation fleet. Sub-hourly energy markets provide economic signals that make it profitable for conventional generators to respond to fluctuations in load and wind. Scheduling rules that restrict generators to hourly movements artificially hobble the conventional generation fleet, resulting in lost opportunities for those generators and increased costs for all. Markets that encourage conventional generation movement when it helps increase reliability, and do not restrict generators to only changing output at the top of each hour, reduce costs. Markets can provide direct economic incentives for generation flexibility if the current fleet does not have enough. RTOs and ISOs in the United States have fast energy markets, which result in a new economic dispatch every 5 to 15 minutes, depending on the market. The fast energy markets make it possible to hold the regulating units closer to their preferred operating point because they can be brought back to the mid-point of their operating range much faster than if the redispatch did not occur for an hour. Therefore, there is less need for regulation in faster energy markets. This results in a significant reduction in costs because regulation is typically the most expensive ancillary service. Thus, when calculating wind integration costs, such features that reduce balancing costs generally will lead to lower wind integration costs. Enhancing the flexibility of the conventional generation fleet helps to accommodate wind. This can involve valuing physical flexibility as other generators are built: fast start generators, lower minimum load capability, and high ramp rates are all valuable. Participation in the fast energy markets also encourages generators to move to the operating level that is consistent with their energy bids. Table 2 provides average hourly prices from day-ahead, hour-ahead, and real-time 5-minute energy markets from five ISOs for all of 2008. Note that the average prices are reasonably consistent from day-ahead to hour-ahead to real-time with only a dollar or two difference. The average within-hour price differences for the 5-minute markets (15-minute market in Texas) are very high by contrast. This implies that ISOs send strong economic signals to move economic generation within the hour but that the load following response they obtain does not have a high cost. If the within hour response were expensive the average prices from the 5-minute markets would be higher than the hourly prices, but they are not. This

13
can have important consequences for wind integration, and is discussed further in that context below. Table 2. Annual average prices for 2008 show consistency between hourly energy markets. Sub-hourly markets show strong volatility.
ISO Day-Ahead $/MWh
Hour-Ahead $/MWh
5-Minute $/MWh
Average Within-Hour 5-Minute Range
$/MWh NYISO $67.70 $64.93 $63.31 $91.18 ISO-NE $81.38 $80.76 $81.22 $24.40 CAISO $69.78 $68.32 $59.87
ERCOT1 $71.69 $40.00 MISO $49.99 $48.62 $48.71 $67.75
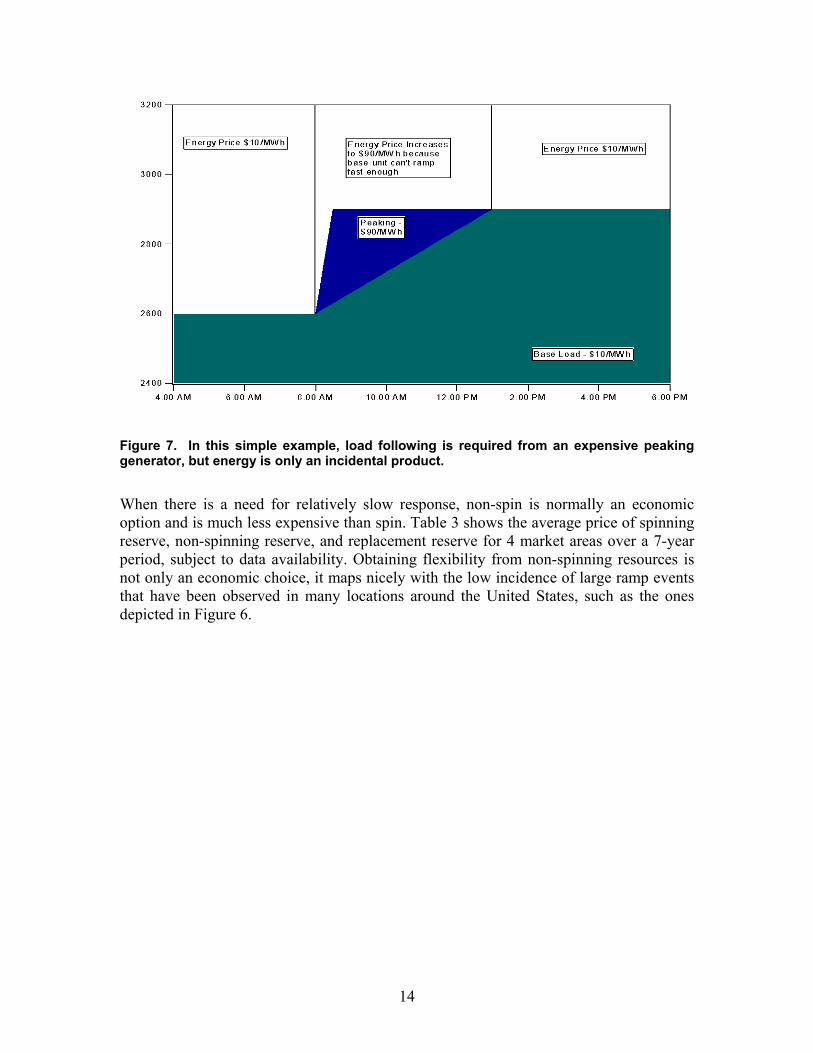
1ERCOT currently operates a 15-minute sub-hourly market rather than a 5-minute market. It is possible for a power system to have insufficient ramping capability with inappropriate consequences for energy prices if maneuverability is not directly valued. Figure 7 presents a simplified example where a fast energy market, which normally provides load following as a byproduct, may have difficulty providing ramp capacity under some conditions. Prior to 8:00 a.m., the example system is serving a 2,550 MW load with over 3,000 MW of baseload generation, and therefore clearing all energy at $10/MWh. At 8:00 a.m., a 300 MW ramp starts which the baseload generation cannot follow. There is ample baseload capacity; it simply cannot ramp fast enough. Peaking generation (the only other generation in this example system) is started to meet the ramp needs. The peaking generator stays on until baseload generation can ramp up. With no explicit ramping service, the price rises for the entire energy market (all 2,850 MW) from $10/MWh to $90/MWh for 5 hours, just to follow a 30-minute 300-MW ramp. In this case, it might be better to create a separate ramping or load following service and pay the peaking generator for its response, rather than distorting the price of the entire energy market. It is very important to determine if ramping requirements can be served at a low cost as a byproduct of the sub-hourly energy market (the typical condition), or if ramping requirements impose a high cost because dedicated resources must be used. Fortunately market monitors can detect this condition and recommend the establishment of a ramping service if the condition is persistent. (Milligan and Kirby, 2007)
14
Figure 7. In this simple example, load following is required from an expensive peaking generator, but energy is only an incidental product.
When there is a need for relatively slow response, non-spin is normally an economic option and is much less expensive than spin. Table 3 shows the average price of spinning reserve, non-spinning reserve, and replacement reserve for 4 market areas over a 7-year period, subject to data availability. Obtaining flexibility from non-spinning resources is not only an economic choice, it maps nicely with the low incidence of large ramp events that have been observed in many locations around the United States, such as the ones depicted in Figure 6.

15
Table 3. Non-spinning reserve is an order of magnitude less expensive than spinning reserve.
The Benefits of RTOs and ISOs for Wind Of the various utility structures operating in the United States today, ISOs and RTOs provide the best environment for wind generation development. They provide electrically and geographically large open markets for wind integration. They operate sub-hourly balancing markets which can tap the physical maneuvering capabilities of the conventional generators. Balancing payments are typically based upon cost causation rather than on arbitrary penalties. A summary of utility industry research by the Utility Wind Integration Group (UWIG - www.uwig.org) states that “well-functioning hour-ahead and day-ahead markets provide the best means of addressing the variability in wind plant output.” This assertion is based on evidence from wind integration studies such as GE Energy (2005) for the NY ISO. Markets are also cited as helping with wind integration in the International Energy Agency (IEA) report on wind integration on large power systems (Holtinnen, 2007) and by Smith et al, (2007). The UWIG document also says that, “consolidation of balancing areas or the use of dynamic scheduling can improve system reliability and reduce the cost of integrating additional wind generation into electric system operation.” This is also based on evidence from NY (GE Energy, 2005) and MN (Zavadil, 2006, and Milligan & Kirby, 2007). Not surprisingly, ISOs and RTOs host a disproportionate amount of wind generation: 72% of installed wind capacity is now located in ISO and RTO regions, even though only
2002 2003 2004 2005 2006 2007 2008 Annual Average $/MW-hr
California (Reg = up + dn) Regulation 26.9 35.5 28.7 35.2 38.5 26.1 33.4
Spin 4.3 6.4 7.9 9.9 8.4 4.5 6.0 Non-Spin 1.8 3.6 4.7 3.2 2.5 2.8 1.3
Replacement 0.90 2.9 2.5 1.9 1.5 2.0 1.4 ERCOT (Reg = up + dn)
Regulation 16.9 22.6 38.6 25.2 21.4 43.1 Responsive 7.3 8.3 16.6 14.6 12.6 27.2
Non-Spin 3.2 1.9 6.1 4.2 3.0 4.4 New York
Regulation 18.6 28.3 22.6 39.6 55.7 56.3 59.5 Spin 3.0 4.3 2.4 7.6 8.4 6.8 10.1
Non Spin 1.5 1.0 0.3 1.5 2.3 2.7 3.1 30 Minute 1.2 1.0 0.3 0.4 0.6 0.9 1.1
New England (Reg +”mileage”) Regulation 54.64 30.22 22.26 12.65 13.75
Spin 0.27 0.41 1.67 10 Minute 0.13 0.34 1.21 30 Minute 0.01 0.09 0.06

16
44% of wind energy potential and only 53% of electric demand is in these areas. Table 4 shows how wind was distributed inside and outside ISO and RTOs. Table 4. At the end of 2008 more wind was located in ISO/RTOs than outside ISO/RTOs (M.
Goggin, AWEA Projects Database, www.awea.org).
Wind in RTO/ISO Wind in Non-RTO
RTO State Capacity State CapacityERCOT Texas 7,116 Iowa 1,391 CAISO California 2,320 Washington 1,375 MISO Minnesota 1,752 Colorado 1,068 MISO Iowa 1,399 Oregon 1,067 MISO/PJM Illinois 915 Wyoming 676 NYISO New York 882 New Mexico 296 SPP Kansas 815 Montana 272 SPP Oklahoma 708 California 196 MISO North Dakota 539 North Dakota 175 MISO Wisconsin 395 Missouri 163 PJM Pennsylvania 361 Idaho 75 PJM West Virginia 330 Nebraska 73 SPP New Mexico 202 Hawaii 63 MISO South Dakota 143 South Dakota 45 MISO Michigan 129 Tennessee 29 NEISO Main 47 Utah 20 NEISO New Hampshire 25 Alaska 3 PJM New Jersey 8 Arkansas 0 PJM/MISO Ohio 7 Non-RTO Total 6,987 NEISO Vermont 6 NEISO Massachusetts 5 NEISO Rhode Island 1
RTO Total 18,104
A recent study required by the Minnesota legislature to assess the reliability and cost of providing 20% of the state’s electricity from wind provides a good example of how open markets can facilitate wind integration:
“The MISO [Midwest Independent System Operator] energy market also played a large role in reducing wind generation integration costs. Since all generating resources over the market footprint are committed and dispatched in an optimal fashion, the size of the effective system into which the wind generation for the study is integrated grows to almost 1200 individual generating units. The aggregate flexibility of the units on line during any hour is adequate for

17
compensating most of the changes in wind generation.” (See www.puc.state.mn.us/docs/windrpt_vol%201.pdf.) (Zavadil, 2006)
ISO and RTO Characteristics The ISOs grew out of the Federal Energy Regulatory Commission (FERC) Orders Nos. 888 and 889. These orders required transmission operators to provide competing generators non-discriminatory access to the transmission system. Subsequently, FERC Order No. 2000 encouraged RTO formation, which included the characteristics of an ISO plus a requirement for sufficient regional scope. An organization must satisfy 12 characteristics and functions to earn FERC approval as an RTOiv
1. independence :
2. operational authority 3. regional scope (generally implies a large geographic and electrical scope) 4. reliability authority 5. tariff design 6. parallel path flow 7. market monitoring 8. transmission planning 9. congestion management 10. supply ancillary services 11. OASIS and transmission capacity 12. inter-regional coordination.
Operational authority and regional scope capture the benefits of uncorrelated change in loads over various time frames, and can provide a larger, more robust dispatch stack that can potentially reduce per-unit costs. Figure 8 shows how RTOs and ISOs are distributed across the United States and Canada. Large areas benefit from aggregation of loads, which has been one of the driving principles behind the large number of reserve-sharing agreements that have been forged over the past several decades. Combining the characteristics of a large resource stack also provides significant benefits because of the increased aggregate response capability that exists in a larger generation portfolio.
Wind Integration Costs Wind integration studies typically show lower wind integration costs for ISO and RTO markets than for non-ISO/RTO areas. These studies quantify the costs of additional reserves, changes in unit commitment and dispatch, gas nominations, etc. Integration costs are separate from energy and emissions benefits. Table 5 shows results from several recent wind integration studies (Smith et. al, 2007, Northwest Wind Integration Action Plan, 2007, http://www.nwcouncil.org/energy/wind/Default.asp).v In general, the studies show lower integration costs in ISO/RTOs than in smaller, single-utility service areas. The integration costs for the three ISO/RTO studies range from zero to $4.41/MWh of wind, while the integration costs for the two non-ISO/RTO studies range from $8.84 to $16.16/MWh. One reason for these results is that the three ISO/RTOs operate sub-hourly markets, i.e. they dispatch generation on a five to fifteen-minute time frame, while the two non-ISO/RTOs require generators to follow hourly schedules and obtain all sub-

18
hourly balancing from regulating units. Another reason for these results is the large size of ISOs and RTOs, which means there is much more conventional generation with ramping capability available to respond to changes in wind output while maintaining the balance between generation and load, thereby reducing wind integration costs. (ISO/RTO Council, 2007)
Figure 8. ISOs and RTOs in North America have broad geographic and electrical reach. Note that Nebraska is now part of SPP.

19
Table 5. Wind Integration Cost Study Results.
Date Study ISO/RTO Wind Capacity Penetration
Integration Cost: $/MWh of Wind Output
Energy Market Interval
3/05 NYISO ISO/RTO 10% Very Low 5 minute 12/06 Minnesota/MISO ISO/RTO 31% $4.41 5 minute 2/07 GE/Pier/CAIAP(a) ISO/RTO 33% $0-$0.69 10 minute 3/07 Avista No 30% $8.84 1 hour 3/07 Idaho Power(b) No 30% $7.92 1 hour (a) Includes two-thirds wind and one-third solar and includes cost increases of regulation and load following assigned to regulation. (b) Reduced from $16.16 in September, 2007, settlement proceedings.
Wind Integration is facilitated by Energy Markets in Europe Evidence from the United States is corroborated by evidence in Europe. Denmark, Germany, and Spain have all integrated large amounts of wind generation into their power systems. Their experience points to the benefits of operating in a region with a robust spot electricity market. (Holttinen, 2007) West Denmark already receives 24% of its electric energy from wind. Participation in the Nordpool spot market greatly helps wind integration. Holttinen notes that added reserve requirements in the Nordic countries would be double if they operated as single countries compared to operating as a combined pool. Pool operation also reduces the need to curtail wind when there is excess production in one country. Denmark has not needed to increase the amount of operating reserves because of wind, but it does use the reserves more often. Holttinen (2007) shows that West Denmark has experienced times when wind power has exceeded the load. Figure 9, taken from the IEA publication, illustrates one such time period. Note the wind generation exceeding load during light-load nighttime conditions at hours 13, 82-87 and 107-113. Wind generation nearly exceeded load during hours 156, 204 and 228. During the high-wind/low-load events, West Denmark was able to export the surplus wind energy to markets in Norway and Sweden using DC transmission connections. Since Norway and Sweden have hydroelectric generation with water storage capabilities, they use the imported Danish wind in lieu of hydropower and use the hydropower at other times.

20
Figure 9. West Denmark can export excess wind power to other energy markets when wind exceeds load.
North Germany receives 33% of its energy from wind. As noted earlier, (Table 1) forecasting errors are reduced by integrating wind generation across the four German regions. Transmission ties are being strengthened to increase the size of the region over which wind variability and load-following generation can be aggregated. Germany too has seen an increase in the use of operating reserves, but no increase in the amount of reserves needed. Spain, with 24% to 30% of electric energy coming from wind in various regions, has not required increased operating reserves though it also uses the reserves more often. Spain also derives large benefits from integrated interregional operations. The European Wind Energy Association (EWEA) advocates regional markets as an important policy for the integration of wind: “the capacity of the European power system to absorb significant amounts of wind power is determined more by economics and regulatory rules than by technical or practical constraints.” The European Commission cites the need for increased cross-border transmission links and increased liquidity in wholesale electricity markets as barriers to increased wind integration in its 2005 Benchmarking report. EWEA also notes that the large geographical spread of wind power will reduce variability, increase predictability, and decrease the occurrences of near-zero or peak wind output. (Van Hulle, 2005)
West Denmark January 3-15, 2005
0
500
1000
1500
2000
2500
3000
3500
4000
1 49 97 145 193 241 289hour
MW
WindLoad

21
Some Non-RTOs are Adopting or Evaluating RTO-like Functions In large parts of the western part of the U.S., there is no RTO or ISO, and energy markets are not robust. However, there is significant interest in developing cooperative agreements among balancing areas that would provide some of the benefits of consolidation. The Northern Tier Transmission Group (NTTG) (www.nttg.biz) developed an ACE Diversity Interchange (ADI) pilot program that allows for the sharing of regulation across regions. There is significant interest in this project, and WestConnect (www.westconnect.com) has joined the NTTG ADI project, and continues to investigate wholesale market enhancements and seams issues in the footprint. The National Renewable Energy Laboratory (NREL) has begun a large Western Wind and Solar Integration Study. The focus of the study is the WestConnect footprint, but the entire U.S. portion of the Western Electricity Coordinating Council (WECC) will be modeled and high wind and solar penetrations will be analyzed. Figure 10 shows the study footprint. One of the scenarios will consider the benefit of consolidated balancing area operations and examine the potential benefit for integrating a high penetration of renewable energy sources. In the Pacific Northwest, the Bonneville Power Administration convened stakeholders and utilities to examine how the region could best position itself to integrate up to 6,000 MW of wind that may be developed in the next several years. The result of this effort is the Northwest Wind Integration Action Plan (http://www.nwcouncil.org/energy/Wind/library/2007-1.pdf). Among the items on the agenda for the Northwest Wind Integration Action Plan are “(1) developing more cooperation between regional utilities to spread the variability of wind more broadly; (2) developing markets that will reward entities who choose to market their surplus flexibility.” Other parts of the report indicate a need for “developing more robust markets for control area services that will provide needed electric services for smaller control areas with substantial wind resources” (page 13).

22
Figure 10. NREL's Western Wind and Solar Integration Study focuses on the WestConnect footprint and models the U.S. portion of the WECC footprint.
Although the outcomes of these various initiatives cannot be precisely predicted, they are further indication that when analysts consider how to integrate wind, market structure and design changes can offer significant benefits. The combination of regions in the Northwest and in WestConnect covers nearly the entire West that is not currently part of the California ISO or the Southwest Power Pool (parts of eastern New Mexico).
System Evaluation Tool The System Evaluation Tool (Figure 11) is a spreadsheet based instrument for assessing how accommodating the structure of a balancing area (BA) or region is to the integration of large amounts of wind generation. It is especially useful in comparing regions or BAs. The judgments are necessarily subjective but the subjectivity is limited and provided some structure. The evaluator provides a numeric rating between 1 and 10 for each BA in the ten areas discussed previously: one is the poorest performance and ten is the best.
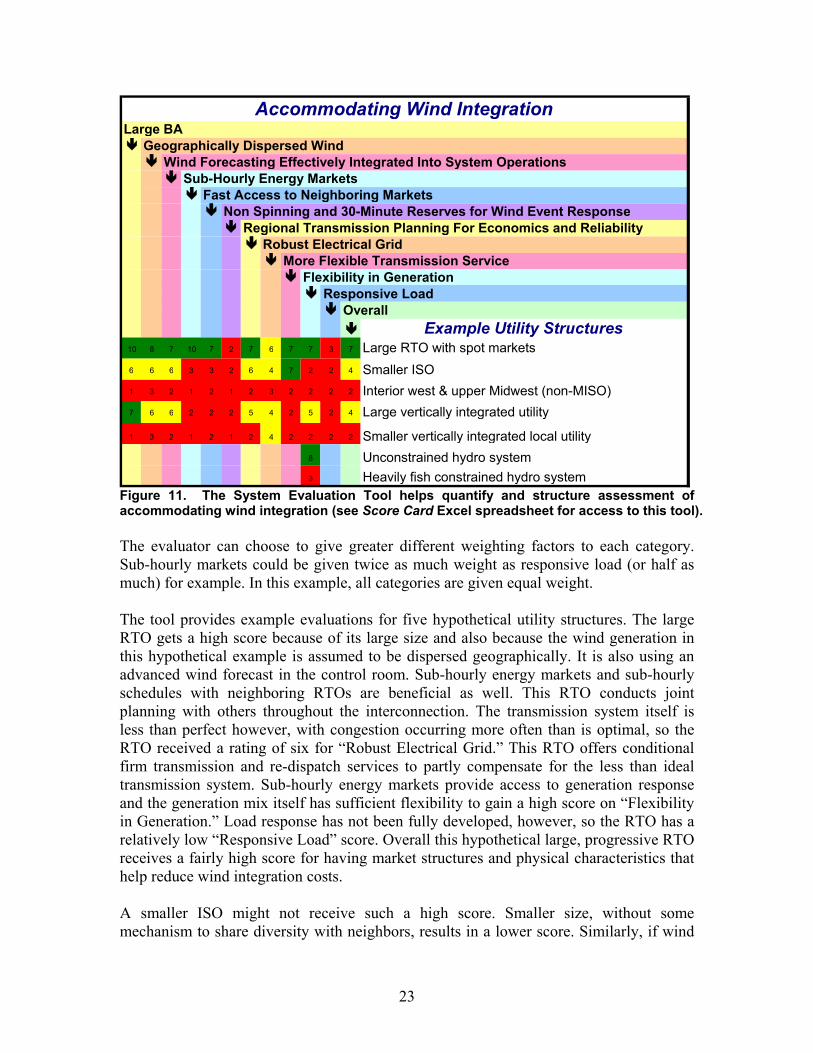
23
Figure 11. The System Evaluation Tool helps quantify and structure assessment of accommodating wind integration (see Score Card Excel spreadsheet for access to this tool). The evaluator can choose to give greater different weighting factors to each category. Sub-hourly markets could be given twice as much weight as responsive load (or half as much) for example. In this example, all categories are given equal weight. The tool provides example evaluations for five hypothetical utility structures. The large RTO gets a high score because of its large size and also because the wind generation in this hypothetical example is assumed to be dispersed geographically. It is also using an advanced wind forecast in the control room. Sub-hourly energy markets and sub-hourly schedules with neighboring RTOs are beneficial as well. This RTO conducts joint planning with others throughout the interconnection. The transmission system itself is less than perfect however, with congestion occurring more often than is optimal, so the RTO received a rating of six for “Robust Electrical Grid.” This RTO offers conditional firm transmission and re-dispatch services to partly compensate for the less than ideal transmission system. Sub-hourly energy markets provide access to generation response and the generation mix itself has sufficient flexibility to gain a high score on “Flexibility in Generation.” Load response has not been fully developed, however, so the RTO has a relatively low “Responsive Load” score. Overall this hypothetical large, progressive RTO receives a fairly high score for having market structures and physical characteristics that help reduce wind integration costs. A smaller ISO might not receive such a high score. Smaller size, without some mechanism to share diversity with neighbors, results in a lower score. Similarly, if wind
Large BA Geographically Dispersed Wind
Wind Forecasting Effectively Integrated Into System Operations Sub-Hourly Energy Markets
Fast Access to Neighboring Markets Non Spinning and 30-Minute Reserves for Wind Event Response
Regional Transmission Planning For Economics and Reliability Robust Electrical Grid
More Flexible Transmission Service Flexibility in Generation
Responsive Load Overall
Example Utility Structures 10 8 7 10 7 2 7 6 7 7 3 7 Large RTO with spot markets 6 6 6 3 3 2 6 4 7 2 2 4 Smaller ISO 1 3 2 1 2 1 2 3 2 2 2 2 Interior west & upper Midwest (non-MISO) 7 6 6 2 2 2 5 4 2 5 2 4 Large vertically integrated utility 1 3 2 1 2 1 2 4 2 2 2 2 Smaller vertically integrated local utility
8 Unconstrained hydro system 3 Heavily fish constrained hydro system
Accommodating Wind Integration

24
generation is concentrated within the ISO the score for wind diversity is reduced. This ISO has not developed sub-hourly energy markets and does not engage in sub-hourly schedule adjustments with neighbors so it receives especially low marks. With less regional focus on transmission planning and greater congestion this ISO receives a lower score though offering conditional firm and re-dispatch gets a high score for transmission flexibility. This ISO primarily has large base-load generators with little flexibility and, like most, has yet to fully develop responsive load. Overall this smaller ISO receives a lower score than the large, progressive RTO. Small independent BAs would typically receive low scores because they do not have sufficient load diversity or wind diversity to reduce the relative variability. They may not use wind forecasts in the operations center. Typically, they do not operate sub-hourly markets or adjust schedules with neighbors more frequently than each hour. They may not engage in regional transmission planning to alleviate economic as well as reliability concerns and they may not offer effective re-dispatch or conditional firm transmission service. Generation is likely inflexible because of the smaller number of generators resulting more difficult minimum load problems. Large, vertically integrated utilities can have an electrically and geographically large footprint though typically not as large as the largest RTOs. Wind may or may not be geographically dispersed; in this example we assume that it is somewhat concentrated. We also assumed that a persistence forecast was available in the control room. With no sub-hourly markets and no sub-hourly coordination with neighbors the BA receives low marks. Regional transmission planning and transmission adequacy need improvement. Effective re-dispatch and conditional-firm transmission service are not offered. Generation is moderately flexible but load is not. Overall this large vertically integrated utility receives marks that are similar to those given to the hypothetical smaller ISO. Lastly, the figure compares an unconstrained hydro system with a constrained hydro system in the generation flexibility category. Some hydro generation can be very flexible with fast ramping capability, rapid cycling, and excellent control. An unconstrained hydro system would receive high marks for flexibility and its ability to accommodate load and wind variability. Biological constraints can remove much of that flexibility, however. Still, constrained hydro systems should be carefully examined to determine how their flexibility can best be used to maximize their profit and to help integrate wind. Wind’s fuel saving capability should be able to maximize the capacity value of a hydro system by saving water. These examples are all hypothetical. The value of the tool is that it supports the evaluation of individual BAs as well as comparing the relative capabilities of several BAs. A regulator could use the tool as part of a process designed to identify needed improvements in market structures and reliability rules as well as in transmission and generation facilities.

25
Conclusions Wind power has emerged from being a technical curiosity to being a serious participant in the U.S electric power supply mix, offering environmental, economic, security, and reliability benefits. With over 25,170 MW of wind capacity currently operating and 8,358 MW installed in 2008, power system operators are learning how to exploit the benefits of wind and to accommodate its limitations. Experience from the United States and Europe, which has significantly higher penetration rates than currently seen in the United States, indicates that larger markets and balancing areas that are a central feature of ISOs and RTOs, can improve the physical conditions needed to integrate large amounts of wind energy. ISOs and RTOs, with their day-ahead and real-time markets, large geographies to aggregate diverse wind resources, large loads to aggregate with wind, large generation pools that tap conventional generator flexibility, and regional transmission planning efforts, offer the best environments for wind generation to develop. It is not surprising that ISOs and RTOs host a disproportionate amount of wind generation. Recent efforts at large scale transmission planning such as the Joint Coordinated System Plan, the Eastern Wind Integration and Transmission Study, the Western Wind and Solar Integration Study, and the ERCOT Competitive Renewable Energy Zone process all show the benefits of removing congestion on a regional bases, both for wind integration and for reducing overall power costs for consumers. The evaluation tool we describe in this paper provides a systematic way to assess how well a BA is positioned to integrate wind and to identify where improvements are needed.
Acknowledgements The authors thank the National Renewable Energy Laboratory for supporting this effort.
Further Reading and Resources J. Smith, M. Milligan, E. DeMeo, B. Parsons, “Utility Wind Integration and Operating Impact State of the Art,” http://www.nrel.gov/docs/fy07osti/41329.pdf. Utility Wind Integration Group web site: www.uwig.org, and the joint statement by UWIG, EEI and NRECA (http://www.uwig.org/UWIGIntSummary.pdf).
References Zavadil, R. 2009, Eastern Interconnection Wind Integration & Transmission Study, TRC Meeting #3, Peabody Little Rock Hotel, Little Rock, Arkansas, February 11-12. Gramlich, R. and Goggin, M. 2008, The Ability of Current U.S. Electric Industry Structure and Transmission Rules to Accommodate High Wind Energy Penetration, 7th International Workshop on Large Scale Integration of Wind Power and on Transmission Networks for Offshore Wind Farms.
26
Ahlstrom, M, 2008. Short-term Forecasting: Integration of Forecast Data into Utility Operations Planning Tools, presented at the Utility Wind Integration Group/National Renewable Energy Laboratory Wind Forecasting Applications to Utility Planning and Operations, St. Paul, MN. Feb 21-22. M. Milligan and B. Kirby 2007, The Impact of Balancing Areas Size, Obligation Sharing, and Ramping Capability on Wind Integration, WindPower 2007. (CAISO 2007, Integration of Renewables, http://www.caiso.com/1ca5/1ca5a7a026270.pdf, November). (ERCOT, 2006, Analysis of Transmission Alternatives for Competitive Renewable Energy Zones in Texas). GE Energy, 2005, The Effects of Integrating Wind Power on Transmission System Planning, Reliability, and Operations: Report on Phase 2, Prepared for The New York State Energy Research and Development Authority. ISO/RTO Council, 2007, Increasing Renewable Resources: How ISOs and RTOs are Helping Meet This Public Policy Objective, ISO/RTO Council, October 16. Holttinen H., et al, 2007, Design and Operation of Power Systems with Large Amounts of Wind Power: State of the Art Report, VTT Working Paper 82, IEA Wind. Rohrig, K. (ed.), 2005. Entwicklung eines Rechenmodells zur Windleistungsprognose für das Gebiet des deutschen Verbundnetzes. Abschlussbericht Forschungsvorhaben Nr. 0329915A, gefördert durch Bundesministeriums für Umwelt, Naturschutz und Reaktorsicherheit (BMU). Kassel, Germany. Spees, K. and Lave, L., 2007, Do RTOs Promote Renewables? A Study of State-Level Data over Time, Carnegie Mellon Electricity Industry Center Working Paper CEIC-07-14, December 3. U.S. Department of Energy, 2002, National Transmission Grid Study, May. F. Van Hulle, 2005, Large Scale Integration of Wind Energy in the European Power Supply: Analysis, Issues and Recommendations, European Wind Energy Association, www.ewea.org, December. R. Zavadil, et al, 2006, Final Report - 2006 Minnesota Wind Integration Study Volume I, the Minnesota Public Utilities Commission, November. i A balancing area (formerly called control area) is the basic administrative unit within the power system. It can be very loosely thought of as a utility. There are about 130 balancing areas in North America ranging in size from the 476-MW Turlock Irrigation District to the 150,000 MW PJM.

27
ii There are several ways to allocate the combined ACE among the participating balancing areas but in all cases the required control actions are smaller than if the ACE signals were not combined. iii Hourly load variability shows the smallest reduction in variability (5%) when state-wide operations are compared with zonal operations because loads are highly correlated on an hourly basis. Most loads increase in the morning and decrease in the evening. State wide wind does not show that same similar pattern. iv Kelly, K., The Value of Large Regional Transmission Organizations, presentation at the IEEE 2004 Power Systems Conference and Exposition, New York, NY. October 12, 2004. Available at http://www.ieee.org/portal/cms_docs_pes/pes/subpages/meetings-folder/PSCE/2004Presentations/474/IEEE-2004-RTO-Benefits-K-Kelly-no-notes.pdfiv The quoted integration costs are actually the operating cost impacts. Some studies quantify additional wind related costs. v J. Smith, M. Milligan, E. DeMeo, B. Parsons, “Utility Wind Integration and Operating Impact State of the Art,” http://www.nrel.gov/docs/fy07osti/41329.pdf.

F1147-E(10/2008)
REPORT DOCUMENTATION PAGE Form Approved OMB No. 0704-0188
The public reporting burden for this collection of information is estimated to average 1 hour per response, including the time for reviewing instructions, searching existing data sources, gathering and maintaining the data needed, and completing and reviewing the collection of information. Send comments regarding this burden estimate or any other aspect of this collection of information, including suggestions for reducing the burden, to Department of Defense, Executive Services and Communications Directorate (0704-0188). Respondents should be aware that notwithstanding any other provision of law, no person shall be subject to any penalty for failing to comply with a collection of information if it does not display a currently valid OMB control number. PLEASE DO NOT RETURN YOUR FORM TO THE ABOVE ORGANIZATION. 1. REPORT DATE (DD-MM-YYYY)
July 2009 2. REPORT TYPE
Technical Report 3. DATES COVERED (From - To)
4. TITLE AND SUBTITLE
Impact of Electric Industry Structure on High Wind Penetration Potential
5a. CONTRACT NUMBER DE-AC36-08-GO28308
5b. GRANT NUMBER
5c. PROGRAM ELEMENT NUMBER
6. AUTHOR(S) M. Milligan, B. Kirby, R. Gramlich, and M. Goggin
5d. PROJECT NUMBER NREL/TP-550-46273
5e. TASK NUMBER WER95501
5f. WORK UNIT NUMBER
7. PERFORMING ORGANIZATION NAME(S) AND ADDRESS(ES) National Renewable Energy Laboratory 1617 Cole Blvd. Golden, CO 80401-3393
8. PERFORMING ORGANIZATION REPORT NUMBER NREL/TP-550-46273
9. SPONSORING/MONITORING AGENCY NAME(S) AND ADDRESS(ES)
10. SPONSOR/MONITOR'S ACRONYM(S) NREL
11. SPONSORING/MONITORING AGENCY REPORT NUMBER
12. DISTRIBUTION AVAILABILITY STATEMENT National Technical Information Service U.S. Department of Commerce 5285 Port Royal Road Springfield, VA 22161
13. SUPPLEMENTARY NOTES
14. ABSTRACT (Maximum 200 Words) This paper attempts to evaluate which balancing area (BA) characteristics best accommodate wind energy.
15. SUBJECT TERMS Wind; grid integration; balancing area; high penetration; systems integration; capacity credit; integration costs; wind energy value, electric system; wind power; utility.
16. SECURITY CLASSIFICATION OF: 17. LIMITATION OF ABSTRACT
UL
18. NUMBER OF PAGES
19a. NAME OF RESPONSIBLE PERSON a. REPORT
Unclassified b. ABSTRACT Unclassified
c. THIS PAGE Unclassified 19b. TELEPHONE NUMBER (Include area code)
Standard Form 298 (Rev. 8/98) Prescribed by ANSI Std. Z39.18