Embed Size (px)
Citation preview

Impact of Economic Policy Reforms, Regional and Global
Shocks on Trade and Growth in East Asia: The Case of Korea
Tran Van Hoa
Centre for Strategic Economic Studies, and Director, Vietnam and ASEAN+ Research Program
Victoria University, MC 8001, Australia Email: [email protected]
Website: www.uow.edu.au/~tvheco/tvh.htm
ABSTRACT In pursuing policies of trade liberalisation and growth promotion within the framework of regional economic integration, WTO membership and globalisation, major Asian economies had achieved economic ‘miracles’ in the past decades. Recently however, they face many challenges, economically and politically (Tran Van Hoa, 2002), compounded by a global (especially the US) economic slowdown (IMF, 2005), terrorist attacks, the SARS and avian flu outbreaks, unprecedented Indian Ocean tsunami devastation affecting millions in Asia, and other domestic or international (eg, the current China/Korea-Japan tension) uncertainty ahead. What are the development and growth prospects then for these economies or especially Korea in the medium and long term? The paper introduces the generalised gravity theory (Tran Van Hoa, 2004) to construct a simple flexible simultaneous-equation econometric model of growth and trade of Korea with its 6 major trading countries or blocs (China, Japan, ASEAN-6, the European Union, the US, and Australia). The model incorporates explicitly major temporary and persistent structural change in the form of reforms and shocks. Using latest ICSEAD, OECD and WBWT data, the paper reports efficient empirical results on trade-growth causality, trade determination and effects of policy reforms and shocks on Korea’s trade and growth with these economies over the past two decades. Based on these findings, current trade policy and economic relations developments, economic policy challenges are then targeted for discussion and resolution. Keywords: Economic Integration in Asia, Regional Free Trade Agreement, Trade and Growth Causality, Structural Change, Generalised Gravity Theory, Modelling Economic and Trade Policy. JEL: C30, F15, O11, O47

2
1 INTRODUCTION In pursuing policies of trade liberalisation and growth promotion within the framework of regional economic integration, WTO membership and globalisation, major Asian developing economies in Asia in general and Korea in particular had achieved economic ‘miracles’ in the past decades. Recently however, they face many challenges, economically and politically (Tran Van Hoa, 2000b and 2002), compounded by a global (especially the US) economic slowdown (IMF, 2005), increasing terrorist attacks, the SARS and avian flu outbreaks, the unprecedented Indian Ocean tsunami devastation affecting millions in Asia, and other domestic or international (eg, the 2005 China-Korea-Japan tension) uncertainty ahead. In response to and as a result of these internal and external shocks or structural and major policy change, what are the development and growth prospects then for these economies or especially Korea and their trade and economic relations or cooperation in the medium and long term? The paper is an empirical study on Korea’s prospects and based on (a) time-tested economic and trade-growth postulates, (b) recent advances in econometric modelling and impact analysis, and (c) improved efficient estimation and forecasting methodologies, to provide credible answers to these questions for informed academic debates and practical policy study. It has a number of features. First, it briefly surveys recent FTA developments and its current negotiations within the context of the WTO, regional economic integration (REI), closer economic relations and bilateral and plurilateral trade in the Asian region. Second, it formalises the essential of these conceptual economic-political developments and, introducing the generalised gravity theory (Tran Van Hoa, 2004), constructs a simple flexible simultaneous-equation econometric model of growth and trade of Korea and its six major trading country or blocs (China, Japan, ASEAN-6, the European Union (EU), the US, and Australia). Third, the model contains novel features in incorporating explicitly not only chief ingredients of the mercantilistic trade and modern growth theory but, significantly, also major temporary and persistent structural change as conceptualised and used in the contemporary literature on unit-root and cointegration analysis. Fourth, using latest ICSEAD, OECD and WBWT data, the paper obtains and reports efficient empirical results on trade-growth causality, trade determination and effects of structural change and shocks on these economies on Korea over the past two decades. Finally, based on these findings and current trade policy and economic relations negotiations, economic policy challenges are then targeted for discussion and for resolution development. 2 RECENT TRADE AND ECONOMIC DEVELOPMENTS IN KOREA Recent trends in Korea’s trade (as a proportion of its GDP) with its major trading partners in the world, namely, China, the ASEAN, Japan, the US, the EU and Australia, are given in Chart 1.

3
Chart 1: Korea's Trade/GDP with the World
0
5
10
15
20
25
TKRJPYTKRUSYTKREUYTKRA6YTKRCNYTKROZY
Source: Raw data from 2005 ICSEAD databases and author’s calculations We note from the data reported in Chart 1 that the trends in Korea’s trade with these 6 partners had been growing over the years, and Korea’s largest trade in 2004 is with China, followed by the US, Japan, the EU, the ASEAN and Australia in that descending order. Australia’s trade with Korea is small in value in comparison, and it seems to be rising only very slowly over the sample period 1985-2004. In terms of its volatility or dynamics, Korea’s trade with Japan and the US peaked around 1987, 1995 and 2000, and that with China scored a big and sustained surge only in around 1990. In terms of growing importance, trade of the US and Japan with Korea had been declining by more than 50% over the years and exceeded by China in 2004. While the ASEAN is ranked fourth in trading importance with Korea in this chart, its trade had been growing before the Asia crisis of 1997 and stabilised since. When we take into account this picture of Korea’s historical trade trends with its trading partners and incorporate it with recent developments in Asia, there are issues and aspects that could be considered and rigorously investigated empirically to improve informed debates on trade, economic and political relations between Korea and the rest of the world. Recent developments of new Asian regionalism (NAR) cover regional economic integration (REI) or economic integration agreements (EIA) and free trade agreements (FTAs). All have been negotiated and endorsed to promote trade and investment liberalisation, economic development and cooperation for the member countries in the region. The ASEAN+3 FTA proposal for example was discussed in the mid- and especially late-1990s by ASEAN leaders, and implemented notably through the 1998 Hanoi Plan of Action and the 2004 Vientiane Action Plan for ASEAN Vision 2020 (ASEAN, 2005). A number of factors can be attributed to its recent emergence. First, it was the result of decades of fast growth and a number of economic, financial and restructuring developments in North East Asia and in other major trading blocs in the world. Second, it was the result of developments and shifts in focus in North America and the EU in the aftermath of the damaging Asia crisis starting in Thailand in July 1997, and its subsequent contagion to a number of ‘once miracle’ economies in East and South East Asia, the former USSR, and, to a lesser extent, North and South America and the EU (Tran Van Hoa, 2000a). Third, it was the result of a benign neglect from such international organisations as the International Monetary Fund (IMF) or the economic power of North America and the EU on the plight of crisis countries in Asia, and the of lack of interest of the former in seriously helping to solve the economic, financial and social problems arising from the Asia crisis (Tran Van Hoa, 2002d). In 2001, and early in 2002, other new developments in East and South East Asia gained prominence and assisted in giving rise to a number of new Asian economic integrations or regionalisms and Asian FTAs. These developments included the quick recovery and recurring growth in Korea, the

4
emergence of China as a fast post-Asia crisis growing economy, and the continuing ‘sick’ state of the world’s second largest economy (namely Japan). The recent recovery and growth of Korea has also been put forward by some authors as a leader in the post-crisis ‘flying geese’ theory for ASEAN+3 economies (see Harvie and Lee, 2002). The NARs and FTAs including customs unions and EIAs (which are accepted exceptions, subject to strict conditions, to the WTO principle of the Most Favoured Nations under Article XXIV of GATT and Article V of GATS) are indeed numerous and proliferating at an amazing speed at the behest of government leaders especially in the Asian region. They include plurilateral and bilateral FTAs such as first ASEAN, ASEAN+3, then ASEAN+5, ASEAN+5+Taiwan, Japan+Singapore, Japan+Korea, Japan+Mexico, Korea+Mexico+Chile, Singapore+New Zealand, China+Japan+Korea, Hong Kong+New Zealand, Australia-Japan (NARA), Australia-Singapore, and last, but not the least, Vietnam+US. There was even a discussion on the setting up of a North Asian FTA in which Japan will play an important part. In mid-2003, a protocol was also being negotiated between Washington and Canberra to address key US complaints about the Australian market and to prepare for the setting up of a sweeping US-Australia FTA, as proposed by the Australian government (Hartcher, 2002), to the dismay of New Zealand which wanted, on the other hand, a trilateral US-CER (Close Economic Relations – an EIA - between Australia and New Zealand). The USAFTA was signed in January 2004. In mid-2002, there was a suggestion by New Zealand Prime Minister Helen Clark to set up Australia-New Zealand Economic Cooperation (ANZEC) to boost the low-activity 22-year old CER. An Australia-Thailand CER Agreement – the first between Thailand and a developed country – was also proposed in mid-2003 and finally signed in November 2003 (DFAT, 2004). A New Zealand and Thailand FTA was signed on 19 April 2005. Current major developments in Asia, the Subcontinent and Oceania include an ASEAN+India and Australia-China FTA feasibility study (DFAT, 2005) and Australia-Japan FTA dialogue. The EU has also been strongly advocating regional integration and liberalisation for the Pacific nations to create EU-type transnational economic partnerships (an EIA) within the Cotonou framework, to stimulate trade and create growth among them (Barker, 2002). 3 ECONOMIC POLICY REFORM, CRISES AND SHOCKS IN ASIA As mentioned earlier, the main focus and objective of the NARs and Asian FTAs (as separate from currency or customs unions and EIAs) are to promote trade and living standard either among the Asian economies themselves or with the membership of other economies outside Asia such as the US, Mexico and Chile in the Americas, and Australia and New Zealand in Oceania. Prominent among these NARs and Asian FTAs is the ASEAN+3 proposal above and, part of it, the ASEAN+1 or ASEAN+China FTA with a 1,700 million people market, a US$2 trillion GDP, and trade worth US$1.2 trillion. ASEAN+China was endorsed by the 10 leaders of ASEAN in Brunei in November 2001, and its details were worked out at a negotiating meeting in Beijing in May 2002. While the focus of the NARs and FTAs is important and the objective is plausible in an economic-theoretic sense, there have been numerous recent developments in the region that could have impeded or sometimes even enhanced the attainment of this objective. These developments include (a) national and international resistance to reform to maintain the status quo, (b) unexpected shocks and crises, and major structural change and ‘good-in-a-market-economy-sense’ policy reform. The first category encompasses for example the Seattle and Singapore issues, globalisation and agricultural subsidies by the US, the EU, and Japan in the current WTO debates. The second category covers the stock market crash of 1987, the Tiananmen Square uprising in 1989, the Gulf War in 1991, the Asia economic and financial crisis of 1997, the SARS and avian flu of 2004, the devastating tsunami shock of 26 December 2004 in the Indian Ocean, and, from the other spectrum of change, Korea’s major SOE reform of the early 1980s and its pro-FDI reform in the early 1990s.

5
It should be noted that while the terms shocks, crises, and structural change used above are generic, the content in each case may have completely different characteristics and implications. For example, shocks usually refer to a sudden event that can have damaging effects, and structural change or policy reform are often used to indicate a sudden major change in government management or governance that has been gradually developed or constructed to generate beneficial outcomes. In addition, as is well known in the current literature on unit roots and cointegration studies, shocks and structural change or policy reform can again have short term impact or they can have a lingering, non-decaying, volatile and permanent consequences (Perron, 1989 and 1997, and Tran Van Hoa 2004). Shocks and structural change may also have selectively national, regional and global implications or contagion. The Black Friday stock market crash of October 1987 for example was considered significant chiefly only for developed countries that have a well-developed financial system and linkage, but it may be regarded as a minor event by the LDCs in which a strong financial system is yet to be developed and operated. The Tiananmen Square incident in 1989 may be considered a watershed point in China’s reform processes, but it is only of minimal consequences to other economies in the Asian region and beyond. On the other hand, due to its status as an LDC but with a large population and economy, China’s WTO membership has been regarded as having a global effect especially on the countries having trade with China or having trade with the markets China is likely to have a competitive edge in trade with. One of the countries in this latter category is India. Above, we stipulated that shocks, crises, structural change and policy reform can have significant impact on trade, development, growth (and even welfare and poverty reduction) for a country, a region or globally. This impact may outweigh or boost the gain from liberalised trade and investment and improved cooperation and economic relations as expected from the NARs and FTAs for the member countries. Unfortunately, existing methodologies or approaches that have been used almost routinely in this kind of study are either unable or inappropriate to accommodate this kind of impact in a realistic or historical data-consistent sense. Among these methodologies are the applied or computable general equilibrium (CGE) and its variations (eg, GTAP), the standard gravity theory (GT) (see Frankel and Romer, 1999), and the panel regression (see Dollar and Kraay, 2004). These methods are however severely restricted either by scope and coverage, temporal historical features, and a lack of circular causality. For example, the CGE deals only with trade in goods and is structurally heavily calibrated and essentially static (unable to accommodate crises) modelling [see Productivity Commission Report (2003) for other issues]; the GT deals chiefly with cross-section data and is also unable to accommodate crises or other recent shocks or economic developments in Asia (and other regions); and the PR excludes completely interdependence or circular causality between trade and growth (Tran Van Hoa, 2004). In the study below, a more appropriate modelling approach is adopted to deal more flexibly with the time-tested concept of trade-growth causality and to accommodate more realistically and more efficiently or accurately the impact of shocks, structural change and policy reform on trade, development, growth, and economic relations for the countries in the NARs and FTAs in the Asian region. This approach is, in addition, supported by new and improved econometric or statistical estimation and impact study methodologies that have superior forecasting properties in terms of the average forecasting mean-squared-errors (MSE) criterion or average Wald risks (Anderson, 1984). 4 FTAS, ASEAN+3, TRADE-GROWTH NEXUS AND GRAVITY THEORY Since the primary objectives of FTAs are trade liberalisation and welfare improvement as well as economic partnerships generally for member countries, the FTA premises that, directly, trade (international and domestic) and, indirectly, other determinants of trade significantly and causally affect: (a) economic welfare (see Raimondos-Moller and

6
Woodland, 2002); real wages (see Ruffin and Jones, 2003); (b) growth (for developed countries see Frankel and Rose, 1998, Frankel and Romer, 1999); and (c) development (for developing countries, see Harrison (for all countries), 1996, Frankel et. al., (for 10 East and South East Asian countries), 1996, and Tran Van Hoa (for ASEAN, China, Korea and Japan, 2002a). The outcomes also are mutually beneficial in many other non-economic aspects (e.g. closer regional and international cooperation and collaboration, social harmony, political stability and prosperity), and, in the context of globalisation and enhancing international competitiveness, conducive to regional or international economic integration (ASEAN, 1999). In view of the expectation that FTAs will enhance trade and produce final outcomes of higher growth and higher real wages or better economic development improvement for trading partners or FTA member countries, a useful causality concept in the form of a GT using geographical, demographic and other common or concurrent attributes (see for example Linneman, 1966, and the specification in Table 3 in Frankel et. al., 1996) to explain trade flows (liberalisation) between countries may be appropriate in empirical studies of this trade-growth nexus (for another more restrictive justification, see Rose, 2000). Some extensions to this theory’s determinants using OECD country data have also been attempted to deal with trade correlations and output fluctuations (see for example, Otto et. al., 2002). The data used in these important studies of the GT have been singularly cross-sectional and therefore unable to deal with recent temporal developments in the Asian or other non-Asian regions. In the case of Korea vis-à-vis Asian economies and its other major trading countries or blocs in our focus (that is, China, Japan, ASEAN, the US, the EU, and Australia), the trade-growth impact in a bilateral (China-Japan, China-US, China-Australia) and plurilateral (China-ASEAN and China-EU) context, both of a qualitative or quantitative kind, has not been carried out or reported. This lack of evidence on the validity of the required premises underlying the foundation of NARs or FTAs leaves much to be desired. In addition, the role played by sudden shocks, gradual structural change and policy reform on this trade-growth causality for these countries has not been addressed or adequately dealt with in an empirical historical data-consistency context in the current literature. 5 A MODEL TO STUDY THE IMPACT OF POLICY REFORM AND SHOCKS ON KOREA’S TRADE AND GROWTH The development of the model and its main features can be briefly described as follows. Based on our previous modelling and impact studies (eg, see Tran Van Hoa, 2002a, 2002b, 2002c, 2003, 2004, 2005), we consider, for convenience and without loss of generality, a simple model of two simultaneous implicit or arbitrary functions (extension to more functions is straightforward when more variables are considered and endogenised) comprising and extending the basics of the standard cross-section-data GT linking trade and growth between two trading countries or blocs. This so-called generalised gravity theory (GGT) comprises not only the GT’s geographic or demographic attributes (for the country in focus, Korea) but also, significantly, economic factors, and the requirements or protocol conditions of a regional FTA or EIA. Since the geographical attributes (such as distance and area) in the cases of Korea-ASEAN or Korea-Japan are a priori assumed to be a rationale for setting up ASEAN+Korea or ASEAN+3 (or even ASEAN itself), we can then focus on other relevant demographic (e.g, population as a proxy for size – see Frankel and Romer, 1999), economic and non-economic determinants of trade and growth in our model. In this model, trade (named T) may be defined as exports or imports or openness [exports plus imports) or broader coverage and scope (including services, investment, and ODA)], and growth (Y) may be defined as GNP or, by more popular convention, GDP. The two countries, within the interest of our present study, are as pair-wise (bilateral) combinations of Korea-Japan, Korea-ASEAN, Korea-Australia, Korea-US and Korea-EU. Thus

7
F1 (α,Y,T) = 0 (1) F2 (β,T,Y,X,W) = 0 (2) where F1 and F2 are two arbitrary functionals linking trade and growth and their theoretically plausible determinants, α and β are parameter vectors, X and W denote, respectively, other economic (fiscal, monetary, trade and industry policy – see Sala-i-Martin, 1991) and non-economic (e.g, distance, area, size, policy reform and domestic and external shocks – see Johansen, 1982) variables, relevant to a country or a group of countries’ growth or development. Importantly for our study, in addition to T and Y, data for X and W must be available and consistent with published time-series data in a standard Kuznets-type accounting framework (e.g, SNA93), or the accounting system of Stone (1988), or the recent World Bank World Tables. Taking the total differentials of (1) and (2), and neglecting the second and higher–order terms in a Taylor’s series expansion (see for example Allen, 1960, and Tran Van Hoa, 1992a), the 2-simultaneous equation model (1)-(2) can be written in stochastic form and in terms of the rates of change (eg, Y%, T%, X%, W%) of all the included econometrically exogenous and endogenous variables (Y, T, X and W) as: Y% = α1 + α2T% + u1 (3) T% = β1 + β2Y% + β3X% + β4W% + u2 (4) In (3)-(4), the equations are linear and interdependent in the sense of Marshall or Haavelmo, α’s and β’s are the elasticities, and u’s other unknown factors outside the model (see Anderson, 1979, Frankel and Romer, 1999) or, as usual, the disturbances with standard statistical properties. In (3)-(4), circular and instantaneous causality in the sense of Granger (1969) or Engle-Granger (1987) exists or is regarded as a testable hypothesis. In their non-stochastic forms (in which all disturbances are idealistically zero), these equations form the basic structure of the CGE/GTAP models of the Johansen class, in which all elasticities are usually assumed to be given or known a priori and the impact of endogenous or endogenised variables (say T) on Y is dependent on the exogenous variables and calculated system-wise using such iterative procedures as the Gauss-Euler algorithm with a known sparse matrix of elasticities. It can be verified that our so-called flexible (or function-free) trade-growth equation (3) in the model above is econometrically identified in the sense of mathematical consistency. An impact study of endogenous trade (or exogenous X and W) on growth can be analysed directly via its 2SLS (or reduced-form adjusted) form structurally given in (5) below or indirectly via its reduced form given in (6) in terms of all the exogenous economic and non-economic variables in the model. In (6), T is approximated by X and W, and the success of this proxy plays a central role in credible analysis of trade-to-growth nexus and impact study. It is well-known in the theory of econometrics that the use of OLS to estimate Equation (3) for example will, in this case, produce biased parameter estimates. The structural and reduced-form equations for Y can be written more explicitly as Y% = a1 + a2 T% + v1 (5) Y% = p1 + p2 X% + p3 W% + v2 (6) where v’s are the new disturbances with standard statistical properties. An important feature of our modelling approach is that, contrary to the CGE/GTAP restrictive (goods only) and a priori (i.e., the values for elasticities are assumed or subjectively or dogmatically given) approach, our impact study is historical-data-consistent as all required elasticities are estimated from the model and from available data, and have asymptotically

8
and statistically desirable and consistent properties (an important issue in the GT’s empirical applications – see Frankel and Romer, 1999) when suitable estimation and forecasting methods (eg, 2SLS or other instrumental variables (IV) methods) are employed. Another important dominant feature is that, contrary to other SNA93-based or Keynesian system-wide approaches, our impact study has the general flexibility in modelling specification rationale and empirical implementation in assuming explicitly no a priori functional forms (eg, linear, log, log-linear, or translog) for the equations in the model, and it can handle data on trade or budget deficits (having therefore negative values) and real rates of interest when inflation exceeds the nominal interest rate. The usual method of routine log transformations for all variables in a single or multi-equation econometric model cannot do this. From our model’s construct, the impact may be regarded as long run in the context of Engel-Granger cointegration or long run causality if all variables in (5)-(6) are integrated of degree one. 6 EMPIRICAL IMPLEMENTATION OF THE MODEL INCORPORATING SERVICES, FDI, POLICY REFORMS AND SHOCKS To implement the model [Equations (3)-(4)] above with available data to empirically investigate the causal relationship between, for example, comprehensive trade (that is, goods, services and investment) and growth for Korea-ASEAN, we can use, given fixed geographical components (distance and area) as discussed, and, for time-series data, population (a proxy for size), conventional economic determinants of trade (eg, see Frankel and Rose, 1998, Frankel and Romer, 1999, and Rose, 2000, and Otto et. al., 2002) and/or other relevant factors (eg, external or internal shocks or policy reform – Johansen, 1982) when such data are available. One such extended model relevant to our focus of study on the possible causality (impact) between say Korea-ASEAN trade and Korea’s growth may be written in either the structural equation (7), and supplemented by the full reduced-form equation for T (8) (and similarly for growth Y) as Y% = a1 + a2 T% + a3ST + a4SV% + a5FDI% + v1 (7) T% = p1 + p2 YT% + p3 FT% + p4 MT% + p5 PT% + p6ERT% + p7IT% + p8POT %+ p9ST + v2 (8) In Equations (7)-(8), Korea’s trade (T%) with its ASEAN trading partner for example is assumed to cause, together with crises or shocks or policy reform (ST) and services (SV) and foreign direct investment (FDI), Korea’s growth (Y%), but this trade T (and endogenous SV and FDI) is also affected by economic activities, trade-related policies and external or internal shocks in Korea and its trading partner, ASEAN. Assuming for convenience that Korea’s trade (traditionally defined as its exports (or imports, see Barro and Helpman, 1991) with its trading partner is affected by this partner’s GDP (supply) and other major economic activities, trade-related policies (see Coe and Helpman, 1993 for this approach) or external or internal shocks or policy reform in Korea (and in its trading partner), then Equation (8) in its reduced form simply assumes that Korea’s partner trade is simply affected by the exogenous factors such as GDP (named YT), inflation (PT) – see Romer (1993), fiscal policy (FT), monetary policy (MT), trade policy and exchange rates (ERT) – see Rose (2000), industry structure (IT) – see Otto et. al. (2002), population (POT) – see Frankel and Romer (1999), and internal or external shocks or policy reform (ST) – see Johansen (1982) - of Korea and its trading partner. Equation (8) is in fact a derived demand equation for tradable goods (or even transacted services and investment) reflecting essentially its supply (its trading partner) and demand components (Korea) postulated in standard microeconomic and trade theory. In deriving Equations (7) and (8) for 2 trading countries or blocs above, we assume that Country 1’s trade affecting its growth is a testable hypothesis and this trade itself is essentially a demand equation for either imports (from Country 2) and exports (to Country 2) or vice versa or both. For the economies of the ASEAN and Korea, geographic attributes (that is, being in the neighbouring region) are assumed to be the prime facie reason for setting up

9
the ASEAN+3 or ASEAN+Korea, and the distance and area characteristics are omitted and proxied by population size as all of our variables are expressed in terms of time-series (distance and area may also not be appropriate even for cross-section studies with high-trade and small countries like Singapore and Brunei in ASEAN+3). All variables in the model, that is, Y, T, SY, FDI, YT, FT, MT, PT, ERT, IT and POT are expressed as their rates of change so the units of measurement (i.e., $billion or $million, ratios or index numbers) for the trading countries’ variables are irrelevant. ST is a qualitative time-series variable representing internal or external shocks and policy reform having either one-off effects or temporally permanent effects (autoregressive and non-stationary) on trade and growth with discrete values. The implications of our model above are important for studying the transmission mechanism or relationship between Korea’s growth and trade with its major trading partners and their linkages. This relationship, if empirically substantiated, can provide powerful evidence on the trade, services, investment and welfare enhancement relationship premises of these countries as trading partners, and, as a result, it would lend crucial support to the viability, sustainability and promising prospects of the new Asian regionalism, namely, ASEAN+China, ASEAN+3, or other bilateral and plurilateral FTAs, as well as to providing empirical evidence for quantifying the comprehensive trade-to-growth impact and suggesting robust and credible trade policy. 7 NEW ADVANCES IN ESTIMATION, FORECASTING AND IMPACT STUDY METHODOLOGIES The importance of using a suitable estimation method for our model (or similar models) to get more accurate or unbiased results has been emphasised in previous trade-growth studies using standard gravity theory (see for example Frankel and Romer, 1999). These studies deal mainly with the OLS and 2SLS or IV (instrumental-variables) estimation methods. In this section, we briefly survey the various new and improved estimation and forecasting methods that are available, and suggest that their appropriate use can produce more accurate econometric outcomes on the trade-growth causal relationship and subsequently on economic and trade policies and regional integration. More specifically, in our model, the equations in differential and reduced form as given in equation (8) for the endogenous Y% [or, similarly, for other endogenous T%, SV% and FDI%] can be written more generally with a sampling size T and k independent variables (possible causal components) in matrix notation as: y = Z ß + u (9) (Tx1) (Txk) (kx1) (Tx1) where y = Y%, Z = the rate of changes of the exogenous and predetermined variables (both static and dynamic), ß = the parameters, and u the disturbance satisfying all standard statistical assumptions. We now define our evaluation criterion (in terms of average MSE or Wald risks) for an arbitrary estimator β̂ a for β in equation (9) as Wald risk ≡ MSE( β̂ a) = ( β̂ a-β)’W( β̂ a-β) where W is a positive definite. Under Wald risks, we can estimate equation (9), which is essentially a general linear model for structural or behavioural analysis or for direct forecasting and policy studies (see Pindyck and Rubinfeld, 1998), by using the OLS or, at a more statistically efficient level, any of the explicit (Baranchik, 1973) Stein or Stein-rule methods as described below.

10
More specifically, using equation (9), the basic and most well-known and used method to produce estimates and forecasts of y (or Y%) is the OLS estimator of ß (denoted by β̂ ) and written as β̂ = (Z'Z)-1Z'y (10) A more efficient method is the explicit Stein estimator of ß (Baranchik, 1973) and given by β̂ s = [1 - c(y-Zb)'(y-Zb)/b'Z'Zb] β̂ = [1 - c(1-R²)/R²] β̂ (11) where c is a characterising scalar and defined in the range 0 < c < 2(k-2)/(T-k+2), and R² is the square of the sample multiple correlation coefficient. A still more efficient method (to avoid, in one respect, implausible results derived from plausible OLS parameter estimates) is the explicit positive-part Stein estimator of ß (Anderson, 1984). This estimator is defined as β̂ +s = [1 - min{1 , c(y-Z β̂ )'(y-Z β̂ )/ β̂ 'Z'Z β̂ }] β̂ = [1 - min{1 , c(1-R²)/R²}] β̂ (12) A new method to obtain estimates and forecasts of ß in equation (9) with better properties in Wald risks has been proposed (see Tran Van Hoa, 1985, Tran Van Hoa and Chaturvedi, 1988, 1990, 1997). It is in a class of explicit improved Stein-rule or empirical Bayes (also known as the two-stage hierarchical information or 2SHI estimators for linear regression models). This estimator includes the explicit Stein and the double k-class (Ullah and Ullah, 1978) estimators as subsets (Tran Van Hoa, 1993a). Other applications of the Stein, Stein-rule, and 2SHI estimators to linear regression models with non-spherical disturbances and to Zellner’s seemingly unrelated regression model have also been made (see Tran Van Hoa et al, 1993, in the case of regressions with non-spherical disturbances, and Tran Van Hoa, 1992b, 1992c, and 1992d, in the case of seemingly unrelated regressions). The explicit 2SHI estimator is a bona fide or fully operational (in statistical theory terminology) estimator and defined as β̂ h = [1 - c(1-R²)/R²} - c(1-R²)/{R²(1+c(1-R²)/R²)}] β̂ (13) and its positive-part counterpart (Tran Van Hoa, 1986a) is given by β̂ +h = [1 - min{1 , c(1-R²)/R²} - {1/((R²/c(1-R²)) + 1)}] β̂ (14) While all the estimators given above can be applied to the general linear model equation (9) for structural and forecasting analysis, their relative performance in terms of historical, ex post or ex ante (Pindyck and Rubinfeld, 1998), forecasting MSE can differ. Thus, it is well-known that, in MSE and for k ≥ 3 and T ≥ k + 2, β̂ s dominates (that is, it performs better in
forecasting MSE) β̂ , and β̂ s is dominated by β̂ +s (Baranchik, 1973, Anderson, 1984). However, it has also been demonstrated (Tran Van Hoa, 1985, Tran Van Hoa and Chaturvedi, 1988) that, in MSE, β̂ h dominates both β̂ and β̂ s, and more importantly, β̂ +h dominates

11
β̂ +s (Tran Van Hoa, 1986a). Substantial informational gain has also been demonstrated in applied studies (see eg, Tran Van Hoa, 1992a). A further important result of the 2SHI theory has recently been proved (see Tran Van Hoa and Chaturvedi, 1997): the dominance of the 2SHI over the OLS and Stein exists anywhere in the range 0 < c < 2(k-1)/(T-k). This indicates that the 2SHI produces better (in terms of smaller Walk risk or generalized Pitman nearness) estimates and forecasts even if the estimating and forecasting equation has only one independent variable in it. The condition for the optimal Stein dominance in the linear equation up to now requires that 0 < c < 2(k-2)/(T-k+2) (see Anderson, 1984). Further MSE-dominance properties of the 2SHI estimators and their extensions over the positive-part Stein estimator in regression equations have been given by Namba (2000, 2001). One aspect on the data quality used in our study should be noted. It has been demonstrated that the 2SHI dominates other conventional (OLS or 2SLS) estimators when measurement errors exist (Tran Van Hoa, 1986b). Since the poor quality of economic data from the Asian countries and other LDCs is well known, one by-product of our study is that the findings are also optimal in errors-in-variables (EV) cases. Previous applications of the 2SHI to major developing countries in Asia are given in Tran Van Hoa (1993b and 1993c).
8 ECONOMETRIC EVIDENCE ON KOREA’S GROWTH-TRADE WITH ITS MAJOR TRADING PARTNERS
This section reports substantive results for the six trade-growth simultaneous-equation models that are based on several plausible extensions to the standard GT: such as (a) Taylor’s series planar approximation to any arbitrary functional (see below), (b) the use of time-series data, (c) incorporating micro/macroeconomic factors (including significantly services and FDI) and (d) external and internal shocks. These are captured in equations (7) and (8) above. For comparison with the findings of previous studies in standard GT applications, these results are obtained by the OLS, 2SLS and 2SHI for the structural equation of growth, Equation (7). Data – Due to the limitation of the required data in our studies, especially dealing with developing economies (see also Austrade, 2003), all original data are obtained as annual and then transformed to their ratios (when appropriate). The ratio variables include trade (exports and imports), services, FDI, government budget, and money supply (M2), all divided by GDP, and unemployment rates (open unemployment/labour force). Other non-ratio variables include won/US exchange rates, population and binary variables representing the occurrence of the economic, financial and other major crises or policy shift or reform over the period 1981 to 2002. All non-binary variables are then converted to their percentage rate of changes. The use of this percentage measurement is a main feature of our modelling and impact approach and avoids the problem of a priori known functional forms (see above) and also of logarithmic transformations for negative data [such as budget (fiscal) or current account deficits]. As the average micro/macroeconomic data for the countries in the ASEAN (and the EU) are difficult (if not impossible) to measure and our sampling size is limited, we have focused on a unidirectional direction of trade below in a ‘dual’ context: Korea’s trade with China, Japan, ASEAN, the US, the EU and Australia, and the impact of this trade on Korea’s growth. The data for regional (eg, ASEAN and the EU) and national (e.g, China, Korea, Australia and the US) trade [exports (X) to and imports (IM) from, respectively], services (SV), foreign direct investment (FDI), GDP and estimated mean population (named POP) are retrieved from ICSEAD’s 2005 regional trade databases. Openness between 2 trading countries is defined as T=X+IM although the separate effects of either X or IM can be experimented with. All trade and economic data are at current prices in US dollars. Fiscal, monetary, trade and

12
industry policy data for the country of focus, Korea, were also obtained from the 2005 ICSEAD databases and approximated, respectively, by government budget/GDP (BY), M2/GDP (M2Y), interest rates (R), exchange rates per US dollars (XR), and unemployment rate (UR). In addition to the usual demographic and economic components in our model, we also identified (due to ICSEAD data unavailability before 1980) 5 major reforms or crises that had affected Korea, China, the ASEAN, the US, the EU, and Australia (and other economies) during our sampling period, and included them as 5 dummy variables with persistent effects after their occurrence (one-off effects were postulated but empirically discarded as implausible in the study). These are the stock market crash of 1987 (C88) which was also coinciding with Korea’s export-led large-scale conglomerate industrialisation and emerging democracy period 1970-88, the Gulf War of 1991 (C91), Korea’s SME rebalance and banking privatisation period 1995 (C95), the Asia crisis of 1997 (C97), and post-1997 crisis reform and recovery period (C02). The outbreaks of SARS in 2003, avian or bird flu early in 2004, and the December 2004 tsunami devastation have been omitted due to a lack of sufficient data. Various modelling experiments in our study also show that these crises all have an econometrically permanent or non-decayed effect (reflecting autoregressiveness or non-stationarity) on growth in China. The Estimated Models - The various bilateral and plurilateral trade-growth models for Korea and its 6 trading partners are based on the availability of these data. The 2-simultaneous equation trade-growth model for Korea and China in our studies, for example, that is based on Equations (7)-(8), can be written fully using mnemonic notation for estimation and impact analysis as: YKR% = α1 + α2TCNY% + α3SY% + α4FDIY% + α5C88 + α6C91 + α7C95 + α8C97 + α9C02 + v1 (15) TCNY% = β1+ β12YCN% +β3BY% +β4M2Y% +β5R% +β6CPI% +β7XR% +β8UR% + β9POP% + β10C88 + β11C91 + β12C95 + β13C97 + β14C02+ v2 (16) where, in percentage change, YKR = Korea’s GDP, TCNY = Korea’s total trade (exports + imports or openness) to China divided by Korea’s GDP, SY = total services/GDP, FDIY = total direct investment/GDP, and YCN = China’s GDP. The variables BY, M2Y, R, CPI, XR, UR and POP denote, respectively, fiscal, monetary, interest rates, inflation, exchange rate, industry policy and population in Korea. The v’s are the disturbances representing other unknown factors but with effects on YKR and TCNY (and SY and FDIY) respectively (see Frankel and Romer, 1999 for this rationale). The trade-growth models for Korea-ASEAN, Korea -US, Korea-EU, Korea-Australia and Korea-Japan can be similarly constructed. Substantive Findings – Six sets of empirical findings for 6 trade-growth models and based on Equations (15)-(16) above for Korea and its 6 trading countries/blocs are given in Table 1. These models provide information on the causality direction of trade (goods/services/FDI)-growth activities. Due to the importance of the estimation methods used that can provide greatly different results/conclusions even for the same model and data (see further detail in Frankel and Romer, 1999) and also for the purpose of statistical efficiency comparison, three types of estimated structural parameters have been calculated for each model. These are the OLS, the 2SLS (an IV) and the 2SHI (applied to the 2SLS). The dominance of the 2SHI over the 2SLS has also been demonstrated (Tran Van Hoa, 1986c, 1992a). For hypothesis testing, the 2SHI has approximately the same asymptotic properties as OLS and 2SLS.

13
Table 1 Impact of Trade, Services and FDI with Major Trading Blocs on Korea’s Growth
Generalised Gravity Theory in Flexible Structural Form 1986 to 2003
__________________________________________________________________________________________ Korea -ASEAN Korea -Japan Korea -US Variables OLS 2SLS 2SHI OLS 2SLS 2SHI OLS 2SLS 2SHI __________________________________________________________________________________________ Constant 10.95** 11.68** 7.54** 7.51** 5.87** 5.05** 10.53** 10.84** 7.59** Openness/GDP 0.01 0.06 0.04 0.20** 0.27** 0.23** 0.11 0.09 0.06 Services/GDP -0.26** -0.31** -0.20** -0.25** -0.24** -0.21** -0.31** -0.34** -0.24** FDI/GDP -0.02 -0.02 0.01 -0.04** -0.05** -0.04** -0.03 -0.02 -0.02 Stock Crash 87-88 -2.18 -3.30 -2.13 3.52 6.15* 5.29* -0.61 -1.13 -0.86 Gulf War 91 0.23 0.35 0.23 -0.31 -0.45 -0.39 0.19 0.39 0.28 SME-Banks 95 1.59 1.56 1.01 1.17 0.99 0.85 1.01 1.27 0.89 Asia Crisis 97 -5.62* -5.11* -3.30* -7.52** -8.55** -7.35** -6.49** -6.15** -4.31** Reform 2000s 1,10 0.88 0.57** 1.89 2.45@ 2.10@ 2.02 1.14 1.00 R2 0.78 0.77 0.88# 0.91 0.90 0.95# 0.80 0.80 0.89# F 4.08** 4.08** 4.80** 12.03** 11.96** 11.96** 4.60** 4.68** 4.61** DW 2.79 1.14 1.32& 2.89 2.54 1.68& 2.96 2.88 1.31& __________________________________________________________________________________________
Table 1 (continued)
__________________________________________________________________________________________ Korea -EU Korea –Australia Korea-China Variables OLS 2SLS 2SHI OLS 2SLS 2SHI OLS 2SLS 2SHI __________________________________________________________________________________________ Constant 10.91** 11.24** 7.74** 9.73** 10.98** 7.54** 9.53** 9.72** 6.23** Openness/GDP -0.02 -0.05 -0.03 -0.13 -0.02 -0.02 0.06 0.10 0.06 Services/GDP -.24** -0.27** -0.18** -.14 -0.28 -0.19 -0.28** -0.31** -0.20** FDI/GDP -.02 -0.02 -0.02 -0.02 -0.02 -0.01 -0.03 -0.03 -0.02 Stock Crash 87 -88 -2.18 -2.75 -1.83 -0.77 -2.29 -1.57 Guld War 91 0.19 0.35 0.24 -0.85 0.21 0.14 -1.98 -2.83 -1.81 SME-Banks 95 1.78 2.11 1.41 2.98 2.02 1.39 2.55 3.08 1.97 Asia Crisis 97 5.72** -5.54** -3.68** -6.51** -5.58** -3.84** -5.77* -5.76** -3.70** Reform 2000s 1.04 0.55 ** 0.37** 1.21 0.63 0.43 0.68 0.35 0.03 R2 0.79 0.78 0.88# 0.82 0.79 0.89# 0.80 0.79 0.89# F 4.12** 4.21** 4.11** 5.14** 4.46** 5.13** 3.36* 3.44* 3.37* DW 2.82 2.84 1.15& 2.87 2.80 1.23& 2.21 1.99 1.05& ________________________________________________________________________________________ Sources of data: OECD and World Bank data as compiled by Australia’s 2005 DX database. ICSEAD Trade Data (2005). Notes: ** significant at the 5% level, * significant at the 10% level @ significant at the 15% level. # correlation coefficient between actual Korea growth and its 2SHI estimate. & DW calculated using the formula DW=2(1-ρ). Tests on 2SHI estimates are based on their asymptotic properties as T -> ∞.
From the results given in Table 1, we note 5 important findings. First, while having high success in modelling output growth (change in GDP) has been internationally accepted as difficult, all 6 estimated models of growth vis-à-vis trade in goods, services, and investment between Korea and its 6 trading partners have statistically significant (using the F-test) and much higher modelling performance (that is, R2 reaching up to 95 per cent) relative to other trade-growth causality models as reported in previous international studies. As R2 is an average number for the whole sample size used in estimation, it may not be able to give a detailed period-by-period success of the estimated models. It is important to note that a graph of Korea’s observed and predicted growth fluctuations based on the 6 estimated models for the period under study would give a better measurement of modelling success. The graphs for these growth data and their forecasts have also been plotted (not reported here) and the results indicate that the peaks, troughs and turning points of the growth data are accurately predicted for almost all of the 20-year period under study. Second, when we look at the dynamic

14
features of the estimated models using either plots or standard diagnostic tests, all estimated models also appear free from serious first or higher order autocorrelation-induced or simple Markov scheme inefficiency problems. Third, trade, as defined by total trade/GDP between Korea and its 6 trading partners, has positive impact on Korea’s growth vis-a-vis China, the ASEAN, Japan, the US, and negative vis-a-vis the EU and Australia. Significance is obtained only however for Korea-China trade. Fourth, the introduction of financial services and investment into the models (which the CGE, GT and PR are unable to do) shows a stark contrast between the impact of trade, services and investment. More specifically, while Korea’s services inflows and outflows have a significant (except with Australia) dampening effect on its growth, FDI is found on the contrary (and more consistently with the perceived minor role of pre-crisis FDI in the Korean economy – see for example Harvie, 2004) to have a negligible (except with Japan) impact on this growth. Finally, the introduction of crises, shocks or major policy reforms into the models (which is natural for this kind of impact study but which the CGE, the GT and the PR are also unable to accommodate) provides very informative evidence on the characteristics of these crises, shocks, policy reforms, and the role they have played in or contributed to the economic performance of Korea in recent years. 9 IMPLICATIONS FOR KOREA’S TRADE POLICY AND ECONOMIC
RELATIONS While the GGT models we used for study above may be simple and illustrative in their structure, they contain the main and conventional ingredients of and analysis on trade, growth, their major determinants, and their relationships for the 7 trading countries or blocs under study. They are also fairly consistent, for comparative purpose, with similar previous studies of a different kind (eg, the CGE, GT, PR or other quantitative trade-growth analysis). The empirical findings reported in the preceding section also provide a number of new and interesting results on trade-growth causation where trade has been notably expanded to include services and investment, and on the effect of sudden shocks and gradual policy reforms for which very limited research has been carried out and reported. Finally, the findings are seen as providing empirical support (or rejection) of recent (or similar) FTA initiatives at the highest political level in Asia. This claim is credible in the sense that the findings provide important data-based inputs and implications with historical support for international trade negotiations or dialogues and for formulating co-operation policy for Korea and its major trading economies either in Asia or other regions.
Some of these new trade and economic relation FTA initiatives include, as we mentioned earlier, the ASEAN-Korea, ASEAN-China, Korea-Chile, Korea-Japan, Korea-Singapore, and Australia-China FTAs. The methodology proposed and used in this study can also be adopted for analysis of other FTAs in the Asian and other regions. These include for example the Australia-Korea FTA, the currently ministerially mooted Australia-Mexico (for South America), the Australia-Emirates and Australia Kuwait (for the Middle East or West Asia) FTAs (ABC, 2004), and the Australia-Japan or Australia-India FTA proposal.
Does Korea’s Trade with its Major Trading Partners Cause Korea’s Growth?
Trade-to-growth is an important causality topic in economics that has attracted some of the best minds in the field over the last 15 years or so (see eg Frankel and Romer, 1999, for a survey), and the conclusions have not been finalised or robust for all cases, especially in the short run for even comparative static strictly calibrated neo-classical models (see eg Rees and Tyers, 2004). Our empirical results above show that, in the specific case of Korea vis-a-vis its major global trading partners, its trade (when defined as the relative size of openness to its GDP) with the ASEAN, Japan, the US and China, has only a weak empirical support as a beneficial determinant (except Japan) of Korea’s growth. The impact of Korea’s trade with the EU and Australia on Korea’s growth is negative but this impact is statistically

15
insignificant. A partial explanation for this negative evidence could be in the relative small volume of Korea’s trade with Australia or the stable movement of the EU’s trade (see Chart 1) with Korea during the period under study (see Guttmann and Richards, 2004, for similar evidence on the significance of Australia’s trade on its GDP).
Does Korea’s Trade with its Major Trading Partners Impact Korea’s Growth Differently and Where the Most Gains Come from?
It should be noted that, based on the findings given in Table 1 above, Korea appears to have gained most from its trade with Japan, China, the US, and the ASEAN in that descending order. This is despite that fact that Korea’s trade with the US and Japan had been leading the trend for the sample period until 2004 when Korea-China’s trade became the largest of Korea’s 6 trading partners. This finding would have important implications in trade and economic relation priority setting for government and corporate trade policy makers in China, the US, Japan, and the ASEAN. The evidence also appears not to support empirically the current proposal by the Australian government to develop further the country’s trade and economic cooperation with Korea via a formal FTA framework and explains perhaps the hesitation by Korea (or Korean economists) to explore an FTA with Australia. We can infer that the motives for the Australia proposal may have been more on the recent growth of Korea-Australia trade, long term expectations or based on other non-economic aspects.
Impact of Financial Services and Investment on Korea’s Growth and Trade Policy
As mentioned earlier, one of the innovative and novel features of our paper is the introduction of comprehensive trade in goods, services and investment into the GGT models. At this stage, the measurement of services and investment follows the concept of openness in trade in goods in which both inflows and outflows have unweighted impact. Given this definition, the results reported in Table 1 show that the effects of services from and to Korea’s 6 major trading partners are uniformly negative, statistically significant (except with Australia) and large (with an elasticity of slightly over 20%). In contrast, the role of FDI on Korea’s growth until the 2000s when policy reform was introduced to attract FDI after the devastation of the 1997 Asia crisis, is seen, as expected (see above), to be minimal with a small elasticity and statistical insignificance.
Do Crises and Economic Policy Reform Affect Korea’s Growth? The specification of shocks, crises and policy reform, either of the sudden or gradual kind and with temporary or long-lasting effects, in our GGT models is one of their significant modelling features. This feature has not been captured adequately or at all by well-known existing methodologies such as the CGE/GTAP, the GT and the PR. The types of shocks and policy reform we introduced into our models, as discussed earlier, include major recent developments in the Asian region and elsewhere. These cover Korea’s export-led large-scale conglomerate industrialisation and emerging democracy period 1970-88 (C88), the Gulf War of 1991 (C91), Korea’s SME rebalance and banking privatisation period 1995 (C95), the Asia crisis of 1997 (C97), and post-1997 crisis reform and recovery period (C02). In the terminology of Box-Jenkins time-series analysis or the literature on unit roots and cointegration (see for example Perron, 1989, 1997), the shocks (ie, C91 and C97) may have the characteristics of a sudden change, and Korea’s economic policy reforms (C88, C95 and C02) are assumed to have the feature of a gradual reform. From our modelling experiments, all shocks and policy reforms have been found to have a non-decaying permanent effects of the non-stationary kind on Korea’s trade and growth for the sampling period under study. From Table 1, it appears that C88, which was regarded as crucial, significant and damaging event for developed countries’ financial markets and economic performance resulting from the stock market crash of 1987, is found to have a damaging but statistically weak effect (except with Japan) on Korea’s growth in all 5 (China excluded) bilateral and plurilateral GGT models. A partial explanation may be that this stock market crash period was, while

16
significant for free-market economies including Korea, attenuated to some significant extent by Korea industrialisation in the preceding years. The Gulf War in 1991 (C91) which is the warring coalition’s major external shock has also only a weak impact (negatively with Japan and China and positively with ASEAN, US, EU and Australia) on Korea’s growth. In contrast, Korea’s SME and banking reforms of 1995 produce uniformly a beneficial outcome to its trade and growth but the evidence is not that strong. The findings reported in Table 1 indicate the severely damaging effect of the Asia crisis of 1997 (C97) on Korea’s trade and growth and this outcome is found in the trade-growth models of all of Korea’s six trading countries and blocs. Finally, Korea’s program of reforms after the 1998 Asia crisis (C02) seems to have born fruits with a positive and generally significant effect on its growth from all trading partners. Two derivative conclusions can be derived from the results above. First, a contemporary trade-growth model for Korea (or any other major country in Asia) vis-a-vis its 6 (or any other) trading partners without (a) the inclusion of these recent shock (sudden change) factors (as implied by Frankel and Romer, 1999, but not dealt with in standard GT or CGE/GTAP impact evaluation studies), (b) economic policy reform (gradual change), or (c) as rightly stipulated by Johansen (1982) for policy analysis even in neo-classical models, may have serious and biased results on the causation and subsequent policies being explored and formulated for governments, national and international trade agencies. Second, shocks (and major policy reform), when appropriately modelled and measured with historical trade-growth data, do seriously affect a country’s development and growth and, from a policy’s perspective, severely damage its ability to carry out economic and social reforms, regional and global economic relations activities. In this context, the tsunami devastation in the Indian Ocean on the Boxing Day 26 December 2004 would be a major issue for governments and policy-makers in the affected countries and regions as far as development and growth prospects in the future are concerned. Are Korea’s Trade-Growth Causation Results Affected by Estimation Methodologies? In previous studies of trade-growth, OLS results of trade-growth models based on the gravity theory or similar theory seem to indicate an underestimation of the trade effect. In other words, IV (eg, 2SLS) estimates of the trade effect are usually found to be at least larger than OLS estimates. In our present studies, this is also supported for trade (openness/GDP) with the exception of Korea-US and Korea-Australia. In terms of FDI however, the underestimation of the OLS is true for all 5 trade-growth models, Korea-US excepted. Four reasons have been put forward to explain the underestimation of the OLS and two explanations for the overestimation of the 2SLS (see Frankel and Romer, 1999, for a brief survey, Anderson, 1979, discusses the bias due to specification). It is well known from the bias –βCov(Vu) of the OLS in the standard errors-in-variables models (that is, y=βX*+u, but X* is unobserved and proxied by observed X with X=X*+V, where V is measurement errors) or, equivalently, in simultaneous-equation econometric models, that the specification of the model or the instruments (as captured through Cov(Xu)) solely determines a downward or upward bias of the OLS. In our view, it is the nature of the model and the characteristics of the instruments and collected data that empirically determine the estimation bias. A general conclusion for a model may not be made in this case. When we take into account new advances in the estimation and forecasting theory in econometrics and its sister, statistics, and when we are focused on higher efficiency for the estimates of the models that are subject to misspecification (eg, omitted relevant variables) or measurement errors or simultaneity bias, then the 2SHI estimates should, as has been demonstrated earlier, be used. In this case, the impact based on the OLS is underestimated and that on the 2SLS overestimated and seriously so in some trade-growth models. In

17
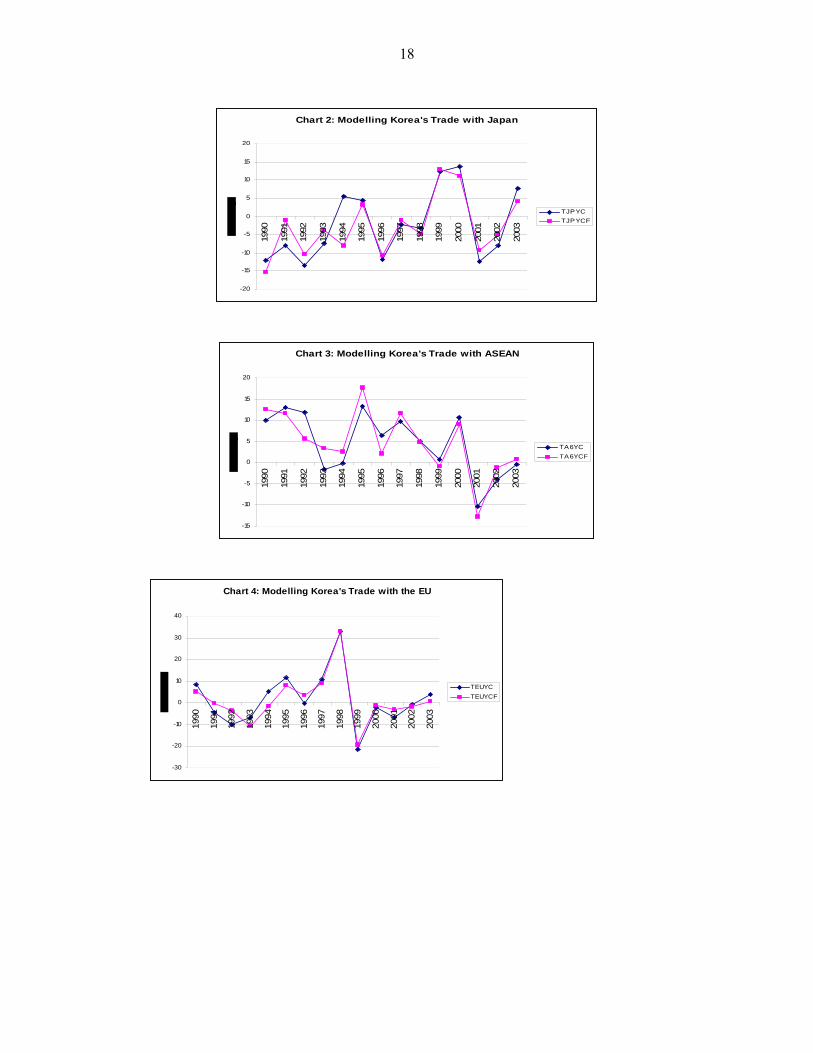
addition, historical and ex-post forecasts and impact derived from the OLS and 2SLS will be seriously statistically biased and informationally suboptimal. Do Our Trade Forecasts Model Observed Trade Well? This is a question on the accuracy and reliability of the trade-growth model and the instruments – in a simultaneous-equation context- used (a point often raised in the literature, see Frankel and Romer, 1999). The answer in this case has to be relative, as different models will have different instruments and therefore different accuracy or reliability outcomes. To answer this question for our simultaneous-equation models of Korea’s trade-growth above, we have calculated the proxy for T, namely Ť, from its reduced form for each of the estimations requiring a knowledge of Ť. Standard evaluation criteria such as the correlation coefficient, the RMSE, and the Theil-MSE-decomposition Um (bias), Us (variation), and Uc (covariance) where, by definition, Um + Us + Uc = 1 (see Pindyck and Rubinfeld, 1998), are then used to evaluate the proxy performance of Ť as compared to its actual T in each of the 6 models reported in Table 1. The results of this evaluation are given in Table 2. The graphs of the actual trade flows between Korea and its 6 major trading partners and their estimates from our 6 trade-growth models have also been plotted (see Charts 2-7). From these graphs, we first note that, as in the earlier studies using our new modelling flexible (that is, simultaneous-equation and function-free GGT) approach, the Ť very accurately emulates all troughs, peaks and turning points of the actual T in all 6 models. Second, the excellent modelling success here should also be assessed in the context of modelling the rates of changes of major economic variables or activities, a notoriously difficult task according to researchers in this field. Third, as the Ť seems to be a very good estimated proxy to T in all models, our findings would enhance the robustness and reliability of our estimation (by the OLS, 2SLS or 2SHI) of the impact of Korea’s trade with its major 6 trading partners on its growth, and provide mre credible empirical support to related recommendations on trade policy or economic relations.
18
Chart 2: Modelling Korea's Trade with Japan
-20
-15
-10
-5
0
5
10
15
20
1990
1991
1992
1993
1994
1995
1996
1997
1998
1999
2000
2001
2002
2003
TJPYCTJPYCF
Chart 3: Modelling Korea's Trade with ASEAN
-15
-10
-5
0
5
10
15
20
1990
1991
1992
1993
1994
1995
1996
1997
1998
1999
2000
2001
2002
2003
TA6YCTA6YCF
Chart 4: Modelling Korea's Trade with the EU
-30
-20
-10
0
10
20
30
40
1990
1991
1992
1993
1994
1995
1996
1997
1998
1999
2000
2001
2002
2003
TEUYCTEUYCF

19
Chart 5: Modelling Korea's Trade with the US
-20
-15
-10
-5
0
5
10
15
20
25
30
1990
1991
1992
1993
1994
1995
1996
1997
1998
1999
2000
2001
2002
2003
TUSYCTUSYCF
Chart 6: Modelling Korea's Trade with Australia
-30
-20
-10
0
10
20
30
40
1990
1991
1992
1993
1994
1995
1996
1997
1998
1999
2000
2001
2002
2003
TOZYCTOZYCF
Chart 7: Modelling Korea's Trade with China
-10
-5
0
5
10
15
20
25
30
35
40
1990
1991
1992
1993
1994
1995
1996
1997
1998
1999
2000
2001
2002
2003
TCNYCTCNYCF

20
Table 2 Reliability of Merchandise Trade Proxy in
Models on Korea’s Trade with its Six Major Trading Partners Openness (Exports+Imports)/GDP
1981 to 2003
Model Korea-A6 Korea-Japan Korea-US Korea-EU Korea-Australia Korea-China Correlation Coefficient 0.95 0.89 0.95 0.94 0.98 0.99 RMSE 3.31 4.46 2.86 4.15 2.35 1.70 Mean Error 0.00 0.00 0.00 0.00 0.00 0.00 Um 0.00 0.00 0.00 0.00 0.00 0.00 Us 0.03 0.06 0.02 0.03 0.01 0.01 Uc 0.97 0.94 0.98 0.97 0.99 0.99 _____________________________________________________________________ Notes. Ub+Us+Uc = 1. See Pindyck and Rubinfeld (1998) for further detail on these evaluation criteria. The estimates are based on TSP calculation. Implications for Korea’s Trade and Investment Policy Our findings as given in Table 1 appear to support the view that Korea’s merchandise trade (ie, exports and imports of goods), while being considered widely as the most important element of all FTAs or closer economic relations by the media and in political debates and dialogues even at the highest level of government or corporation, constitutes empirically only a small contribution to Korea’s growth, based on historical data over the past 2 decades or so. Korea’s trade with the ASEAN, the US and Japan positively contributes to this but only Korea-Japan trade is a significant factor. Both services and FDI flows surprisingly reduce Korea’s growth and the effect is highly significant (except with Australia) in the case of services. While FDI is usually seen as the most important driver of a country’s economic performance, our finding’s implication seems to capture Korea’s economic policy of less focus on FDI and FDI promotion during the period under study. Implications for Korea’s Regional FTA Strategy The findings above lead us a fortiori to the conclusion that Korea, in spite of its widespread trade with all major trading partners in the world, has been focusing chiefly on its trade and trade benefits with a close neighbour, Japan. These also may explain why Korea has been reluctant to go into an FTA with any major countries either in the ASEAN region or beyond. In addition, the fast growing trade between Korea and China (see Chart 1) and its beneficial effect on Korea’s growth may tempt Korea to start what would become a bilateral Korea-China FTA or an East Asia 3 FTA as a strategic move for economic and political relations in the medium term. References ABC (Australian Broadcasting Commission) (2004) Allen, R.G.D. (1960), Mathematical Analysis for Economists, London: Macmillan. Anderson, J.E. (1979), “A Theoretical Foundation for the Gravity Equation”, American
Economic Review, Vol. 69, pp. 106-116. Anderson, T.W. (1984), An Introduction to Multivariate Statistical Analysis, 2nd Edition,
New York: Wiley. ASEAN (1999), Joint Statement on East Asia Cooperation, 28 November 1999,
www.aseansec.org/, September 2002.

21
ASEAN (2002), www.aseansec.org/, August 2002. Austrade (2003), Economic and Trade Statisrtics, www.austrade.gov.au/, July 2003. Baranchik, A.J. (1973), "Inadmissibility of Maximum Likelihood Estimators in some
Multiple Regression Problems with Three or More Independent Variables", Annals of Statistics, Vol. 1, pp. 312-321.
Barker, G. (2002), “Integrate or Fail, EU Official Warns Pacific Nations”, Australian Financial Review, 9 October 2002, p. 10.
Barro, G. and Helpman, E. (1991), “Trade, Knowledge Spillovers and Growth”, European Economic Review, Vol. 35, pp. 517-536.
Coe, D. and Helpman, E. (1993), “International R&D Spillovers”, National Buraeu of Economic Research Working Paper, Cambridge, MA, No. 4444, August 1993.
DFAT (Department of Foreign Affairs and Trade) (2005), http://www.dfat.gov.au/trade/ftas.html/.
Dollar, D and Kraay, A. (2004), “Trade, Growth, and Poverty”, Economic Journal, Vol. 114, http://80-www.blackwell-synergy.com.ezproxy.uow.edu.au/. Engle, R.F. and Granger, C.W.J. (1987), "Co-integration and Error Correction:
Representation, Estimation and testing", Econometrica, Vol. 55, pp. 251-276. Guttmann, S. and Richards, A. (2004), “Trade Openness: An Australian Perspective”, Reserve Bank of Australia Discussion Paper No. 2004-11. Frankel, J.A., Romer, D. and Cyrus, T.L. (1996), “Trade and Growth in East Asian Countries: Cause and Effect”, National Bureau of Economic Research Working Paper (Cambridge, MA), No. 5732, August 1996. Frankel, J.A. and Rose, A.K. (1998), “The Endogeneity of The Optimum Currency Area Criteria”, Economic Journal, Vol. 108, pp. 1009-1025. Frankel, J.A. and Romer, D. (1999), “Does Trade Cause Growth?”, American Economic
Review, Vol. 89, pp. 379-399. Granger, C.W.J. (1969), “Investigating Causal Relations by Econometric Models and Cross-
Spectral Methods”, Econometrica, Vol. 37, pp. 424-438. Harrison, A. (1996), “Openness and Growth: A Time-series, Cross-Country Analysis for Developing Countries”, Journal of Development Economics, Vol. 48, pp. 410- 447. Hartcher, P. (2002), “Grape Progress on US Trade Deal”, Australian Financial Review, 24 May 2002, p. 22. Harvie, C. (1999), “Economic transition: what can be learned from Korea’s experience”, International Journal of Social Economics, Vol. 26, No. 7/8/9, pp 1091-1119. Harvie, C. and Lee, H-H. (2002), “New Regionalism in East Asia: How Does It Relate to the
East Asian Economic Development Model?”, ASEAN Economic Bulletin, Vol. 19, pp. 123-140.
Harvie, C. (2004) “Corporate Restructuring in the wake of the Financial Crisis”, in Harvie. C and Lee, H-H (eds) (2004), The Korea Economy: Post-crisis Policies, Issues and Prospects, Cheltenham: Edward Elgar.
ICSEAD (International Center for the Study of East Asian Development) (2004), http://www.icsead.or.jp/index_e.html
IMF (2005), World Economic Outlook, http://www.imf.org/external/pubs/ft/weo/2004/01/index.htm
Johansen, L. (1982), "Econometric Models and Economic Planning and Policy: Some Trends and Problems", in M. Hazewinkle and A.H.G. Rinnooy Kan (eds.), Current Developments in the Interface: Economics, Econometrics, Mathematics, Boston: Reidel.
Linneman, H. (1966), An Econometric Study of International Trade Flows, Amsterdam: North-Holland.
Namba, A (2000), “MSE Dominance of the PT-2SHI Estimator over the Positive-part Stein-rule Estimator in Regression”, Journal of Statistical Planning and Inference, No. 89, pp. 175-85.
Namba, A. (2001), “MSE Performance of the 2SHI Estimator in a Regression Model with Multivariate-t Error Terms. Statistical Papers, Vol. 42(1): pp.81-96.

22
Otto, G., Voss, G. and Willard, L. (2002), “Understanding OECD Output Correlations”, Seminar Paper, Department of Economics, University of Wollongong, May 2002. Perron, P. (1989), “The Great Crash, the Oil Price Shock, and the Unit Root Hypothesis”, Econometrica, Vol. 80, pp. 1361-1401. Perron, P. (1997), “Further Evidence on Breaking Trend Functions in Macroeconomic Variables, Journal of Econometrics, Vol. 80, pp. 355-385. Pindyck, R.S. and Rubinfeld, D.L. (1998), Econometric Models and Economic Forecasts, Sydney: McGraw-Hill. PC (2003) Productivity Commission, http://www.pc.gov.au/researchproject/2001/010202.html . Romer, D. (1993), “Openness and Inflation: Theory and Evidence”, Quarterly Journal of
Economics, Vol. 108, pp. 869-903. Rose, A.K. (2000), “One Money, One Market: The Effect of Common Currencies on Trade”,
Economic Policy, Vol. 30, pp. 9-33. Raimondos-Moller, P. and Woodland, A. D. (2002), “A Note on Two Elementary
Propositions on Customs Unions”, International Conference on WTO and World Trade, III: Challenges in a New Area, Gerhard-Mercator University, Duisburg, Germany, 29-30 June 2002.
Rees, L. and Tyers, R. (2004), “On the Robustness of Short Run Gains from Trade Reform”, CEPR Discussion Paper No. 474, Australian National University, Canberra, 2004.
Ruffin, R J and R W Jones (2003), “Real Wages and Trade: Insights from Extreme Examples”, Paper presented at Festschrift Workshop in Honour of Peter Lloyd, Department of Economics, University of Melbourne, 23-24 January 2003.
Sala-I-Martin, X. (1991), “Comment”, in Blanchard, O.J. and Fischer, S. (eds), NBER Macroeconomic Annual 1991, Cambridge, MA: MIT Press, 1991, pp. 368-78.
Stone, R (1988), “Progress in Balancing the National Accounts”, in Ironmonger, D S, Perkins, J O N and Tran Van Hoa (eds), National Income and Economic Progress: Essays in Honour of Colin Clark, London: Macmillan.
Tran Van Hoa (1985), "The Inadmissibility of the Stein Estimator in Normal Multiple Regression Equations", Economics Letters, Vol. 19, pp. 39-42.
Tran Van Hoa (1986a), "The Inadmissibility of the Stein Estimator in Normal Multiple Regression Models: Analytical and Simulation Results", 15th Anniversary of the NBER-NSF Seminar on Bayesian Inference in Econometrics, ITAM, Mexico City, 16-18 January 1986.
Tran Van Hoa (1986b), "Improved Estimators in Some Linear Errors-in-Variables Models in Finite Samples", Economics Letters, Vol.20 (1986), pp. 355-358.
Tran Van Hoa (1986c), "The Inadmissibility of the 2SLS Estimator in some Linear Structural Equations", Economics Letters, Vol. 21 (1986), pp. 337-341. Tran Van Hoa (1992a), "Modelling Output Growth: A New Approach", Economics Letters,
Vol. 38, pp. 279-284. Tran Van Hoa (1992b) "Energy Consumption in Thailand: Estimated Structure and Improved
Forecasts to 2000" (in Thai), Thammasat Economic Journal (Thailand), Vol. 10, pp. 55-63.
Tran Van Hoa (1992c), "A Multi-equation Model of Energy Consumption in Thailand", International Journal of Energy Research, Vol. 16, pp. 381-385.
Tran Van Hoa (1992d), "A New and General Approach to Modelling Short-Term Interest Rates: With Application to Australian Data 1962-1990", Journal of Economics and Finance: Proceedings, Vol. 16. pp. 327-335.
Tran Van Hoa (1993a), "The Mixture Properties of the 2SHI Estimators in Linear Regression Models", Statistics and Probability Letters, Vol. 16, pp. 111-115.
Tran Van Hoa (1993b), "Effects of Oil on Output Growth and Inflation in Developing Countries: The Case of Thailand 1966:1 to 1991:1", International Journal of Energy Research, Vol. 17, pp. 29-33.

23
Tran Van Hoa (1997), “Improved Forecasts of Investment and Growth in Some Major ASEAN Economies: An Economy-wide Approach”, Journal of Economics and Finance (Proceedings), Vol. 21, pp. 271-280. Tran Van Hoa (2000a) (ed), The Asia Crisis: The Cures, Their Effectiveness and the
Prospects After, London: Macmillan, 2000. Tran Van Hoa (2000b) (ed), The Social Impact of the Asia Crisis, London: Macmillan, 2000. Tran Van Hoa (2002a), “Korea, China and Japan’s Trade with the World and Its Impact on New Asian Regionalism ASEAN+3”, Paper presented at the Joint Conference of the Association of the Korean Economic Studies, Korea Development Institute, and Research Center for International Economics, Yonsei University, Seoul, 21-22 July 2002. Tran Van Hoa (2002b), “Growth of Asian Regional Trade and Income Convergence:
Evidence from ASEAN+3 based on Extended Helpman-Krugman Hypothesis and Flexible Modelling Approach”, Department of Economics, University of Wollongong, mimeo.
Tran Van Hoa (2002c), “New Asian Regionalism: Evidence on ASEAN+3 Free Trade Agreement from Extended Gravity Theory and New Modelling Approach”, Department of Economics, University of Wollongong, mimeo.
Tran Van Hoa (2002d) (ed.) Economic Crisis Management, Mass: Edward Elgar. Tran Van Hoa (2003), “New Asian Regionalism and ASEAN+3 Free Trade Agreement:
Theoretical and Empirical Foundation, Policy Challenges and Growth Prospects”, Chulalongkorn Journal of Economics (Thailand), forthcoming.
Tran Van Hoa (2004), Korea’s Trade, Growth of Trade and the World Economy in Post-crisis ASEAN+3 Free Trade Agreement: An Econometric and Policy Analysis, Journal of the Korean Economy, Vol. 5, No. 2, pp. 73-108.
Tran Van Hoa (2005), “Modelling the Impact of Korea’s WTO Membership on Its Investment and Growth: A New Flexible Keynesian Approach” (with Comment), in Heiduk G.S. and Wong, Karyiu (eds), WTO and World Trade, New York: Physica- Verlag, 2005.
Tran Van Hoa and Chaturvedi, A. (1988), "The Necessary and Sufficient Conditions for the Uniform Dominance of the Two-Stage Stein Estimators", Economics Letters, Vol. 28, pp. 351-355. Tran Van Hoa and Chaturvedi, A. (1990), "Further Results on the Two-Stage Hierarchical Information (2SHI) Estimators in the Linear Regression Models", Communications in Statistics (Theory and Methods), Vol A19, No. 12, pp. 4697- 4704. Tran Van Hoa (with Chaturvedi, A. and Shukla, G.) (1993), "Performance of the Stein-rule
Estimators when the Disturbances are Misspecified as Spherical", Economic Studies Quarterly (Japan), Vol. 44, pp. 601-611.
Tran Van Hoa (with Chaturvedi, A.) (1997), “Performance of the 2SHI Estimator under the Generalized Pitman Nearness Criterion”, Communications in Statistics (Theory and Method), Vol. 26, Issue 5, pp. 1227-1238.
Tran Van Hoa and Harvie, C (1998), Causes and Impact of the Asian Financial Crisis, London: Macmillan.
Ullah and Ullah (1978), "Double k-class Estimators of Coefficients in Linear Regression", Econometrica, Vol. 46, pp. 705-722.
World Bank, (2004), World Tables, World Bank, Washington DC.


![Economic Reforms India[1]](https://img.dokumen.tips/doc/110x75/577d20011a28ab4e1e91c5b2/economic-reforms-india1.jpg)