Embed Size (px)
Citation preview

ADVANCES in NATURAL and APPLIED SCIENCES
ISSN: 1995-0772 Published BY AENSI Publication EISSN: 1998-1090 http://www.aensiweb.com/ANAS
2016 October 10(15): pages 31-42 Open Access Journal
To Cite This Article: G. Kathiresan and Dr. S. Ragunathan., Impact of Drivers for the Implementation of Green Supply Chain Management in Leather Industries of Northern Tamilnadu. Advances in Natural and Applied Sciences. 10(15); Pages: 31-42
Impact of Drivers for the Implementation of Green Supply Chain Management in Leather Industries of Northern Tamilnadu
1G. Kathiresan and 2Dr. S. Ragunathan 1G. Kathiresan, Associate Professor, Department of Mechanical Engineering, SSM College of Engineering, Komarapalayam-638183, Namakkal District, Tamilnadu, India. 2Dr. S.Ragunathan, Principal & Professor, Department of Mechanical Engineering, AVS Engineering College, Military Road, Ammapet, Salem District-636006, Tamilnadu, India.
Address For Correspondence: G.KATHIRESAN, Associate Professor, Department of Mechanical Engineering, SSM College of Engineering, Komarapalayam-638183, Namakkal District, Tamilnadu, India.
Copyright © 2016 by authors and American-Eurasian Network for Scientific Information (AENSI Publication). This work is licensed under the Creative Commons Attribution International License (CC BY). http://creativecommons.org/licenses/by/4.0/
ABSTRACT Background: Green supply chain management (GSCM) is an influential weapon to distinguish one concern from the others and it can significantly control the success of any plan. Green supply chain intents at restraining the wastages within the industrial structure for preserving the energy and prohibit the dissipation of hazardous substances in to environment. With elevated attentiveness about corporate onus and the decisive to meet the strings of the environmental policy, green supply chain management (GSCM) is becoming more and more important for Indian firms. Objective: The main objective of this research is to identify pivotal and obtrusive drivers for espousing “greenness” in supply chain management system of leather industries to originate eco-friendly environment by diminishing pollution. This work also interprets the impact of pinpointed drivers (such as technological, organizational and environmental) in the adoption of green supply chain management using structural equation modeling (SEM), VIKOR and Fuzzy VIKOR. Results: Hence SEM, VIKOR and Fuzzy VIKOR provide a base line to analyze and understand the importance of parameter weightage and ranking pertaining to GSCM implementation in leather industry. Conclusion: From the results, weightage of each drivers and its ranking were found. Among all identified drivers it is perceived that External Stakeholder Cooperation demeanour has high impact for approbation of green concept in supply chain management in Tamilnadu leather industries
KEYWORDS: Structural Equation Modeling, VIKOR, Green Supply Chain, Fuzzyness, Tannery,
INTRODUCTION
Environmental degradation is a growing global concern in today’s competitive scenario. In 2010, the
world’s greenhouse gas emission was the highest ever in history. The implications this will have is
still unknown, but research done leaves no doubt that the climate changes facing today is a consequence of
the increased amounts of gases that circulates in our atmosphere due to increased human activity following
the industrialization. Researchers are saying that if the global middle-temperature rises with more than 2
degrees Celsius until 2100 there is a large potential for dangerous climate change.
The expected consequences of climate change is that it will cause a more uneven distribution of the
world’s resources than what is the case today, and thus leading to mass migrations and conflicts [1].
Increasing environmental awareness amongst the customer and government rules getting stricter has increased
the pressure on the industries to become more eco-friendly. Increased production and consumption has resulted
in increased use of raw material and energy, which has led to the depletion of natural resources. Additionally,
the waste production and pollution has also increased significantly. Hence, there is an utmost need of

32 G. Kathiresan and Dr. S. Ragunathan., 2016/ Advances in Natural and Applied Sciences. 10(15) October 2016, Pages: 31-42
improvement in industrial processes for product manufacturing. Thus, the companies are being subjected to the
dual challenge of responding to competitive and environmental demands simultaneously. The Green or
Sustainable Supply Chain is an approach which seeks to minimize an organization’s ecological footprint, and
is an extremely broad area of study. GSCM has caught the attention of most of the multinational industry and
SME (Small and Medium industry) in last two decades for the sake of environmental factors. Due to civic
alertness, fiscal, ecological or legislative reasons, the necessity of GSCM has increased [2].
Literature Review:
Literature review on Green Supply Chain Management (GSCM):
GSCM is considered as a process of integrating the environmental concerns, values and thinking into
supply chain [3]. GSCM is a spectacle where eco-friendly novelties disperse from a consumer firm to a
purveyor firm, with ecological innovation defined as being yields, procedure, technics or method developed to
trim down environ effect [4]. It is not astonishing that green supply chain management meets its explication in
the supply chain management. Accumulating the green module to supply chain management comprises
inscribing the power and appositeness of supply chain management to the connatural environment [5]. The
concept of GSCM can be holistically represented in following fig.1 [6].
Fig. 1: Schematic Representation of GSCM
Literature Review on GSCM Research:
GSCM is a very good practice to be done for dealing and minimizing with the environmental issues that we
are facing today [7]. Many researchers contribute in this topic in various respects. Several researchers have
given various definitions of GSCM in different perspective. Number of definitions of GSCM exist [8]. Similar
to the concept of supply chain management, the boundary of GSCM is dependent on researcher goals and the
problems at hand, e.g., should it be just the procurement stage or the full logistics channel that is to be
investigated [9]. Detailed review of the work carried out by Srivastava et al., [10-11] reveals that the key themes
from the perspective of practice and performance of GSCM that came out in the prose over the last two decades
are the conception of: green configuration, green operations, reverse logistics, offal management and green
production. The green supply chain concept came into context in 1989. Kelle and Silver’s [12] article was the
pioneer of this fiction that extended an optimal forecasting structure for organizations to use to anticipate
products that can be potentially be reused. According to Chen et al., [13] the customer is the essence of any
business. Businesses must design and manufacture products and provide services that meet customers’ needs
and expectations. Environmental consciousness of consumers is one of the most significant driving forces for
companies to engage in environmental management. If consumers are ‘green’, then it will be profitable for
business to become ‘green’ [14].
Research Gap:
It is evident from the literature review that extensive research has been in the field of GSCM. It is
unfortunate that Indian manufacturing sector is not yet embracing the concept of GSCM enthusiastically. It is a
well-known fact that leather industrial sector plays a vital part of manufacturing industry next to textile
industrial segment in the northern region of Tamilnadu. Tanneries in Tamilnadu are getting revolutionized
rapidly but are still reluctant to adapt to the concept of GSCM. It is thus imperative to identify the factors that
will motivate the tanneries to adopt the concept of GSCM.
Problem Description:
Due to environmental issues, GSCM find a great need in the society. A lot of work has been done on it but
the main drawback is that implementation of GSCM has not been seen active in full form. Today many
industries are following “greenness” in their business but at the same time many industries are there which are
not following GSCM. It not only causes problem for them but also to the society. According to the project
undertaken by Central Leather Research Institute (Chennai) and Pollution control authorities, leather industry
sector fared badly in the green rating program, and supply chain has the major contribution in reducing the green
33 G. Kathiresan and Dr. S. Ragunathan., 2016/ Advances in Natural and Applied Sciences. 10(15) October 2016, Pages: 31-42
rating of the company [15]. So it is importunate to identify the drivers to help the industry to achieve
environmental sustainability.
This Thesis is the comprehensive study of various such drivers which motivates and encourages the
industries to transit from conventional supply chain to an ecofriendly supply chain in order to reduce the
environmental footprint of the organization. In this study various driving factors are identified by referring to the
literature and by consulting various experts from academia and industry. The identified drivers are then tested in
the Tamilnadu leather manufacturing environment and then are analyzed by using 3 methods in order to identify
the relative importance of the drivers and it is adjudged by the relation between the identified drivers.
The factors are extensively analyzed using 3 different methods
1. Structural Equation Modeling (SEM)
2. VIKOR and
3. Fuzzy VIKOR.
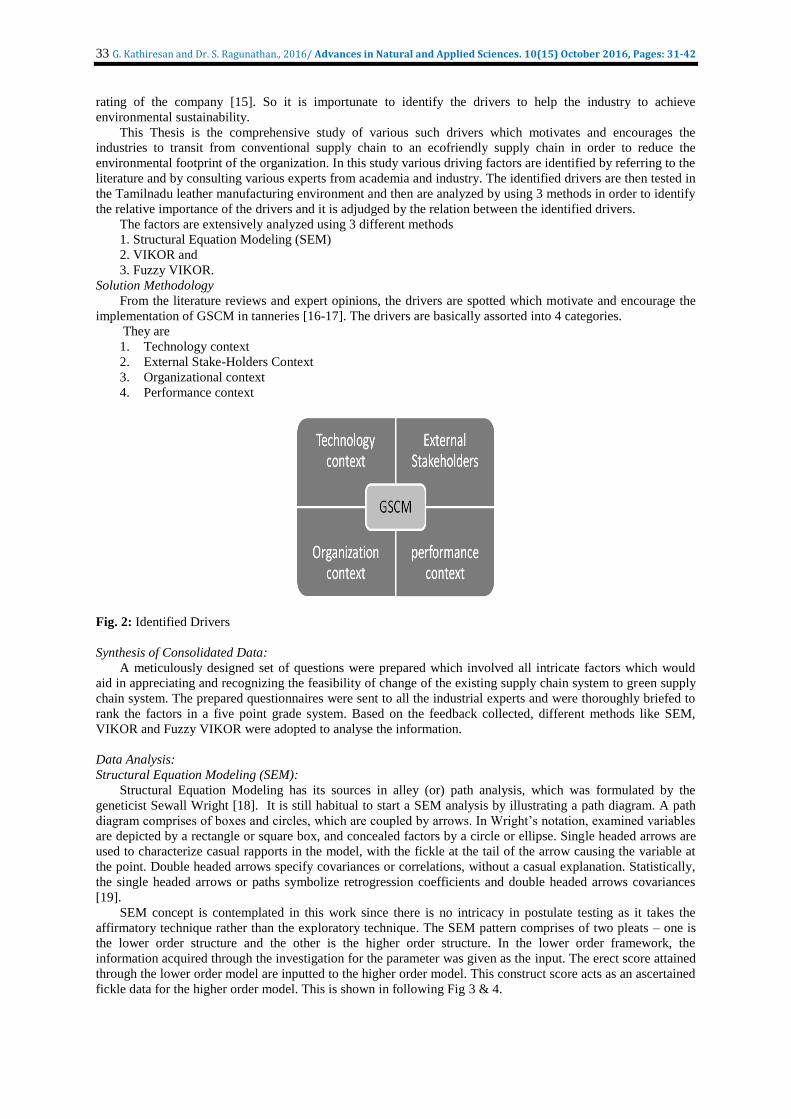
Solution Methodology
From the literature reviews and expert opinions, the drivers are spotted which motivate and encourage the
implementation of GSCM in tanneries [16-17]. The drivers are basically assorted into 4 categories.
They are
1. Technology context
2. External Stake-Holders Context
3. Organizational context
4. Performance context
Fig. 2: Identified Drivers
Synthesis of Consolidated Data:
A meticulously designed set of questions were prepared which involved all intricate factors which would
aid in appreciating and recognizing the feasibility of change of the existing supply chain system to green supply
chain system. The prepared questionnaires were sent to all the industrial experts and were thoroughly briefed to
rank the factors in a five point grade system. Based on the feedback collected, different methods like SEM,
VIKOR and Fuzzy VIKOR were adopted to analyse the information.
Data Analysis:
Structural Equation Modeling (SEM):
Structural Equation Modeling has its sources in alley (or) path analysis, which was formulated by the
geneticist Sewall Wright [18]. It is still habitual to start a SEM analysis by illustrating a path diagram. A path
diagram comprises of boxes and circles, which are coupled by arrows. In Wright’s notation, examined variables
are depicted by a rectangle or square box, and concealed factors by a circle or ellipse. Single headed arrows are
used to characterize casual rapports in the model, with the fickle at the tail of the arrow causing the variable at
the point. Double headed arrows specify covariances or correlations, without a casual explanation. Statistically,
the single headed arrows or paths symbolize retrogression coefficients and double headed arrows covariances
[19].
SEM concept is contemplated in this work since there is no intricacy in postulate testing as it takes the
affirmatory technique rather than the exploratory technique. The SEM pattern comprises of two pleats – one is
the lower order structure and the other is the higher order structure. In the lower order framework, the
information acquired through the investigation for the parameter was given as the input. The erect score attained
through the lower order model are inputted to the higher order model. This construct score acts as an ascertained
fickle data for the higher order model. This is shown in following Fig 3 & 4.

34 G. Kathiresan and Dr. S. Ragunathan., 2016/ Advances in Natural and Applied Sciences. 10(15) October 2016, Pages: 31-42
nnnY
Y
Y
Y
Y
Y
4
3
2
1
4
3
2
1
4
3
2
1
Fig. 3: Lower order SEM Model Fig. 4: Higher Order SEM Model
Then, the factor loading of each scale on GSCM are analyzed for significance and the importance of each
gauge, in spite of the symbol, will give the impact of those drivers on GSCM. These values are cashed for
attaining at the proportionate weightage of traits. To execute the aforementioned technique, SEM model with
LISREL representation can be developed by assuming the relationship between the observed variables and their
underlying factors.
Fig. 5: Conceptual Model of Lower Order Fig. 6: Conceptual Model of Higher Order
Equation Formation:
The lower order and higher order factor structure can be written in equation or statement which briefs its
configuration.
The Lower order factor structure equations are
Y1 = λ11 + 1, Y2 = λ21 + 2,
Y3 = λ31 + 3, Y4 = λ41 + 4 ….
Yn = λnn + n
and the equation can be written in vector form as:
Also, the above lower order system can be compiled as:
YY

35 G. Kathiresan and Dr. S. Ragunathan., 2016/ Advances in Natural and Applied Sciences. 10(15) October 2016, Pages: 31-42
η = Γ ξ +
Aj = γj / ∑ γj
Where, the Lower- order factor loadings and ε is assessment fallacy terms.
The higher order constituent system equations are
η1 = 1 ξ + 1, η2 = 2 ξ + 2,
η3 = 3 ξ + 3, η4 = 4 ξ + 4,
η5 = 5 ξ + 5, η6 = 6 ξ + 6,
η7 = 7 ξ + 7, η8 = 8 ξ + 8,
η9 = 9 ξ + 9, η10 = 10 ξ + 10
and the equation can be written in vector form as
Where, 1, 2,3,4… 10 - Higher- order factor loadings,
1,2,3,4 … 10 - Assessment fallacy terms
Also, the above higher order structure can be abridged as:
Where, Γis Higher- order element loadings and is Remnant (i.e. Residual) error terms.
From the higher order element structure, important factors were recognized. Based on that, relative
weightage for the attributes are deliberated using the subsequent expression.
Comparative weightage for trait (Latent factors):
Where γj is the High order element loading of the “j” th trait and
∑ γj is the summation of all the High order element loadings of the traits.
Thus relative influence or weightage of attributes on driver selection can be established by Structural
Equation Model (SEM). The achieved results from LISREL for lower order and higher order model are depicted
in fig respectively.
Fig. 7: Lower Order GSCM Driver Model Fig. 8: Higher Order GSCM Driver Model
nnn
4
3
2
1
4
3
2
1
4
3
2
1
36 G. Kathiresan and Dr. S. Ragunathan., 2016/ Advances in Natural and Applied Sciences. 10(15) October 2016, Pages: 31-42
From the above diagrams it is evident that the loading of SHC i.e., Stake holders Cooperation has highest
impact for the adoption of green supply chain in leather industries.
VIKOR:
VIKOR method can be used to resolve multiple criteria decision making (MCDM) problems with
contradictory and non-proportionate (different units) factors, portraying that relinquishing is agreeable for
contrast resolution, the decider wants a solution that is the intimate to the optimal, and the alternates are
valuated according to all constituted criteria. This technique focus on sorting and selecting from a set of
alternates in the presence of conflicting criteria and on suggesting conciliate solution [20].
By applying VIKOR method, the ranking for each identified drivers were found and mentioned below
Table 1: Initial Criteria Matrix
Criteria c1(.20) c2(.17) c3(.23) c4(.14) c5(.26)
Organizational Context 3 3 4 3 2 Technology Context 4 4 4 3 3
Regulatory Requirement 3 4 3 4 3
Stakeholders Cooperation 4 4 4 3 4 Environmental Impact 4 3 3 4 3
Economic Performance 2 3 3 2 2
Table 2: Result Matrix
S.No Organi
zational
Context
Techno
logy
Context
Regulatory
Require
ments
Stake
holders
Cooperation
Environ
mental
Impact
Economic
Performance
1 S 3 2 4 1 5 6
2 R 4 1 5 6 3 Q 4 1 5 6
Table 3: Result of Sub-Criteria Matrix
S.No Ranking A7 A8 A9 A10 A11 A12
1 Sj 6 1 2 5 4 3
2 Rj 6 1 2 5 4 3
3 Qj 6 1 2 5 4 3
Fuzzy VIKOR:
From the findings of Tien-Chin Wang and Tsung-Han Chang [21], it reveals that when the info in a
decision making system is undefined, indecipherable, and imprecise or represented in linguistic terms, this leads
to the study of a new decision analysis field i.e., fuzzy decision analysis. The fundamental principle of VIKOR
is that each alternate can be appraised by each destined function; avow ranking can be presented by relating the
degree of propinquity to the irreproachable alternative [22-23-24].
According to Tien-Chin Wang, the following steps are proposed as a procedure of fuzzy VIKOR method
underneath fuzziness environment.
Step 1. Shape a clique of decision makers, and then clarify the assessment criteria and viable alternatives.
Step 2. Pinpoint the pertinent linguistic variables for evaluating the significance weight of criteria, and the
grading of alternatives.
Step 3. Drag the decision makers’ notions to get the accumulated fuzzy precedence weight of criteria, and
aggregated fuzzy rating of alternatives. If there are k persons in a decision making group, the prominence weight
of criteria and rating of each alternative can be computed by:
k
jjjj WWWk
W~
...~~1~ 21
k
ijijijij xxxk
x ~...~~1~ 21
Step 4. Construct a fuzzy decision matrix, and then find out the fuzzy best value *~, jfFBV and fuzzy
worst value jfFWV~
, of all criteria functions.
Bjxf iji
j ,~max~*
Cjxf iji
j ,~min~
Where B is related with the benefit criteria, C is associated to the expense criteria.

37 G. Kathiresan and Dr. S. Ragunathan., 2016/ Advances in Natural and Applied Sciences. 10(15) October 2016, Pages: 31-42
Step 5. Enumerate the index iS~
and iR~
jjijj
n
j
ji ffxfwS~~
/~~~~ **
1
jjijjjj
i ffxfwR~~
/~~~max~ **
where iS~
denotes to the segregation span of Ai from the fuzzy best value, similarly, iR~
is the separation
span of Ai from the fuzzy worst value, and jw~ is the weight of each criterion.
Step 6. Figure out the index iQ~
**** ~~/
~~1
~~/
~~~RRRRvSSSSvQ iii
,~
max~
,~
min~*
iii SiSSS
Where
iiii RRRR~
max~
,~
min~*
The index ii S~
min is with a summit majority rule, and ii R~
min is with a modicum individual regret of
foe. And v is presented as the weight in scheme of the maximum group utility, usually v = 0.5.
Step 7. Defuzzification for triangular fuzzy number iQ~
.
The technique of transforming a fuzzy number into a curt value is called defuzzification. In this work,
Chen’s method of maximizing set and minimizing set is applied.
The maximizing set is defined as:
RxxfxM M , With the membership function:
otherwise
xxxxxxxxfM
,0
,,/ 21121
By contrast, the minimizing set is defined as: ,, RxxfxG G with the membership function:
otherwise
xxxxxxxxfG
,0
,,/ 21212
Then the right utility iM FU and left utility iG FU can be denoted as:
xfxfFU MFix
iM ^sup
xfxfFU GFix
iG ^sup
As a result, the crisp value can be obtained by combining the right and left utilities.
2/1 FiUFUFU GiMiT
Step 8. Rank the alternatives by the crisp value iQ
The index iQ implies the separation measure of iA from the best alternative. That is, the smaller value
indicates the better performance of an alternative.
Step 9. Propose a compromise solution (a’) by the index Q, if the condition ‘A’ is satisfied.
A. Acceptable advantage: DQaQaQ '"
MMDQ ,1/1 is the number of alternatives 4,25.0 MifDQ , and a” stands for the
alternative with second position ranked by index Q. If condition ‘A’ is not satisfied, maaa ,.......,",' are
compromise solutions. The best alternative is the one with the minimum of Q.
The lacuna observed in the VIKOR method were overcome by following the procedure detailed above and
for every factor and its related sub factors ,analysis were carried out and their respective rankings were found
which have been tabulated below.

38 G. Kathiresan and Dr. S. Ragunathan., 2016/ Advances in Natural and Applied Sciences. 10(15) October 2016, Pages: 31-42
Table 4: Initial Criteria Matrix
Criteria c1(.20) c2(.17) c3(.23) c4(.14) c5(.26)
Organizational Context 3 3 4 3 2 Technology Context 4 4 4 3 3
Regulatory Requirement 3 4 3 4 3
Stakeholders Cooperation 4 4 4 3 4 Environmental Impact 4 3 3 4 3
Economic Performance 2 3 3 2 2
Table 5: Weight Matrix of Criteria
Wt OC TC RR SHC
Env.
Impact
Eco.
Impact
c1 0.2 L 3 4 3 4 4 2
M
R c2 0.17 L 3 4 4 4 3 3
M
R c3 0.23 L 4 4 3 4 3 3
M
R
c4 0.14 L 3 3 4 3 4 2
M
R c5 0.26 L 2 3 3 4 3 2
M
R
Table 6: Final Ranking of Criteria
Organizational Context
Technology Context
Regulatory Requirement
Stakeholders Cooperation
Environment
al Impact
Economic Impact
Sj^l
Sj^m Sj^r
S
Rj^l Rj^m
Rj^r
R qj^l
qj^m
qj^r Q
0.415
0.551 0.356
0.468
0.182 0.26
0.182
0.221 0.835
1.203
0.849 1.0225
0.16
0.2 0.12
0.17
0.104 0.13
0.078
0.11 0.287
0.359
0.215 0.305
0.315
0.394 0.236
0.335
0.131 0.164
0.098
0.139 0.539
0.675
0.403 0.573
0.056
0.07 0.042
0.028
0.056 0.07
0.042
0.0595 0
0
0 0
0.332
0.415 0.249
0.353
0.131 0.164
0.098
0.359 0.555
0.695
0.415 0.59
0.684
0.886 0.591
0.762
0.182 0.26
0.182
0.222 0.884
1.516
1.08 1.249
Ranking
S
R Q
5
5 5
2
2 2
3
3 3
1
1 1
4
4 4
6
6 6
Once the ranking for drivers generated, the ranking for sub-factors also need to generate.
Table 7: Sub-Factors
A11 Works Closely with Government and Local Authority
A12 Financial Benefits from Government for Green Initiatives
A13 Loans From Financial Institutions for Green Practices A14 Supplier Trainings to allow Capability Building in Meeting the Environmental Standards
A15 Awareness Seminar
A16 Technical Advice and Consultation Services from External Parties
Table 8: Weights and Sub-Factors
Stakeholders
Cooperation (SHC) 1 2 3 4 5
Weights 0.2 0.17 0.23 0.14 0.26
A11 3 4 4 2 3
A12 4 5 4 4 5 A13 4 4 5 4 4
A14 3 4 3 4 3
A15 3 3 4 3 4 A16 4 4 5 3 4

39 G. Kathiresan and Dr. S. Ragunathan., 2016/ Advances in Natural and Applied Sciences. 10(15) October 2016, Pages: 31-42
Table 9: Defuzzification and Ranking of Sub-Criteria Matrix
S^l
S^m
S^r
crisp S
0.517
0.739
0.518
0.628
0.092
0.115
0.069
0.097
0.201
0.251
0.15
0.213
0.526
0.754
0.529
0.641
0.439
0.609
0.414
0.518
0.261
0.351
0.231
0.298
0.526
0.754
0.529
0.092
0.115
0.069
R^ R*
R^l R^m
R^r
crisp R Q^l
Q^m
Q^r crisp Q
0.182 0.26
0.182
0.221 0.986
1.519
1.141 1.291
0.092 0.115
0.069
0.097 0
0
0 0
0.104 0.13
0.078
0.11 0.191
0.239
0.143 0.203
0.182 0.26
0.182
0.222 0.996
1.537
1.154 1.306
0.104 0.143
0.114
0.126 0.463
0.721
0.644 0.637
0.104 0.13
0.079
0.111 0.26
0.353
0.241 0.302
0.182 0.26
0.182
0.092 0.115
0.069
Ranking
S
R Q
5
5 5
1
1 1
2
2 2
6
6 6
4
4 4
3
3 3
RESULTS AND DISCUSSIONS
By VIKOR:
S.No. Organizational
Context
Technology
Context
Regulatory
requirements
Stakeholders
Cooperation
Environmental
Impact
Economic
Performance
1 S 3 2 4 1 5 6
2 R 4 2 3 1 5 6
3 Q 4 2 3 1 5 6
By Fuzzy VIKOR:
Ranking
Organizational
Context
Technology
Context
Regulatory
Requirement
Stakeholders
Cooperation
Environmental
Impact
Economic
Impact
S Q
R
5 5
5
2 2
2
3 3
3
1 1
1
4 4
4
6 6
6
By SEM:
As per results mentioned in the tabular column (6 and 9), the drivers are arranged in terms of the calibre of
their prominence based on their respective rank. Stakeholders Cooperation driver has the highest degree of
importance followed by Technology Context, Regulatory Requirement, Organizational Context, Environmental
Performance and Economic Performance. In annexation to this, considering the rank, the valuation factors
namely Regulatory Requirements (i.e., Government Regulations and Principles), Organizational context (i.e.,

40 G. Kathiresan and Dr. S. Ragunathan., 2016/ Advances in Natural and Applied Sciences. 10(15) October 2016, Pages: 31-42
Top Management Commitment, Employee Interest and Involvement), Stakeholders role are classified into root
cluster drivers. While the Technological Context (i.e., Implementation of New Technology and Practices),
Economical impact and Environmental impact are comes under sequel cluster.
The root drivers are very vibrant because of their direct influence on the entire system [25]. Thus, it would
be substantial to focus on the root set drivers. Among all the source factors, stakeholders’ cooperation has the
highest potential, which denotes that it has more impression in sculpting the organizational perception towards
the efficacious implementation of GSCM. Consequently, the drivers in the root cluster needs to be focused as
per their priority while implementing GSCM for achieving the anticipated goal.
Drivers in the sequel cluster tend to be smoothly controlled by other factors. However, these group factors
doesn’t have a direct impact on the GSCM structure, but still, makes a substantial contribution [25]. So, these
drivers need to be deliberated to find out their share in the global manner. In all the upshot drivers, technological
context attains a maximum score, which infers that this factor receives the maximum sway from all other
factors. This study is an exertion to understand and valuate the GSCM plan form industrial circumstances. It
proffers numerous substantial apportion to both the theory and practice in the sphere of GSCM. The present
research work has offered six main success factors based on literature review and experts’ opinion which are
related to successful implementation of GSCM in leather industry sector.
Conclusion:
In the epoch of globalization, ecological sustainability and green disputes have an increasing fame among
researchers and supply chain practisers [26-27]. There are numerous factors allied with assimilation of the green
initiatives in supply chain management [28]. It will be beneficial for organizations to know those drivers to
increase their economic-environ performances [29]. The companies are still belligerent to recognize the
technique for effective implementation of this notion in their relevant spaces [30-31]. In that path, this work
aims to evaluate the drivers correlated to the fruitful implementation of GSCM. This paper helps to shape a
structural model for investigating the kinships among drivers relevant to GSCM implementation. Using
literature and expert’s persuasion, six key factors with its appropriate sub factors, were identified. These drivers
were further evaluated using the Structural Equation Modeling (SEM), VIKOR and Fuzzy VIKOR method. This
approaches identified viable lean alternatives for achieving a defined set of criteria. SEM explores a set of
relationships between one or more Independent variables (IV) and one or more Dependent Variables (DV). The
VIKOR method is stationed on the accumulating ambiguous merit that characterizes how afar an alternative
from the optimal solution. The fuzzy deeds and procedures for ranking fuzzy numbers are spent in emerging
VIKOR algorithm. Fuzzy VIKOR technique aims on ranking and electing from a group of alternates in a blurred
atmosphere having conflicting criteria.
These approaches also aid to divide the factors into root (or) source and sequel cluster. It would be major to
focus on the source drivers in the commencement, and the criteria in the effect set need to be deliberated to find
out their part in the overall manner. As per result of this paper, it is ascertained that, external stakeholder
cooperation (SHC) is the paramount criterion and has preeminent assertive power for the implementation of
green supply chain in Tamilnadu leather Industries. Adoption of greenness in supply chain will assist the
organization to accomplish environmental and economic benefits
Future Scope of the work:
Concerning future work in this field of research, the structural model is based on SEM, VIKOR and Fuzzy
VIKOR methodology, which has its own precincts. Second one could be the driver selection for the successful
implementation of GSCM, as only six key drivers with its related sub factors were identified. Other vital factors
for effective GSCM execution have not been identified and categorized. Likewise the effect of dubiety in
evaluating the drivers has not been considered in this work. It could be targeted as an area of research in future
work. The future study can be directed to realize the hierarchical interrelated relationship among the drivers
using Interpretive Structural Modeling, Analytical Network Process and Fuzzy Analytical Network Process.
REFERENCES
1. Trine-Lise Anker-Rasch and Siri S. Daviknes, 2011. A Study of Green Supply Chain Management within
the pulp and paper industry. Master Thesis, Norwegian School of Economics and Business Administration
(NHH), Bergen.
2. Luthra, S., Vinod, Kumar, S., Abidhaleem, 2011. Barriers to implement green supply chain management in
automobile industry using interpretive structural Modeling technique-An Indian perspective. Journal of
Industrial Engineering and Management, 4(2): 231-257.
3. Lamming, R. and J. Hamapson, 1996. The environmental as a Supply Chain Management issue. British
Journal of Management, 7(March Special Issue), 45-62.
4. Hall, J., 2000. Environmental supply chain dynamic, Journal of Cleaner Production, 8: 455-471.

41 G. Kathiresan and Dr. S. Ragunathan., 2016/ Advances in Natural and Applied Sciences. 10(15) October 2016, Pages: 31-42
5. Ashish Kumar Bhateja, Rajesh Babbar, Sarbjit Singh, Anish Sachdeva, 2011. Study of Green Supply Chain
Management in the Indian Manufacturing Industries: A literature review cum an analytical approach for the
measurement of performance. International Journal of Computational Engineering & Management, 13: 84-
99.
6. Ninlawan, C., P. Seksan, K. Tossapol and W. Pilada, 2010. The Implementation of Green Supply
Chain Management Practices in Electronics Industry. Proceedings of the International Multi-
conference of Engineers and Computer Scientists.
7. Mudgal, R.K., R. Shankar, P. Talib and T. Raj, 2009. Greening the supply chain practices: an Indian
perspective. International Journal of Engineering Trends and Technology, 4(5): 2172-2182.
8. Zhu, Q. and J. Sarkis, 2004. Relationships between operational practices and performance among early
adopters of green supply chain management practices in Chinese manufacturing enterprises. Journal of
Operations Management, 22(3): 265-289.
9. Lai, K.H., E.W.T. Ngai and T.C.E. Cheng, 2004. An empirical study of supply chain performance in
transport logistics. International Journal of Production Economics, 87(3): 321-331.
10. Srivastava, and V.D.R. Guide, 1998. Inventory buffers in recoverable manufacturing. Journal of Operations
Management, 16: 551-568.
11. Srivastava, S.K., 2007. Green supply-chain management: a state-of-the-art literature review. International
Journal of Management Reviews, 9(1):53–80.
12. Kelle, P., E.A. Silver, 1989. Purchasing policy of new containers considering the random returns of
previously issued containers. IIE Transactions, 21(4): 349-54.
13. Chen, Y-S., S.B. Lai and C-T. Wen, 2006. The influence of green innovation performance on corporate
advantage in Taiwan. Journal of Business Ethics, 67(4): 331-339.
14. Roarty, M., 1997. Greening business in a market economy. European Business Review, 97(5): 244-254.
15. Clavijo Buriticá, N., L.M. Correa Lópezand and J.R. Sánchez Rodríguez, 2012. Environmental
Management of the Tanning Industry’s supply Chain: An Integration Model from Lean Supply Chain,
Green Supply Chain, Cleaner Production and ISO 14001:2004. International Journal of Mechanical,
Aerospace, Industrial, Mechatronic and Manufacturing Engineering, 6(10): 2281-2288.
16. Zellalem Tadesse Beyene, 2015. Green Supply Chain Management Practices in Ethiopian Tannery
Industry: An Empirical Study. International Research Journal of Engineering and Technology, 2(07): 587-
598.
17. Hosseini, A., 2007. Identification of Green Management of system’s factors: - A Conceptualized Model.
International Journal of Management Science and Engineering Management, 2(3): 221-228.
18. Wright, S., 1921.Correlation and Causation. Journal of Agricultural Research, (20): 557-585.
19. Hox, J.J., T.M. Bechger, 2011. An Introduction to Structural Equation Modeling. Family Science Review,
354-373.
20. Serafim Opricovic, Gwo-Hshiung Tzeng, 2006. Extended VIKOR method in comparison with outranking
methods. European Journal of Operational Research, pp: 514-529.
21. Tien-Chin Wang, Tsung-Han Chang, 2007. Application of TOPSIS in evaluating initial training aircraft
under a fuzzy environment. Expert Systems with Applications, (33): 870-880.
22. Tzeng, G.H., M.H. Teng, J.J. Chen and S. Opricovic, 2002. Multicriteria selection for a restaurant location
in Taipei”. International Journal of Hospitality Management, (21): 171-187.
23. Tzeng, G.H., S.H. Tsaur, Y.D. Laiw and S. Opricovic, 2002. Multicriteria analysis of environmental quality
in Taipei: public preferences and improvement strategies. Journal of Environmental Management, (65):
109-120.
24. Tzeng, G.H., C.W. Lin and S. Opricovic, 2005. Multi-criteria analysis of alternative-fuel buses for public
transportation. Energy Policy, (33): 1373-1383.
25. Mangla, S., P. Kumar and M.K. Barua, 2014b. An Evaluation of Attribute for Improving the Green Supply
Chain Performance via DEMATEL Method. International Journal of Mechanical Engineering and Robotics,
1(1): 30-35.
26. Govindan, K., K. Mathiyazhagan, D. Kannan and Noorul Haq, 2014. A barriers analysis for Green Supply
Chain Management implementation in Indian industries using Analytic Hierarchy Process. International
Journal of Production Economics, 147(Part B): 555-568.
27. Min, H., and I. Kim, 2012. Green supply chain research: past, present and future. Logistic Research, 4(1-2):
39-47.
28. Luthra, S., M.A. Qadri, D. Garg and A. Haleem, 2014. Identification of critical success factors to achieve
high green supply chain management performance in Indian automobile industry. International Journal of
Logistic Systems and Management, 18(2): 170-199.
29. Diabat, A. and K. Govindan, 2011. An analysis of the drivers affecting the implementation of green supply
chain management. Resources, Conservation and Recycling, 55: 659-667.

42 G. Kathiresan and Dr. S. Ragunathan., 2016/ Advances in Natural and Applied Sciences. 10(15) October 2016, Pages: 31-42
30. Mathiyazhagan, K., and A.N. Haq, 2013. Analysis of the influential pressures for green supply chain
management adoption - an Indian perspective using interpretive structural modeling. The International
Journal of Advanced Manufacturing Technology, 68(1-4): 817-833.
31. Mathiyazhagan, K., K. Govindan and Noorul Haq, 2014. Pressure analysis for green supply chain
management implementation in Indian industries using analytic hierarchy process. International Journal of
Production Research, 52: 1-16.


![Tamilnadu delicacies[1]](https://img.dokumen.tips/doc/110x75/551d02f94979595f198b4753/tamilnadu-delicacies1.jpg)
