Embed Size (px)
Citation preview

Energy Procedia 59 ( 2014 ) 67 – 74
Available online at www.sciencedirect.com
ScienceDirect
1876-6102 © 2014 The Authors. Published by Elsevier Ltd. This is an open access article under the CC BY-NC-ND license (http://creativecommons.org/licenses/by-nc-nd/3.0/).Peer-review under responsibility of the Austrian Academy of Sciencesdoi: 10.1016/j.egypro.2014.10.350
European Geosciences Union General Assembly 2014, EGU 2014
Impact of DMO processing on 3D seismic imaging at Ketzin, Germany
Fei Huang*, Christopher Juhlin, Monika Ivandic, and Fengjiao ZhangDepartment of Earth Sciences, Uppsala University, Uppsala 75236, Sweden
Abstract
The goal of the dip-moveout correction (DMO) is to eliminate velocity bias when stacking. DMO processing is tested in order to account for variable dips at the Ketzin CO2 storage pilot site. In this study, 3D Squeezing DMO is applied to seismic data to study the impact of DMO on seismic imaging and to investigate if it enhances the CO2 seismic monitoring technique. We compare the data with and without DMO processing by utilizing quantitative and qualitative analysis. Our results indicate its effectiveness with applications to the 3D seismic data at the Ketzin site.
© 2014 The Authors. Published by Elsevier Ltd.Peer-review under responsibility of the Austrian Academy of Sciences.
Keywords: CO2 storage; seismic processing; dip-moveout; velocity analysis
1. Introduction
The dip-moveout (DMO) correction is a process which attempts to transform finite offset data closer to zero offset data after the normal-moveout (NMO) correction. The NMO correction is then dip independent and reflections with different dips will stack coherently. DMO may play a critical role in seismic processing by enhancing the final image quality of the seismic data.
DMO by Fourier transform [1] and most other DMO algorithms use constant-velocity in the DMO processing. Constant-velocity DMO has the advantages of relatively less computation cost and easy implementation. However, constant-velocity DMO processing may not perform well in variable velocity media [2]. Results can be even worse compared to without DMO processing, especially for the case of rapid velocity changes [3,4]. To obtain a greater enhancement of the DMO implementation, Artley [5] and others [6,7] presented algorithms of a precise DMOcorrection by exactly handing depth-variant velocity. However, the methods are more complex to implement and the computational costs are considerably higher. To overcome these disadvantages, methods for approximately handing
© 2014 The Authors. Published by Elsevier Ltd. This is an open access article under the CC BY-NC-ND license (http://creativecommons.org/licenses/by-nc-nd/3.0/).Peer-review under responsibility of the Austrian Academy of Sciences

68 Fei Huang et al. / Energy Procedia 59 ( 2014 ) 67 – 74
depth-variant velocity were proposed and developed by Bolondi and Rocca [8] and other authors [9]. Furthermore, Hale and Artley [10] improved these methods by squeezing a constant-velocity DMO operator and showed enhanced imaging results for both synthetic and real data.
The Ketzin pilot site, west of Berlin, is located in the Northeast German Basin (Fig. 1a). It is the first European onshore pilot scale CO2 storage site. The project commenced in 2004 with the aim to develop an in-situ laboratory for CO2 storage. One injection well and two observation wells were drilled to approximately 800-m depth in the preparatory phase. About 67,000 tons of CO2 were injected into the target saline aquifer at 630 to 650 m depth from June 2008 until August 2013. The reservoir is located in the lithologically heterogeneous 80 m thick Triassic Stuttgart Formation. Various seismic methods, including vertical seismic profiling (VSP), surface seismics, moving source profiling (MSP) and crosswell seismic have been applied to monitor the CO2 migration [11].
At the Ketzin site, reflections in the crossline direction are not horizontally aligned and some dome-shaped structures are observed [11]. Therefore, DMO processing may be required in order to increase the dip bandwidth of the stacked data [9]. Moreover, the lithological heterogeneity leads to rapid velocity changes in some formations. Based on the test by Hale and Artley [10], we can infer that the imaging result using squeezed DMO processing may be better at Ketzin compared to that with constant-velocity DMO processing. In this study, we apply 3D Squeezing DMO to the seismic data from the Ketzin pilot CO2 site after NMO to study the impact of DMO on seismic imaging and to investigate if it enhances the CO2 seismic monitoring technique. We then apply a time-lapse analysis to the 3D seismic data sets and compare the results with and without DMO processing.
2. Data acquisition
Acquisition of the 3D baseline seismic survey with 41 templates was carried out in 2005 to understand the structural geometry within the reservoir, to supply a baseline for time-lapse analysis and to provide detailed subsurface images near the injection borehole for planning the drilling operations [11]. Fig. 1b shows the template geometry of the baseline survey [12]. Inset shows theoretical source (blue) and receiver (red) locations for a single template. The first repeat 3D seismic data were acquired in 2009, when approximately 22,000 tons of CO2 had been injected into the target saline aquifer. In 2012, the second repeat 3D seismic data were acquired when about 61,000 tons of CO2 had been injected. The repeat 3D surveys had the same acquisition parameters [11] and geometry as in the baseline, but with less templates; 20 templates for the first repeat and 31 templates for the second repeat.
Fig. 1. (a) Location of the Ketzin CO2 Storage site in Germany; (b) template geometry used in the data acquisition and locations of source and receiver points for a single template.
Fei Huang et al. / Energy Procedia 59 ( 2014 ) 67 – 74 69
3. Data processing
In order to apply time-lapse analysis in the later stages, the processing workflow (Table 1) for the repeat datasets was nearly the same as the one used for the baseline [11], except for changes in refraction and residual statics due to different ground and weather conditions. The 3D Squeezing DMO method is based on an integral approach and incorporates Hale and Artley’s [10] modifications for variable velocity with time. A time-variant squeeze function which depends on the averages of the velocity function is used to approximately handle depth-variant velocitychanges [10]. After DMO the data are stacked and F-XY deconvolution is applied. Finally, 3D finite-difference migration using the final smoothed NMO velocities is performed for each data set. The most important aspect of the DMO processing is determining the velocity field for the NMO step. This is done by using the initial smoothed velocity field obtained from the conventional velocity analysis before DMO as a first estimate. The data are then input into the DMO process and then inverse NMO is applied. These data are then subjected to a new velocity analysis and the velocity field is updated and used as input for the NMO process. A number of iterations are generally required until the velocity field does not need further updating. Velocities were picked at every 20th CDP in the inline and crossline directions.
Table 1. Processing workflow applied to the 3D data.
1 Read raw SEGD data
2 Vertical diversity stack
3 Bulk static shift to compensate for source delay
4 Extract and apply geometry
5 Trace edit and polarity reversal
6 Pick first breaks
7 Remove 50 Hz noise on selected receiver locations
8 Spherical divergence correction
9 Band-pass filter
10 Surface consistent deconvolution
11 Ground roll mute
12 Spectral equalization
13 Band-pass filter
14 Zero-phase filter
15 Refraction statics
16 Trace balance using data window
17 Velocity analysis
18 Residual statics
19 Normal moveout correction
20 3D Squeezing DMO
21 Inverse NMO
22 Velocity analysis
23 Normal moveout correction
24 Stack
25 Trace balance
26 FX-Decon: inline and crossline directions
27 Trace balance
28 Migration: 3D FD using smoothed stacking velocities
70 Fei Huang et al. / Energy Procedia 59 ( 2014 ) 67 – 74
3.1. Velocity spectrum
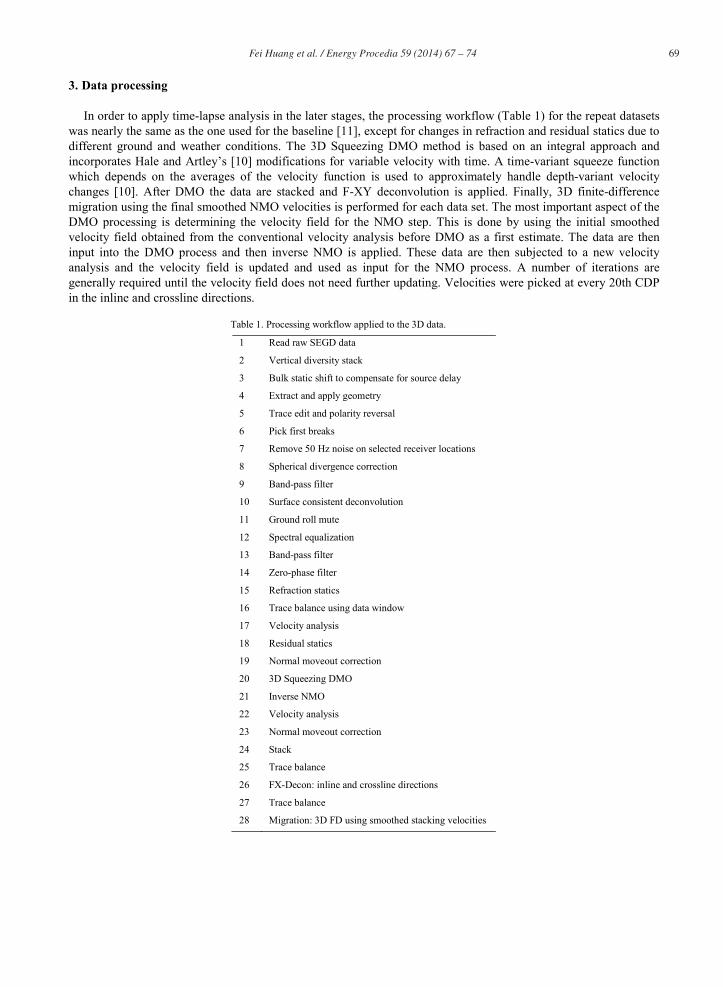
Comparison of the velocity spectra (Fig. 2) without and with DMO processing shows that the velocity trend is improved and the ambiguity in the velocity picks is eliminated after the DMO correction. The improved accuracy of velocity picking makes it easier to interpret the velocity spectrum and obtain the correct interval velocities.
Fig. 2. Velocity spectra for baseline survey (a) without DMO processing; (b) with DMO processing.
3.2. Stacked section
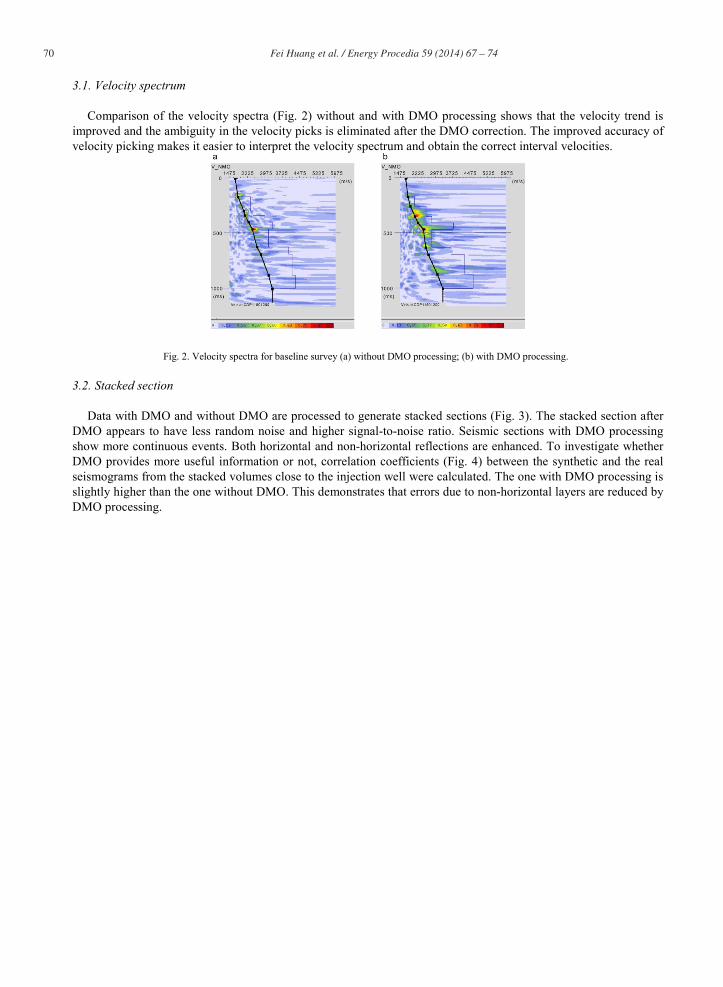
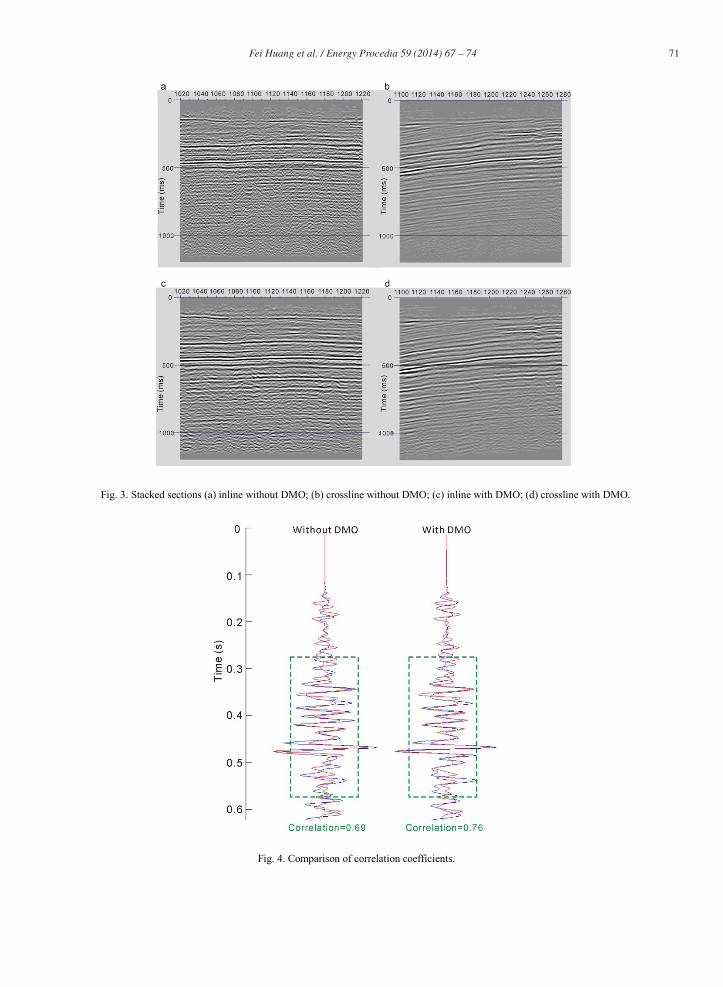
Data with DMO and without DMO are processed to generate stacked sections (Fig. 3). The stacked section after DMO appears to have less random noise and higher signal-to-noise ratio. Seismic sections with DMO processing show more continuous events. Both horizontal and non-horizontal reflections are enhanced. To investigate whether DMO provides more useful information or not, correlation coefficients (Fig. 4) between the synthetic and the real seismograms from the stacked volumes close to the injection well were calculated. The one with DMO processing is slightly higher than the one without DMO. This demonstrates that errors due to non-horizontal layers are reduced by DMO processing.
Fei Huang et al. / Energy Procedia 59 ( 2014 ) 67 – 74 71
Fig. 3. Stacked sections (a) inline without DMO; (b) crossline without DMO; (c) inline with DMO; (d) crossline with DMO.
Fig. 4. Comparison of correlation coefficients.

72 Fei Huang et al. / Energy Procedia 59 ( 2014 ) 67 – 74
3.3. Frequency content
A time-frequency analysis was performed to further compare the improvement of DMO using a 25ms (half-length) Gaussian window acceptable for both resolution of time and frequency. Fig. 5 shows the time-frequency graphs of one trace from the migrated data with and without DMO processing, respectively. After DMO, the energy of the high frequency components has been enhanced and the predominant frequency increases. Moreover, the dominant band is expanded in both the low and high frequency directions, enriching the seismic information of the deeper layers.
Spectral decomposition using a Gabor transform was also carried out to investigate the seismic response of various frequency components (Fig. 6).
It can be seen that more high-energy low-frequency reflections are observed in the section with DMO processing. In addition, frequency slices with DMO processing exhibit more detail and higher resolution. Thus, we conclude that DMO should help to better identify CO2 reservoirs and monitor them.
4. Time-lapse results
Previous time-lapse processing of the baseline and repeat 3D datasets imaged a CO2 induced change of reflection amplitude at the injection well [13,14,15]. We now apply a time-lapse analysis to the 3D seismic data sets and compare the results with and without DMO processing.
Although the baseline and repeat data are processed in almost the same manner, some differences in time shifts, phase, frequency and amplitude remain, probably related to variations in the natural environmental conditions, imperfect repetition of the survey geometry, non-repeatable ambient noise and other factors [16]. Therefore, in the time-lapse processing, the baseline survey is used as a reference volume, and the repeat surveys are cross-calibrated to attenuate artifacts by applying a series of cross-matching procedures. After processing, the differences between the time-lapse seismic images should mainly represent changes in the reservoir properties.
Fig. 5. Time-frequency map (a) without DMO; (b) with DMO.

Fei Huang et al. / Energy Procedia 59 ( 2014 ) 67 – 74 73
Fig. 6. Comparison of frequency slices. (a), (b), (c) are single-frequency sections without DMO at 10 Hz, 35Hz and 50Hz, respectively; (d), (e), (f) are single-frequency sections with DMO at 10 Hz, 35Hz and 50Hz, respectively.
Fig. 7. Amplitude differences for first (top) and second (bottom) repeat surveys. (a), (c) without DMO; (b), (d) with DMO.

74 Fei Huang et al. / Energy Procedia 59 ( 2014 ) 67 – 74
Comparison of the amplitude difference horizons at the reservoir level (Fig. 7) shows that the shape of the observed anomaly and its westward propagating tendency in the repeat data with DMO processing are similar to those observed in the data without DMO processing [14,15]. However, the amplitude anomalies of the repeat surveys with DMO are stronger than those without DMO, especially in the vicinity of the injection well.
5. Conclusion
The DMO correction yields a better velocity spectrum with a better defined stacking trend. DMO suppresses the noise caused by the dips to a greater extent and thus the signal-to-noise ratio and correlation coefficients between the synthetic and the real seismograms, as well as the continuity of the reflections, are enhanced. After DMO, the energy of the low and high frequency components has been enhanced and the predominant frequency increases. The details of low-frequency events are clearer as shown by the spectral decomposition analysis. Time-lapse results with DMO processing show stronger amplitude anomalies, supporting a preferred westward trend of the CO2 migration. Our results show that DMO is an effective method for improving the quality of seismic imaging and enhancing the CO2 seismic monitoring technique at the Ketzin site.
Acknowledgements
Part of this work was conducted within the CO2MAN collaborative project that facilitated research and development work at the Ketzin pilot site and was supported by the German Federal Ministry for Education and Research and the industry partners VNG, RWE Power AG, Vattenfall, Statoil Petroleum AS, Dillinger Hüttenwerke, Saarstahl AG and OMV Exploration and Production GmbH. GLOBE ClaritasTM under license from the Institute of Geological and Nuclear Sciences Limited, Lower Hutt, New Zealand was used to process the seismic data. Hampson and Russell (CGG Veritas) provided Pro4D for the time lapse analysis.
References
[1] Hale D. Dip-moveout by Fourier transform. Geophys 1984;49:741-757.[2] Lynn W, Gonzalez A, MacKay S. Where are the fault-plane reflections?. 61st Ann Internat Mtg: Soc Expl Geophys 1991;1151-1154.[3] Black JL, Cornish BE, Dingwall KA, Gerhardstein AC, Meinardus HA. Velocity refinement for accurate migration. 55th Ann Internat Mtg:
Soc Expl Geophys 1985.[4] Hale D. Dip moveout processing course notes. SEG Continuing Education: Soc Expl Geophys 1988.[5] Artley C. Dip-moveout processing for depth-variable velocity. 61st Ann Internat Mtg: Soc Expl Geophys 1991.[6] Meinardus HA, Schleicher K. 3-D time-variant dip-moveout by the FK method. 61st Ann Internat Mtg: Soc Expl Geophys 1991;1208-1210.[7] Witte D. Dip moveout in vertically varying media. 61st Ann Internat Mtg: Soc Expl Geophys 1991;1181-1183.[8] Bolondi G, Rocca F. Normal moveout correction, offset continuation and prestack partial migration compared as prestack processes: Elsevier
Applied Science 1985.[9] Deregowski SM. An integral implementation of dip moveout. Geophys Trans of Geophys Inst of Hungary 1987;33:11-22.[10] Hale D, Artley C. Squeezing dip moveout for depth-variable velocity. Geophys; 1993;58(2):257-264.[11] Juhlin C, Giese R, Zinck-Jørgensen K, Cosma C, Kazemeini H, Juhojuntti N, Lüth S, Norden B, Förster A. 3D baseline seismics at Ketzin,
Germany: the CO2SINK project. Geophys 2007;72:B121–B132.[12] Yang C. Time-lapse analysis of borehole and surface seismic data, and reservoir characterization of the Ketzin CO2 storage site, Germany.
Ph.D. Dissertation, Uppsala University; 2012. [13] Ivandic M, Yang C, Lüth S, Cosma C, Juhlin C. Time-lapse analysis of sparse 3D seismic data from the CO2 storage pilot site at Ketzin,
Germany. J Appl Geophys 2012;84:14-28.[14] Ivanova A, Kashubin A, Juhojuntti N, Kummerow J, Henninges J, Juhlin C, Lüth S, Ivandic M. Monitoring and volumetric estimation of
injected CO2 using 4D seismic, petrophysical data, core measurements and well logging: a case study at Ketzin, Germany. Geophys Prospect2012;60(5):957-973.
[15] Ivandic M, Juhlin C, Lüth S, Bergmann P, Kashubin A. Geophysical monitoring of CO2 at the Ketzin storage site - the results of the second 3D repeat seismic survey. 75th EAGE Conference & Exhibition Incorporating SPE EUROPEC 2013.
[16] Ayeni G. Time-lapse seismic imaging by linearized joint inversion. Ph.D. Dissertation, Stanford University; 2012.