Embed Size (px)
Citation preview

Impact of Changing the Maximum Out-of-Pocket Amounts for
Qualified Health Plans and Stand Alone Dental Plans
REPORT
PREPARED FOR
NORC AND THE CENTER FOR CONSUMER
INFORMATION AND INSURANCE OVERSIGHT (CCIIO)
BY
JULIE PEPER, FSA, MAAA KARAN RUSTAGI, ASA, MAAA STEVE WESSLING, ASA, MAAA
JOHN EBELING
AUGUST 26, 2013
Impact of Changing the Maximum Out-of-Pocket Amounts
August 26, 2013 Page 2
I. Background
The Affordable Care Act (ACA) restricts the maximum out-of-pocket (MOOP) payment for Essential
Health Benefits (EHB) to $6,350 for an individual in 2014. Essential Health Benefits cover pediatric dental
services, which can be offered as a stand-alone dental product (SADP) or as part of a qualified health
plan (QHP) benefit package. When offered as part of a QHP, the consumer will have a total MOOP of
$6,350. When offered as a SADP, the SADP is permitted to have a MOOP of up to $700, resulting in a
total MOOP for the consumer in excess of the $6,350 level in the QHP, up to $7,050. The Center for
Consumer Information and Insurance Oversight (CCIIO) is exploring policies to coordinate MOOPs
between the QHPs and SADPs to remove the discrepancy in total MOOP experienced or perceived by
the consumer. One method of removing this discrepancy is to lower the MOOP on QHPs and/or SADPs
such that the total MOOP for QHPs and SADPs is $6,350.
Wakely Consulting Group, in partnership with NORC at the University of Chicago, was retained by CCIIO
to report on the plan design impacts needed to keep the actuarial value (AV) constant as the MOOP is
varied. MOOP changes were modeled on both the QHPs and the SADPs. One method of removing the
discrepancy is to lower the MOOP on QHPs or SADPs such that the total MOOP for QHPs and SADPs is
$6,350. Wakely determined the change in cost if it is not possible to keep the actuarial value the same
with reasonable plan design changes. Throughout this report, reasonable plan design changes are those
that we would expect a typical consumer to find acceptable. The primary approach to determining
consumer acceptability was based on the plan designs currently available in the dental insurance
market.
II. Executive Summary
To address questions about the interplay of MOOPs for QHPs and SADPs, Wakely has analyzed the
impact of changes in MOOPs on QHPs with SADPs. Individual and Small Group products must meet
certain AVC requirements, essentially being within two percentage points of the requirements at each
metal tier level (60%, 70%, 80% or 90%). Further, any net changes in AV cause the premiums to change
since changes in AV affect the expected cost of a plan. Therefore, any changes in MOOP would need to
be offset by changing other cost sharing features to continue to meet the required AV levels and not
cause premiums to change. Wakely tested several sample starting plan designs to inform the decision of
how much the MOOP can be varied and the corresponding cost sharing changes required.
For SADPs, Wakely tested four plans, two with an actuarial value around 85% and two with an actuarial
value around 70%. Each plan design started with a MOOP of $700. The analysis modeled decreasing
MOOPs down to $100 in $100 increments and increasing MOOPs up to $1,000 in $100 increments.
For QHPS, Wakely used four plans, two with an actuarial value around 70% (silver metal level) and two
with an actuarial value around 60% (bronze metal level). At each actuarial value level, the two plans

Impact of Changing the Maximum Out-of-Pocket Amounts
August 26, 2013 Page 3
included a deductible plan and a High Deductible Health Plan (HDHP)1. Each plan design started with a
MOOP of $6,350. The analysis modeled decreasing MOOPs down to $5,350 in $100 increments.
For both SADPs and QHPs, Wakely identified the simplest offsetting changes in other cost sharing
elements that kept the actuarial value the same at each MOOP level. The most important conclusion
from our analysis is that MOOPs on both the medical QHPs and SADPs can mostly be varied with
reasonable and offsetting cost sharing changes. Reasonability of cost sharing is determined based on
the levels currently available in the market. For example, cost sharing that exceeds 50% of the cost of
the service was considered unreasonable. Throughout this document, we use the term ‘unreasonable
cost sharing’ if the level of cost sharing is rarely seen in the market.
For a SADP with a 70% actuarial value, we found that the MOOP can be increased from the standard
$700 up to $1,000. To offset the reduction in actuarial value, the deductible needs to be reduced from
$150 to $110 without any other changes to the plan designs. There is limited room to decrease the
MOOP without increasing cost sharing to unreasonable or nearly unreasonable levels. Unreasonable
cost sharing includes cost sharing that is more than 50% of the average cost of the service. The SADP
MOOP can be decreased from $700 to $400 with a corresponding increase in deductible from $150 to
$300. Any additional reductions in MOOP cannot be absorbed by reasonable changes to plan designs.
For the QHPs, the MOOP can be reduced from the highest 2014 allowable limit of $6,350 down to
$5,350 without requiring unreasonable plan design changes, which means that premium increases are
not necessary. This observation was true for all four sample plans we tested. Further reductions in
MOOP could be made for Silver plans without requiring unreasonable plan design changes. However,
MOOP could not be reduced to much less than $5,350 without requiring unreasonable plan design
changes for Bronze plans.
Wakely also looked at whether the cost sharing changes would impact premiums due to induced
demand. That is, we estimated whether members would be likely to use more services given the
resulting cost sharing at each MOOP level. For QHPs, the change in MOOP resulted in a modest AV
change. It is not expected that QHPs would see a significant increase in induced demand based on the
resulting cost sharing changes. For SADPs, there is a significant change in AV, particularly at the lower
MOOP levels. Significant induced demand is possible at these lower levels, increasing premiums.
We would expect lower MOOPs and higher copays, deductibles or coinsurance to generally be more
appealing to sicker individuals. Therefore, we believe it is reasonable to assume that lowering the
MOOP would increase average morbidity and therefore average cost. However, the effect may not be
material depending on how significant the plan design changes are.
Our analysis was based on the Federal Actuarial Value Calculator (AVC), the Wakely pricing model,
information and guidance provided by CCIIO, the Towers Watson Dental pricing model, and actuarial
judgment. Actual results will likely vary from our estimates. Our analysis was limited because we used
1 Deductible plans are more common and popular in the market than HDHPs, but deductible plans are also more
difficult to model for our analysis.

Impact of Changing the Maximum Out-of-Pocket Amounts
August 26, 2013 Page 4
pricing models that employ distributions for average members (or average adults), rather than actual
detailed claims.2 Our analysis was designed for purposes of assisting CCIIO with making general
decisions. If CCIIO decides to move forward with changes in maximum allowable MOOPs and
integration between medical and SADP MOOPs, we recommend further analysis and refinement of our
estimates.
III. Task 1a: Impact of MOOP on Stand-Alone Dental Plans
Wakely created four stand-alone dental plan designs to estimate the impact on plan designs of changing
the MOOP at various levels. All the MOOP and deductible levels shown in this analysis are at the
member level as opposed to the family level. The analysis shows the actuarial value impact of changing
the MOOP and then outlines the required cost sharing changes for the actuarial value (AV) to remain in
line with the original plan. Four plan designs were created; two at the 70% AV level and two at the 85%
AV level.
The coinsurance and deductible levels in the plans are similar in design to plans that are currently in the
marketplace. One relatively minor simplification in the design is that the deductible in these sample
plans applies to all services, whereas many plans in the marketplace do not apply the deductible to
preventive services, particularly at the 85% AV level. Table 1 displays the high level plan design features
and resulting AV of each of the four plans. The ‘Deductible’ and ‘MOOP’ rows show the deductible and
maximum out-of-pocket applicable to dental benefits only. The next four rows show the applicable
coinsurance to various broad service categories. The ‘Effective Coinsurance’ rows shows a weighted
average coinsurance across all four service categories for a nationwide average pediatric population.
The ‘Target AV’ row shows the actuarial value that we were targeting when selecting the benefit design.
The ‘Actual AV’ shows the actuarial value of the plan design we selected. The difference in target and
actual AV is a result of not selecting accurate but odd cost sharing features such as a deductible of
$148.50 on the ‘70% Plan 1’. These two rows show that our plan designs were actuarially equivalent to
the targeted plan actuarial values.
2 Detailed claims for a representative population under similar programs and circumstances were not available.
High quality and representative data will likely only become available when 2014 experience under the ACA
reforms becomes available.

Impact of Changing the Maximum Out-of-Pocket Amounts
August 26, 2013 Page 5
Table 1: Plan Designs
Plan 70% Plan 1 70% Plan 2 85% Plan 1 85% Plan 2
Deductible $150 $100 $0 $25
MOOP $700 $700 $700 $700
Class 1 Preventive and Diagnostic 0% 0% 0% 0%
Class 2 Basic 40% 50% 15% 10%
Class 3 Major 50% 60% 40% 40%
Medically Necessary Ortho 50% 70% 50% 40%
Effective Coinsurance 28% 36% 19% 15%
Target AV 70.0% 70.0% 85.0% 85.0%
Actual AV 70.5% 70.5% 84.9% 85.5%
For each plan, a $700 MOOP was used as the starting point. Wakely estimated the effect on the
actuarial value from changing the MOOP in $100 increments from $100 to $1,000. The deductible or
coinsurance was then adjusted to offset the impact of the MOOP change and to create a plan with an
actuarial value equal to the starting plan.
Table 2 below shows the changes in MOOP for the 70% Plan 1, the resulting actuarial value after the
MOOP changes, the change in cost sharing necessary to offset the actuarial value from the MOOP
change, and the final actuarial value after all cost sharing changes. The table shows every other MOOP
change (every $100) and the effective coinsurance over all service categories. In each table below, the
first row shows how the MOOP changes compared to the Original plan (MOOP of $700), the second row
lists out the revised MOOP (Original plus change shown in first row). The Actuarial Value with MOOP
changes shows what the actuarial value of the plan would be without any changes to other cost sharing
elements. The ‘Cost Impact with MOOP changes’ row shows the estimated change in plan cost due to
the change in MOOP compared to the original plan. The next row shows what changes to other cost
sharing elements were made (deductible and coinsurance). The effective coinsurance is the weighted
average cost sharing. The cost impact estimates what the net effect of the MOOP and cost sharing
changes are (targeting 0% but not always possible). The Additional Costs for Induced Demand estimates
the effect of the cost sharing changes on overall costs due to changes in utilization.
The full details are included in Appendix A.
Table 2: Impact of MOOP Changes for 70% Plan 1
MOOP MOOP MOOP Original MOOP MOOP MOOP MOOP MOOP MOOP
↑ 300 ↑ 200 ↑ 100 70% Plan ↓ 100 ↓ 200 ↓ 300 ↓ 400 ↓ 500 ↓ 600
Revised MOOP $1,000 $900 $800 $700 $600 $500 $400 $300 $200 $100
Actuarial Value with MOOP changes 68% 69% 70% 71% 72% 73% 75% 77% 81% 90%
Cost Impact with MOOP changes -4% -3% -1% 0% 2% 3% 6% 9% 16% 28%
Offsetting Benefit Change
Deductible $110 $120 $135 $150 $170 $195 $240 $300 $200 $100
Effective Coinsurance 28% 28% 28% 28% 28% 28% 28% 0% 0% 0%
Actuarial Value with Offsetting Changes 70% 71% 70% 71% 70% 71% 70% 73% 81% 90%
Cost Impact 0% 0% 0% 0% 0% 0% 0% 4% 15% 28%
Additional Costs for Induced Demand -1% -1% 0% 0% 0% 1% 2% 19% 22% 29%

Impact of Changing the Maximum Out-of-Pocket Amounts
August 26, 2013 Page 6
The table above shows that for each $100 increase in MOOP (starting at $700) the deductible needs to
be lowered by $10-15 to offset the increase in actuarial value. For every $100 reduction in MOOP, the
deductible has to be increased by $20-60 to keep the actuarial value constant. In the lower MOOP
values (such as MOOPs of $100-300), the deductible could not be raised high enough to achieve an
actuarial value similar to the original plan. In fact, for MOOPs below $400, the deductible had to be
reduced to match the MOOP. It does not make sense to have a MOOP greater than the deductible. Also,
the coinsurance level becomes irrelevant when deductible matches out-of-pocket maximum and so we
set it to 0% at lower MOOPs. Having a MOOP of $300 or less on dental will result in a significant increase
in cost for the SADP since the resulting AV is higher than the original. For example, a MOOP of $100 will
increase plan cost by 28% since the resulting AV of 90% is 28% higher than the original AV of 70%.
In addition to the cost impact due to higher AVs, induced demand is expected to increase costs further
at the lower MOOP levels, with costs increasing up to an additional 29% at the lowest MOOP level. For
example, in the scenario above where the MOOP and the deductible are both equal to $100, we expect
members to hit that MOOP during their first routine visit to the dentist. Beyond the first visit, the
members would not be required to pay anything out of pocket for dental services. From the plan’s
perspective, the only remaining checks and balances to reduce superfluous care would be any limits on
services such as a maximum of two annual routine dental checkups. Since these service limits do not
exist on all types of dental services, we believe a low cost sharing would induce additional demand for
dental services to increase plan costs by as much as 29% when the MOOP is $100 compared to a MOOP
of $700.
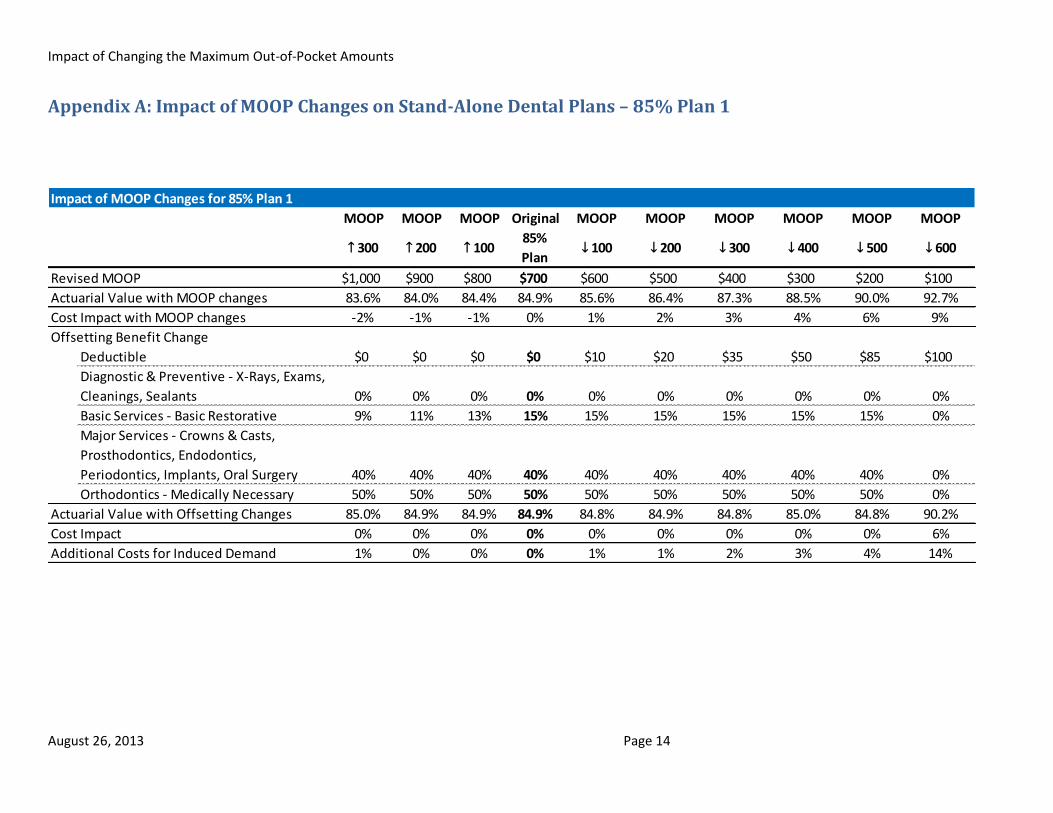
Table 3 below shows similar details as Table 2, but for the 85% Plan 1. The full details of all cost sharing
and changes are shown in Appendix A.
The first 85% actuarial value plan started with no deductible so the only cost sharing that could be
reduced to offset the rise in MOOP was coinsurance. The table above shows the changes in effective
coinsurance that were required to offset the MOOP increases3. When the MOOP was lowered, the
deductible was increased to keep the actuarial value constant. When the MOOP was lowered to $100,
even with the deductible at $100, the actuarial value was still 90%, which means that plan cost would
increase at that low of a MOOP level. Our calculations show that the cost impact would be 6% increase
3 At the higher MOOP levels, increases in MOOP do not change the actuarial value materially because the
continuance curves indicate very few people have costs in excess of the associated levels.
Table 3: Impact of MOOP Changes for 85% Plan 1
MOOP MOOP MOOP Original MOOP MOOP MOOP MOOP MOOP MOOP
↑ 300 ↑ 200 ↑ 100 85% Plan ↓ 100 ↓ 200 ↓ 300 ↓ 400 ↓ 500 ↓ 600
Revised MOOP $1,000 $900 $800 $700 $600 $500 $400 $300 $200 $100
Actuarial Value with MOOP changes 84% 84% 84% 85% 86% 86% 87% 88% 90% 93%
Cost Impact with MOOP changes -2% -1% -1% 0% 1% 2% 3% 4% 6% 9%
Offsetting Benefit Change
Deductible $0 $0 $0 $0 $10 $20 $35 $50 $85 $100
Effective Coinsurance 16% 17% 18% 19% 19% 19% 19% 19% 19% 0%
Actuarial Value with Offsetting Changes 85% 85% 85% 85% 85% 85% 85% 85% 85% 90%
Cost Impact 0% 0% 0% 0% 0% 0% 0% 0% 0% 6%
Additional Costs for Induced Demand 1% 0% 0% 0% 1% 1% 2% 3% 4% 14%

Impact of Changing the Maximum Out-of-Pocket Amounts
August 26, 2013 Page 7
in premiums for a MOOP of $100 compared to the original plan. Similar to the 70% Plan 1, induced
demand is expected to increase costs further at the lower MOOP levels, with costs increasing up to an
additional 14% at the lowest MOOP level.
Similar changes were made with the second 70% and 85% actuarial value plans. The summary results for
these plans are shown below in Tables 4 and 5. The full details of all example plans are shown in
Appendix A.
The above analysis shows that for most of the scenarios where MOOP was changed, no cost or premium
increases need to be made to offset these changes. The increases in actuarial value due to lower MOOP
can usually be offset by reducing other cost sharing such as deductibles and coinsurances. However,
there were several cases at the very extreme levels of MOOP where changes in premium would be
needed since it is not possible to keep the same AV as the base plan with reasonable cost sharing
changes. In addition to the higher AVs, many of the plans at lower MOOP levels may also see a
significant increase in cost due to induced demand.
The impact of induced demand is based on a combination of the Federal QHP induced demand factors,
the Towers Watson Dental pricing model, and actuarial judgment. Actual member behavior is difficult
to predict given that these plan designs are not in the market today and studying induced demand is
difficult because of confounding variables. In particular, the current dental products do not include
MOOPs but rather use annual benefit maximums. The induced demand factors should be used as a
general indication of how member behavior may change rather than a reliable prediction based on any
historical data. Wakely does expect that induced demand for dental will be more sensitive to cost
sharing levels than for medical services.
Table 4: Impact of MOOP Changes for 70% Plan 2
MOOP MOOP MOOP Original MOOP MOOP MOOP MOOP MOOP MOOP
↑ 300 ↑ 200 ↑ 100 70% Plan ↓ 100 ↓ 200 ↓ 300 ↓ 400 ↓ 500 ↓ 600
Revised MOOP $1,000 $900 $800 $700 $600 $500 $400 $300 $200 $100
Actuarial Value with MOOP changes 67% 68% 69% 71% 72% 73% 75% 78% 82% 90%
Cost Impact with MOOP changes -4% -3% -2% 0% 2% 4% 7% 11% 17% 28%
Offsetting Benefit Change
Deductible $48 $62 $80 $100 $125 $160 $220 $300 $200 $100
Effective Coinsurance 36% 36% 36% 36% 36% 36% 36% 0% 0% 0%
Actuarial Value with Offsetting Changes 70% 70% 71% 71% 71% 70% 70% 73% 81% 90%
Cost Impact 0% 0% 0% 0% 0% 0% 0% 4% 15% 28%
Additional Costs for Induced Demand -1% -1% 0% 0% 0% 1% 2% 19% 22% 28%
Table 5: Impact of MOOP Changes for 85% Plan 2
MOOP MOOP MOOP Original MOOP MOOP MOOP MOOP MOOP MOOP
↑ 300 ↑ 200 ↑ 100 85% Plan ↓ 100 ↓ 200 ↓ 300 ↓ 400 ↓ 500 ↓ 600
Revised MOOP $1,000 $900 $800 $700 $600 $500 $400 $300 $200 $100
Actuarial Value with MOOP changes 84% 85% 85% 85% 86% 87% 87% 88% 90% 92%
Cost Impact with MOOP changes -1% -1% 0% 0% 1% 1% 2% 3% 5% 8%
Offsetting Benefit Change
Deductible $10 $15 $20 $25 $30 $40 $50 $65 $90 $100
Effective Coinsurance 14% 14% 14% 14% 14% 14% 14% 14% 14% 0%
Actuarial Value with Offsetting Changes 86% 86% 85% 85% 86% 85% 85% 85% 85% 90%
Cost Impact 0% 0% 0% 0% 0% 0% 0% 0% 0% 6%
Additional Costs for Induced Demand -1% -1% 0% 0% 0% 1% 1% 2% 3% 11%

Impact of Changing the Maximum Out-of-Pocket Amounts
August 26, 2013 Page 8
Wakely also explored the potential impact of adverse selection on AVs and resulting plan designs
included in this analysis. Selection may exist in SADPs since it is not a requirement that the benefit must
be purchased for the pediatric population. Therefore it is possible that the SADPs will only be purchased
for children who are expected to incur higher than average dental costs. Adjusting the MOOPs for the
SADP may further impact selection. If there is significant selection, the result is that the AVs for the plan
designs used in this analysis would be higher than currently projected. This would require the starting
plan designs to be adjusted to provide less rich cost sharing. The remainder of the analysis in this
report, particularly the relationship of plan design and cost to MOOP changes, would remain largely the
same.
IV. Task 1b: Impact of MOOP on Qualified Health Plans
Wakely developed four sample plan designs to illustrate the impact of changing MOOP on actuarial
values and the offsetting plan design changes required to return the actuarial value to the original value.
A deductible plan at the Silver level (actuarial value of 70%)
An HDHP at the Silver level
A deductible plan at the Bronze level (actuarial value of 60%)
An HDHP at the Bronze level
The deductible plans are hybrid plans with copays on office visits and generic drugs, and
deductible/coinsurance on all other benefits. These plans are representative of popular plans in the
market place. However, mixing copays on some services and deductibles on others creates some issues
with actuarial value calculations in the Federal Actuarial Value Calculator4 and it is also difficult to
conceptualize the impact of changing the MOOP. Therefore, we included an HDHP plan at each metallic
level which contains a simpler plan design consisting of deductible and coinsurance on all services
(except preventive services as required by the ACA).
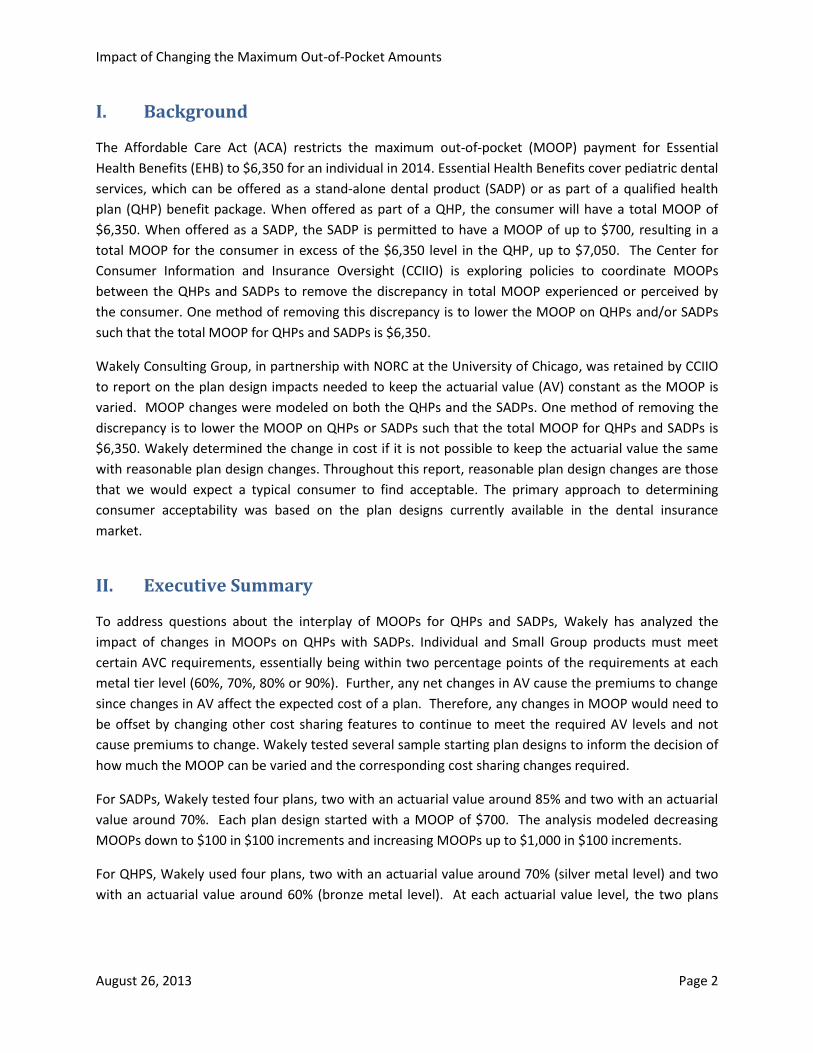
Table 6 below shows the plan designs selected for our analysis.
4 The Federal Actuarial Value Calculator does not always produce expected results. For example, an increase in the
deductible would be expected to lower the AV, all else equal. For deductible plans with higher deductible
amounts, the converse occurs.
Impact of Changing the Maximum Out-of-Pocket Amounts
August 26, 2013 Page 9
For each of these plans, we reduced the MOOP by $100 and noted the increased actuarial value of the plan. We then increased either the deductible or the coinsurance to offset the increase in actuarial value. We used the Federal AVC to estimate the actuarial values. Since the Federal actuarial value calculator has limitations, we supplemented it where necessary with the Wakely pricing model. For the HDHP plans, the Wakely AV estimates lined up closely with the Federal AV estimates. For the deductible plans, the Federal AVC produced unreasonable results at some deductible levels. That is, the mathematical relationships between deductible and actuarial value did not hold when they should have. Therefore, we needed to supplement the actuarial values with estimates from the Wakely model as described below. Table 7 below shows the relationships between the changes in MOOP, the actuarial value of the plan, and how much of the change in actuarial value can be offset by changing benefit design for a Silver HDHP plan. The first row shows the MOOP in increments of $100 from the maximum MOOP of $6,350 down to $5,350. The second row shows the resulting actuarial value after the MOOP reductions. The third row shows the increase in deductible required to offset the increase in actuarial value. The last row shows the final actuarial value with all the offsetting cost sharing factored in. The full details of all cost sharing are shown in Appendix B.
Table 6: Plan Designs
Silver Silver Bronze Bronze
Deductible HDHP Deductible HDHP
MOOP (Medical + Rx combined) $6,350 $6,350 $6,350 $6,350
Medical Benefits
Deductible $1,900 $1,550 $3,000 $2,500
Deductible WaivedPreventive and
Office VisitsPreventive Preventive Preventive
Office Visits - PCP $35 20% $60 50%
Office Visits - Specialist $60 20% $100 50%
Mental Health and Substance Abuse $35 20% $60 50%
Preventive 0% 0% 0% 0%
All other medical services 30% 20% 50% 50%
Drug Benefits
Deductible $100 Integrated with
medical deductible$200
Integrated with
medical deductible
Deductible WaivedGenerics and
Preferred BrandN/A N/A N/A
Generics $15 $10 $20 $12
Preferred Brand $40 $40 $80 50%
Non-Preferred Brand 50% 50% 50% 50%
Specialty 50% 50% 50% 50%
Target AV 70.0% 70.0% 60.0% 60.0%
Actual AV 70.3% 70.2% 61.0% 61.8%
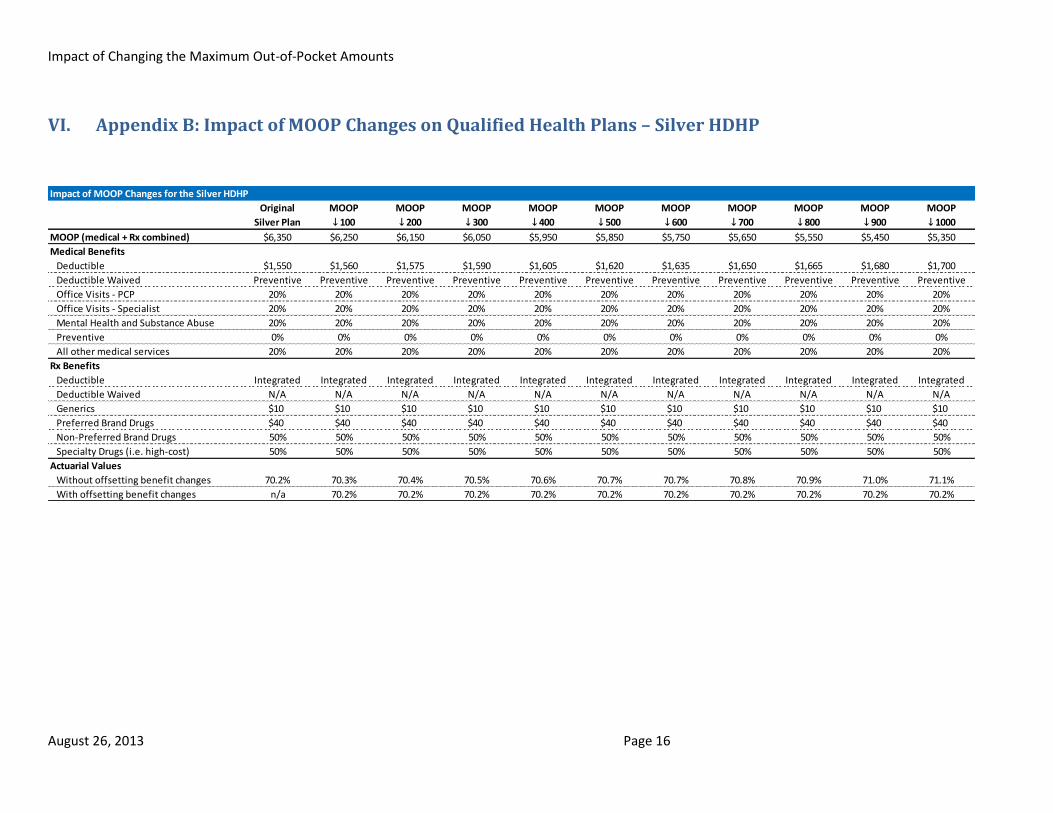
Table 7: Impact of MOOP Changes for the Silver HDHP Plan
Original MOOP MOOP MOOP MOOP MOOP MOOP MOOP MOOP MOOP MOOP
Silver Plan ↓ 100 ↓ 200 ↓ 300 ↓ 400 ↓ 500 ↓ 600 ↓ 700 ↓ 800 ↓ 900 ↓ 1000
Revised MOOP $6,350 $6,250 $6,150 $6,050 $5,950 $5,850 $5,750 $5,650 $5,550 $5,450 $5,350
Actuarial Value with
MOOP changes70.2% 70.3% 70.4% 70.5% 70.6% 70.7% 70.7% 70.8% 70.9% 71.0% 71.1%
Offsetting Benefit
Change (Deductible)$1,550 $1,560 $1,575 $1,590 $1,605 $1,620 $1,635 $1,650 $1,665 $1,680 $1,700
Actuarial Value with
Offsetting Changen/a 70.2% 70.2% 70.2% 70.2% 70.2% 70.2% 70.2% 70.2% 70.2% 70.2%
Impact of Changing the Maximum Out-of-Pocket Amounts
August 26, 2013 Page 10
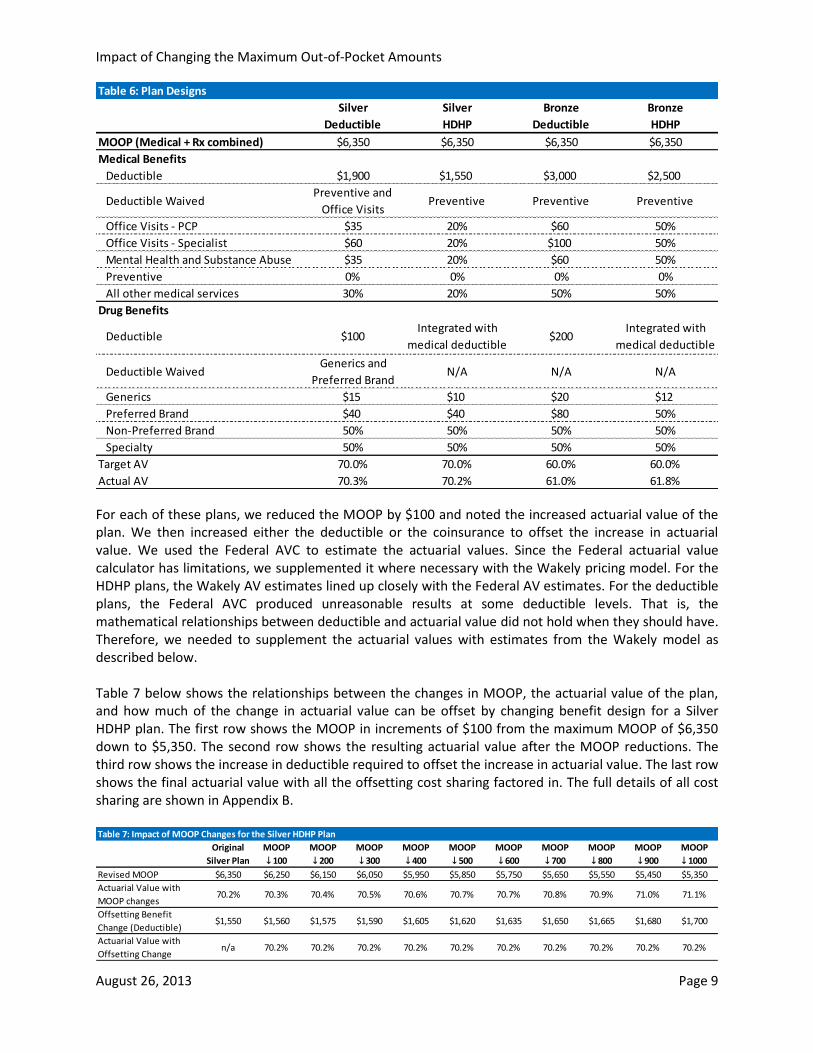
The table above shows that for every $100 reduction in MOOP, the deductible needed to be increased
by $15-20 to fully offset the increase in actuarial value from reducing the MOOP. Since the MOOP
reductions can be fully offset by increasing the deductible, there is no cost impact for any of the MOOP
levels. Also, since the maximum change in AV is approximately 1%, it is not expected that there would
be a significant impact due to induced demand.
Table 8 below shows similar details as Table 7 but for a Bronze HDHP plan. The full details of all cost sharing are shown in Appendix B.
The table above shows that for every $100 reduction in MOOP, the deductible needed to be increased by over $100 at higher MOOP levels to offset the increase in actuarial value. For lower MOOPs, the magnitude of the needed deductible change increased, up to $1,000. Table 9 below shows the same summary for the Silver Deductible plan. The full details of all cost sharing
are shown in Appendix B.
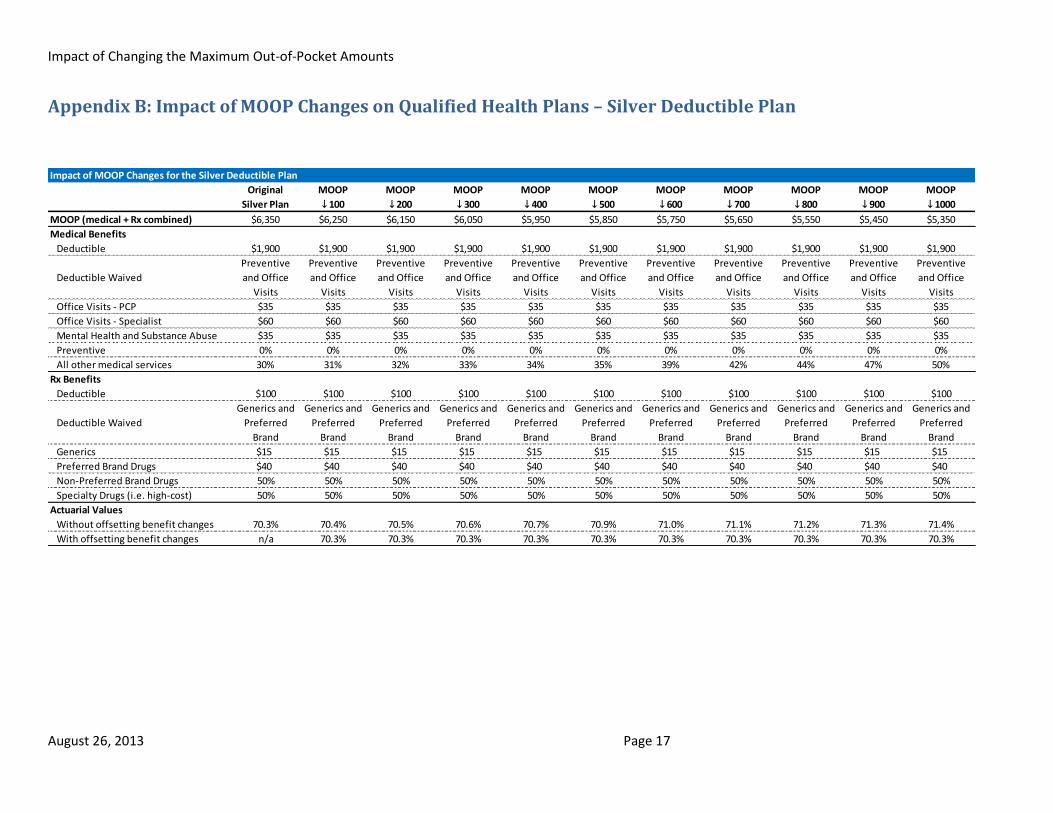
The table above shows that for every $100 reduction in MOOP, the coinsurance needed to be increased
by one to three percentage points. For these sample plan designs, the deductible on the original plan
was already at the maximum allowable level ($2,000 for small group market under ACA) so coinsurance
was adjusted.
The table 10 below shows the results summary for the Bronze deductible plan. The full details of all cost
sharing are shown in Appendix B.
Table 8: Impact of MOOP Changes for the Bronze HDHP Plan
Original MOOP MOOP MOOP MOOP MOOP MOOP MOOP MOOP MOOP MOOP
Bronze Plan ↓ 100 ↓ 200 ↓ 300 ↓ 400 ↓ 500 ↓ 600 ↓ 700 ↓ 800 ↓ 900 ↓ 1000
Revised MOOP $6,350 $6,250 $6,150 $6,050 $5,950 $5,850 $5,750 $5,650 $5,550 $5,450 $5,350
Actuarial Value with
MOOP changes61.8% 62.0% 62.2% 62.5% 62.7% 63.0% 63.3% 63.5% 63.8% 64.0% 64.3%
Offsetting Benefit
Change (Deductible)$2,500 $2,620 $2,780 $2,920 $3,050 $3,250 $3,400 $3,600 $3,900 $4,300 $5,250
Actuarial Value with
Offsetting Changen/a 61.8% 61.7% 61.7% 61.8% 61.7% 61.8% 61.7% 61.8% 61.8% 61.8%
Table 9: Impact of MOOP Changes for the Silver Deductible Plan
Original MOOP MOOP MOOP MOOP MOOP MOOP MOOP MOOP MOOP MOOP
Silver Plan ↓ 100 ↓ 200 ↓ 300 ↓ 400 ↓ 500 ↓ 600 ↓ 700 ↓ 800 ↓ 900 ↓ 1000
Revised MOOP $6,350 $6,250 $6,150 $6,050 $5,950 $5,850 $5,750 $5,650 $5,550 $5,450 $5,350
Actuarial Value with
MOOP changes70.3% 70.4% 70.5% 70.6% 70.7% 70.9% 71.0% 71.1% 71.2% 71.3% 71.4%
Offsetting Benefit
Change (Coinsurance)30% 31% 32% 33% 34% 35% 39% 42% 44% 47% 50%
Actuarial Value with
Offsetting Changen/a 70.3% 70.3% 70.3% 70.3% 70.3% 70.3% 70.3% 70.3% 70.3% 70.3%
Impact of Changing the Maximum Out-of-Pocket Amounts
August 26, 2013 Page 11
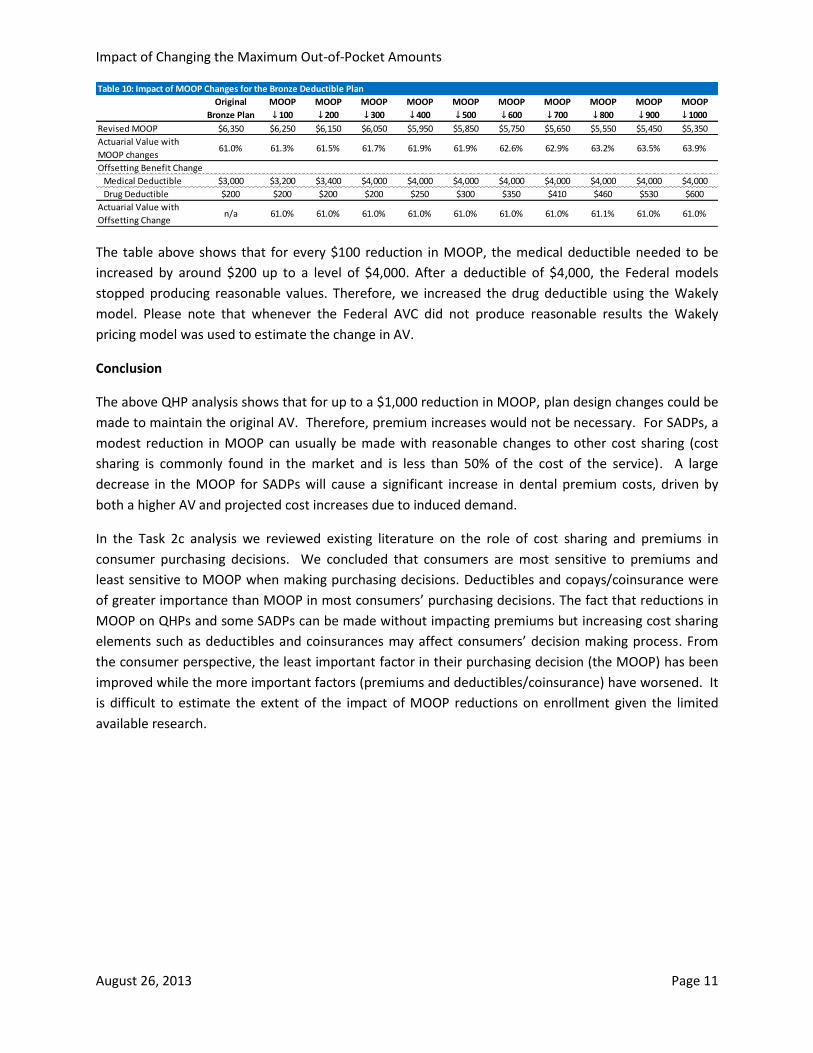
The table above shows that for every $100 reduction in MOOP, the medical deductible needed to be
increased by around $200 up to a level of $4,000. After a deductible of $4,000, the Federal models
stopped producing reasonable values. Therefore, we increased the drug deductible using the Wakely
model. Please note that whenever the Federal AVC did not produce reasonable results the Wakely
pricing model was used to estimate the change in AV.
Conclusion
The above QHP analysis shows that for up to a $1,000 reduction in MOOP, plan design changes could be
made to maintain the original AV. Therefore, premium increases would not be necessary. For SADPs, a
modest reduction in MOOP can usually be made with reasonable changes to other cost sharing (cost
sharing is commonly found in the market and is less than 50% of the cost of the service). A large
decrease in the MOOP for SADPs will cause a significant increase in dental premium costs, driven by
both a higher AV and projected cost increases due to induced demand.
In the Task 2c analysis we reviewed existing literature on the role of cost sharing and premiums in
consumer purchasing decisions. We concluded that consumers are most sensitive to premiums and
least sensitive to MOOP when making purchasing decisions. Deductibles and copays/coinsurance were
of greater importance than MOOP in most consumers’ purchasing decisions. The fact that reductions in
MOOP on QHPs and some SADPs can be made without impacting premiums but increasing cost sharing
elements such as deductibles and coinsurances may affect consumers’ decision making process. From
the consumer perspective, the least important factor in their purchasing decision (the MOOP) has been
improved while the more important factors (premiums and deductibles/coinsurance) have worsened. It
is difficult to estimate the extent of the impact of MOOP reductions on enrollment given the limited
available research.
Table 10: Impact of MOOP Changes for the Bronze Deductible Plan
Original MOOP MOOP MOOP MOOP MOOP MOOP MOOP MOOP MOOP MOOP
Bronze Plan ↓ 100 ↓ 200 ↓ 300 ↓ 400 ↓ 500 ↓ 600 ↓ 700 ↓ 800 ↓ 900 ↓ 1000
Revised MOOP $6,350 $6,250 $6,150 $6,050 $5,950 $5,850 $5,750 $5,650 $5,550 $5,450 $5,350
Actuarial Value with
MOOP changes61.0% 61.3% 61.5% 61.7% 61.9% 61.9% 62.6% 62.9% 63.2% 63.5% 63.9%
Offsetting Benefit Change
Medical Deductible $3,000 $3,200 $3,400 $4,000 $4,000 $4,000 $4,000 $4,000 $4,000 $4,000 $4,000
Drug Deductible $200 $200 $200 $200 $250 $300 $350 $410 $460 $530 $600
Actuarial Value with
Offsetting Changen/a 61.0% 61.0% 61.0% 61.0% 61.0% 61.0% 61.0% 61.1% 61.0% 61.0%

Impact of Changing the Maximum Out-of-Pocket Amounts
August 26, 2013 Page 12
V. Appendix A: Impact of MOOP Changes on Stand-Alone Dental Plans – 70% Plan 1
Impact of MOOP Changes for 70% Plan 1
MOOP MOOP MOOP Original MOOP MOOP MOOP MOOP MOOP MOOP
↑ 300 ↑ 200 ↑ 10070%
Plan↓ 100 ↓ 200 ↓ 300 ↓ 400 ↓ 500 ↓ 600
Revised MOOP $1,000 $900 $800 $700 $600 $500 $400 $300 $200 $100
Actuarial Value with MOOP changes 67.9% 68.7% 69.5% 70.5% 71.6% 73.0% 74.6% 77.0% 81.5% 90.0%
Cost Impact with MOOP changes -4% -3% -1% 0% 2% 3% 6% 9% 16% 28%
Offsetting Benefit Change
Deductible $110 $120 $135 $150 $205 $220 $260 $300 $200 $100
Diagnostic & Preventive - X-Rays, Exams,
Cleanings, Sealants 0% 0% 0% 0% 0% 0% 0% 0% 0% 0%
Basic Services - Basic Restorative 40% 40% 40% 40% 40% 40% 40% 0% 0% 0%
Major Services - Crowns & Casts,
Prosthodontics, Endodontics,
Periodontics, Implants, Oral Surgery 50% 50% 50% 50% 50% 50% 50% 0% 0% 0%
Orthodontics - Medically Necessary 50% 50% 50% 50% 50% 50% 50% 0% 0% 0%
Actuarial Value with Offsetting Changes 70.5% 70.6% 70.5% 70.5% 70.5% 70.5% 70.5% 73.3% 80.9% 90.2%
Cost Impact 0% 0% 0% 0% 0% 0% 0% 4% 15% 28%
Additional Costs for Induced Demand -1% -1% 0% 0% 0% 1% 2% 19% 22% 29%

Impact of Changing the Maximum Out-of-Pocket Amounts
August 26, 2013 Page 13
Appendix A: Impact of MOOP Changes on Stand-Alone Dental Plans – 70% Plan 2
Impact of MOOP Changes for 70% Plan 2
MOOP MOOP MOOP Original MOOP MOOP MOOP MOOP MOOP MOOP
↑ 300 ↑ 200 ↑ 10070%
Plan↓ 100 ↓ 200 ↓ 300 ↓ 400 ↓ 500 ↓ 600
Revised MOOP $1,000 $900 $800 $700 $600 $500 $400 $300 $200 $100
Actuarial Value with MOOP changes 67.4% 68.4% 69.4% 70.5% 71.8% 73.4% 75.3% 78.0% 82.3% 90.2%
Cost Impact with MOOP changes -4% -3% -2% 0% 2% 4% 7% 11% 17% 28%
Offsetting Benefit Change
Deductible $48 $62 $80 $100 $125 $160 $220 $300 $200 $100
Diagnostic & Preventive - X-Rays, Exams,
Cleanings, Sealants 0% 0% 0% 0% 0% 0% 0% 0% 0% 0%
Basic Services - Basic Restorative 50% 50% 50% 50% 50% 50% 50% 0% 0% 0%
Major Services - Crowns & Casts,
Prosthodontics, Endodontics,
Periodontics, Implants, Oral Surgery 60% 60% 60% 60% 60% 60% 60% 0% 0% 0%
Orthodontics - Medically Necessary 70% 70% 70% 70% 70% 70% 70% 0% 0% 0%
Actuarial Value with Offsetting Changes 70.4% 70.5% 70.5% 70.5% 70.5% 70.4% 70.3% 73.3% 80.9% 90.2%
Cost Impact 0% 0% 0% 0% 0% 0% 0% 4% 15% 28%
Additional Costs for Induced Demand -1% -1% 0% 0% 0% 1% 2% 19% 22% 28%
Impact of Changing the Maximum Out-of-Pocket Amounts
August 26, 2013 Page 14
Appendix A: Impact of MOOP Changes on Stand-Alone Dental Plans – 85% Plan 1
Impact of MOOP Changes for 85% Plan 1
MOOP MOOP MOOP Original MOOP MOOP MOOP MOOP MOOP MOOP
↑ 300 ↑ 200 ↑ 10085%
Plan↓ 100 ↓ 200 ↓ 300 ↓ 400 ↓ 500 ↓ 600
Revised MOOP $1,000 $900 $800 $700 $600 $500 $400 $300 $200 $100
Actuarial Value with MOOP changes 83.6% 84.0% 84.4% 84.9% 85.6% 86.4% 87.3% 88.5% 90.0% 92.7%
Cost Impact with MOOP changes -2% -1% -1% 0% 1% 2% 3% 4% 6% 9%
Offsetting Benefit Change
Deductible $0 $0 $0 $0 $10 $20 $35 $50 $85 $100
Diagnostic & Preventive - X-Rays, Exams,
Cleanings, Sealants 0% 0% 0% 0% 0% 0% 0% 0% 0% 0%
Basic Services - Basic Restorative 9% 11% 13% 15% 15% 15% 15% 15% 15% 0%
Major Services - Crowns & Casts,
Prosthodontics, Endodontics,
Periodontics, Implants, Oral Surgery 40% 40% 40% 40% 40% 40% 40% 40% 40% 0%
Orthodontics - Medically Necessary 50% 50% 50% 50% 50% 50% 50% 50% 50% 0%
Actuarial Value with Offsetting Changes 85.0% 84.9% 84.9% 84.9% 84.8% 84.9% 84.8% 85.0% 84.8% 90.2%
Cost Impact 0% 0% 0% 0% 0% 0% 0% 0% 0% 6%
Additional Costs for Induced Demand 1% 0% 0% 0% 1% 1% 2% 3% 4% 14%

Impact of Changing the Maximum Out-of-Pocket Amounts
August 26, 2013 Page 15
Appendix A: Impact of MOOP Changes on Stand-Alone Dental Plans – 85% Plan 2
Impact of MOOP Changes for 85% Plan 2
MOOP MOOP MOOP Original MOOP MOOP MOOP MOOP MOOP MOOP
↑ 300 ↑ 200 ↑ 10085%
Plan↓ 100 ↓ 200 ↓ 300 ↓ 400 ↓ 500 ↓ 600
Revised MOOP $1,000 $900 $800 $700 $600 $500 $400 $300 $200 $100
Actuarial Value with MOOP changes 84.3% 84.7% 85.1% 85.5% 85.9% 86.5% 87.3% 88.3% 89.7% 92.1%
Cost Impact with MOOP changes -1% -1% 0% 0% 1% 1% 2% 3% 5% 8%
Offsetting Benefit Change
Deductible $10 $15 $20 $25 $30 $40 $50 $65 $90 $100
Diagnostic & Preventive - X-Rays, Exams,
Cleanings, Sealants 0% 0% 0% 0% 0% 0% 0% 0% 0% 0%
Basic Services - Basic Restorative 10% 10% 10% 10% 10% 10% 10% 10% 10% 0%
Major Services - Crowns & Casts,
Prosthodontics, Endodontics,
Periodontics, Implants, Oral Surgery 40% 40% 40% 40% 40% 40% 40% 40% 40% 0%
Orthodontics - Medically Necessary 40% 40% 40% 40% 40% 40% 40% 40% 40% 0%
Actuarial Value with Offsetting Changes 85.5% 85.5% 85.5% 85.5% 85.5% 85.4% 85.4% 85.4% 85.3% 90.2%
Cost Impact 0% 0% 0% 0% 0% 0% 0% 0% 0% 6%
Additional Costs for Induced Demand -1% -1% 0% 0% 0% 1% 1% 2% 3% 11%
Impact of Changing the Maximum Out-of-Pocket Amounts
August 26, 2013 Page 16
VI. Appendix B: Impact of MOOP Changes on Qualified Health Plans – Silver HDHP
Impact of MOOP Changes for the Silver HDHP
Original MOOP MOOP MOOP MOOP MOOP MOOP MOOP MOOP MOOP MOOP
Silver Plan ↓ 100 ↓ 200 ↓ 300 ↓ 400 ↓ 500 ↓ 600 ↓ 700 ↓ 800 ↓ 900 ↓ 1000
MOOP (medical + Rx combined) $6,350 $6,250 $6,150 $6,050 $5,950 $5,850 $5,750 $5,650 $5,550 $5,450 $5,350
Medical Benefits
Deductible $1,550 $1,560 $1,575 $1,590 $1,605 $1,620 $1,635 $1,650 $1,665 $1,680 $1,700
Deductible Waived Preventive Preventive Preventive Preventive Preventive Preventive Preventive Preventive Preventive Preventive Preventive
Office Visits - PCP 20% 20% 20% 20% 20% 20% 20% 20% 20% 20% 20%
Office Visits - Specialist 20% 20% 20% 20% 20% 20% 20% 20% 20% 20% 20%
Mental Health and Substance Abuse 20% 20% 20% 20% 20% 20% 20% 20% 20% 20% 20%
Preventive 0% 0% 0% 0% 0% 0% 0% 0% 0% 0% 0%
All other medical services 20% 20% 20% 20% 20% 20% 20% 20% 20% 20% 20%
Rx Benefits
Deductible Integrated Integrated Integrated Integrated Integrated Integrated Integrated Integrated Integrated Integrated Integrated
Deductible Waived N/A N/A N/A N/A N/A N/A N/A N/A N/A N/A N/A
Generics $10 $10 $10 $10 $10 $10 $10 $10 $10 $10 $10
Preferred Brand Drugs $40 $40 $40 $40 $40 $40 $40 $40 $40 $40 $40
Non-Preferred Brand Drugs 50% 50% 50% 50% 50% 50% 50% 50% 50% 50% 50%
Specialty Drugs (i.e. high-cost) 50% 50% 50% 50% 50% 50% 50% 50% 50% 50% 50%
Actuarial Values
Without offsetting benefit changes 70.2% 70.3% 70.4% 70.5% 70.6% 70.7% 70.7% 70.8% 70.9% 71.0% 71.1%
With offsetting benefit changes n/a 70.2% 70.2% 70.2% 70.2% 70.2% 70.2% 70.2% 70.2% 70.2% 70.2%
Impact of Changing the Maximum Out-of-Pocket Amounts
August 26, 2013 Page 17
Appendix B: Impact of MOOP Changes on Qualified Health Plans – Silver Deductible Plan
Impact of MOOP Changes for the Silver Deductible Plan
Original MOOP MOOP MOOP MOOP MOOP MOOP MOOP MOOP MOOP MOOP
Silver Plan ↓ 100 ↓ 200 ↓ 300 ↓ 400 ↓ 500 ↓ 600 ↓ 700 ↓ 800 ↓ 900 ↓ 1000
MOOP (medical + Rx combined) $6,350 $6,250 $6,150 $6,050 $5,950 $5,850 $5,750 $5,650 $5,550 $5,450 $5,350
Medical Benefits
Deductible $1,900 $1,900 $1,900 $1,900 $1,900 $1,900 $1,900 $1,900 $1,900 $1,900 $1,900
Deductible Waived
Preventive
and Office
Visits
Preventive
and Office
Visits
Preventive
and Office
Visits
Preventive
and Office
Visits
Preventive
and Office
Visits
Preventive
and Office
Visits
Preventive
and Office
Visits
Preventive
and Office
Visits
Preventive
and Office
Visits
Preventive
and Office
Visits
Preventive
and Office
Visits
Office Visits - PCP $35 $35 $35 $35 $35 $35 $35 $35 $35 $35 $35
Office Visits - Specialist $60 $60 $60 $60 $60 $60 $60 $60 $60 $60 $60
Mental Health and Substance Abuse $35 $35 $35 $35 $35 $35 $35 $35 $35 $35 $35
Preventive 0% 0% 0% 0% 0% 0% 0% 0% 0% 0% 0%
All other medical services 30% 31% 32% 33% 34% 35% 39% 42% 44% 47% 50%
Rx Benefits
Deductible $100 $100 $100 $100 $100 $100 $100 $100 $100 $100 $100
Deductible Waived
Generics and
Preferred
Brand
Generics and
Preferred
Brand
Generics and
Preferred
Brand
Generics and
Preferred
Brand
Generics and
Preferred
Brand
Generics and
Preferred
Brand
Generics and
Preferred
Brand
Generics and
Preferred
Brand
Generics and
Preferred
Brand
Generics and
Preferred
Brand
Generics and
Preferred
Brand
Generics $15 $15 $15 $15 $15 $15 $15 $15 $15 $15 $15
Preferred Brand Drugs $40 $40 $40 $40 $40 $40 $40 $40 $40 $40 $40
Non-Preferred Brand Drugs 50% 50% 50% 50% 50% 50% 50% 50% 50% 50% 50%
Specialty Drugs (i.e. high-cost) 50% 50% 50% 50% 50% 50% 50% 50% 50% 50% 50%
Actuarial Values
Without offsetting benefit changes 70.3% 70.4% 70.5% 70.6% 70.7% 70.9% 71.0% 71.1% 71.2% 71.3% 71.4%
With offsetting benefit changes n/a 70.3% 70.3% 70.3% 70.3% 70.3% 70.3% 70.3% 70.3% 70.3% 70.3%

Impact of Changing the Maximum Out-of-Pocket Amounts
August 26, 2013 Page 18
Appendix B: Impact of MOOP Changes on Qualified Health Plans – Bronze HDHP
Impact of MOOP Changes for the Bronze HDHP
Original MOOP MOOP MOOP MOOP MOOP MOOP MOOP MOOP MOOP MOOP
Bronze Plan ↓ 100 ↓ 200 ↓ 300 ↓ 400 ↓ 500 ↓ 600 ↓ 700 ↓ 800 ↓ 900 ↓ 1000
MOOP (Medical + Rx combined) $6,350 $6,250 $6,150 $6,050 $5,950 $5,850 $5,750 $5,650 $5,550 $5,450 $5,350
Medical Benefits
Deductible $2,500 $2,620 $2,780 $2,920 $3,050 $3,250 $3,400 $3,600 $3,900 $4,300 $5,250
Deductible Waived Preventive Preventive Preventive Preventive Preventive Preventive Preventive Preventive Preventive Preventive Preventive
Office Visits - PCP 50% 50% 50% 50% 50% 50% 50% 50% 50% 50% 50%
Office Visits - Specialist 50% 50% 50% 50% 50% 50% 50% 50% 50% 50% 50%
Mental Health and Substance Abuse 50% 50% 50% 50% 50% 50% 50% 50% 50% 50% 50%
Preventive 0% 0% 0% 0% 0% 0% 0% 0% 0% 0% 0%
All other medical services 50% 50% 50% 50% 50% 50% 50% 50% 50% 50% 50%
Rx Benefits
Deductible Integrated Integrated Integrated Integrated Integrated Integrated Integrated Integrated Integrated Integrated Integrated
Deductible Waived N/A N/A N/A N/A N/A N/A N/A N/A N/A N/A N/A
Generics $12 $12 $12 $12 $12 $12 $12 $12 $12 $12 $12
Preferred Brand Drugs 50% 50% 50% 50% 50% 50% 50% 50% 50% 50% 50%
Non-Preferred Brand Drugs 50% 50% 50% 50% 50% 50% 50% 50% 50% 50% 50%
Specialty Drugs (i.e. high-cost) 50% 50% 50% 50% 50% 50% 50% 50% 50% 50% 50%
Actuarial Values
Without offsetting benefit changes 61.8% 62.0% 62.2% 62.5% 62.7% 63.0% 63.3% 63.5% 63.8% 64.0% 64.3%
With offsetting benefit changes n/a 61.8% 61.7% 61.7% 61.8% 61.7% 61.8% 61.7% 61.8% 61.8% 61.8%

Impact of Changing the Maximum Out-of-Pocket Amounts
August 26, 2013 Page 19
Appendix B: Impact of MOOP Changes on Qualified Health Plans – Bronze Deductible Plan
Impact of MOOP Changes for the Bronze Deductible Plan
Original MOOP MOOP MOOP MOOP MOOP MOOP MOOP MOOP MOOP MOOP
Bronze Plan ↓ 100 ↓ 200 ↓ 300 ↓ 400 ↓ 500 ↓ 600 ↓ 700 ↓ 800 ↓ 900 ↓ 1000
MOOP (Medical + Rx combined) $6,350 $6,250 $6,150 $6,050 $5,950 $5,850 $5,750 $5,650 $5,550 $5,450 $5,350
Medical Benefits
Deductible $3,000 $3,200 $3,400 $4,000 $4,000 $4,000 $4,000 $4,000 $4,000 $4,000 $4,000
Deductible Waived Preventive Preventive Preventive Preventive Preventive Preventive Preventive Preventive Preventive Preventive Preventive
Office Visits - PCP $60 $60 $60 $60 $60 $60 $60 $60 $60 $60 $60
Office Visits - Specialist $100 $100 $100 $100 $100 $100 $100 $100 $100 $100 $100
Mental Health and Substance Abuse $60 $60 $60 $60 $60 $60 $60 $60 $60 $60 $60
Preventive 0% 0% 0% 0% 0% 0% 0% 0% 0% 0% 0%
All other medical services 50% 50% 50% 50% 50% 50% 50% 50% 50% 50% 50%
Rx Benefits
Deductible $200 $200 $200 $200 $250 $300 $350 $410 $460 $530 $600
Deductible Waived N/A N/A N/A N/A N/A N/A N/A N/A N/A N/A N/A
Generics $20 $20 $20 $20 $20 $20 $20 $20 $20 $20 $20
Preferred Brand Drugs $80 $80 $80 $80 $80 $80 $80 $80 $80 $80 $80
Non-Preferred Brand Drugs 50% 50% 50% 50% 50% 50% 50% 50% 50% 50% 50%
Specialty Drugs (i.e. high-cost) 50% 50% 50% 50% 50% 50% 50% 50% 50% 50% 50%
Actuarial Values
Without offsetting benefit changes 61.0% 61.3% 61.5% 61.7% 61.9% 61.9% 62.6% 62.9% 63.2% 63.5% 63.9%
With offsetting benefit changes n/a 61.0% 61.0% 61.0% 61.0% 61.0% 61.0% 61.0% 61.1% 61.0% 61.0%
![MOOP - Amazon Web Services · 36. SKOP X 50. Psyche 24. Tip top bus stop 1 55. Tankwa Chess 56. Ephemeropoly Y CLEAR MOOP [MATTER OUT OF PLACE]MAP 68. Step Sequencer 69. Shrine of](https://img.dokumen.tips/doc/110x75/5f7b7e053536e734f8565d4c/moop-amazon-web-services-36-skop-x-50-psyche-24-tip-top-bus-stop-1-55-tankwa.jpg)

![An Empirical Study on the Use and Misuse of Java 8 Streams · programming (MOOP) languages and platforms [5], including Scala [14], Java-Script [44], C# [33], F# [47], Java [39],](https://img.dokumen.tips/doc/110x75/5f09a9987e708231d427e9f7/an-empirical-study-on-the-use-and-misuse-of-java-8-streams-programming-moop-languages.jpg)