Embed Size (px)
Citation preview
International Journal of Economics and Finance; Vol. 8, No. 9; 2016
ISSN 1916-971X E-ISSN 1916-9728
Published by Canadian Center of Science and Education
249
Impact of Capital Structure on Stock Prices: Evidence from Oman
Udayakumari Vidhyasagara Menon1
1 Dept. of Management Studies, Middle East College, Knowledge Oasis, Al Rusayl, Sultanate of Oman
Correspondence: Udayakumari Vidhyasagara Menon, Dept. of Management Studies, Middle East College,
Knowledge Oasis, Al Rusayl, Sultanate of Oman. E-mail: [email protected]
Received: April 21, 2016 Accepted: August 20, 2016 Online Published: August 25, 2016
doi:10.5539/ijef.v8n9p249 URL: http://dx.doi.org/10.5539/ijef.v8n9p249
Abstract
The study tests the relationship between capital structures and share prices of the listed companies of Muscat
Securities Market (MSM). It considers all the 113 listed companies registered in MSM for three main sectors for
a period of eight years i.e. 2008 till 2015. It analyzes the relationship between share price and capital structure by
employing correlation analysis and multiple regression analysis in a panel framework. We found an inverse
relationship between amount of debt and share prices. Further a positive relationship between amount of equity
and share prices and debt equity ratio. The results were statistically significant at 1% level of significance. The
results indicate adding debt to overall capital inversely effects the share prices. The results are in tandem to Net
Income Approach which portrays capital structure to influence firm value.
Keywords: capital structure, debt, equity, firm value, muscat securities market, share price
1. Introduction
Share prices can be affected by a wide variety of factors with a predominance of performance of the company
that has issued the shares and a much wider perspective where market forces are highly significant. Stock prices
change on a daily basis as a result of these market forces. Influence of market forces can be easily explained by
the idea that share prices change due to a change in the supply and demand for the company’s shares. If more
people are interested to buy than selling, demand for that particular share increases. In such a circumstance, the
prices move up. Conversely, if more people want to sell a stock than buy it, there would be greater supply than
demand, and the price would fall. Again the demand and supply may also be affected by the psychological
factors of the investing public.
Further, it is also important to note that capital structure of the firm also influence its profitability to a great
extent. Debt is a liability on which interest has to be paid irrespective of the company’s profits. While equity
consists of shareholders, or owners, funds on which payment of dividend depends upon the company’s profits. A
high proportion of debt content in the capital structure increases the risk and may lead to financial insolvency in
adverse times. However, raising funds through debt is cheaper as compared to raising funds through shares. This
is because interest on debt is allowed as an expense for tax purposes. Dividend is considered to be an
appropriation of profits hence payment of dividend does not result in any tax benefit to the company. This means
if a company, which is in the 50 percent tax bracket, pays interest at 12 percent on its debentures, the effective
cost to it comes only to 6 percent. While if the amount is raised by issue of 12 percent preference shares, the cost
of raising the amount would be 12 percent.
Thus, raising of funds by borrowing is cheaper resulting in higher profits for shareholders. This increases the
earnings per equity share (EPS) of the company which is the basic objective of any investors. The choice of an
appropriate capital structure depends on a number of factors, such as the nature of the company’s business,
regularity of earnings, conditions of the money market, attitude of the investor, etc. The companies should use a
capital structure which also raises the worth of the company for its investors. This is an assumption used for the
whole ideas of this research.
Therefore, a study on share price changes with the change in capital structure becomes highly significant. In the
same line, this research also would look at; if a change in a capital structure may impact on the share prices. It
can be simply by testing the changes in the debt or equity component they use in their capital, based on the
above theories and assumptions. Thus, the research is presumed as will be a significant contribution to the
corporate finance discipline.

ijef.ccsenet.org International Journal of Economics and Finance Vol. 8, No. 9; 2016
250
2. Literature Review
The relationship between capital structure and stock performance has been a growing area of management
research. A comprehensive review of literature reveals that capital structure decisions were often subject to a
large number of studies. It is an area in corporate finance which requires extensive planning skills and capital
market exposure. If looking backward, several studies documented a significant decrease in the price of firms’
common stock at the earliest public announcement of certain types of capital structure changes. As stated by
Masulis (1978) there was a statistically significant negative average common stock return s at the announcement
of intra firm exchange offers that involve the issuance of common stock for debt, common stock for preferred
stock, or preferred stock for debt. In line with that, Mikkelson (1981) also has documented a very a considerable
negative average common stock return at the announcement of convertible debt calls that force conversion of
debt to common stock. Similarly the research works of Dann and Mikkelson (1984) and Korwar (1982) also had
come up with similar findings of negative average return at the announcement of the issuance of convertible debt
and common stock, respectively. None of these studies of capital structure changes, however, resolves the issue
of what factors determine the negative average stock price response. Nor do they completely explain the
motivation for these capital structure changes
As stated by Masulis (1983) presented an extensive theoretical literature available with respect to the optimal
capital structure. However, evidence of a relation between changes in capital structure and firm value are seldom
reported. However, Miller-Modigliani (1966) reported evidence of a positive relationship between firm value and
leverage which they attributed to a debt tax shield effect. Even then, this result was doubtful due to the statistical
problems they encountered when attempting to adjust for differences in the firms’ asset structures. The study was
considering only regulated firms and therefore, their empirical findings were caused by the regulatory
environment in which these firms operate. Even after that study, no strong research work had been carried out to
identify evidence of a relation between a firm’s value and the size of its debt tax shield, evidence of a relation
between a firm’s value and the size of its debt tax shield. Further, Masulis (1983) found that both stock prices
and firm values are positively related to changes in debt level and leverage; security prices are negatively related
to these capital structure change variables. This evidence is consistent with models of optimal capital structure
and with the hypothesis that debt level changes release information about changes in firm value.
Although significant literature exists on the issue of capital structure and stock market performance La Porta, et
al., 2000; Iyer & Agarwal, 2007; Strebuleav, 2007; Asquith & Mullin, 1986; Baker & Wurgler, 2002; Jung, Kim,
& Stulz, 1996; Mickelson & Partch, 1989; Marsh, 1982; Dasgupta & Hilary, 2006; Singal & Mittal, 1993;
Boodho, 2009; Mehmet & Eda, 2009; Joshua, 2008; Fakher et al., 2005; Keshar & Baral, 2004; Venkatesan,
1983; Asideu, 2005; Fama, 1998; Hutchinson, 1995; Singh, 2005) however limited research is available in
context of Oman. Along with that empirical studies have yielded conflicting results. The current paper makes an
attempt to fill the gap by study the relationship for the last eight years and showcases the impact of capital
structure on the movement of share prices in context of listed companies in Oman.
3. Research Objective
This research tests the influence of changes in the debt and equity combination of the companies on the share
prices of the listed companies of Muscat Securities Market. To bring strength for the analysis, all the listed
companies were considered. There are 113 companies registered in MSM by the end of year 2015. To analyze
the relationship between share price and capital structure the study identified the following three hypothesis
1) There exists an inverse relationship between amount of debt in a company and share prices.
2) There exists an positive relationship between amount of equity in a company and share prices.
3) There exists a positive relationship between debt/equity ratio and share prices.
4. Research Methodology
This research tests the influence of changes in the debt and equity combination of the companies on the share
prices of the listed companies of Muscat Securities Market. To bring strength for the analysis, all the listed
companies were considered. There are 113 companies registered in MSM by the end of year 2015. However the
non-availability of share prices for all the companies related to all the relevant period restricted the scope to 41
companies out of the total 113 which is 36%. It comprises 17 companies from Finance Sector, 12 from Service
and 12 from Industrial sector. Also the companies which are listed in between the period of this study are also
avoided, finally keeping the number of companies to 41. Data is collected from all the markets like regular,
parallel, and third markets across all the sectors like Finance, Service and Industrial Sectors for the 5 years from
2008 to 2015, for these companies. The research has utilized secondary data to complete its analysis. The data
ijef.ccsenet.org International Journal of Economics and Finance Vol. 8, No. 9; 2016
251
regarding the capital structure and shares prices were collected from the published sources like the relevant
companies’ websites, Muscat Securities Market Website, investor’s guide published by the MSM for the year
2015 etc. The share prices were downloaded from the MSM website. Capital structure; debt and equity
combination details were collected from the company’s annual reports as well as the financial reports
downloaded from MSM website. These were also cross checked by the information available to the public
through the investor’s guide published by MSM.
5. Econometric Methods
Initially we explore the general properties of data using statistical tools like mean, standard deviation, kurtosis
etc of the collected data. In the next stage we move one step ahead by studying the degree of correlation among
the four variables by employing bivariate Pearson correlation method; the method calculates the pairwise
associations for a set of variables and displays the results in a matrix. It is useful for determining the strength and
direction of the association between variables.
Further, we analyze the relationship between share price and capital structure by employing a multiple linear
regression model in a panel framework. We take share prices as dependent variable and the other three variables
as independent variables. We also adopted stepwise regression model to check the robustness of our results for
the full sample. It employs panel data framework (Note 1) for analysis work due to its advantage of allowing for
more data points. Greene (1997) explained that the panel data sets allow researchers to capture both time series
and cross-sectional relations. The basic panel data model is of the form:
𝑦𝑖𝑡 = 𝛼0 + 𝛽0 ∗ 𝑥𝑖𝑡 + 𝜀𝑖𝑡 (1)
In equation (1), yit is the dependent variable (Share Price); αo is a constant; xit is a K-dimensional vector of
explanatory variables (Amount of Debt, Equity and Debt Equity Raio) and ɛit is the error term which is further
decomposed into the following disturbance terms:
𝜀𝑖𝑡 = 𝜇𝑖𝑡 + 𝑣𝑖𝑡 (2)
6. Results
In this paper, we tried to examine the influence of changes in the debt and equity combination of the companies
on the share prices of the listed companies of Muscat Securities Market. In this section we discuss the empirical
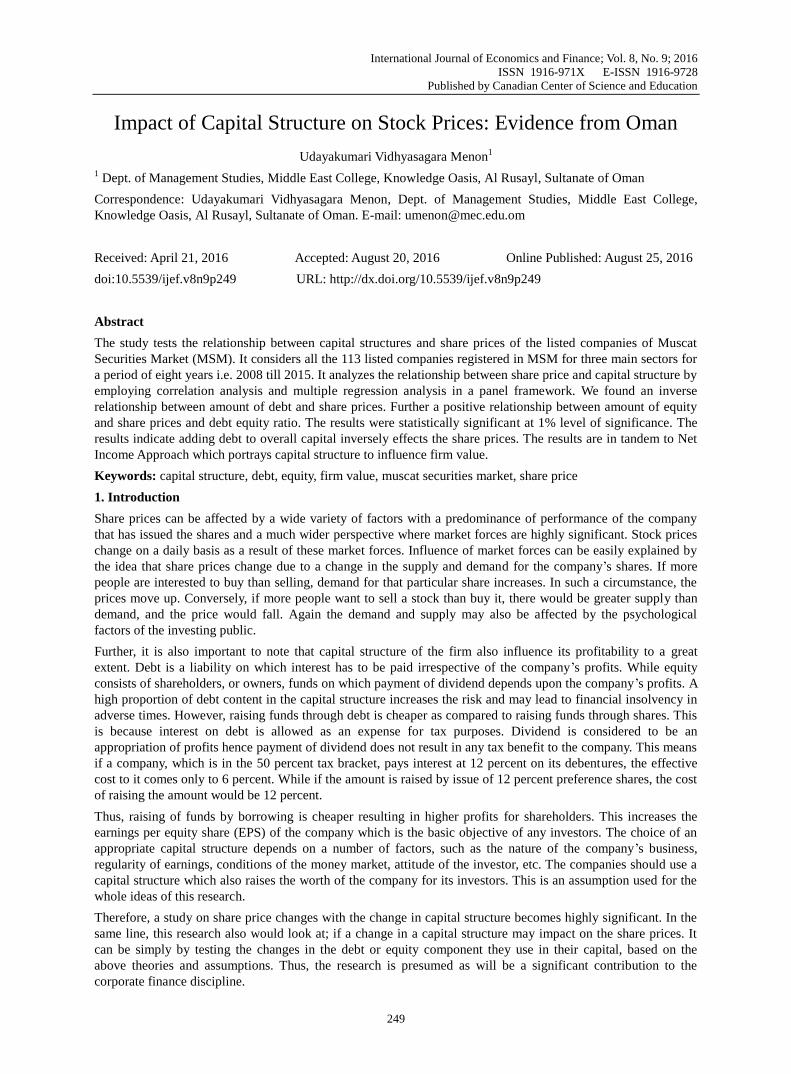
findings of the study. Table 1 presents the degree of correlation among the four variables by employing bivariate
Pearson correlation method; the method calculates the pairwise associations for a set of variables and displays
the results in a matrix. It is useful for determining the strength and direction of the association between variables.
Table 1. Pearson correlations for full sample period
Share Price Equity Debt De
Share Price Pearson Correlation 1 .000 -.001 .224**
Sig. (2-tailed) .999 .987 .003
N 215 215 179 179
Equity Pearson Correlation .000 1 .861** .130
Sig. (2-tailed) .999 .000 .083
N 215 215 179 179
Debt Pearson Correlation -.001 .861** 1 .261**
Sig. (2-tailed) .987 .000 .000
N 179 179 179 179
De Pearson Correlation .224** .130 .261** 1
Sig. (2-tailed) .003 .083 .000
N 179 179 179 179
**. Correlation is significant at the 0.01 level (2-tailed).
The results indicate a significant positive correlation between share price and debt equity ratio, amount of equity
capital and debt and amount of debt and debt equity. The results also indicate negative correlation between
equity share prices and amount of debt however the results are not statistically significant for the same. As
pointed out in our earlier results which highlight differences among the three different sectors, we calculate
correlation among the same variables for the three different sectors.
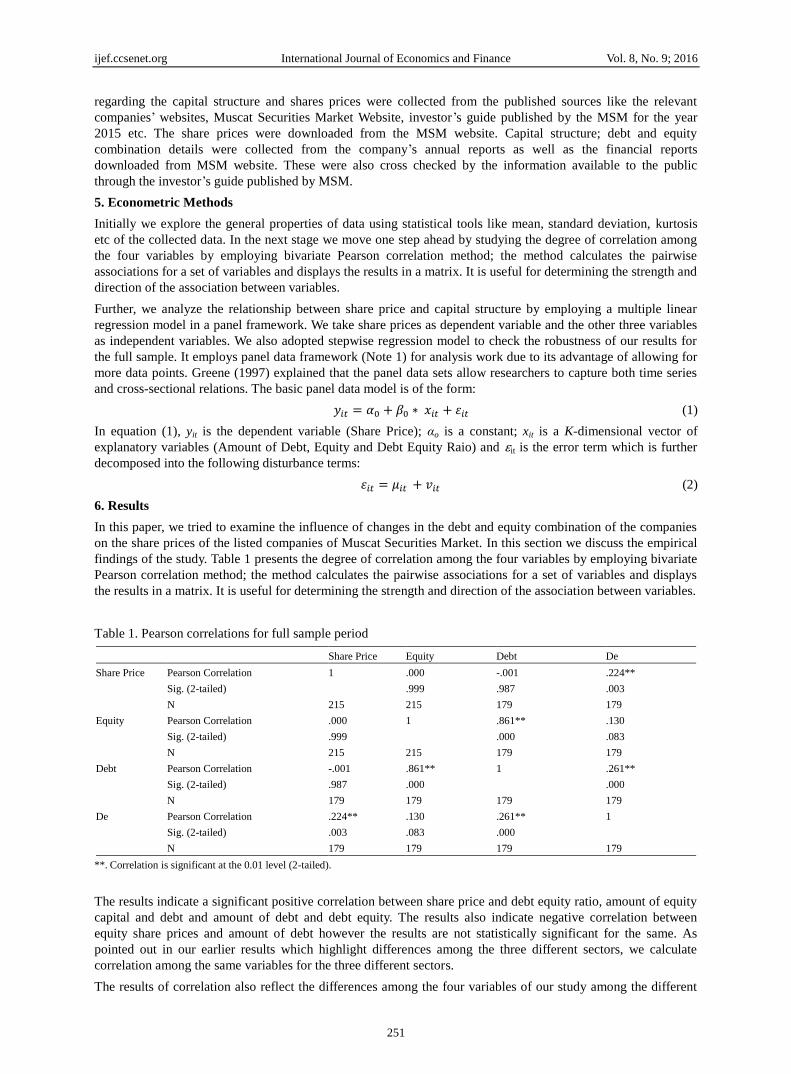
The results of correlation also reflect the differences among the four variables of our study among the different
ijef.ccsenet.org International Journal of Economics and Finance Vol. 8, No. 9; 2016
252
sectors (Table 2, 3 & 4). In case of financial sector, the relationship between share prices and amount of equity
and debt is positive and the results are statistically significant, however the same relationship doesn’t hold true
for other two sectors.
Table 2. Pearson correlations for financial sector
SP Equity Debt DE
SP Pearson Correlation 1 .310** .293** .198
Sig. (2-tailed) .003 .007 .071
N 90 90 84 84
Equity Pearson Correlation .310** 1 .988** .573**
Sig. (2-tailed) .003 .000 .000
N 90 90 84 84
Debt Pearson Correlation .293** .988** 1 .645**
Sig. (2-tailed) .007 .000 .000
N 84 84 84 84
Table 3. Pearson correlations for service sector
SP Equity Debt DE
SP Pearson Correlation 1 .041 -.230 .174
Sig. (2-tailed) .743 .065 .166
N 65 65 65 65
Equity Pearson Correlation .041 1 .117 -.136
Sig. (2-tailed) .743 .352 .279
N 65 65 65 65
Debt Pearson Correlation -.230 .117 1 .181
Sig. (2-tailed) .065 .352 .149
N 65 65 65 65
DE Pearson Correlation .174 -.136 .181 1
Sig. (2-tailed) .166 .279 .149
N 65 65 65 65
Table 4. Pearson correlations for manufacturing sector
SP EQUITY DEBT DE
SP Pearson Correlation 1 -.065 -.041 -.013
Sig. (2-tailed) .620 .755 .921
N 60 60 60 60
EQUITY Pearson Correlation -.065 1 -.120 -.144
Sig. (2-tailed) .620 .362 .271
N 60 60 60 60
DEBT Pearson Correlation -.041 -.120 1 .630**
Sig. (2-tailed) .755 .362 .000
N 60 60 60 60
DE Pearson Correlation -.013 -.144 .630** 1
Sig. (2-tailed) .921 .271 .000
N 60 60 60 60
**. Correlation is significant at the 0.01 level (2-tailed).
Surprisingly, we do not find any significant correlation between for service sector and in case of manufacturing
sector we find evidence of negative correlation among the variables however the relationship is not statistically
significant except for a single case.
6.1 Results of Regression Analysis
Further, we analyze the relationship between share price and capital structure by employing a multiple linear
ijef.ccsenet.org International Journal of Economics and Finance Vol. 8, No. 9; 2016
253
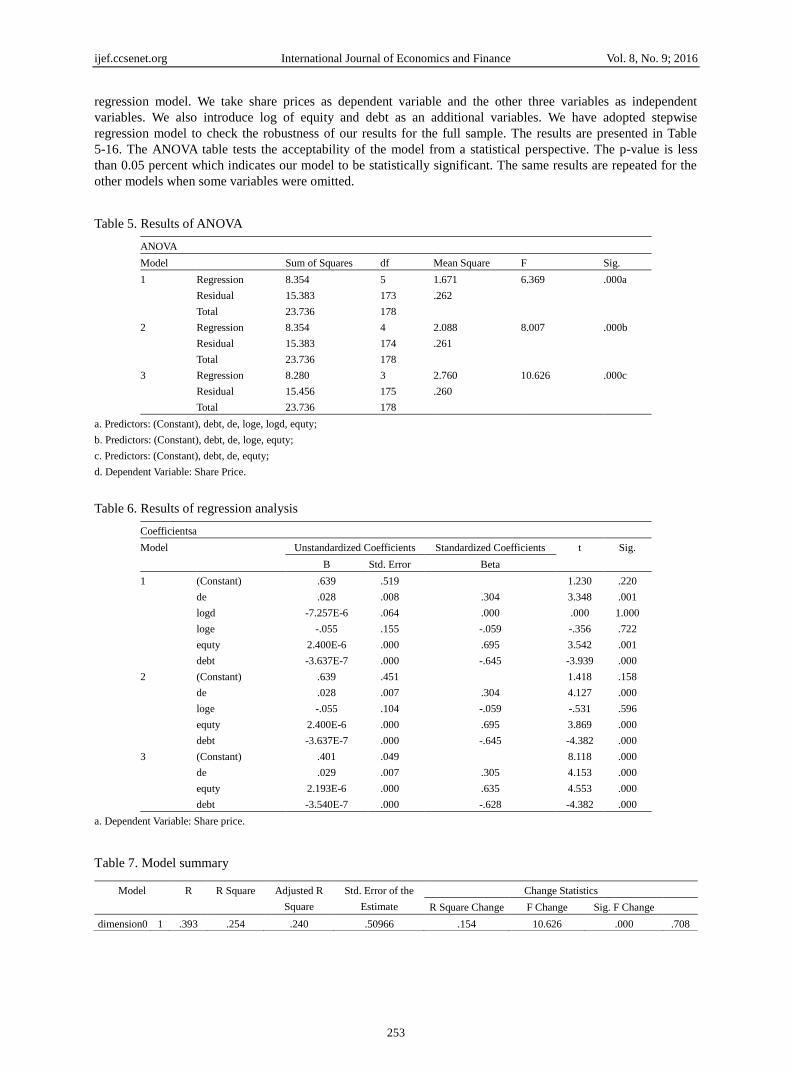
regression model. We take share prices as dependent variable and the other three variables as independent
variables. We also introduce log of equity and debt as an additional variables. We have adopted stepwise
regression model to check the robustness of our results for the full sample. The results are presented in Table
5-16. The ANOVA table tests the acceptability of the model from a statistical perspective. The p-value is less
than 0.05 percent which indicates our model to be statistically significant. The same results are repeated for the
other models when some variables were omitted.
Table 5. Results of ANOVA
ANOVA
Model Sum of Squares df Mean Square F Sig.
1 Regression 8.354 5 1.671 6.369 .000a
Residual 15.383 173 .262
Total 23.736 178
2 Regression 8.354 4 2.088 8.007 .000b
Residual 15.383 174 .261
Total 23.736 178
3 Regression 8.280 3 2.760 10.626 .000c
Residual 15.456 175 .260
Total 23.736 178
a. Predictors: (Constant), debt, de, loge, logd, equty;
b. Predictors: (Constant), debt, de, loge, equty;
c. Predictors: (Constant), debt, de, equty;
d. Dependent Variable: Share Price.
Table 6. Results of regression analysis
Coefficientsa
Model Unstandardized Coefficients Standardized Coefficients t Sig.
B Std. Error Beta
1 (Constant) .639 .519 1.230 .220
de .028 .008 .304 3.348 .001
logd -7.257E-6 .064 .000 .000 1.000
loge -.055 .155 -.059 -.356 .722
equty 2.400E-6 .000 .695 3.542 .001
debt -3.637E-7 .000 -.645 -3.939 .000
2 (Constant) .639 .451 1.418 .158
de .028 .007 .304 4.127 .000
loge -.055 .104 -.059 -.531 .596
equty 2.400E-6 .000 .695 3.869 .000
debt -3.637E-7 .000 -.645 -4.382 .000
3 (Constant) .401 .049 8.118 .000
de .029 .007 .305 4.153 .000
equty 2.193E-6 .000 .635 4.553 .000
debt -3.540E-7 .000 -.628 -4.382 .000
a. Dependent Variable: Share price.
Table 7. Model summary
Model R R Square Adjusted R
Square
Std. Error of the
Estimate
Change Statistics
R Square Change F Change Sig. F Change
dimension0 1 .393 .254 .240 .50966 .154 10.626 .000 .708

ijef.ccsenet.org International Journal of Economics and Finance Vol. 8, No. 9; 2016
254
Table 8. Results of ANOVA model 2
Model Sum of Squares df Mean Square F Sig.
1 Regression 8.280 3 2.760 10.626 .000a
Residual 15.456 175 .260
Total 23.736 178
a. Predictors: (Constant), debt, de, equty;
b. Dependent Variable: Share price.
Table 9. Results of regression analysis full sample coefficients
Model Unstandardized Coefficients Standardized Coefficients
t Sig. B Std. Error Beta
1 (Constant) .401 .049 8.118 .000
de .029 .007 .305 4.153 .000
equity 2.193E-6 .000 .635 4.553 .000
debt -3.540E-7 .000 -.628 -4.382 .000
a. Dependent Variable: Share price.
Table 10. Results of regression analysis sector wise results, finance
Dependent Variable: SP
Model R R Square Adjusted R Square Std. Error of the Estimate
1 .325a .105 .072 .3857927
a. Predictors: (Constant), EQUITY, DE, DEBT.
Table 11. Results of ANOVA
Model Sum of Squares df Mean Square F Sig.
1 Regression 1.404 3 .468 3.144 .030a
Residual 11.907 80 .149
Total 13.311 83
a. Predictors: (Constant), EQUITY, DE, DEBT;
b. Dependent Variable: SP.
Table 12 Results of regression analysis sector wise results, financial sector
B Std. Error Beta
1 (Constant) .165 .085 1.949 .055
DEBT -2.666E-7 .000 -.890 -.993 .324
DE .019 .023 .138 .828 .410
EQUITY 2.223E-6 .000 1.107 1.325 .189
a. Dependent Variable: SP.
Table 13. Model summary, service sector
Model R R Square Adjusted R Square Std. Error of the Estimate
1 .335a .112 .068 .7916563
a. Predictors: (Constant), EQUITY, DEBT, DE.
Table 14. Results of ANOVA, service sector
Model Sum of Squares df Mean Square F Sig.
1 Regression 4.830 3 1.610 2.569 .062a
Residual 38.230 61 .627
Total 43.060 64
a. Predictors: (Constant), EQUITY, DEBT, DE;
b. Dependent Variable: SP.
ijef.ccsenet.org International Journal of Economics and Finance Vol. 8, No. 9; 2016
255
Table 15. Results of regression analysis sector wise results, service sector
Model Unstandardized Coefficients Standardized Coefficients
t Sig. B Std. Error Beta
1 (Constant) .967 .128 7.532 .000
DEBT -7.300E-7 .000 -.286 -2.309 .024
DE .022 .011 .240 1.933 .058
EQUITY 6.976E-7 .000 .108 .876 .385
a. Dependent Variable: SP.
Table 16. Results of model summary, manufacturing sector
Regression
Model R R Square Adjusted R Square Std. Error of the Estimate
1 .082a .007 -.046 1.9932794
a. Predictors: (Constant), EQUITY, DEBT, DE.
Table 17. Results of ANOVA, manufacturing sector
Model Sum of Squares df Mean Square F Sig.
1 Regression 1.522 3 .507 .128 .943a
Residual 222.497 56 3.973
Total 224.020 59
a. Predictors: (Constant), EQUITY, DEBT, DE;
b. Dependent Variable: SP.
Table 18. Results of regression analysis, manufacturing sector
Model Unstandardized Coefficients Standardized Coefficients
t Sig. B Std. Error Beta
1 (Constant) 1.132 .398 2.841 .006
DEBT -1.762E-6 .000 -.058 -.337 .737
DE .040 .524 .013 .077 .939
EQUITY -3.092E-6 .000 -.070 -.522 .604
a. Dependent Variable: SP.
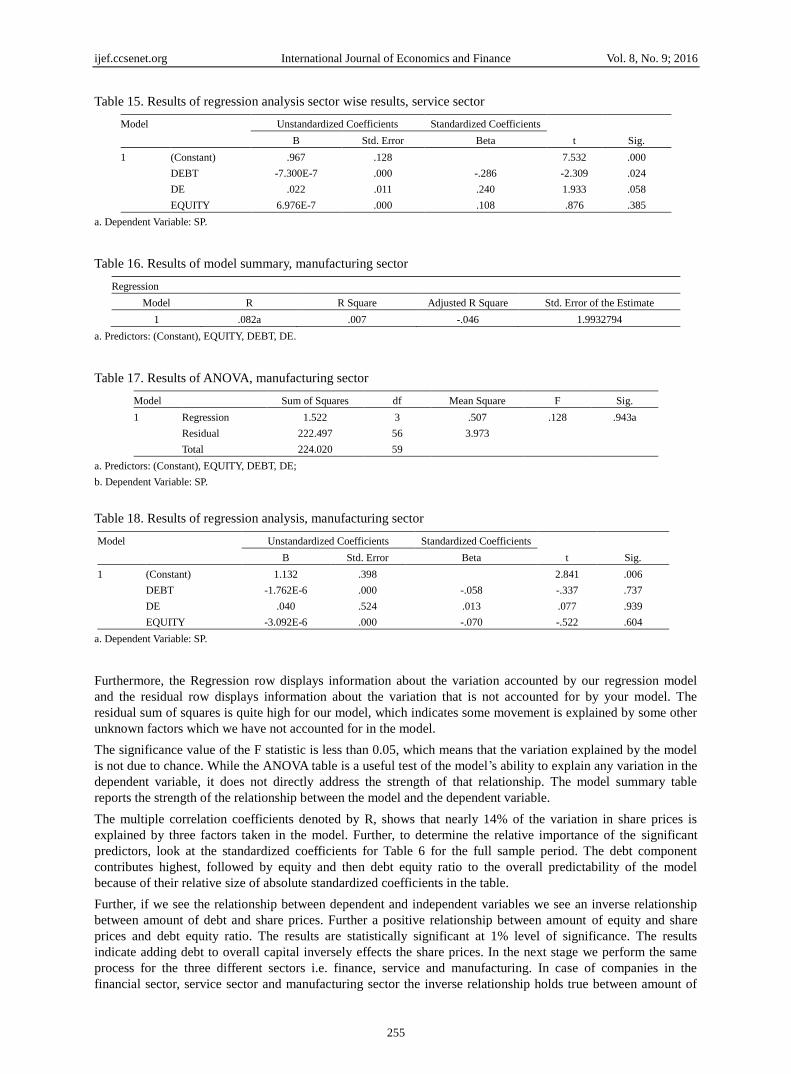
Furthermore, the Regression row displays information about the variation accounted by our regression model
and the residual row displays information about the variation that is not accounted for by your model. The
residual sum of squares is quite high for our model, which indicates some movement is explained by some other
unknown factors which we have not accounted for in the model.
The significance value of the F statistic is less than 0.05, which means that the variation explained by the model
is not due to chance. While the ANOVA table is a useful test of the model’s ability to explain any variation in the
dependent variable, it does not directly address the strength of that relationship. The model summary table
reports the strength of the relationship between the model and the dependent variable.
The multiple correlation coefficients denoted by R, shows that nearly 14% of the variation in share prices is
explained by three factors taken in the model. Further, to determine the relative importance of the significant
predictors, look at the standardized coefficients for Table 6 for the full sample period. The debt component
contributes highest, followed by equity and then debt equity ratio to the overall predictability of the model
because of their relative size of absolute standardized coefficients in the table.
Further, if we see the relationship between dependent and independent variables we see an inverse relationship
between amount of debt and share prices. Further a positive relationship between amount of equity and share
prices and debt equity ratio. The results are statistically significant at 1% level of significance. The results
indicate adding debt to overall capital inversely effects the share prices. In the next stage we perform the same
process for the three different sectors i.e. finance, service and manufacturing. In case of companies in the
financial sector, service sector and manufacturing sector the inverse relationship holds true between amount of

ijef.ccsenet.org International Journal of Economics and Finance Vol. 8, No. 9; 2016
256
debt and share prices. However, the coefficients are larger for companies in financial sector indicating that
borrowing through debt route leads to greater decline in stock prices for manufacturing sector as compared to
other sectors.
7. Discussion and Conclusion
The influence of capital structure on firm value has been among the most debated topic in corporate finance.
Several experts over the years have given different approaches which broadly can be classified into three broader
categories i.e. Net Income Approach (which considered relevance of capital structure), Net Operating Income
Approach (irrelevance of capital structure or capital structure having no impact on firm value) and Traditional
Approach which was a combination of first two approaches. Further, Modigliani and Miller (1958) also assumed
markets to be perfect and absence of taxes, transaction cost etc and therefore anticipated that proportion of
debt-equity did not had any significant impact on the value of the firm. In 1963, Modigliani and Miller gave a
new theory which relaxed the assumption of no taxes and explained that the value of the firm or cost of capital
varied with the variation in the utilization of debt capital due to tax benefits (Baral, 1996). MM considered the
corporate taxes and concluded that due to tax deductibility of interest; the use of debt increases the value of the
firm. Along with that other theories like the static trade-off, the pecking order theory, signalling theory and the
agency theory came into existence in the same context.
The study was an attempt in the same direction and tried to establish a link between capital structure and firm
value in Muscat Securities Market. Along with that the study also examined the level of systemic risk and their
covariation with respect to Muscat stock Index and individual companies listed on the exchange. The study has
attempted to answer these specific questions by taking into account secondary data available on the exchange
website.
After studying the relationship between share prices and capital structure we see an inverse relationship between
amount of debt and share prices. Further a positive relationship between amount of equity and share prices and
debt equity ratio. The results were statistically significant at 1% level of significance. The results indicate adding
debt to overall capital inversely effects the share prices. The results are in tandem to Net Income Approach
which portrays capital structure to influence firm value.
Further, the result also indicates negative perception of investors towards increase in debt and therefore the
market prices decline with the increase in debt. When we explored the same relationship across three different
sectors i.e. finance, service and manufacturing sector we found in case of companies in the financial sector,
service sector and manufacturing sector the inverse relationship holds true between amount of debt and share
prices. However, the coefficients are larger for companies in financial sector indicating that borrowing through
debt route leads to greater decline in stock prices for manufacturing sector as compared to other sectors.
These findings have important implications for managers or people who take decisions regarding capital
structure. The changes in capital structure may have a significant impact on stock prices of the companies in
context of Oman. Therefore, the decisions regarding capital structure should be taken with care so that there is no
negative impact on firm value.
References
Abor, J. (2008). Determinants of the capital structure of Ghanaian firms. Department of Finance University of
Ghana business school legion.
Baltagi, B. H. (2005). Econometric Analysis of Panel Data (3rd ed.). John Wiley & Sons Ltd.
Baral, K. J. (2004). Determinants of capital structure: A case study of listed companies of Nepal. The Journal of
Nepalese Business Studies.
Boodhoo, & Roshan. (2009). Capital Structure and Ownership Structure: A Review Literature. The Journal of
Online Education, New York.
Dann, L. Y., & Wayne, H. M. (1984). Convertible debt issuance, capital structure change and financing-related
information: Some new evidence. Journal of Financial Economics, 13, 157-186.
http://dx.doi.org/10.1016/0304-405X(84)90022-9
Jenson, M. C. (1986). Agency coasts of free cash flow, corporate finance and take over. American Economic
Review, 76, 323-339.
Jenson, M., & Meckling, W. (1976). Theory of the firm: Managerial behaviour agency cost, and ownership
structure. Journal of Financial Economic, 3, 305-360. http://dx.doi.org/10.1016/0304-405X(76)90026-X
ijef.ccsenet.org International Journal of Economics and Finance Vol. 8, No. 9; 2016
257
Kale, K. M., & Walking, R. A. (1996). The impact of industry classifcation on financial research. Journal of
Financial and Quantitative Analysis, 31, 309-355. http://dx.doi.org/10.2307/2331394
Korwar, A. N. (1982). The effect of new issues of equity. University of California.
Lev, B. (1974). On the association between operating leverage and risk. Journal of Financial Quantities Analysis,
627-641. http://dx.doi.org/10.2307/2329764
Masulis, R. W. (1983). The impact of capital structure change on firm value: Some estimates. The Journal of
Finance, 38(1), 107-126. http://dx.doi.org/10.1111/j.1540-6261.1983.tb03629.x
Mickelson, W., & Patrch, M. (1989). Managers voting rights and corporate control. Journal of Financial
Economics, 25, 263-1990. http://dx.doi.org/10.1016/0304-405X(89)90084-6
Modigliani, F., & Merton, H. M. (1958). The cost of capital, corporation finance and the theory of investment.
The American Economic Review, 261-297.
Peterson, M. A., & Rajan, R. G. (1994). The benefts of lending relationship: Evidence from small business data.
The Journal of Finance, 49(1), 3-38. http://dx.doi.org/10.1111/j.1540-6261.1994.tb04418.x
Singal, R. K., & Mittal, R. K. (1992). Determinants of capital structure: A survey. Finance India, 7(4), 883-889.
Stebuleavilya, A. (2007). Do test of capital structure theory mean what they say? Journal of Finance, 62,
1747-1787. http://dx.doi.org/10.1111/j.1540-6261.2007.01256.x
Copyrights
Copyright for this article is retained by the author(s), with first publication rights granted to the journal.
This is an open-access article distributed under the terms and conditions of the Creative Commons Attribution
license (http://creativecommons.org/licenses/by/4.0/).