Embed Size (px)
Citation preview

International Journal of Accounting Research (IJAR) Vol. 2, No. 8, 2015 Publisher: ZARSMI, UAE, and Regent Business School, South Africa
1
IMPACT OF CAPITAL STRUCTURE ON CORPORATE PERFORMANCE: A PRE AND POST CRISIS EVALUATION
OF SELECTED COMPANIES IN US
OLANIYI, Taiwo Azeez 1 (Ph.D; ACA), Corresponding Author 1Department of Accounting, University of Ilorin, Ilorin, Kwara State, Nigeria,
E-mail: [email protected],Phone Number : +2348035771449 ELELU, Muyideen Olanrewaju2 (M.Sc.)
2Department of Accounting and Finance, Birmingham City University, UK E-mail: [email protected]
ABDULSALAM, Tunde Saka3(M.Sc.) 3 Accounting and Finance Department, Kwara State University, Ilorin, Kwara State, Nigeria;
Abstract Capital structure relationship with corporate performance as an unresolved issue became more complicated after the global crisis. This is because of liquidity problems that ensued and firms were looking for strategies of cost reduction and profit increment with a view to enhance performance. This paper examines the impact of capital structure choices (Equity or Debt) on performance of selected firms in US in the pre, during and post crisis periods (2003-2006), 2007-2008 and 2009-2012 respectively) with a view to determine whether or not the relationship between the two variables is period related. Statistically, multiple Regression Model was used to estimate the relationship as performance was measured using Return on Equity (ROE), Return on Assets (ROA), Price per Share (P/E Ratio), Earnings Per Share (EPS) and Tobin’s Q (TQ) while capital structure is proxy by Debt to Equity ratio and Firm size was introduced as control variable using 200 selected listed companies from 10 sectors in the US Stock Exchange. The study finds mixed results such that impact of capital structure on corporate performance depends on the type of performance used and is period related. For instance, higher levels of gearing have negative significant relationship with ROA (-0.362) and (-1.13) before and after the crisis respectively or (-0391) using the pooled data, but a positive significant relationship exist between DE and ROA in the post crisis period other variables shows insignificant relationship. More precisely, a percentage increase in the level of debt brings 46% changes in ROA. Generally capital structure is not a major determinant of corporate performance as it has insignificant impact (15%) on corporate performance of US companies. The study recommends that companies should pay little attention to capital structure but look outwards to human capital development/ managerial efficiency in asset utilization for performance enhancement. Introduction
Financing decision especially capital structure decision which refers to the financial framework comprising the debt and equity maintained by a firm, is one of the important decisions managers make in any organization. The choice of capital structure adopted by a firm
International Journal of Accounting Research (IJAR) Vol. 2, No. 8, 2015 Publisher: ZARSMI, UAE, and Regent Business School, South Africa
2
is fundamentally a financial and marketing problem and it depends on the risk and return characteristics of the firm and / or its management.
A measure of an organizations corporate performance can be viewed from financial and organizational perspectives. Financial performance is in terms of profit maximization, maximizing return on assets and maximizing shareholder return which is built on the company’s efficiency (Tudose 2012). However, valuation of company performance using financial indicators is to be accompanied by a valuation founded on non-financial indicators (organizational perspective): productivity, returns, growth or even customer satisfaction. Good performance translates into job opportunities and if corporate organizations fail to increase performance by ensuring efficient use of capital structure decision, domestically produced goods will become less competitive.
In reality, capital structure of a firm is difficult to determine as financial managers have difficulty in determining an exact optimal capital structure to be adopted; as such, a firm has to issue various securities in a countless mixtures to come across particular combinations (optimal) that can maximize its overall value (San and Heng, 2011). Theoretically, optimal capital structure means a combination of funds which minimizes the weighted average cost of capital (WACC) thereby maximizing the value of the firm. Although, optimal capital structure is a concept that has been discussed variously in the literature, but in reality/practice, no formula or theory has been found that decisively provides optimal capital structure for a firm.
The lack of consensus from theoretical and empirical points of view about what qualify as optimal capital structure had rendered it pertinent and expedient to examine the effect of the debt/equity mix on firm’s performance, primarily because the capital markets that supplies equity funds has become saturated and performing below expectations due to global economic crisis while debt capital is highly risky.
The theory of capital structure is an important reference theory in enterprises financing policy. Whether or not an optimal capital structure exists is one of the most important and complex issues in corporate finance/ financial accounting reporting. How an organization is financed is of paramount importance to both the managers of firms and the providers of funds. This is because if inappropriate mix of finance is employed, the performance and survival of the business may be seriously affected. Unfortunately, most organisations face hurdles in sourcing for funds and in fact, any business organization that opens up itself to external finance is prone to risk due to the associated constraints of repayment.
Previous studies both in Europe, United States and Africa found contradictory results concerning the relationship between capital structure and firms performance. For instance, Zeitun and Tian (2007) and Onaolapo and Kajola, (2010) find a positive relationship, (Luper and Kwanum 2012) obtains a negative relationship but (Ebaid, 2009) concludes that capital structure has a weak-to-no impact on the corporate performance. Thus, researchers still cannot agree on the extent of the impact (San and Heng 2011). In practice, however, the study of Shoaib, (2011) and San and Heng, (2011) finds that most firms do not have optimal capital structure because managers do not have incentive to maximize corporate performance because their compensation is generally not linked to it Taiwo and Olayinka, (2012).
Currently the situation became problematic with the crash of the stock market which led to reduction in value of equity component of a firm’s capital structure while the cost of borrowing keeps increasing. This had left firms running from pillar to post in designing appropriate mix of debt and equity necessary to achieve the ever increasing and differing

International Journal of Accounting Research (IJAR) Vol. 2, No. 8, 2015 Publisher: ZARSMI, UAE, and Regent Business School, South Africa
3
stakeholder’s objectives. This situation had called the academic attention to the following research questions:
(i) is there any relationship between capital structure and corporate performance? (ii) to what extent does capital structure have effect on corporate performance?
(iii) is there an optimal capital structure and if yes, what is it? In an attempt to provide answers to these questions, this study critically evaluate the relationship between capital structure and corporate performance of selected firms in United States in the pre- crisis period, during and in the post crisis period. This allowed us to filter the behavior of firms to equity problems caused by stock market crash. Specifically, the study:
(i) evaluates the different theories on capital structure and their relevance to the post global financial crisis period;
(ii) determines the relationship amongst financing choices; long term debt, short term debt, total debt, equity and their correlation with firms performance measures:
(iii) determine the extent to which capital structure influences corporate performance of US firms
This study is carried out using 200 companies from 20 business sectors in United States of America over a period of ten (10) years ranging from 2003 to 2012. 2.0 Literature Review
Conceptual Framework Capital structure s represents different ways available to a company to finance its
activities. A company can finance its business by only equity, only debt or a mixture of the two. Bank loan, lease financing, bonds and other types of debt can be combined with equity in order to increase the market value of the business and also gain tax shield advantage on the debt (Mahira,2011).
Capital structure decision is one of the most challenging and problematic issues faced in business and thereby it is a most crucial decision companies have to make for its survival (Royal, Salah, Ahmad and Shanaz, 2013). Capital structure of a company should be distinguished from its financial structure. Financial structure refers to how firm’s equity is provided and comprises of both capital structure and short term debts (Myers, 1984).
The concept of performance is a controversial issue in Accounting and Finance, largely due to its multi-dimensional meaning. Performance according to Abbasali, Naser, Alakbar, Elham, Milad, and Pejman, (2012 can be seen from two interrelated perceptive: Accounting measures and market measures. Market performance measure is centered on variable that embroil productivity, returns, growth or even customer satisfaction, while accounting performance is centered on company’s efficiency ( reflected in profit maximization, maximizing return on assets and maximizing shareholder return)
Measurement of performance relied upon the information introduced in the measurement system and the instruments employed (Vernimnent,2009). Thus, the choice of ascertaining performance may be influenced by the company’s objective. However, Accounting performance measures used widely by most researchers include (return on assets and return on equity) (Demsetz1985),( Gorton and Rosen 1995), (Mehran 1995).
However, corporate performance can be summarised to mean a subjective measure of how well a firm can use assets from its primary mode of business and generate revenues. This term is also used as a general measure of a firm's overall financial health over a given period of

International Journal of Accounting Research (IJAR) Vol. 2, No. 8, 2015 Publisher: ZARSMI, UAE, and Regent Business School, South Africa
4
time, and can be used to compare similar firms across the same industry or to compare industries or sectors in aggregation. It was this definition that prompted consideration of alternative measures of performance so that the response of capital structure (CS) to corporate performance (CP) can be statistically established and generalized rather than relying on CS behaviour to a particular performance measure. Theoretical Framework
An appropriate capital structure is a critical decision for managers of any given organization not only because of the need to maximize returns to various organizational constituencies, but also dwell on an organization ability to deal with its competitive environment. Thus, views on the optimal financial structure have varied over time (Tudose2012). Meyers 2001 suggested that all theories on capital structure are “conditional” in the sense that each works out under its own assumptions and propositions. That is, none of the theories can give a complete picture of the practice. The main issues that capital structure literature deals with concern the following questions;
(i) How do firms finance their operations and what are the factors influencing this choice? (ii) Is it possible to increase the firm value just by changing the mix of securities issued? ; (iii)is there an optimal debt –equity combination that maximizes the value of the firm? and
if so, what is it and how is it determined? An attempt to answer these questions led to the following capital structure theories: Modigliani and Miller (M&M) Theory - This theory was published by Franco Modigliani and Merton Miller in 1958 and the believe was that the company level of gearing is independent decision that does not affect the financial structure of the organization in a world of perfect market- a world without taxes, perfect and credible disclosure of all information and no transaction costs associated with raising money or going bankruptcy- the high gearing level in a company would not affect the firms value (Chen 2004). Subsequently, (1963 M&M), taking into account the corporate tax, they underscored the effects of benefits of tax shield of debt; recognizing that leverage can reduce the payment obligations related to corporate tax with the conclusion that the maximum firm value results from being essentially all debt financed. However, Sheikh and Wang, ( 2012), pointed out that the validity of these claims is verified only in the context of pre- established assumptions’ which characterize an ideal situation. Beyond this shortcoming, the ideals they formulated marked the starting point in laying the foundations of modern finance (Tudose, 2012).
Later much research was conducted (Kim 1978, Meyer 2003, Kraus and Litzenberger 1973, Jensen and Meckling 1976) to disprove the irrelevance theory of MM because it works under perfect market but fails under imperfection in the real world situation. As a result, other theories emerge. Static-Trade off Theory - The static trade-off also referred to as the tax based theory, state that optimal capital structure is obtained where the net tax advantages of debt financing balances leverage related costs such as financial distress and bankruptcy, while the firm’s assets and investment decisions are held constant (Baxter and Altman 1984). Thus, a company selects the level of debt that maximizes the total corporate value but Abbasali, et al (2012) was of the view that moderate debts were beneficial at least under the US corporate tax system, while riskier companies should be cautious for larger borrowings; but, a positive relationship exist between the firms leverage and performance (Tudose 2012).
International Journal of Accounting Research (IJAR) Vol. 2, No. 8, 2015 Publisher: ZARSMI, UAE, and Regent Business School, South Africa
5
Agency Cost Theory - The argument of this theory was that when the difference between ownership and control of large firms is increased, it will lead to a decline in investment. The theory was developed on the thought that the interest of shareholders and managers are not accurately aligned (Jensen and Meckling 1976). Hence, the conflicts between shareholders and managers, as well as the conflicts between shareholders and bondholders will raise costs in the firms operating, investing and financing activities. As such, it should be expected that a positive relationship will exist between corporate performance and firm leverage (capital structure) under agency theory. Pecking Order Theory- This is also referred to as the theory of information asymmetry and was proposed by (Meyer 1984). Meyer opined that firms prefer to finance new investment first, internally with retained earnings, then with debt and finally with an issue of new equity; in that order. As such, an optimal capital structure is difficult to define as equity appears at the top and bottom of the pecking order. Internal funds incur no floatation costs and require no disclosure of the firm’s proprietary financial information that may include firm’s potential investment opportunities and gains that are expected to accrue as a result of undertaking such investments. Therefore, more profitable firms should choose less debt because a negative relationship exists between leverage and corporate performance under the pecking order theory (Tudose, 2012). The Market Timing Theory. – This theory, in contrast with the pecking order theory and the trade-off theory claims that ‘market timing’ is the first order determinant of a corporation's capital structure use of debt and equity (Baker and Wurgler 2002). In other words, firms do not generally care whether they finance with debt or equity; they just choose the form of financing which, at that point in time, seems to be more valued by financial markets. Firm issues equity securities when they perceived that their stocks are overvalued and buys it back when they find that shares are undervalued. Historical Background of Capital Structure, Corporate Performance and Financial Crisis. The global financial crisis of 2007/2008 slowdown the pace of economic growth worldwide in terms of depressed stock market, bailout of banks by US government as well as collapse of big financial institutions. Within a short time period, all the sectors of economy are also affected by the crisis which had led to many evictions of firm and this brought an unsatisfied performance by most companies (San and Heng 2011). He pointed out that financial crisis is possible to be strongly connected with corporate poor performance.
While Claessens, Djankov and Xu, (2000) had likened the growing and financing patterns of East Asian companies for the year before crisis with activities of companies in other countries. This globalization had resulted to Indonesia, Malaysia, the Republic of Korea, and Thailand being affected by what obtains in Hong Kong (China) and Singapore. Thus, Suto, (2003) pointed out that the factor that foster economic distress is increased dependency on debt financing, which had led to surplus investment before the crisis and also instability in the Malaysia economy.
Antonio, Guney, Paudyal, (2002) evaluates the impact of financial crisis on the capital structure and finds that by having a low leverage; Turkey’s companies protect themselves against financial crisis. The growth of capital markets is crucial for high leverage companies because they are close to economic distress. This situation had led to high cost of debt for high leverage companies in the post-crisis era relative to the pre-crisis era when it was low. The result had also shown that returns of high leverage companies can be raised by either issue of equity or decrease in debt. But, debt for high leverage companies cannot be decreased as this will make them unable to make profit through the ordinary operations in the post-crisis era.

International Journal of Accounting Research (IJAR) Vol. 2, No. 8, 2015 Publisher: ZARSMI, UAE, and Regent Business School, South Africa
6
No wonder why the stock market crash as a result of global financial crisis will definitely have implication on company’s performance during and in the post crisis period. Hence, the need to evaluate what impact capital structure has on performance in the during the crisis, and in the pre and post crisis periods.
Empirical Evidence Company’s performance is meaningfully affected by many factors and capital structure is
one of the important factors amongst them. The literature is replete with studies on the relationship between capital structure and company performance but with mix outcomes. Butt, (2010) study the relationship between company performance and financial management practices like capital structure decision, dividend policy, investment appraisal techniques, working capital management and financial performance measures in Pakistani business sector. The results show a positive and significant relationship between financial management practices and corporate performance in Pakistani business sector. Margaritis and Psillaki, (2010) studied a sample of French firms from low to high growth industries to investigate the relationship between efficiency, leverage and ownership structure. The study reveals that higher leverage is associated with improved efficiency over the entire range of observed data. Chowdhury and Chowdhury, (2010) found out that strong positive correlation is evident from the empirical study when stratified by industry. This can be an important policy suggestion for finance director because they can use debt to form optimal capital structure to maximize wealth of shareholders.
It was shown in the studies of Ahmad, et al (2012), Boroujeni et al (2013), Nadeesha and Pieris (2014), and Sekar et al (2014) that only short term debt and total debt have significant relationship with ROA while all capital structure indicators have significant relationship with ROE.
Specifically, Abur-rub, (2012) study twenty-eight companies listed on the Palestinian Stock Exchange between 2006 to 2010 through the use of accounting and market performance measures (ROE, ROA, EPS, Market value to book value of equity and Tobin’s Q) and four capital structure measures (STD, LTD, Total debt to total assets and Total debt to total equity). The results showed a positive significant relationship between firm’s capital structure and their performance. This result is at variance with (Ruan et al (2011), Cheng and Tzeng (2011) but agrees with that of (Olorunfemi and David 2010).
Olorunfemi and David, (2010) carried out a study on firms operating in Nigerian petroleum industry and find a positive relationship between EPS, DPS and leverage ratio and finds leverage ratio having significant impact on both EPS and DPS.
Alternatively, Ebaid, (2009) evaluates the impact of capital structure choice on firm performance using a sample of non-financial companies listed on Egyptian Stock Exchange Market from 1997 to 2005 using three accounting based measures of financial performance (ROE, ROA, and Gross profit margin). His finding showed an insignificant relationship between all measures of capital structure and return on equity, as well as gross profit margin.The results were consistent with those of Mahira, (2011), Mumtaz et al (2013).
Onaolapo and Kajola, (2010) carried out a research on 30 non-financial firms listed on the Nigerian Stock Exchange over a period of eight years (2001-2007). With the use of return on assets (ROA) and return on equity (ROE) as performance measures, and debt ratio as capital structure measure, they found a significant negative impact of debt ratio (DR) on ROA and ROE. The result was in support of the agency cost theory.

International Journal of Accounting Research (IJAR) Vol. 2, No. 8, 2015 Publisher: ZARSMI, UAE, and Regent Business School, South Africa
7
Osuji and Odita (2012) carried out a study on 30 non-financial firms listed on Nigerian Stock Exchange from 2004-2010. The result of their research showed that capital structure represented by debt ratio had a significant negative impact on firms’ financial performance.
Sheikh and Wang (2013), examined 240 non-financial firms listed on the Karachi Stock Exchange (KSE) Pakistan over a span of six years from 2004-2009. The performance measures used by them were accounting based (ROA, Total debt ratio, Long and Short-term debt ratio) and market based measure (market-to- book value ratio). Empirical outcomes show that all measures of capital structure (total debt ratio, long and short term debt ratio) are negatively related to return on assets. Additionally, total debt ratio and long-term debt ratio are negatively related to market-to- book ratio.
Dadson and Jamil (2012) examined the relationship between capital structure and performance of listed banks in Ghana from 2000 to 2010. The results revealed that banks listed on the Ghana Stock Exchange are highly geared and this is negatively related to the banks’ performance. The regression result also revealed that capital structure is inversely related to performance of the listed banks in term of ROE and Tobin’s Q. Another study by Pratheepkanth (2011) business companies in Sri Lanka from 2005 to 2009 using regression analysis finds that return on investment (ROI) and return on asset (ROA) have negative relationships with capital structure. This findings is also similar to that of Min Tsung Cheng (2009)
Min Tsung Cheng (2009) evaluates the effects of debt and equity financing on corporate performance revealing that capital structure have significantly negative consequence on corporate performance. Henceforth, the study shows that it is risky for companies to depend entirely on either debt or equity for raising capital but it is far better to raise capital by both methods, with each employed together, at the same time. This method is better as it affords the benefit of one method offsetting the problems of the other and vice versa.
On the other side, some empirical studies have shown no significant relationship or mixed evidence between capital structure and firm performance. For instance, Chowdhury and Chowdhury (2010) examined the impact of capital structure on the value of firm using 77 non-financial firms from four different key sectors of Bangladesh capital market. The study conclude that the best use of wealth of shareholders needs a perfect mixture of debt and equity, while cost of capital has a negative correlation in this decision and it has to be as minimum as possible. It was further seen that by changing the capital structure composition a firm can increase its value in the market.
Margaritis and Psillaki (2010) using a sample of French firms from low- and high-growth industries, consider both the effect of leverage on firm performance as well as the reverse causality relationship while controlling for the effects of ownership structure and ownership type. The study finds no evidence that ownership type has an effect on leverage choices.
San and Heng, (2011) focused on 29 construction companies which are divided into big, medium and small sizes based on paid-up capital in Malaysia. The result reveals mixed results among the capital structure variables and corporate performance.
Also, Saeedi and Mahmoodi (2011) made use of four performance measures (ROA, ROE, EPS and Tobin’s Q) as dependent variables and long term debt, short term debt and total debt ratio as independent variables. The research was on 320 companies listed on the Tehran Stock Exchange over a period of eight years (2002 to 2009). The result indicates capital structure having a positive and significant relationship with Tobin’s Q and EPS, a negative relationship with ROA and no significant relationship with ROE. These results were similar to Uwalomwa and Uadiale, (2012), Ahmad et al (2012) and Hassan et al (2014).

International Journal of Accounting Research (IJAR) Vol. 2, No. 8, 2015 Publisher: ZARSMI, UAE, and Regent Business School, South Africa
8
Taking these mixed and conflicting results into consideration, Ahmad et al (2012) found out that STD and TD have significant relationship with ROE and for corporate performance ROE is significant to all indicators of capital structure. Boroujeni et al (2013) complements Ahmad et al (2012) results when return on assets ROA as performance measure was reported to have a positive impact on capital structure indicators (TD, LTD) and other ratios. Similar results were documented by Abu-rub (2012) when ROE, ROA, EPS, market value to book value of equity and Tobin’s Q performance measures show positive and significant relationship with firms capital structure measures (STD, LTD, Total debt to assets and Total debt to total equity).
Moreover, Ebaid, (2009) shows that STD and TD had negative impact on firms performance measured by ROA while Luper and Kwanum (2012) documented similar results. However, Saeedi and Mahmoodi (2011) reveals mixed results as Tobin’s Q and EPS had a significant positive relationship with capital structure while ROA and ROE has no significant relationship with capital structure.
These measures are also adopted in this study in addition to Tobin’s Q and Firm Size with a view to determine which performance measures do capital structure responds.
Summarily, discussion of the relationship between capital structure and corporate performance is unending and had generated heated controversies. Unfortunately, the global crisis that rocked the American economy also changed the performance structure as well as capital structure contents and decisions of most firms. Thus, an updated analysis of this relationship before, during and after the global crisis will clarify the trend of that relationship. More so, this kind of study is to our knowledge very rare if not close to non-existent. 3.0 Methodology Model Specification Multiple regression analysis was used to determine the relationship between corporate performance (dependent variable) and capital structure independent variable). The measures of corporate performance used include Return on Asset, Return on Equity, Price per Share as well as Earnings per Share and Tobin’s Q while capital structure is proxy by debt to equity ratio and firm size was introduced as control variable. The model for this relationship is presented as follows:
3 1 3, 2
3 3 3 4
3 5 Where: ROEi,t = Return on Equity (Profit after tax /Shareholders equity) for firm i to time t; ROAi,t = Return on Assets(Profit after tax /Total assets) for firm i to time t; PEi,t = Price per Share to Earnings per Share (market value price per share/earning per share) for firm i to time t; TOQi,t = Market Value to Book Value of Equity (Total market value/Total asset value) for firm i to time t; SHPi,t = Share Price at the end of the year for firm i to time t βo= is the intercept (constant), β1 & β2 = Coefficient of the independent variable for the ith firm at time t,
International Journal of Accounting Research (IJAR) Vol. 2, No. 8, 2015 Publisher: ZARSMI, UAE, and Regent Business School, South Africa
9
DEi,t = Total debt to equity (Total debt/Total equity) ratios for the ith firm at time t, FSi,t = Firm size (The market value) for firm i in time t and µi,t = Error term. This model is guided by the assumption that the provisional mean function is linear :£(Ý/X)=βo+β1X. 3 6 However, because more than one forecaster variable is obtainable led to the following ‘multiple regression” mean function: £(Y/X) =βo+β1 X1i,t+…….βpXpi,t + µi,t. 3 7 Where Xi,t is for t term predictor variable and it measures the i term of observation. The key assumptions for the error £µi = 0 and variance (µi) = α² (all variances are equal) and the µi is independent of each other. Thus, a multiple regression analysis is carried out to predict the values of a dependent variable, Y, given a set of (p) explanatory variables (X1, X2 ……..XP).
The Study Variables In line with the relationship presented in the model specification, the relevant variables are Income Statement and Statement of Financial Position (SFP) variables: ROE, ROA, PE, TOQ, DE, FST and SHIP all derivable from Annual Reports and Accounts of the selected companies which had been compressed and made available on DataStream of the University website.
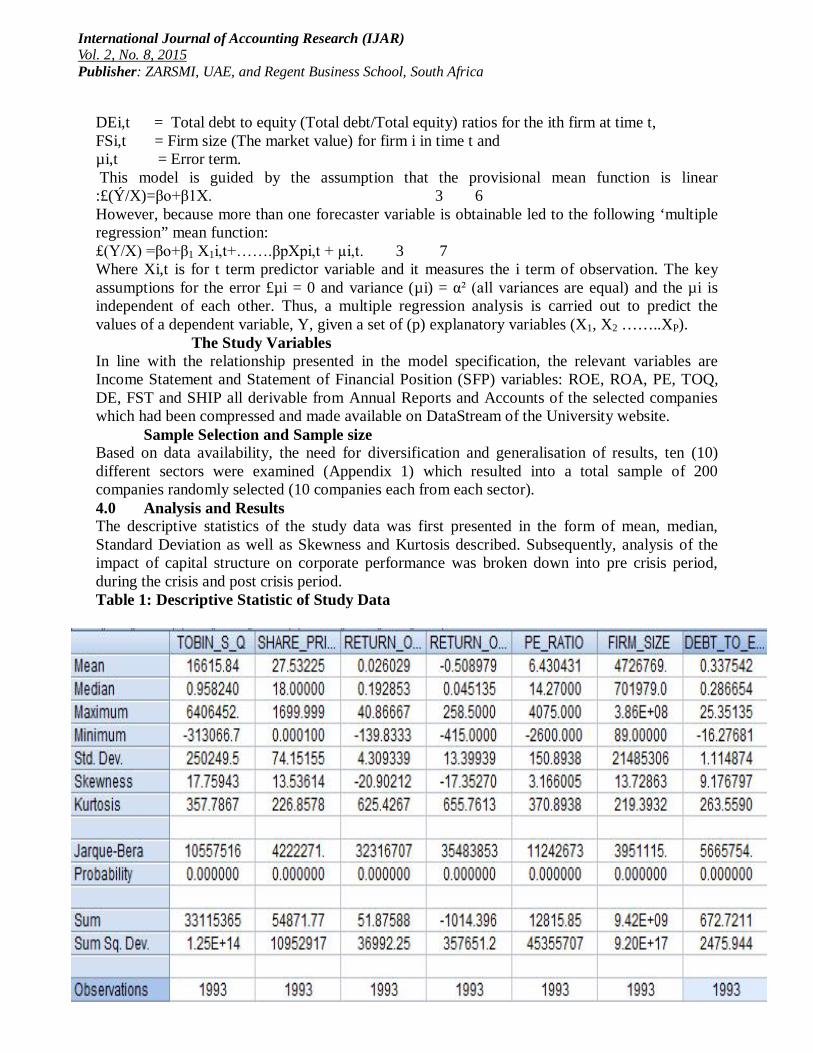
Sample Selection and Sample size Based on data availability, the need for diversification and generalisation of results, ten (10) different sectors were examined (Appendix 1) which resulted into a total sample of 200 companies randomly selected (10 companies each from each sector). 4.0 Analysis and Results The descriptive statistics of the study data was first presented in the form of mean, median, Standard Deviation as well as Skewness and Kurtosis described. Subsequently, analysis of the impact of capital structure on corporate performance was broken down into pre crisis period, during the crisis and post crisis period. Table 1: Descriptive Statistic of Study Data
International Journal of Accounting Research (IJAR) Vol. 2, No. 8, 2015 Publisher: ZARSMI, UAE, and Regent Business School, South Africa
10
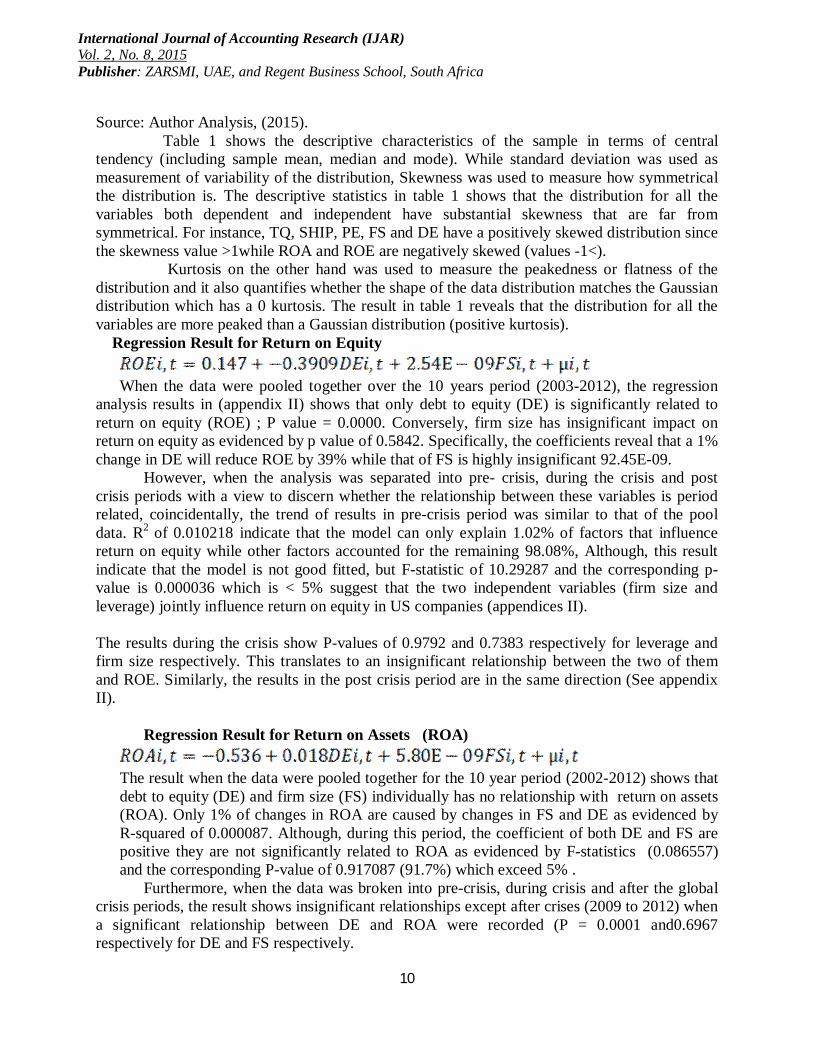
Source: Author Analysis, (2015). Table 1 shows the descriptive characteristics of the sample in terms of central tendency (including sample mean, median and mode). While standard deviation was used as measurement of variability of the distribution, Skewness was used to measure how symmetrical the distribution is. The descriptive statistics in table 1 shows that the distribution for all the variables both dependent and independent have substantial skewness that are far from symmetrical. For instance, TQ, SHIP, PE, FS and DE have a positively skewed distribution since the skewness value >1while ROA and ROE are negatively skewed (values -1<). Kurtosis on the other hand was used to measure the peakedness or flatness of the distribution and it also quantifies whether the shape of the data distribution matches the Gaussian distribution which has a 0 kurtosis. The result in table 1 reveals that the distribution for all the variables are more peaked than a Gaussian distribution (positive kurtosis). Regression Result for Return on Equity
When the data were pooled together over the 10 years period (2003-2012), the regression
analysis results in (appendix II) shows that only debt to equity (DE) is significantly related to return on equity (ROE) ; P value = 0.0000. Conversely, firm size has insignificant impact on return on equity as evidenced by p value of 0.5842. Specifically, the coefficients reveal that a 1% change in DE will reduce ROE by 39% while that of FS is highly insignificant 92.45E-09. However, when the analysis was separated into pre- crisis, during the crisis and post crisis periods with a view to discern whether the relationship between these variables is period related, coincidentally, the trend of results in pre-crisis period was similar to that of the pool data. R2 of 0.010218 indicate that the model can only explain 1.02% of factors that influence return on equity while other factors accounted for the remaining 98.08%, Although, this result indicate that the model is not good fitted, but F-statistic of 10.29287 and the corresponding p-value is 0.000036 which is < 5% suggest that the two independent variables (firm size and leverage) jointly influence return on equity in US companies (appendices II). The results during the crisis show P-values of 0.9792 and 0.7383 respectively for leverage and firm size respectively. This translates to an insignificant relationship between the two of them and ROE. Similarly, the results in the post crisis period are in the same direction (See appendix II). Regression Result for Return on Assets (ROA)
The result when the data were pooled together for the 10 year period (2002-2012) shows that debt to equity (DE) and firm size (FS) individually has no relationship with return on assets (ROA). Only 1% of changes in ROA are caused by changes in FS and DE as evidenced by R-squared of 0.000087. Although, during this period, the coefficient of both DE and FS are positive they are not significantly related to ROA as evidenced by F-statistics (0.086557) and the corresponding P-value of 0.917087 (91.7%) which exceed 5% .
Furthermore, when the data was broken into pre-crisis, during crisis and after the global crisis periods, the result shows insignificant relationships except after crises (2009 to 2012) when a significant relationship between DE and ROA were recorded (P = 0.0001 and0.6967 respectively for DE and FS respectively.

International Journal of Accounting Research (IJAR) Vol. 2, No. 8, 2015 Publisher: ZARSMI, UAE, and Regent Business School, South Africa
11
Regression Result for P/E Ratio.
Analysis of performance using PE ratio shows no statistically significant relationship
DE and FS. The supporting statistics are: P= 0.6114, Coeff = -1.543610, and t= -0.508151 for DE while FS has P = - 0.5305, coeff = 9.89E-08,and t-statistic of 0.627787. Thus, between 2003 and 2012 neither DE nor FS can explain performance of US companies measured by P/E ratio. More so, the F-statistic of 0.310518 and prob(F-Statistics) of 0.733102 (73%) indicate that the two independent variables cannot jointly determine or influence P/E ratio of companies in US.
Though the coefficient of DE is negative while that of FS is positive, none of the variables is significant related to the P/E ratio. Furthermore, in a period by period analysis of pre-crisis, during crisis and after crisis, evidence reveals an insignificant relationship between the variables. (See appendix II).
Regression Result for Tobin’s Q.
The estimated regression using this model with combined (2000) sample sizes shows that there is no significant relationship between capital structure and company performance. This inference was drawn from P-value (probability) of 0.7904, Coefficient of 1338.552 and t-statistic of 0.265870 for debt to equity while firm size has P-value (probability) is 0.8746 (87.5%), coefficient of 4.12E-05 and a negative t-statistic of -0.158120. These statistics indicate that neither DE nor FS can influence the outcome of Tobin’s Q of US companies.
Although, the coefficient sign result for firm size is negative while the debt to equity is positive but since none of the two variables are significantly related to the dependent variable, the signs are irrelevant.
Furthermore, the researcher split the data used in to pre-crisis, during crisis and after crisis periods. The result for all the periods shows an insignificant relationship between the variables. (See appendix II).
Regression Result for Shares Price
The estimated regression here as revealed in (appendix II) shows that share price has no
significant relationship with either DE or FS. Evidence from P-value (probability) coefficient value, standard error and t-statistic suffices. More so, the F-statistic is 1.102470 with the corresponding P-value of 0.332252 (33.2%) that is greater than minimum 5% allowed indicates that the impact of DE and FS on share prize is only 1%.
Furthermore, the pre-crisis and after crisis assessment of these relationships shows an insignificant relationship between (debt to equity and firm size) on share prices while a significant relationship (4.79) was revealed during the crisis using four hundred (400) observation between 2007 to 2008.
The summary of the findings discussed is presented in table 2 Table 2: Summary of Findings (a) Performance Measures
Study Period NO. of Observation Impact of Debt to Equity on Performance
Impact of Firm Size on Performance
ROE 2003-2013 2000 Full Data ↓ X 2003-2006 796 Before Crisis ↓ X

International Journal of Accounting Research (IJAR) Vol. 2, No. 8, 2015 Publisher: ZARSMI, UAE, and Regent Business School, South Africa
12
2007-2008 400 During Crisis X X 2009-2013 799 After Crisis ↓ X ROA 2003-2013 2000 full data X X
2003-2006 796 Before Crisis X X 2007-2008 400 During Crisis X X
2009-2013 799 After Crisis ↑ X P/E RATIO 2003-2013 2000 Full Data X X 2003-2006 796 Before Crisis X X 2007-2008 400 During Crisis X X 2009-2013 799 After Crisis X X TOBINS, Q 2003-2013 2000 Full Data X X 2003-2006 796 Before Crisis X X 2007-2008 400 During Crisis X X 2009-2013 799 After Crisis X X SHARE PRICE
2003-2013 2000 Full Data X X
2003-2006 796 Before Crisis X X 2007-2008 400 During Crisis ↑ X 2009-2013 799 After Crisis X ↑ Source: Author’s Analysis (2015). KEY ↓=; Negative significant relationship. ↑=; Positive significant relationship X =; Insignificant relationship Table 2: Summary of Findings (b)
PerformanceD/E Firm Size D/E Firm Size D/E Firm Size D/E Firm Size
ROE ↓ x x x ↓ x ↓ xVALUE -0.362 -1.13 -0.391
ROA x x x x ↑ x x xVALUE 0.456
P/E Ratio x x x x x x x xVALUE
Tobin's Q x x x x x x x xVALUE
Share Price x x ↑ x x ↑ x xVALUE 7.49 2.96
Before Global Crisis During the Crisis After Global Crisis Total
Source: Author Analysis, (2015).

International Journal of Accounting Research (IJAR) Vol. 2, No. 8, 2015 Publisher: ZARSMI, UAE, and Regent Business School, South Africa
13
↓= Negative Significant relationship ↑= positive Significant relationship X = Insignificant relationship.
Discussion of Findings Tables 2a and 2b shows that performance of USA companies (using any of : ROA, ROE, PE, TQ and SP) is unaffected by capital structure (measured by Firm Size) for all the periods (2003-2012). The absence of any relationship remains the same for periods before the global financial crisis and during the crisis period except in the post crisis periods (2008-2012) when capital structure (firm size) exerts significant positive impact (2.96) on company performance measured by share prices. This might be because share prices began to reflect and take into consideration other factors apart from share purchase frequencies, number of deals on the Exchange and dividend pay-out ratio in the post crisis period contrary to what obtains previously. Conversely, DE exhibits mixed result for different periods and for different measures of performance. Specifically, debt to equity (DE) has negative significant impacts (-0.391, -0.362 and -1.13) on ROE when the whole data was pooled together (2003-2012), before the crisis (2003-2006) and after the crisis (2008-2012). It was only during the crisis period that insignificant relationship was observed between performance and capital structure. It was of much interest to note that DE has highest impact on performance after the global crisis period. This might be because interest elements are paid before equity owners get their rewards and perhaps investors became sensitive to the gearing structure of companies prior to taking investment decisions. This result is similar to findings of Onaolapo and Kajola (2010), Manawaduge et al (2011), Pratheepkanth (2011), Pouraghajan et al (2011) who all concluded that higher levels of gearing have negative relationship with return on equity. Other studies that supported these findings include: Dedson and Jamil (2012), Osuji and Odita (2012), Taiwo (2012), Olokoyo (2012), Luper and Kwanum (2012) as well as Royal et al (2013), Sheikh and Wang (2013) who all reported a negative significant relationship between capital structure and corporate performance.
The trend of results obtained for P/E ratio and Tobin’s Q were similar as insignificant relationship was observed for the three periods (before, after and during the crisis). Even when the data were pooled together between 2003-2012, there was still no significant relationship between capital structure and performance of non-financial companies in the USA. However, using ROA as performance indicator, DE shows a positive (0.456) significant impact on performance in the post crisis period. This result is supported by findings of Olorunfemi and David (2010) and Cheng and Tzeng (2011) which reported a positive significant relationship between ROA and total debt to equity. It is however the same with the results of (Abur-rub 2012 and Ahmad et al 2012) who find a positive relationship among debt to equity and return on assets. The latest results of (Boroujeni et al 2013 and Nadeesha and Pieris, 2014 show a positive significant relationship between higher levels of gearing and return on assets.
Moreover, insignificant relationship was observed during and before the global crisis periods. More so, when the crisis period was factored out and data were believed to behave in the same way (pooled together), yet, insignificant relationship was exhibited between company’s performance and capital structure.

International Journal of Accounting Research (IJAR) Vol. 2, No. 8, 2015 Publisher: ZARSMI, UAE, and Regent Business School, South Africa
14
In the same vein, for all the periods, DE has insignificant impact on performance measured by share price except during the crisis when a positive significant impact (7.49) was recorded. Share price as a measure of corporate performance has positive significant relationship with debt and equity during the crisis and positively significantly related to firm size after the crisis. This result was in-line with Chowdhury and Chowdhury, (2010) as they found out that by stratifying industry, the share price of the company will have strong positive correlation. In summary, the study showed that capital structure has no effect on corporate performance since only the return on equity has negative relationship with capital structure while other performance measures showed an insignificant relationship with capital structure. This conclusion is supported by the market timing theory which claims that ‘market timing’ is the first order determinant of a corporation's capital structure use of debt and equity. Meanwhile, firms do not generally care whether they finance with debt or equity; they just choose the form of financing which, at a point in time, seems to be more valued by financial markets. 5.0 Conclusion and Recommendation In line with the analysis carried out taking into consideration the fact that global economic crises slowdown economic growth worldwide and its effect on performance of most companies, the study data were grouped into four main categories: before the crisis (2003 to 2006), during the crisis (2007 to 2008), after the crisis (2009-2012) and the pooled total data (2003 to 2012), the following conclusions were reached: i. higher levels of gearing have negative significant relationship with corporate performance when measured by return on equity (ROA) before the crisis (-0.362) after the crisis (-1.13) and in total using the pooled data (-0391). (ii) there exist a positive significant relationship between capital structure (measured by debt to equity: DE) and corporate performance (measured by return on assets: ROA) after the crisis period. More precisely, a percentage increase in the level of debt brings 46% changes in return on assets. (iii) however, generally capital structure has insignificant impact (15%) on corporate performance of US companies. Thus, capital structure is not a major determinant of corporate performance of US non-financial companies.
In line with findings of this study which reveal that capital structure has negative significant impact on return on equity and insignificant impact on other corporate performance measures, the following were recommendations offered:
i. Companies should pay little attention to capital structure as it not a major determinant of corporate performance.
ii. Attention should be shifted to underlying efficiency with which inputs are converted to outputs in corporate organizations (human capital development/ managerial efficiency in asset utilization for performance enhancement instead of relying on capital structure mixture.
References Abbasali, P, Naser, A., Alakbar, R., Elham, M, Milad, E. & Pejman, M (2012). The Relationship
Between Capital Structure and Firm Performance Evaluation Measures: Evidence from Tehran Stock Exchange. International Journal of Business and Commerce, 1(9):166-181.
Abu-Rub, N. (2012). Capital Structure and Firm Performance: Evidence from Palestine Stock Exchange. Journal of Money, Investment and Banking, 23, 109-117.

International Journal of Accounting Research (IJAR) Vol. 2, No. 8, 2015 Publisher: ZARSMI, UAE, and Regent Business School, South Africa
15
Ahmad, Z. et al. (2012). Capital structure effect on firm performance: focus on consumers and industrial
sectors onMalaysian Firms, International Review of Business Research Papers, 8(5): 137 Ali, K., Akhtar, M.F. and Sadaqat, S. (2011). “Practical implication of capital structure theories: empirical
evidence from the commercial banks in Pakistan”, European Journal of Social Science, 23(1): 165-173.
Antonio, A., Guney, Y., & Paudyal, K. (2002). Determinants of Corporate Capital Structure: Evidence From European Countries. Centre for Empirical Research in Finance
Baker, M. & Wurgler, R. (2002). Market Timing and Capital Structure. Journal of Finance 57, 1-32. Baxter, N.D. (1967). Leverage, the Risk of Ruin and the Cost of Capital. Journal of Finance, 22(3), 395-403. Boroujeni, H. N., Noroozi, M., Nadem, M. & Chadegani, A. (2013). The Impact of Capital Structure and
Ownership Structure on Firm Performance: A Case Study of Iranian Companies. Research Journal of Applied Sciences, Engineering and Technology, 6(22):4265-4270).
Butt, B. Z., Hunjra,I.H.& Rehma,.K.U.(2010). Financial Management Practices and Their Impact on
Organizational Performance.World Applied Sciences Journal, 9 (9), 997-1002. Chen, J. J. (2004). Determinants of Capital Structure of Chinese Listed Companies. Journal of
Business Research, 57: 1341-1351. Cheng Ming, Tzeng Zuwei(2011). How Does Ownership Structure Effect Capital Structure and Firms Performance ?Evidence from Taiwan, Global Review of Accounting and Finance 2( 2): 61-81. Claessens, S., Djankov, S. & Xu, L. C. (2000). Corporate Performance in the East Asian Financial Crisis.
The World Bank Research Observe, 15(1), 23-46. Chowdhury, A., & Chowdhury, S. P. (2010). Impact of capital structure on firm’s value: Evidence from
Bangladesh. Business and Economic Horizons, 3(3), 111–122. http://dx.doi.org/10.15208/beh.2010.32
Dadson, A., & Jamil, B., (2012). Capital Structure and Performance of Listed Banks in Ghana. Global Journal of Human Social Science, 12(5):57-62.
Demsetz, H. & Lehin, K. (1985). The Structure of Corporate Ownership: Causes and Consequences. Journal of Political Economy, 93:1155-1177.
Ebaid, I. E. (2009). The Impact of Capital Structure Choice on Firm Performance: Empirical Evidence from Egypt. Journal of Risk Finance, 7:479-487.
Gorton, G., & Rosen, R. (1995). Corporate Control, Portfolio Choice, and the Decline of Banking. Journal of Finance, 50:1377-1420.
Hassan, M.B., Ahsan, A.F.M, Rahaman, M.E. & Alam, M.N.(2014). Influence of Capital Structure on
Firm Performance: Evidence from Bangladesh, International Journal of Business and Management. 9( 5):184-194.
International Journal of Accounting Research (IJAR) Vol. 2, No. 8, 2015 Publisher: ZARSMI, UAE, and Regent Business School, South Africa
16
Jensen, M. & Meckling, W. (1976). The Theory of the Firm: Management Behaviour, Agency Costs and Capital Structure. Journal of Financial Economics, 3(1): 305-360.
Kim, E. (1978). A Mean-Variance Theory of Optimal Capital Structure and Corporate Debt Capacity. Journal of Finance, 33: 45-63.
Kraus, A., & Litzenberger, R. H. (1973). A State –Preference Model of Optimal Financial Leverage. Journal of Finance, 28:911-922.
Luper, L. & Kwanum, I. M. (2012). Capital Structure and Firm Performance: Evidence from Manufacturing Companies in Nigeria. International Journal of Business and Management Tomorrow,2 (5): pp 1-7.
Mahira, R. (2011). Effect of Profitability and Financial Leverage on Capital Structure: A Case Study of Pakistans Automobile Industry. Journal of Economics Review, 1( 4): 50-58.
Manawaduge, A., Zoysa, A. D., Chowdhury, K. & Anil, C. (2011). Capital Structure and Firm Performance in Emerging Economies: An Empirical Analysis of Sri Lankan Firms. Corporate ownership and control, 8 (4):253-263.
Margaritis, D., Psillaki, M. (2009). Capital structure, equity ownership & firm performance, Journal of Banking & Finance, 34 (3): 621-632. Mehran, H. (1995). Executive Compensation Structure, Ownership and Firm Performance.
Journal of Finance Economics, (38):163-184 Min-Tsing, C. (2009). Relative Effects of Debt and Equity on Corporate Operating Performance:
A Quantile Regression Study Modigliani, F. & Miller, M. (1958). The Cost of Capital, Operation Finance and Theory of
Investment. American Economic Review,48:261-297. Modigliani, F. and Miller, M. (1963). Corporate income taxes and the cost of capital: a
correction. American Economic Review, 53: 443-453. Mumtaz, R., Rauf, S.A., Ahmad, B., & Noreen, U. (2013). Capital Structure and Financial Performance: Evidence from Pakistan (Kse 100 Index), Journal of Basic and Applied
Scientific Research, 3(4):113-119. Myers, S. (1977). Determinants of Corporate Borrowing. Journal of Financial Economics, 5:
147-175. Myers, S. (1984b).The Capital Structure Puzzle, Journal of Finance, 39:575-592. Myers, S. (2001). Capital Structure. Journal of Economic Perspectives, 15:81-102. Nadeesha, D.H.D & Pieris, T.S.G. (2014). The Impact of Capital Structure Choice on Firm
Performance in sri lanka: Empirical Evidence from the Colombo Stock Exchange, Proceedings of the Peradeniya University. International Research Sessions, Sri Lanka.
Onaolapo, A. A. andKajola, S. O. (2010). Capital Structure and Firm Performance: Evidence from Nigeria. European Journal of Economics, Finance and Administrative Sciences, Issue 25:70-77.
Olorunfemi, S. & David, D. F. (2010). Capital Structure and Corporate Performance in the Nigeria Petroleum Industry. Journal of Mathematics and Statistics,.6(2):168-173.
Osuji, C.C., & Odita, A. (2012). impact of capital structure on the financial performance of Nigerian firms , Arabian Journal of Business and Management Review (OMAN Chapter)
1(12) :43-61. Pratheepkanth, P. (2011). Capital Structure and financial Performance: Evidence from selected Business

International Journal of Accounting Research (IJAR) Vol. 2, No. 8, 2015 Publisher: ZARSMI, UAE, and Regent Business School, South Africa
17
Companies in Colombo Stock Exchange, Sri Lanka, Journal of Arts, Science and Commerce,
2(2), 171-173. Raijan, Y. G. and Zingales, L. (1995). What Do We know About Capital Structure? Some
Evidence from International Data. Journal of Finance,(50):1421-1460. Royal, D., Salah, M., Ahmad, G. & Shanaz, F. (2013). The Relationship Between Financial
Flexibility and Capital Structure Decisions. Journal of Applied Sciences, Engineering and Technology, 5(14):3843-3850.
Saad, N. M (2010). Corporate Governance Compliance and Effects on Capital Structure. International Journal of Economics and Financial, 2(1):105-114.
Saeedi, A & Mahmoodi, I. (2011). Capital Structure and Firm Performance: Evidence from Iranian Companies, International Research Journal of Finance and Economics,1, 70.
San, O. T & Heng, T. O. (2011). Capital Structure and Corporate Performance of Malaysian Construction Sector. International Journal of Humanities and Social Sciences,1(2):28-37.
Sheikh, N.A & Wang, Z. (2013). The Impact of Capital Structure on Performance: An Empirical Study of Non-Financial Listed Firms in Pakistan. International Journal of Commerce and Management, 23 (4):354-368.
Shoaib, M. M. (2012). Impact of Capital Structure on Firms’ Financial Performance: Evidence from Pakistan. Journal of Finance, 17(5):56-101.
Suto, M. (2003). Capital Structure and Investment Behaviour of Malaysian Firms in the 1990s: A study of Corporate Governance Before the Crisis. Corporate Governance. An International Review , 11(1), 25–39. Taiwo, A. & Olayinka, A. (2012). Profitability and Leverage: Evidence from Nigerian Firms.
Global Journal of Business Research, 6(1):17-22. Tsuji, C. (2011). A Survey of the Trade-off Theory of Corporate Financing. Journal of Business
and Management Review, 1(6):102-107. Tudose, M. B. (2012). Capital Structure and Corporate Performance. Economy
Transdisciplinarity Cognition,15(2):76-82. Uwalomwa, U., & Uadiale, O.M.(2012). An Empirical Examination of the Relationship between
Capital Structure and the Financial Performance of Firms in Nigeria, EuroEconomica, 1(31):57-
65. Vernimment, P. (2009). Finance d “entreprises, 7th edition, Dalloz Publishing House, Paris, pp
681-695. Zeitun, R. and Tian, G. (2007). Capital Structure and Corporate Performance: Evidence from
Jordan. Australian Accounting and Finance Journal, 1(4):40-67.

International Journal of Accounting Research (IJAR) Vol. 2, No. 8, 2015 Publisher: ZARSMI, UAE, and Regent Business School, South Africa
18
Appendix 1: Classification of Companies Selected SERIAL NUMBER
INDUSTRY/ SECTORS NUMBER OF FIRMS SAMPLED
01 GENERAL INDUSTRY 20 COMPANIES 02 CHEMICAL INDUSTRY 20 COMPANIES 03 CONSTRUCTION INDUSTRY 20 COMPANIES 04 AUTOMOBILE AND PARTS 20 COMPANIES 05 ELECTRONIC AND ELETRICAL
EQUIPMENT 20 COMPANIES
06 FOOD PRODUCT 20 COMPANIES 07 INDUSTRIAL ENGINEERING 20 COMPANIES 08 INDUSTRIAL TRANSPORTATION 20 COMPANIES 09 MINNING 20 COMPANIES 10 REAL ESTATE INVESTMENT AND
SERVICES 20 COMPANIES
TOTAL 200 COMPANIES. Source: Author’s Analysis (2015).

International Journal of Accounting Research (IJAR) Vol. 2, No. 8, 2015 Publisher: ZARSMI, UAE, and Regent Business School, South Africa
19
PRESENTATION OF REGRESSION RESULTS
PERIOD ROE ROA PE TOQ SHIP Coeff. t. stat. p-
value
Coeff. t. stat.
p-value
Coeff. t. stat.
p-value
Coeff. t. stat. p-value
Coeff.
t. stat.
p-value
WITH FULL DATA(2003-2013) : DE FS
-0.3909 2.45E-09
-4.5297 0.5479
0.0000 0.5838
0.0018 5.80E-09
0.0066 0.4147
0.9947 0.6784
-1.5436 9.89E-08
-0.5082 0.6273
0.6114 0.5305
1338.55 -4.12E-05
0.2659 -0.1578
0.7904 0.8746
0.6487 1.07E-07
0.4352 1.3894
0.6635 0.1649
PRE-CRISIS PERIOD(2003-2006) : DE FS
-0.3621 2.44E-09
-5.957 0.6601
0.0000 0.5094
-0.062 0.0623
-0.1327 0.2759
0.8945 0.7827
-2.5617 5.30E-08
-0.5126 0.1745
0.6084 0.8615
1121.9 -8.16E-05
0.1805 -0.2161
0.8568 0.8289
-0.223 3.56E-08
-0.091 0.2383
0.9274 0.8117
DURING THE CRISIS (2007-2008) : DE FS
0.0044 2.04E-09
0.02604 0.3343
0.9792 0.7383
0.0043 2.04E-09
0.0260 0.3343
0.9792 0.7383
2.4955 1.50E-07
0.4167 0.6905
0.6771 0.4903
1368.3 -3.03E-05
0.0940 -0.0574
0.9251 0.9542
7.4950 1.05E-07
2.4973 0.9687
0.0129 0.3332
POST-CRISIS PERIOD (2009-2013): DE FS
-1.128 5.57E-09
-2.7169 0.4057
0.0067 0.6851
0.4561 1.45E-09
4.0591 0.3899
0.0001 0.6967
1.9311 1.39E-07
0.2691 0.5833
0.7879 0.5598
2643.18 5.49E-05
0.1621 0.1016
0.8713 0.9191
0.2667 2.96E-07
0.1792 6.008
0.8578 0.0000

International Journal of Accounting Research (IJAR) Vol. 2, No. 8, 2015 Publisher: ZARSMI, UAE, and Regent Business School, South Africa
20
Source: Author’s Computation (2015). NOTE: Significant Values are in red colours