Embed Size (px)
Citation preview

Impact of Agulhas Leakage on the Atlantic Overturning Circulationin the CCSM4
WILBERT WEIJER
Los Alamos National Laboratory, and the New Mexico Consortium, Los Alamos, New Mexico
ERIK VAN SEBILLE
Climate Change Research Centre, and ARC Centre of Excellence for Climate System Science,
University of New South Wales, Sydney, New South Wales, Australia
(Manuscript received 30 September 2012, in final form 25 July 2013)
ABSTRACT
The impact of Agulhas leakage variability on the strength of the Atlantic meridional overturning circu-
lation (AMOC) in the Community Climate System Model, version 4 (CCSM4) is investigated. In this model
an advective connection exists that transports salinity anomalies from the Agulhas region into the North
Atlantic on decadal (30–40 yr) time scales. However, there is no identifiable impact of Agulhas leakage on the
strength of theAMOC, suggesting that the salinity variations are tooweak to significantlymodify the stratification
in the North Atlantic. It is argued that this study is inconclusive with respect to an impact of Agulhas leakage on
theAMOC. Salinity biases leave the SouthAtlantic and IndianOceans toohomogeneous, in particular erasing the
observed salinity front in the Agulhas retroflection region. Consequently, salinity variability in the southeastern
South Atlantic is found to be much weaker than observed.
1. Introduction
Coupled climate models are routinely used to study
internal variability and externally forced changes of the
climate system. A crucial role is ascribed to the Atlantic
meridional overturning circulation (AMOC), which plays
an important role in the earth’s heat balance by trans-
porting heat northward across every latitude in theAtlantic
Ocean (e.g., Trenberth and Solomon 1994); understanding
the controls on its stability and variability is therefore a
main thrust of climate research.Agulhas leakage is thought
to be one of those controls. Agulhas leakage is the ex-
change of warm and salty waters from the Indian to the
Atlantic Ocean, mainly through the shedding of large
Agulhas rings (e.g., De Ruijter et al. 1999). In a recent
review paper, Beal et al. (2011) explored existing evi-
dence that Agulhas leakage may impact the global cli-
mate system, as it could affect the strength (Weijer et al.
1999, 2002; van Sebille and van Leeuwen 2007), stability
(Weijer et al. 2001), and variability (Biastoch et al. 2008;
Biastoch and B€oning 2013) of the AMOC. Particularly
tantalizing are studies suggesting that resumption of
Agulhas leakage during glacial terminations may have
contributed to the recovery of the AMOC after glacial
periods (Berger and Wefer 1996; Knorr and Lohmann
2003; Peeters et al. 2004).
Dynamically, Agulhas leakage can impact the stratifi-
cation in the Atlantic through the introduction of tem-
perature and salinity anomalies into the southeastern
South Atlantic. Weijer et al. (2002), for instance, show
that the adjustment takes place in two stages. The first
stage is through rapid, O(years) wave adjustment in-
volving Rossby and Kelvin waves (van Sebille and van
Leeuwen 2007; Biastoch et al. 2008; Heimbach et al.
2011). However, the efficiency of this interhemispheric
influence on short, intradecadal time scales was ques-
tioned by Johnson and Marshall (2002a,b, 2004), who
showed that the equator acts as a low-pass filter to cross-
hemispheric communications; a Southern Hemispheric
impact on North Atlantic overturning can be expected
on decadal time scales only. The second stage is an
advective O(decades) transport of the anomalies into
the North Atlantic. In particular, Weijer et al. (2002)
identify a mechanism through which an anomaly in
Corresponding author address: Wilbert Weijer, Los Alamos
National Laboratory, CCS-2, MS B214, Los Alamos, NM 87545.
E-mail: [email protected]
1 JANUARY 2014 WE I J ER AND VAN SEB I LLE 101
DOI: 10.1175/JCLI-D-12-00714.1
� 2014 American Meteorological Society

temperature and salinity that is initially density compen-
sated loses its thermal signature, and develops a density
anomaly on its way north. Biastoch and B€oning (2013)
observe such a densification in their model in response to
an increase in Agulhas leakage; however, they could not
unequivocally ascribe a weak change in the strength of the
AMOC to leakage-induced changes in the stratification.
The spatial resolution of the current generation of cli-
mate models, however, does not allow for an explicit
representation of the process of Agulhas ring shedding.
Instead, the Indian–Atlantic interocean exchange takes
place in a viscous boundary layer (De Ruijter 1982), lead-
ing to a significantly stronger volume transport. Indeed,
Weijer et al. (2012) report a mean 43Sv volume exchange
(Sv [ 106m3 s21) in the twentieth-century runs of the lat-
est (fourth) version of the Community Climate System
model (CCSM4), which is about threefold the 15Sv rate
inferred from observations (e.g., Richardson 2007). With
the Indian–Atlantic Ocean connection fully open, rather
than being choked off by a leaky retroflection, it is not clear
to what extent variability in Agulhas leakage affects the
strength of the AMOC in these coupled climate models.
Here, we will explore this question by analyzing five cen-
turies of a preindustrial control integration of the CCSM4.
To the best of our knowledge, this is the first study to ad-
dress the impact of Agulhas leakage on the strength of the
AMOC in a fully coupled climate model.
2. Analysis
For this study we use output from the Community
Climate SystemModel, version 4 (Gent et al. 2011). The
CCSM4 is a fully coupled climate model; it consists of
submodels for the different climate components, which
communicate through a flux coupler. The ocean compo-
nent is the Parallel Ocean Program (Smith et al. 2010). For
the analysis presented in this paper, we use monthly av-
eraged fields from the last 500 years of the 1850 pre-
industrial control integration of CCSM4. The spatial
resolution of the ocean model is nominally 18. In addition
to the Lagrangian diagnostics described below, we analyze
time series of AMOC transport, defined as the maximum
value of the overturning streamfunction as function of
latitude in the Atlantic Ocean. The mean overturning
strength at 26.58N is 20.1Sv, which compares well with the
18.76 5.6Sv observed by Cunningham et al. (2007) at that
latitude. The mean AMOC at 358S is 18.4Sv. For the
analysis presented here, salinity is averaged over the upper
1500m (S1500). Analyses with salinity averaged over the
upper 150, 750, and 1000m and the interval 750–1500m
yield similar results and will not be discussed here.
Agulhas leakage is estimated here using a Lagrangian
particle tracking approach (e.g., van Sebille et al. 2010).
The design of the Lagrangian experiment is very similar
to that described by Weijer et al. (2012), who studied
Agulhas leakage in the twentieth-century runs of the
same model. Here, over the 500 years of the 1850 pre-
industrial control integration, a total of 2.43 106 particles
are released in the Agulhas Current and each of them is
advected for 100 years using the Connectivity Modeling
System (Paris et al. 2013). Figure 1 shows some of the
calculated trajectories in the Atlantic Ocean. TheAgulhas
leakage is then diagnosed by keeping track of when each
float last crosses the so-called Good Hope line. The Good
Hope line is an oceanographic monitoring section that
stretches from Cape Town southwestward through the
Cape Basin, and then south to about 608S along the
Greenwichmeridian (black lines in Fig. 1). It was designed
tomonitor the watermass exchanges between theAtlantic
and Indian Ocean (Ansorge et al. 2005; Speich and Arhan
2007; Gladyshev et al. 2008).
Coarse-resolution ocean models such as the ocean
component of theCCSM4 do not explicitly represent the
mesoscale eddy field. Instead, its implied transports are
parameterized by the parameterization of Gent and
McWilliams (1990). The particles here only see the mean
Eulerian velocity field and hence miss the more or less
random dispersion implied by an active eddy field. Such
dispersion can be modeled as a diffusion term in our
Lagrangian analysis. To gauge the effects of subgrid-scale
variability on the results, we repeated the calculations
with an additional diffusion of 100m2 s21 to the trajec-
tories. However, the results of this run with diffusion are
very similar to the results without any diffusion added,
and will not be discussed further.
The average volume flux across the GoodHope line is
defined asVag(t)5�iVi, hence the sum of all volumesVi
associated with particles that cross the Good Hope
section in any given month (Fig. 2a); the mean transport
in this 1850 preindustrial control run is 34 Sv. This is
slightly lower than the 43 Sv in the twentieth-century
runs of CCSM4 as reported by Weijer et al. (2012). In
addition to its volume flux, Agulhas leakage can also be
characterized by the heat and salt fluxes that it gener-
ates. In fact, previous studies (Weijer et al. 2002) suggest
that salinity anomalies introduced by Agulhas leakage
might be the most important factor in influencing the
AMOC, as they perturb the stratification of the South
Atlantic Ocean without significant damping by the at-
mosphere. Here, we measure Agulhas leakage as the
flux of salinity anomalies FS (Fig. 2b); monthly values of
FS(t) are calculated as �iVi(Si 2 S0), hence summing
over all particles that cross the Good Hope section in
a given month with volume Vi and salinity Si.
The choice for S0 is not obvious but, since FS strongly
depends on its value, it has to be chosen carefully; for
102 JOURNAL OF CL IMATE VOLUME 27

any choice of S0 that deviates however slightly from
the time- and section-averaged salinity on the Good Hope
section (hSGHi, where the overbar denotes a time average
and the angle brackets denote section average) FS will be
dominated by the contribution Vag(t)(hSGHi2 S0). There
are a few problems with this: 1) the fact that the choice for
S0 is not obvious (arguments can be made for an average
over the full Atlantic, the South Atlantic only, or maybe
even a regional average over the southeastern South At-
lantic) introduces an arbitrariness to our analysis; and 2) the
salt flux is dominated by transport fluctuations advecting
the section-averaged salinity. A substantial part of this salt
input may simply be recirculated in the subtropical gyre
without affecting the density field in a meaningful way. In
addition, the impact of salinity fluctuations of the leakage
are effectively ignored, and thus 3) a constant value of S0will lead to positive and negative salt fluxes across different
parts of the Good Hope section, due to spatial variations
(mainly as function of depth) in the mean salinity on this
section.
To alleviate these problems, we choose S0 here to be
the time-averaged salinity over the Good Hope section,
SGH(x, z) (van Sebille et al. 2010). So, for each float that
crosses the Good Hope section, its salinity is measured
against the mean salinity at the crossing location. Salt
flux variations will now be induced only by the mean
transport advecting salinity anomalies, and by co-
variance of transport and salinity anomalies; fluctuations
in volume transport in itself will not generate variability
in FS, just as would be expected in the real ocean where
Agulhas leakage that does not import excess salt will
likely not affect the dynamics of the AMOC. Consistent
with our choice of S1500, we use only particles that cross
the GoodHope line in the upper 1500m. In addition, we
exclude floats in the upper 150m, which are influenced
by the mixed layer and whose thermohaline character-
istics are hence not conserved.
3. Results
a. Agulhas leakage impact on the AMOC
An analysis of the coherence (e.g., section 11.4 in von
Storch and Zwiers 1999) between the two time series
(Fig. 3a) shows that the volume flux Vag does not affect
the salinity in the southeastern Atlantic Ocean, as rep-
resented here by a reference salinity time series Sref1500
(salinity at 378S, 108E in the South Atlantic, averaged
over the upper 1500m; Fig. 2c). The associated salt
transport FS, however, is significantly coherent with
Sref1500 for a wide range of frequencies. This suggests that
in this model the salinity in the southeastern South At-
lantic is affected by the upstream salinity variability in
the Indian Ocean rather than changes in the actual
volume flux, justifying the choice for S0 5 SGH(x, z)
discussed in the previous section.
Second, we study the meridional coherence of the
AMOC to see whether and, if so, on what time scales
interhemispheric communication of the AMOC can be
expected. Figure 2d shows the time series of AMOC
FIG. 1. Trajectories of 419 particles released on 15 Jan of model year 810 at 328S in the
Agulhas Current. The black line indicates theGoodHope line; trajectories crossing this line are
assumed to have ‘‘leaked’’ into the Atlantic. The black dot indicates our reference location, at
378S, 108E.
1 JANUARY 2014 WE I J ER AND VAN SEB I LLE 103

anomalies at 268N. They are coherent with the AMOC
in the South Atlantic only on multidecadal time scales,
with periods exceeding 50 yr (Fig. 3b). This is consistent
with the idea that the equator acts as a low-pass filter for
AMOC anomalies propagating as waves (Johnson and
Marshall 2002a,b, 2004). For this reason, we cannot ex-
pect variability in Agulhas leakage on interdecadal time
scales to significantly affect the AMOC in the North
Atlantic through wave adjustment.
Third, Fig. 3c shows the coherence between FS and the
AMOC at select latitudes, namely 308S (blue), 158S(red), and 158N (black). The coherences rise slightly
above the significance limit for multidecadal time scales
(periods exceeding 50 yr); no significant coherences are
found with the AMOC north of 358N. This signal might
point to a causal relationship between salt flux vari-
ability and the strength of the AMOC in at least the
South Atlantic. To investigate this further, we consider
the coherence phase and associated time lag between FS
and the AMOC as function of latitude (Fig. 4, black
curves). Indeed, south of about 158S the phase is nega-
tive, meaning that FS leads the AMOC as one would
expect for a causal relationship. However, north of this
latitude, FS seems to lag the AMOC. In fact, the phase
FIG. 2. Time series of anomalous (a) Agulhas leakage volume
transport,Vag, as determined from the Lagrangian particle tracking
analysis; (b) its associated salt flux FS; (c) salinity at 378S, 108E in
the South Atlantic, averaged over the upper 1500m Sref1500; and
(d) the AMOC strength, as the maximum of the overturning stream-
function in the North Atlantic. Shown are monthly anomalies (with
annual and semiannual cycles removed; gray) and low-pass filtered
time series, retaining time scales of 10 yr and longer (black). See text
for details.
FIG. 3. (a) Coherence between Sref1500, and Agulhas leakage Vag
(black) and its associated salt flux FS (red). (b) Coherence between
the strength of the AMOC at 268N and at 158N (black), 158S (red),
and 308S (blue). (c) Coherence between FS and the AMOC at 158N(black), 158S (red), and 308S (blue). (d) Coherence between the
Ni~no-3.4 index and FS (black), the AMOC at 268N (red), and the
AMOCat 308S (blue). The gray lines represent the 95% confidence
limit of nonzero coherence. A 7-point Daniell filter is applied to
smooth the spectra.
104 JOURNAL OF CL IMATE VOLUME 27

progression when going northward is suggestive of a
southward propagating signal with a transit time of
about 15 yr from 458N to 308S. This is not consistent withan adjustment of the AMOC through northward ad-
vection of density anomalies introduced by Agulhas
leakage. The adjustment of the AMOC through waves
is a complicated process involving Kelvin and Rossby
waves (Johnson and Marshall 2002a) and could in princi-
ple lead to an apparent southward propagation of AMOC
anomalies in the South Atlantic. However, the adjustment
in the North Atlantic should still proceed northward, in
contrast to the result presented here.We therefore suspect
that the coherence found in themultidecadal range reflects
a southward propagating signal of the AMOC that affects
FS, or a joint response to a common forcing.
On decadal time scales, there is a narrow peak of sig-
nificant coherences around the 25-yr period. However,
inspection of the phase between the time series indicates
that FS lags the AMOC by about 4 yr throughout the
Atlantic, with no noticeable change in lag when going
northward (Fig. 4, gray curves). For that reason it seems
unlikely that Agulhas leakage is responsible for the var-
iability in theMOC at 25yr, but that both AMOC and FS
vary in response to a common forcing instead.
The remaining time scales where significant coherences
are found are between 3 and 5yr. Further analysis (Fig. 3d)
suggests that these coherences do not indicate a causal re-
lationship but that both salinity and the AMOC time series
are affected by the El Ni~no–Southern Oscillation phe-
nomenon, the dominant mode of interannual variability in
the climate of this model (Deser et al. 2012). In particular,
Fig. 5 shows that theElNi~no signal, represented here by the
traditional Ni~no-3.4 index [SST averaged over a strip in the
equatorial Pacific from 58S to 58N and from 1708 to 1208W;
Trenberth (1997)], has an equally strong and concurrent
(but opposite in sign) impact on the AMOC in the sub-
tropical regions of the South and North Atlantic.
This analysis of the coherences between the different
time series thus suggests that Agulhas leakage, and the
salinity anomalies that it introduces into the southeast-
ern South Atlantic, does not affect the AMOC at any
latitude in the CCSM4 on any time scale.
b. Signal propagation
The statistical analysis of the previous section does
not suggest any consistent causal relationship between
Agulhas leakage and the strength of the AMOC. The
question is whether salinity anomalies introduced by
Agulhas leakage actually make it far enough north to
influence the AMOC in the North Atlantic. Here we
investigate the propagation of signals introduced into
the southeastern South Atlantic by calculating lagged-
correlation maps between FS and upper-ocean salinities
(S1500) in the entire Atlantic. To focus on (inter)decadal
time scales, we apply the following data processing
steps (black lines in Fig. 2): 1) the mean and the an-
nual and semiannual cycles are removed; 2) a low-pass
Parks–McClellan filter of order 40 is applied, with
high-frequency cut-off at 1/10 cpy (Parks and McClellan
1972); 3) a fourth-order polynomial is fitted to, and
FIG. 4. (a) Coherence squared K2, (b) coherence phase f, and
(c) time lag t (yr), between FS and AMOC strength as function of
latitude, averaged over two frequency bands: 0.01–0.02 (black) and
0.03–0.05 cpy (gray). Negative phase and lag mean FS leads the
AMOC. Phase and time lag are only averaged over frequency
components that have a coherence significantly different from zero
(K2 . 0.4).
FIG. 5. Lagged correlations between the Ni~no-3.4 index and the
strength of the AMOC as function of latitude in the Atlantic. Only
correlations at the 95% significance level are shaded.
1 JANUARY 2014 WE I J ER AND VAN SEB I LLE 105

subtracted from, the time series to remove the low-
frequency undulations; 4) the time series are detrended;
and 5) the data are bin-averaged into 3-month bins. Lags
between675 yr are probed. Testing of correlations being
significantly larger than zero at the 95% level is based on
the t distribution (Von Storch and Zwiers 1999), and
a rigorous determination of the number of degrees of
freedom of the time series (based on the maximum
of their decorrelation time scales, Gille 2005). Since
our goal is to detect the propagation of salinity anom-
alies based on positive correlations between FS and S1500in the Atlantic, a one-sided significance test is appro-
priate; this test is less stringent than a two-sided test at
the 95% level, which assumes that only 2.5% of the cor-
relations of random time series test positive for a positive
correlation.
Figure 6 shows the maximum correlation between FS
and S1500 probed for positive lags only, as well as the lag
where this correlation is obtained. There are several
areas of significant correlations found in the Atlantic.
First of all, a west-northwestward-oriented plume of
significant correlations arises in theAgulhas region, with
lags increasing westward from 0 to about 3 yr in the
Brazil Current; this is consistent with an advective trans-
port of salinity anomalies across the South Atlantic basin.
Second, there is a patch of significant correlations in the
eastern equatorial Atlantic, with relatively small lags of
3–5 yr. Third, a ‘‘ribbon’’ of significant correlations can be
seen in the Caribbean Current and the Gulf Stream, at
35–36-yr lags. This connects, fourth, to a large area in the
subtropical gyre of the North Atlantic with significant
positive correlations. The smallest lags are 39 yr. Fifth,
significant correlations as high as 0.3 are seen in the sub-
polar North Atlantic, with lags as short as 1 yr.
The correlations in the subpolar North Atlantic are
too rapid to be explained by the advective mechanism
and might, instead, reflect a joint response to a common
forcing agent (such as ENSO). Evidence for a rapid
wavelike response could not be found here and is
expected to be weak, as argued in the previous section.
However, the correlations linking the South Atlantic,
the Brazil Current, the Caribbean, the Gulf Stream, and
the subtropical North Atlantic are consistent with an
advective mechanism. Still, the time scales for the anom-
alies to reach the North Atlantic (30–40 yr) seem rather
long.We investigate the propagation of salinity anomalies
in more detail from the Lagrangian perspective. In par-
ticular we would like to understand the transit times for
particles to reach the North Atlantic. To that end, we
followed the trajectories from the Good Hope line to
three locations in the Atlantic (Fig. 7).
The trajectories arriving in the Brazil Current at 128Shave an average arrival time of about 20 yr, with the
largest wave of trajectories arriving after a decade.
However, it takes particles on average 34 yr to reach the
southern Caribbean at 128N, with the majority arriving
after 20 yr. This value is consistent with the lag of about
36 yr for which the salinity field has the optimal corre-
lation with FS. Figure 8 shows the often circuitous routes
taken by the particles before reaching the southern
Caribbean. The arrival time distribution for the Gulf
Stream centers around 30 yr, with an average of 40 yr
(assuming a lognormal fit to the distribution).
This analysis shows that the particles reach the Brazil
Current fairly quickly, but that it takes almost a decade
longer before a significant amount of the particles have
entered the North Atlantic. Nonetheless, the particles
appear able to carry their salinity anomaly from the
Good Hope line to that region, and leave a significant
imprint on the salinity field, as shown by Fig. 6.
FIG. 6. (a) Map of the optimal correlation between FS and S1500in the Atlantic. Contour interval is 0.1, and contours with values of
0.5 (yellow) and 0.2 (magenta) are highlighted. Areas without any
significant positive correlations are shaded gray. (b) The lag (yr) at
which this optimal correlation is achieved.
106 JOURNAL OF CL IMATE VOLUME 27
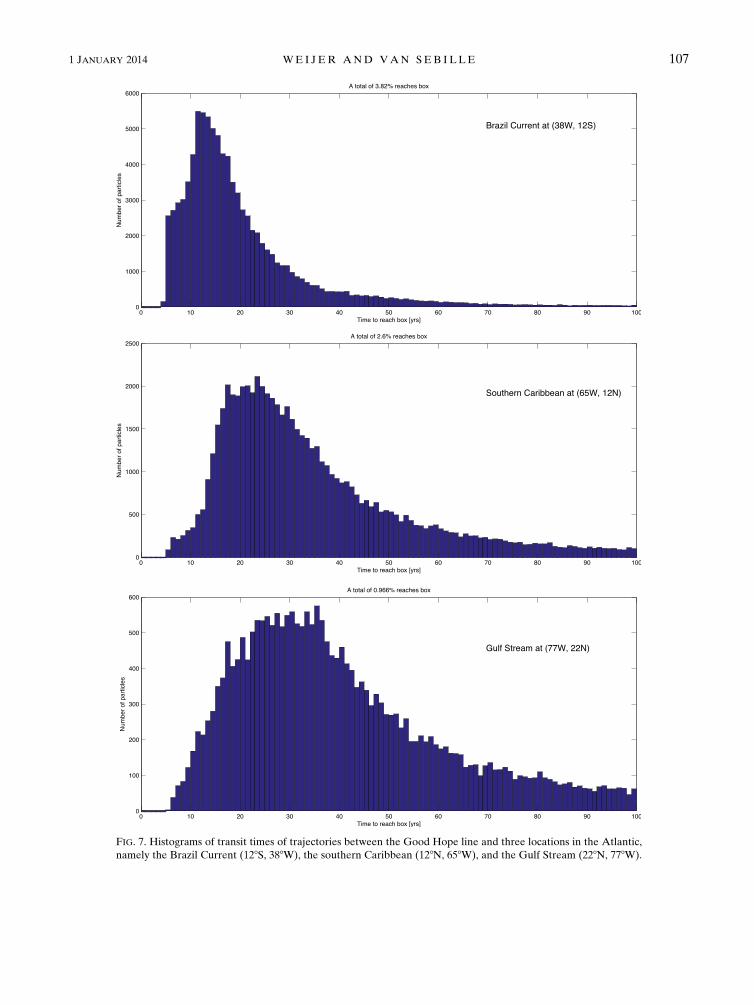
FIG. 7. Histograms of transit times of trajectories between the Good Hope line and three locations in the Atlantic,
namely the Brazil Current (128S, 388W), the southern Caribbean (128N, 658W), and the Gulf Stream (228N, 778W).
1 JANUARY 2014 WE I J ER AND VAN SEB I LLE 107

4. Discussion
Our analysis shows that an advective pathway exists in
a coupled climate model that connects the Agulhas re-
gion with the North Atlantic, and through which salinity
anomalies are advected. Characteristic time scales for
these anomalies to reach theNorthAtlantic are typically
on the order of 30–40 yr, consistent with the analysis by
Biastoch and B€oning (2013). Nonetheless, we found no
clear causal relation between variability in Agulhas
leakage and the strength of the AMOC. Apparently, the
salinity anomalies that arrive in the northern North
Atlantic are tooweak in thismodel to have ameasurable
impact on the stratification, and hence on the AMOC.
However, we are hesitant to conclude that variability in
Agulhas leakage does not have an impact on the
AMOC. As discussed below, significant salinity biases
exist in the model that render the salinity anomalies
introduced by Agulhas leakage to be much weaker than
found in observations. It is possible that more significant
variability in the Agulhas leakage salt flux may be able
to exert an influence on the AMOC. Dedicated model
experiments with the current model, or a long in-
tegration of an Agulhas leakage-resolving ocean model,
would be required to settle this question.
It has been well established (e.g., Banks et al. 2007;
Weijer et al. 2012) and it is dynamically well understood
(De Ruijter 1982) that the Indian–Atlantic interocean
exchange is overestimated in models that lack enough
spatial resolution to properly represent the inertial dy-
namics of the Agulhas retroflection and ring shedding
process; the wind-driven circulation systems of the
southern Indian and SouthAtlanticOceans [the so-called
super gyre, Speich et al. (2007)] are too strongly coupled.
We suggest here that the overestimation of the inter-
ocean exchange in this model homogenizes the water
mass characteristics of the South Atlantic and Indian
Oceans, possibly exacerbating existing biases in these
fields due to precipitation errors (Gent et al. 2011;
Danabasoglu et al. 2012).
A look at the salinity difference between the south-
eastern South Atlantic and the southwestern section
of the southern Indian Ocean provides support for
this idea; Fig. 9 compares salinity averaged over the upper
1000m S1000 for the CCSM4 and the Commonwealth
Scientific and Industrial Research Organisation (CSIRO)
FIG. 8. A subset of trajectories that reach our target location in the southern Caribbean Sea at
128N, 658W, indicated by the black square.
FIG. 9. Climatology of S1000, for (a) CARS2009 and (b) CCSM4.
Area-averaged salinity is subtracted from both datasets to em-
phasize spatial anomalies of the time-mean state. The black crosses
indicate the location of a reference point at 348S, 108E in the
southeastern South Atlantic, while the boxes represent the area of
averaging in the southeastern section of the southern IndianOcean
referred to in the text.
108 JOURNAL OF CL IMATE VOLUME 27
Atlas ofRegional Seas (CARS2009) (Ridgway et al. 2002)
climatology. CARS2009 clearly shows a sharp salinity
front at the Agulhas retroflection, separating the salty
subtropical waters of the southwestern section of the
southern Indian Ocean from the relatively fresh waters in
the southeastern South Atlantic. Such a front is totally
absent in the CCSM4. The climatological value of S1000 at
348S, 108E in the South Atlantic (indicated by crosses in
Fig. 9) is 34.82 psu in CARS2009, while the average over
the region 388–238S, 208–708E in the southeastern Indian
Ocean (black boxes in Fig. 9) is 35.06psu, a contrast of
0.24 psu. In the model, these values are 34.40 and
34.36psu, a difference of only 20.04psu, with the Indian
Ocean being fresher than the Atlantic. Indeed, the stan-
dard deviation of salinity, averaged over the upper 1000m
(note that the standard deviations—given for each level in
the upper 1000m—are averaged here) is 0.11psu in
CARS2009, compared to 0.02psu for the model. This
suggests that salinity variability induced by Agulhas
leakage is underestimated in the CCSM4, possibly by
a factor of 5.
We should note that this present study only addresses
interdecadal variability in Agulhas leakage in a relatively
constant control climate. The study, therefore, does not
address the relation betweenAgulhas leakage andAMOC
in a rapidly changing climate. As also stated in the intro-
duction, there is strong evidence from paleoceanographic
proxies that Agulhas leakage and AMOC strength are
linked during rapid climate transitions. The associated
changes in Agulhas leakage, however, are likely much
larger than the interannual signal in CCSM4.
Acknowledgments. This research was supported by
the Regional and Global Climate Prediction Program of
the U.S. Department of Energy Office of Science. The
Los Alamos National Laboratory (LANL) is operated
by the Los Alamos National Security, LLC, for the
National Nuclear Security Administration of the U.S.
Department of Energy under Contract DE-AC52-
06NA25396. EvS was supported by the Australian Re-
searchCouncil viaGrantsDE130101336 andCE110001028.
The CCSM4 data were obtained from the Earth System
Grid. The Connectivity Modeling System (CMS) for the
Lagrangian advection of particles most current de-
velopment was funded by the NSF–OCERAPIDAward
1048697 to C. B. Paris. We thank Mat Maltrud, with help
in the data preparation, Milena Veneziani, and Matthew
Hecht of LANL, and two anonymous reviewers for useful
comments on the manuscript.
REFERENCES
Ansorge, I. J., S. Speich, J. R. E. Lutjeharms, G. J. Goni, C. J.
Rautenbach, P. W. Froneman, M. Rouault, and S. L. Garzoli,
2005: Monitoring the oceanic flow between Africa and Ant-
arctica: Report of the first GoodHope cruise. S. Afr. J. Sci.,
101, 29–35.
Banks, H. T., S. Stark, andA. B. Keen, 2007: The adjustment of the
coupled climatemodelHadGEM1 toward equilibrium and the
impact on global climate. J. Climate, 20, 5815–5826.Beal, L. M., and Coauthors, 2011: On the role of the Agulhas
system in global climate. Nature, 472, 429–436.
Berger, W. H., and G. Wefer, 1996: Expeditions into the past:
Paleoceanographic studies in the South Atlantic. The South
Atlantic, G. Wefer et al., Eds., Springer-Verlag, 363–410.
Biastoch, A., and C. W. B€oning, 2013: Anthropogenic impact on
Agulhas leakage.Geophys. Res. Lett., 40, 1138–1143, doi:10.1002/
grl.50243.
——, ——, and J. Lutjeharms, 2008: Agulhas leakage dynamics
affects decadal variability in Atlantic overturning circulation.
Nature, 456, 489–492.
Cunningham, S. A., and Coauthors, 2007: Temporal variability of
the Atlantic meridional overturning circulation at 26.58N.
Science, 317, 935–938.Danabasoglu, G., S. C. Bates, B. P. Briegleb, S. R. Jayne, M. Jochum,
W. G. Large, S. Peacock, and S. G. Yeager, 2012: The CCSM4
ocean component. J. Climate, 25, 1361–1389.
De Ruijter, W., 1982: Asymptotic analysis of the Agulhas and
Brazil current systems. J. Phys. Oceanogr., 12, 361–373.——, A. Biastoch, S. S. Drijfhout, J. R. E. Lutjeharms, R. P.
Matano, T. Pichevin, P. J. van Leeuwen, and W. Weijer, 1999:
Indian–Atlantic interocean exchange: Dynamics, estimation
and impact. J. Geophys. Res., 104 (C9), 20 885–20 910.
Deser, C., and Coauthors, 2012: ENSO and Pacific decadal vari-
ability in the Community Climate System Model version 4.
J. Climate, 25, 2622–2651.
Gent, P. R., and J. C. McWilliams, 1990: Isopycnal mixing in ocean
circulation models. J. Phys. Oceanogr., 20, 150–155.
——, and Coauthors, 2011: The Community Climate System
Model version 4. J. Climate, 24, 4973–4991.
Gille, S. T., 2005: Statistical characterization of zonal and meridi-
onal ocean wind stress. J. Atmos. Oceanic Technol., 22, 1353–
1372.
Gladyshev, S., M. Arhan, A. Sokov, and S. Speich, 2008: A hy-
drographic section from South Africa to the southern limit of
the Antarctic circumpolar current at the Greenwich meridian.
Deep-Sea Res. I, 55, 1284–1303.
Heimbach, P., C. Wunsch, R. M. Ponte, G. Forget, and J. Utke,
2011: Timescales and regions of the sensitivity of Atlantic
meridional volume and heat transport: Toward observing
system design. Deep-Sea Res. II, 58, 1858–1879.
Johnson, H. L., and D. P. Marshall, 2002a: A theory for the surface
Atlantic response to thermohaline variability. J. Phys. Oce-
anogr., 32, 1121–1132.——, and ——, 2002b: Localization of abrupt change in the North
Atlantic thermohaline circulation. Geophys. Res. Lett., 29,
doi:10.1029/2001GL014140.
——, and ——, 2004: Global teleconnections of meridional over-
turning circulation anomalies. J. Phys. Oceanogr., 34, 1702–
1722.
Knorr, G., and G. Lohmann, 2003: Southern Ocean origin for the
resumption of Atlantic thermohaline circulation during de-
glaciation. Nature, 424, 532–536.Paris, C. B., J. Helgers, E. van Sebille, and A. Srinivasan, 2013:
Connectivity Modeling System: A probabilistic modeling tool
for the multi-scale tracking of biotic and abiotic variability in
the ocean. Environ. Modell. Software, 42, 47–54.
1 JANUARY 2014 WE I J ER AND VAN SEB I LLE 109

Parks, T. W., and J. H. McClellan, 1972: Chebyshev approximation
for nonrecursive digital filters with linear phase. IEEE Trans.
Circuit Theory, 19, 189–194.
Peeters, F. J. C., R. Acheson, G. J. A. Brummer, W. P. M. de
Ruijter, R. R. Schneider, G. M. Ganssen, E. Ufkes, and
D. Kroon, 2004: Vigorous exchange between the Indian and
Atlantic Oceans at the end of the past five glacial periods.
Nature, 430, 661–665.Richardson, P. L., 2007: Agulhas leakage into the Atlantic esti-
mated with subsurface floats and surface drifters. Deep-Sea
Res. I, 54, 1361–1389.
Ridgway, K. R., J. R. Dunn, and J. L. Wilkin, 2002: Ocean in-
terpolation by four-dimensional weighted least squares—
Application to the waters aroundAustralia. J. Atmos. Oceanic
Technol., 19, 1357–1375.Smith, R., and Coauthors, 2010: The Parallel Ocean Program
(POP) reference manual. Los Alamos National Laboratory
Tech. Rep., 141 pp.
Speich, S., and M. Arhan, 2007: Good-Hope/Southern Ocean:
A study and monitoring of the Indo-Atlantic connections
through the Southern Ocean. Mercator Ocean Quarterly News-
letter, No. 27, Ramonville-Saint-Agne, France, 29–41.
——, B. Blanke, andW. Cai, 2007: Atlantic meridional overturning
circulation and the SouthernHemisphere supergyre.Geophys.
Res. Lett., 34, L23614, doi:10.1029/2007GL031583.
Trenberth, K. E., 1997: The definition of El Ni~no. Bull. Amer.
Meteor. Soc., 78, 2771–2777.
——, and A. Solomon, 1994: The global heat balance: Heat trans-
ports in the atmosphere and ocean. Climate Dyn., 10, 107–134.van Sebille, E., and P. J. van Leeuwen, 2007: Fast northward energy
transfer in theAtlantic due toAgulhas rings. J. Phys. Oceanogr.,
37, 2305–2315.
——, ——, A. Biastoch, and W. P. M. de Ruijter, 2010: Flux
comparison of Eulerian and Lagrangian estimates of Agulhas
leakage: A case study using a numerical model.Deep-Sea Res. I,
57, 319–327.
von Storch, H., and F. W. Zwiers, 1999: Statistical Analysis in Cli-
mate Research. Cambridge University Press, 484 pp.
Weijer, W., W. P. M. De Ruijter, H. A. Dijkstra, and P. J. van
Leeuwen, 1999: Impact of interbasin exchange on the Atlantic
overturning circulation. J. Phys. Oceanogr., 29, 2266–2284.
——, ——, and ——, 2001: Stability of the Atlantic overturning
circulation: Competition between Bering Strait freshwater flux
and Agulhas heat and salt sources. J. Phys. Oceanogr., 31, 2385–2402.
——, ——, A. Sterl, and S. S. Drijfhout, 2002: Response of the
Atlantic overturning circulation to South Atlantic sources of
buoyancy.Global Planet. Change, 34, 293–311.——, and Coauthors, 2012: The Southern Ocean and its climate in
CCSM4. J. Climate, 25, 2652–2675.
110 JOURNAL OF CL IMATE VOLUME 27