Embed Size (px)
Citation preview

Impact EvaluationImpact Evaluation
Randomized ExperimentsRandomized Experiments
Sebastian GalianiSebastian Galiani
November 2006November 2006
2
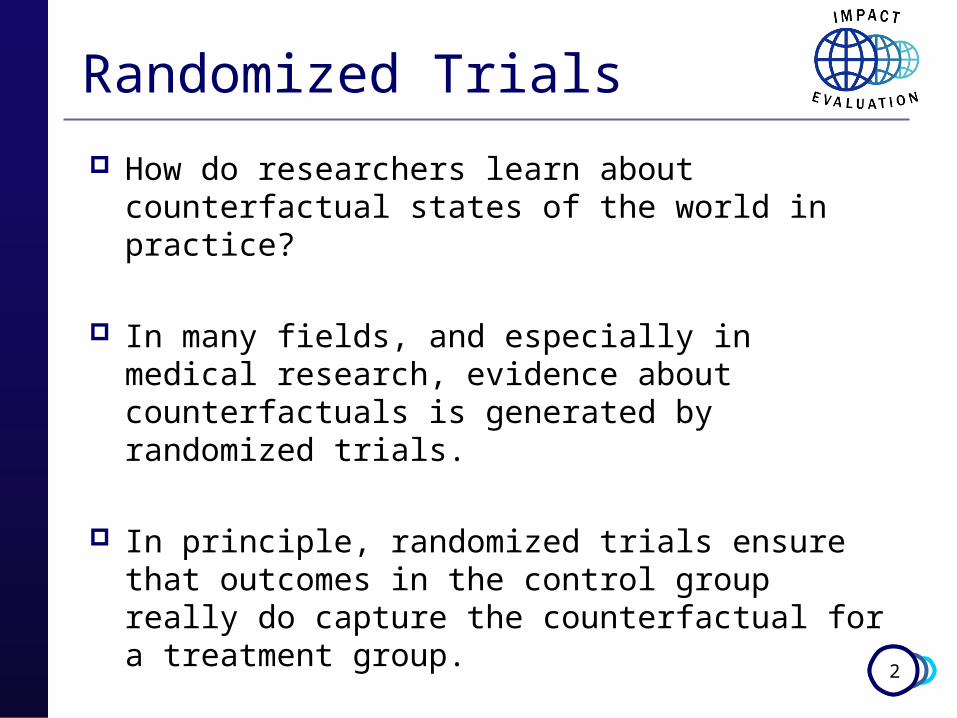
Randomized Trials
How do researchers learn about counterfactual states of the world in practice?
In many fields, and especially in medical research, evidence about counterfactuals is generated by randomized trials.
In principle, randomized trials ensure that outcomes in the control group really do capture the counterfactual for a treatment group.

3
Randomization
To answer causal questions, statisticians recommend a formal two-stage statistical model.
In the first stage, a random sample of participants is selected from a defined population.
In the second stage, this sample of participants is randomly assigned to treatment and comparison (control) conditions.

4
Population
Sample
Treatment Group Control Group
Randomization
Randomization
5
External & Internal Validity
The purpose of the first-stage is to ensure that the results in the sample will represent the results in the population within a defined level of sampling error (external validity).
The purpose of the second-stage is to ensure that the observed effect on the dependent variable is due to some aspect of the treatment rather than other confounding factors (internal validity).

6
Two-Stage Randomized Trials In large samples, two-stage randomized
trials ensure that:
0]D|Y[1]D|Y[and0]D|Y[1]D|Y[ 0011
• Thus, the estimator
0]D|Y[-1]D|Y[ˆ01
• Consistently estimates ATE

7
One-Stage Randomized Trials Instead, if randomization takes place on a
selected subpopulation –e.g., list of volunteers-, it only ensures:
• And hence, the estimator
0]D|Y[-1]D|Y[ˆ01
• Only estimates TOT Consistently
0]D|Y[1]D|Y[ 00
8
Furthermore, even in idealized randomized designs,
1. Not all participants will receive the intended treatment (non-compliance)
2. Not all participants will complete the dependent measure (attrition)
Even the best-designed randomized experiment will at best only approximate the ideal of the two-stage statistical model.
Randomized Trials
9
Nevertheless, the important point is that, in the absence of difficulties such as noncompliance or loss to follow up, assumptions play a minor role in randomized experiments, and no role at all in randomized tests of the hypothesis of no treatment effect.
In contrast, inference in a nonrandomized experiment requires assumptions that are not at all innocuous.
Randomized Trials

10
Randomized Trial of Coronary Surgery
The US Veterans Administration conducted a randomized controlled experiment comparing coronary artery bypass surgery with medical therapy as treatments for coronary artery disease.
Bypass surgery is an attempt to repair the arteries that supply blood to the heart. A bridge is formed around a blockage in a coronary artery. In contrast, medical therapy uses drugs to enhance the flow of blood through narrowed arteries.
The study involved randomly assigning 596 patients at 13 Veterans Administration hospitals, of whom 286 received surgery and 310 received drug treatments.
11
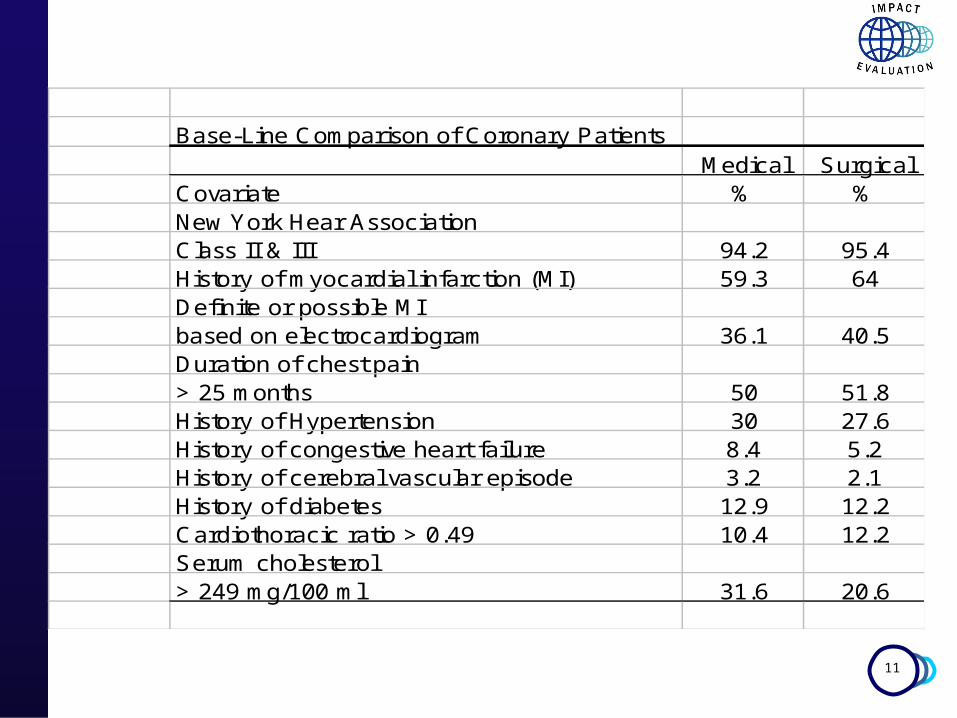
Base-Line Comparison of Coronary PatientsMedical Surgical
Covariate % %New York Hear AssociationClass II & III 94.2 95.4History of myocardial infarction (MI) 59.3 64Definite or possible MIbased on electrocardiogram 36.1 40.5Duration of chest pain > 25 months 50 51.8History of Hypertension 30 27.6History of congestive heart failure 8.4 5.2History of cerebral vascular episode 3.2 2.1History of diabetes 12.9 12.2Cardiothoracic ratio > 0.49 10.4 12.2Serum cholesterol > 249 mg/100 ml 31.6 20.6

12
Randomized Trial of Coronary Surgery
The previous table shows that the two groups of patients were similar in many important ways prior to the start of treatment.
Differences are not significant at conventional levels of statistical significance for 9 of the 10 pre-treatment variables analyzed.
This is in line with what one would expect from 10 significant tests if the only differences were due to chance.

13
This example shows that randomization tends to produce relatively comparable or balanced treatment groups in large experiments.
These 10 covariates were not used in assigning treatments. There was not deliberate balancing of these variables. Rather, the balance we see was produced by the random assignment.
This gives us some reason to hope and expect that other variables, not measured, are also similarly balanced.
Indeed, in large samples, statistical theory supports this expectation.
Randomized Trial of Coronary Surgery

14
Vitamin C and Treatment of Advanced Cancer
An early study presented observational evidence showing that, as a group, patients receiving vitamin C survived about four times longer than the control group.
Controls were selected by means of matched sampling. However, the control group was formed from records of
patients already dead. This induced Selection bias in unobservables.
In response, the Mayo Clinic conducted a careful randomized controlled experiment comparing vitamin C to placebo for patients with advanced cancer of the colon and rectum.
Instead, they found no indication that vitamin C lengthened survival.

15
Does reducing class size improve elementary school education?
Project STAR (Student-Teacher Achievement Ratio): 4-year experiment designed to evaluate the effect on learning of small class sizes.
Focus of the experiment: 3 different class arrangements for kindergarten through third grade.
Treatment levels: 1. Regular class size: 22-25 students and a single teacher. 2. Small class: 13-17 students and a single teacher.
3. Teacher’s aide: regular-sized class plus a teacher’s aide.

16
Does reducing class size improve elementary school education?
Each school had at least one class of each type.
Students entering kindergarten in a participating school were randomly assigned to one of these three groups.
Teachers were also assigned randomly.

17
iiii ugAideReSmallClassY 210
Project STAR: Differences Estimates of Effect on Standardized Test Scores of Class Size Treatment Group
Grade
Regressor K 1 2 3
Small Class13.90***
(2.45)29.78***
(2.83)19.39***
(2.71)15.59***
(2.40)
Regular Size with aide
0.31(2.27)
11.96***(2.65)
3.48(2.54)
-0.29(2.27)
Intercept918.04***
(1.63)1,039.39***
(1.78)1,157.81***
(1.82)1,228.51***
(1.68)
Number of Observations
5,786 6,379 6,049 5,967

18
Does reducing class size improve elementary school education?
The estimates presented suggest that:1. Reducing class size has an effect on test
performance, 2. But adding an aide to a regular sized class
has a much smaller effect, possible zero.
• However, the estimates presented ignore both attrition and non-compliance. These two nuisances were high, and hence, the results might be biased.

19
Possible Solution to Attrition and Non-compliance
Non-compliance:
1. Intention to Treat Analysis2. Instrumental Variables Analysis (Local Average
Treatment Effect)
Attrition (Hidden bias)
1. Search for ignorability among sub-groups. 2. Instrumental Variables & Matching Methods.
20
Vouchers for Private Schooling in Colombia: Evidence from a
Randomized Natural Experiment
Angrist et al. (2002)AER

21
Motivation This paper presents evidence on the impact of
one of the largest school voucher programs to date: Programa de Apliacion de Cobertura de la Educacion Secundaria (PACES).
Treatment: 125,000 pupils with vouchers covering somewhat more than half the cost of private secondary school.
Vouchers were renewable as long as students maintained satisfactory academic performance.

22
Design The authors interviewed 1,600 PACES applicants
in 1998, stratifying to obtain approximately equal numbers of winners and losers.
For practical reasons, interwieving was limited to the 1995 and 1997 applicant cohorts from Bogota and the 1993 applicant cohort from Jamundi, a suburb of Cali.
Telephones were used for the majority of interviews. Approximately 60% response rate. Response is independent of treatment assignment.

23
Personal Characteristics and Voucher StatusBogotá 1995 Bogotá 1997 Jamundi 1993Dependent variable
Loser means Won voucher Loser means Won voucher Loser means Won voucher
Age at time of survey 15.0(1.4)
-0.013(0.078)
13.2(1.4)
-0.259(0.171)
17.2(1.4)
-0.375(0.217)
Male 0.501 0.004(0.029)
0.527 -0.047(0.061)
0.365 0.110(0.077)
Mother’s highest gradecompleted
5.9(2.7)
-0.079(0.166)
5.9(2.7)
0.654(0.371)
4.4(2.7)
1.46(0.494)
Father’s highest gradecompleted
5.9(2.9)
-0.431(0.199)
5.5(2.5)
0.929(0.388)
5.2(2.9)
0.737(0.640)
Mother’s age 40.7(7.3)
-0.027(0.426)
38.7(6.6)
-0.146(0.808)
43.6(8.8)
-0.736(1.42)
Father’s wage 44.4(8.1)
0.567(0.533)
41.9(7.3)
0.265(0.973)
45.5(9.1)
1.92(1.61)
Father’s wage (>2 minwage)
0.100 0.005(0.021)
0.088 -0.008(0.043)
0.133 -0.092(0.056)
N 583 1,176 131 277 74 165Notes: The table reports voucher losers’ means and the estimated effect of wining a voucher. Numbers in parentheses arestandard deviations in columns of means and standard errors in columns of estimated voucher effects.

24
Educational Outcomes and Voucher Status (I)Bogotá 1995 Combined sample
Dependent variableLoser means
(1)No controls
(2)
Basiccontrols
(3)
Basic +19barrio
controls(4)
Basiccontrols
(5)
Basic +19barrio
controls(6)
Using any scholarship insurvey year
0.057(0.232)
0.509***(0.023)
0.504***(0.023)
0.505***(0.023)
0.526***(0.019)
0.521***(0.019)
Ever used a scholarship 0.243(0.430)
0.672***(0.021)
0.663***(0.022)
0.662***(0.022)
0.636***(0.019)
0.635***(0.019)
Started 6th grade inprivate
0.877(0.328)
0.063***(0.017)
0.057***(0.017)
0.058***(0.017)
0.066***(0.016)
0.067***(0.016)
Started 7th grade inprivate
0.673(0.470)
0.174***(0.025)
0.168***(0.025)
0.171***(0.024)
0.170***(0.021)
0.173***(0.021)
Currently in privateschool
0.539(0.499)
0.160***(0.028)
0.153***(0.027)
0.156***(0.027)
0.152***(0.023)
0.154***(0.023)
Highest grade completed 7.5(0.960)
0.164***(0.053)
0.130***(0.051)
0.120***(0.051)
0.085**(0.041)
0.078**(0.041)
Currently in school 0.831(0.375)
0.019(0.022)
0.007(0.020)
0.007(0.020)
-0.002(0.016)
-0.002(0.016)
Sample size 562 1,147 1,577Notes: The table reports voucher losers’ means and the estimated effect of wining a voucher. Numbers in parenthesesare standard deviations in columns of means and standard errors in columns of estimated voucher effects.*** significant at 1% ** significant at 5% * significant at 10%

25
Educational Outcomes and Voucher Status (II)Bogotá 1995 Combined sample
Dependent variableLoser means
(1)No controls
(2)
Basiccontrols
(3)
Basic +19barrio
controls(4)
Basiccontrols
(5)
Basic +19barrio
controls(6)
Finished 6th grade 0.943(0.232)
0.026**(0.012)
0.023*(0.012)
0.021*(0.011)
0.014(0.011)
0.012(0.010)
Finished 7th grade(excludes Bogotá 97)
0.847(0.360)
0.040**(0.020)
0.031(0.019)
0.029(0.019)
0.027(0.018)
0.025(0.018)
Finished 8th grade(excludes Bogotá 97)
0.632(0.483)
0.112***(0.027)
0.100***(0.027)
0.094***(0.027)
0.077***(0.024)
0.074***(0.024)
Repetitions of 6th grade 0.194(0.454)
-0.066***(0.024)
-0.059**(0.024)
-0.059**(0.024)
-0.049***(0.019)
-0.049***(0.019)
Ever repeated after lottery 0.224(0.417)
-0.060***(0.023)
-0.055**(0.023)
-0.051**(0.023)
-0.055***(0.019)
-0.053***(0.019)
Total repetitions sincelottery
0.254(0.508)
-0.073***(0.028)
-0.067**(0.027)
-0.064**(0.027)
-0.058***(0.022)
-0.057***(0.022)
Years in school sincelottery
3.7(0.951)
0.058(0.052)
0.034(0.050)
0.031(0.050)
0.015(0.044)
0.012(0.043)
Sample size 562 1,147 1,577Notes: The table reports voucher losers’ means and the estimated effect of wining a voucher. Numbers in parentheses arestandard deviations in columns of means and standard errors in columns of estimated voucher effects.*** significant at 1% ** significant at 5% * significant at 10%

26
Test Results
VariableOLS results
(1)
OLS resultswith covariates
(2)
RE(3)
RE withcovariates
(4)
Sample size(5)
Total Points 0.217*(0.116)
0.205*(0.108)
282
Math scores 0.178(0.120)
0.153(0.114)
282
Reading scores 0.204*(0.115)
0.203*(0.114)
283
Writing scores 0.126(0.116)
0.128(0.105)
283
Pooled testscores
0.170*(0.095)
0.148*(0.088)
846
Math andreading scores
0.192*(0.101)
0.162*(0.096)
568
Robust standard errors are reported in parentheses.*** significant at 1% ** significant at 5% * significant at 10%

27
Observational Studies Economists rarely have the opportunity to
randomize variables like educational attainment, immigration or minimum wages. Normally, we must rely on observational studies.
An observational study is an empiric investigation of treatments, policies, or exposures and the effects they cause.
They differ from an experiment in that the investigator cannot control the assignment of treatment to subjects.

28
Cochran (1965) defined an observational study as an empiric investigation in which:
«…The objective is to elucidate cause-and-effect relationships … [in which] it is not feasible to use controlled experimentation, in the sense of being able to impose the procedures or treatments whose effects it is desired to discover, or to assign subjects at random to different procedures.»

29
References
Rosenbaum, Paul (2002): Observational Studies, Springer. Chapter 2.
W. G. Cochran (1965): “The planning of observational studies of human populations”, Journal of the Royal Statistics Association Series A 128, pp. 134-155, with discussion.
Angrist, J., E. Bettinger, E. Bloom, E. King and M. Kremer (2002): “Vouchers for Private Schooling in Colombia: Evidence from a Randomized Natural Experiment”, American Economic Review, 92, pp. 1535-58.
Angrsit, J. and V. Lavy (2002): “The Effect of High School Matriculation Awards: Evidence from Randomized Trials”, NBER Working Paper.