Embed Size (px)
Citation preview

Impact evaluation of Support Programme for Industrial Innovation
Final evaluation report submitted to DPME by Genesis Analytics 1, 3, 25 version 24 April 2014
ii
Document Reference: SPII_Impact_Evaluation – Final_Evaluation_Report:1,3,25 version
Date: 24 April 2014
Contact Information
Genesis Analytics (Pty) Ltd
Office 3, 50 Sixth Road Hyde Park, 2196, Johannesburg South Africa
Post to: PO Box 413431, Craighall, 2024 Johannesburg, South Africa
Tel: +2711 994 7000 Fax: +2711 994 7099
www.genesis-analytics.com
Authors
Genesis Analytics
Contact Person
Alyna Wyatt

iii
Table of Contents
GLOSSARY .................................................................................................... I
POLICY SUMMARY ....................................................................................... I
EXECUTIVE SUMMARY ................................................................................ I
1.1. Findings ................................................................................................... i
1.2. Recommendations ...................................................................................ii
SUMMARY REPORT ..................................................................................... 1
1.1. Background to the evaluation ................................................................. 1
1.1.1. Objectives of the impact evaluation ........................................................... 1
1.1.2. Evaluation criteria ....................................................................................... 2
1.2. Background to the intervention ............................................................... 2
1.3. Methodology ........................................................................................... 4
1.3.1. Limitations .................................................................................................. 4
1.4. Findings .................................................................................................. 4
1.4.1. Impact of SPII on South Africa’s competitiveness and broader development objectives .............................................................................. 4
1.4.2. Impact and relevance of SPII in the South African innovation landscape . 9
1.4.3. Achievement of and constraints to SPII’s objectives ............................... 12
1.4.4. Institutional efficiency as it relates to the impact of SPII .......................... 14
1.4.5. Sustainability ............................................................................................ 16
1.5. Analysis ................................................................................................ 17
1.5.1. Impact ....................................................................................................... 17
1.5.2. Cost effectiveness .................................................................................... 22
1.5.3. Processes ................................................................................................. 22
1.6. Recommendations ................................................................................ 24
ANNEXES .................................................................................................... 27
Annex 1: Detail of the methodology ................................................................ 27
1.1. Desktop review ..................................................................................... 27
1.2. Analysis Framework ............................................................................. 27
1.3. Quantitative data analysis ..................................................................... 28
iv
1.3.1. Project reporting data ............................................................................... 28
1.3.2. Administered survey questionnaire .......................................................... 29
1.4. Qualitative research .............................................................................. 30
1.4.1. Key Informant Interviews .......................................................................... 30
1.4.2. Case Studies ............................................................................................ 31
1.5. Limitations ............................................................................................ 33
Annex 2: References...................................................................................... 35
Annex 3: Proposed logframe .......................................................................... 37
List of Figures Figure 1: Timeline of SPII's evolution ....................................................................................... 3 Figure 2: Was the project commercialised (absolute) .............................................................. 5 Figure 3: Was the project commercialised (relative) ................................................................ 5 Figure 4: How long it took survey respondents to achieve commercialisation ......................... 5 Figure 5: Return on investment ................................................................................................ 6 Figure 6: Length of time to achieve profitability ........................................................................ 6 Figure 7: Would you have been able to attempt your project without SPII funding?................ 7 Figure 8: Did unsuccessful applicants continue despite lack of SPII support? ........................ 7 Figure 9: SPII’s contribution to success ................................................................................... 8 Figure 10: Average job creation per project ............................................................................. 8 Figure 11: Number of employees trained ................................................................................. 9 Figure 12: South African innovation landscape 2013 ............................................................. 11 Figure 13: Perceived impediments to innovation in South Africa ........................................... 12 Figure 14: SPII theory of change ............................................................................................ 21 Figure 15: Sample and response by scheme ......................................................................... 29 Figure 16: Sample and response by location ......................................................................... 29 Figure 17: Sample and response by SPII status .................................................................... 30
List of Tables Table 1: Characteristics of SPII schemes ................................................................................. 3 Table 2: Data collection tools.................................................................................................... 4 Table 3: Tax revenue from April 2006 to April 2011 ................................................................. 9 Table 4: Summary of SPII commitments, MTEF expenditure and fees ................................. 13 Table 5: SPII's performance against international best practice ............................................ 23 Table 6: Data availability ......................................................................................................... 28
i
GLOSSARY
CSIR Council for Scientific and Industrial Research
ROI Return on Investment
DAC Development Assistance Criteria Seda Small Enterprise Development Agency
DPME Department of Performance Monitoring and Evaluation
SME Small and medium enterprise
dti Department of Trade and Industry SMME Small, medium and micro-sized enterprise
IDC Industrial Development Corporation SPII Support Programme for Industrial Innovation
IP Intellectual Property TIA Technology Innovation Agency
MRC Medical Research Council TOR Terms of Reference
PII Partnership Scheme TTF Technology Transfer Fund
PPD Product Process Development TVC Technology Venture Capital
R&D Research and Development

i
POLICY SUMMARY
The purpose of this evaluation is to provide insight into the effectiveness and efficiency of the current model of implementation of the Support Programme for Industrial Innovation (SPII), assess the impact of SPII and to determine how the beneficial impacts can be strengthened.
We believe that SPII should continue given the important and extremely relevant role it plays in the innovation landscape in South Africa. The following recommendations were developed based on the findings of the study, some of which will have cost implications should they be adopted:
Policy and programme design recommendations
1. SPII should clearly define its objectives, with corresponding targets, and its achievement of these should be measured annually. There should be clear recognition that SPII cannot be directly responsible for the short-term fulfillment of job creation, economic growth, or competitiveness targets as the funding is for pre-commercialisation activities. A draft logframe has been developed and can be completed by the SPII team. This is a major priority.
2. SPII’s mandate to support and enhance innovation in business/industry should not be overwhelmed by a mandate to address direct job creation. SPII is not an enterprise development fund. The developments in products, productivity, scale and skills requirements that result from successful innovation will lead to long term economic growth and job creation. The direct and indirect benefits have been made explicit in SPII’s theory of change (presented on Page 21).
3. SPII should continue to stimulate innovation in products/processes and in geographical areas where opportunities are the greatest.
Implementation recommendations
4. The application appraisal process should more rigorously assess an applicant’s prospects of successful commercialisation as a key criterion, however; this does need to take into consideration the timeframe required to reach commercialisation.
5. Greater linkages with other innovation actors and programmes in the private and public sectors should be encouraged. SPII should consider addressing the lack of business skills amongst some of its funded projects, particularly SMEs, through improved linkages to training programmes, incubators and other competent service providers.
6. SPII should adopt less of a one-size-fits-all approach to its application and funding processes, which should differ according to scheme. Consideration should be given to the creation of specialist teams with specific skills sets for the types of firms assessed and funded.
7. SPII should formalise internal processes that generate lessons from applications, successful and unsuccessful projects, and applicants’ feedback.
8. A web-based platform for applications, internal appraisals, and project reporting data (during and post funding) should be established.
9. A set of indicators to determine the success of SPII itself should be established, linked to the objectives and targets (particularly the commercialisation of approved projects) highlighted in its theory of change, and benchmarked against the scheme’s previous performance.
10. SPII should remain a specialised innovation fund located within a specialised fund management institution to allow for the dynamic and changing needs of the innovators and to maintain a focused, flexible and opportunity driven approach.

i
EXECUTIVE SUMMARY
This report presents an impact evaluation of the Support Programme for Industrial Innovation (SPII) for the thirteen year period 2000/01 - 2012/13. The purpose of this evaluation is to provide insight into the effectiveness and efficiency of the current model of implementation of SPII, assess the impact of SPII and to determine how the beneficial impacts can be strengthened.
Although this was initially considered an impact evaluation in the Terms of Reference (ToR), the limited availability of data has constrained this evaluation’s ability to robustly identify and attribute impact in all instances, and so focus is also given to the implementation factors that both limit and enhance SPII’s impact. A broader recommendation for further evaluations is to conduct evaluability assessments of the projects and programmes to be evaluated prior to the finalisation of the ToRs to provide insight into the type of evaluation that can be conducted.
1.1. FINDINGS
Impact of SPII on South Africa’s competiveness and broader development objectives: Successful commercialisation is the ultimate indicator of project (and innovation) success. Survey responses show that 25% of PPD projects and 53% of SPII matching scheme projects were commercialised. Further, the survey showed that 47% of respondents who received SPII support said that they could not have continued without SPII funding, while 57% of rejected applicants reported to not have continued with their project. Further analysis revealed that an accepted SPII application has a higher probability of commercialisation than a project that was rejected. This could be that SPII assists projects to commercialise; or it could be that SPII only selects projects that are likely to succeed regardless of whether they receive SPII funding or not. However; the findings did identify that bridging the gap between the pre-production prototype stage and commercialisation remains the most significant barrier impeding the success of innovations, and that this was exacerbated for smaller firms.
The survey results suggest that on average, both accepted and rejected SPII projects create jobs. However, it is not possible to attribute increased permanent job creation for companies that are participants of SPII against companies that are not. In total it is estimated that SPII funded projects have directly created or retained approximately 3000 permanent jobs1. According to the same data ZAR 622 671 640 was received from SPII by the funded projects, which equates to approximately ZAR 207 560 per job. However, it must be noted that SPII, according to its objectives, does not aim to generate employment, but merely to stimulate innovation. It is also important to note that the job figures reported here relate to those created directly within SPII recipient companies, and does not include those created indirectly once the innovation is commercialised. Regarding skills development, the survey results show that the majority of survey respondents trained between one and five employees for their project. The case studies suggest that this is usually on-the-job training and is product specific in one-product companies.
Impact and relevance of SPII in the South African Innovation Landscape: SPII contributes to specific stages in the innovation cycle (the end of basic research to the development of a pre-commercialisation prototype). The majority of interview respondents believe that SPII fills an important role by funding these stages, as traditional sources of funding are difficult to obtain at these points in the process in South Africa. The survey revealed that the availability of appropriate forms of financing, the cost of innovation and the length of pay-off period associated with innovation
1 Detail provided in the report that follows as well as the full report submitted to the DPME.

ii
are perceived to be the greatest barriers to innovation in South Africa, all of which SPII attempts to address through its provision of grants in the less developed and risk-adverse venture capital market of South Africa.
In terms of other available funding mechanisms, the Technology Innovation Agency (TIA) and SPII both provide funding for the purpose of prototype development. These could be used in a complimentary manner for innovators requiring support, however, a number of industry stakeholders who have had experience working with TIA noted that SPII is the dominant player in this space. This finding was supported by the findings of the 2013 Ministerial Review of TIA, which found that there was a distinct lack of confidence in TIA from both the public and private sector.
Achievement of and constraints to SPII’s objectives: Between the dti and the IDC a business plan is developed each year with targets on how many projects to fund and the monetary value available to commit to projects. When assessed against these targets, SPII has successfully met all of its annual targets and thus would be considered to have been effective. However, this narrow interpretation of a programme’s effectiveness does not actually refer to the achievement of any results. Currently, there are no targets set with respect to the number of projects successfully commercialised, the number of projects producing a positive return on investment, or the number of (direct and indirect) jobs created.
Institutional efficiency as it relates to the impact of SPII: The average time between submission of a SPII application to rejection or approval is approximately 166 days. However, on the whole, case study respondents reported SPII’s application process to be efficient, but very much dependent on the consultant and account manager assigned to the project. Two factors are considered when evaluating an application - economic merit and the level of innovation. These are currently broad, open-ended and subject to interpretation when evaluating applications.
Smaller companies reported SPII’s contracting and reporting processes to be more costly and onerous than larger companies. Respondents also noted that SPII’s follow-up reporting is limited to financials and employment figures and is unable to establish progress for projects that have not been commercialised yet, or provide reasoning for the lack of commercialisation.
Constraints SPII administrators face in achieving the programme’s objectives were consistently reported to be a lack of funding for the scheme. It was also stated by SPII stakeholders that SPII’s account managers and post-investment team is small and is often overburdened.
Sustainability: Many industry stakeholders confirmed the importance of SPII funding being grant-based as any form of repayable funding would stifle innovation. Given that SPII is grant-based, the programme itself is not financially sustainable, nor was it designed to be. However; at the project level, respondents noted that projects, particularly those of smaller firms, would likely have a greater chance of success if business development support was provided in conjunction with the SPII funding or if projects were incubated during and post-SPII funding.
1.2. RECOMMENDATIONS
SPII should continue given the important and extremely relevant role it plays in the innovation landscape in South Africa, its direct impact on innovation and its potential indirect impact on long-term job creation and increased competitiveness. The following set of recommendations have been provided, each of which will have cost implications should they be adopted:

iii
Policy and programme design recommendations
1. SPII should clearly define its objectives, with corresponding targets, and its achievement of these should be measured annually. There should be clear recognition that SPII cannot be directly responsible for the short-term fulfilment of job creation, economic growth, or competitiveness targets, but that it can play an indirect role in contributing to the achievement of these outcomes. A draft logframe has been developed and can be completed by the SPII team.
2. SPII’s mandate to support and enhance innovation in business/industry should not be overwhelmed by a mandate to address direct job creation. SPII is not an enterprise development fund. The developments in products, productivity, scale and skills requirements that result from successful innovation will lead to long term economic growth and job creation. The direct and indirect benefits have been made explicit in SPII’s theory of change (presented on Page 21).
3. SPII should continue to stimulate innovation in products/processes and in geographical areas where opportunities are the greatest.
Implementation recommendations:
4. The application appraisal process should more rigorously assess an applicant’s prospects of successful commercialisation as a key criterion.
5. SPII should adopt less of a one-size-fits-all approach to its application and funding processes, which should differ according to scheme. Consideration should be given to the creation of specialist teams of programme managers within each scheme with specific skills sets for the types of firms they assess and fund.
6. In order to strategically build a project portfolio, consideration should be given to: collectively considering applications at a limited number of defined points in a year, allocating defined but flexible funding amounts to each of the three schemes per funding round, and adopting a more targeted and proactive marketing approach.
7. Greater linkages with other innovation actors and programmes in the private and public sectors should be encouraged. SPII should consider explicitly addressing the lack of business skills amongst some of its funded projects, particularly SMEs, through improved linkages to training programmes, incubators and other competent service providers.
8. SPII should formalise internal processes that generate lessons from applications, from successful and unsuccessful projects, and from applicants’ feedback following each funding round.
9. A web-based platform for applications, internal appraisals and project reporting data (during and post funding) should be established.
10. A set of indicators for success of SPII itself should be determined, linked to the objectives and targets (particularly the commercialisation of approved projects) highlighted in its theory of change, and benchmarked against the scheme’s previous performance.
11. Recipients of SPII funding should have greater accountability to SPII to report progress on the funded project once the funding period has ended by, for example, clearly stating reporting requirements in contracts and the use of automated emails reminding grantees of their contractual obligation to report with a link to the web-based platform.
12. SPII should remain a specialised innovation fund located within a specialised fund management institution and maintain a focused, flexible and opportunity driven approach.
1
SUMMARY REPORT
1.1. BACKGROUND TO THE EVALUATION
The Department of Performance Monitoring and Evaluation (DPME), as part of its mandate under the National Evaluation Policy Framework (NEPF) and in partnership with the Department of Trade and Industry (the dti), commissioned Genesis Analytics to conduct an impact evaluation of the Support Programme for Industrial Innovation (SPII) for a thirteen year period from 2000/01 - 2012/13. SPII is a dti initiative that is administered by the Industrial Development Corporation (IDC). SPII supports the development of viable, innovative products and/or processes and the commercialisation thereof.
1.1.1. Objectives of the impact evaluation
The purpose of this evaluation is to provide insight into the effectiveness and efficiency of the current model of implementation, assess the impact of SPII and to determine how the beneficial impacts can be strengthened. In carrying out the evaluation the Genesis team was guided by a number of overarching questions, namely:
What is the impact of SPII on South Africa’s innovation landscape?
What impact does SPII have on economic development through technology transfer and technology development?
Do industry partners realise a significant return on investment (ROI) from SPII; after how long?
Does South Africa realize a return on investment from SPII against the cost of delivering the programme in terms of:
o Economic growth and empowerment; o Skills development and job creation (rate); o Taxable Revenue; and o Competitiveness.
What happens to the Intellectual Property from complete SPII projects?
Is SPII still relevant when considering other instruments in the innovation landscape?
What factors in the South African context enable or constrain the beneficial impact of SPII, including the long term sustainability of those impacts?
How can the beneficial impacts of SPII be strengthened?
Is the current model of delivering SPII cost effective in comparison to alternative models?
What effect do institutional mechanisms (structure, management, administration, and processes) have on the efficiency and effectiveness of delivering programme outcomes?
How does SPII performance compare to similar programmes nationally and internationally?
Although this is considered an impact evaluation in the Terms of Reference (ToR), a number of these evaluation questions are also focused on the implementation of the programme. Furthermore, the limited availability of data has constrained this evaluation’s ability to robustly identify and attribute impact in all instances, and so focus is also given to the implementation of

2
SPII, using qualitative and quantitative research to understand the implementation factors that both limit and enhance SPII’s impact.
A critical point that the evaluation process highlighted to the evaluation team is the importance of conducting an evaluability assessment prior to finalising and issuing a ToR to ensure that the context and data available can reasonably answer particular types of evaluation questions. Had this been done in this case prior to the ToR being issued – it would have more likely been appropriate to focus this evaluation on implementation, rather than on impact.
1.1.2. Evaluation criteria
The Development Assistance Community (DAC)2 evaluation criteria were selected as the guiding framework for the evaluation in order to gather the information required to answer all the evaluation questions. This approach provided an in depth assessment of the programme’s relevance, effectiveness, efficiency, impact, and sustainability, as well as additionality.
1.2. BACKGROUND TO THE INTERVENTION
In discussing the SPII programme it is important to start by exploring the definition and process of innovation. According to the World Bank, innovations can be described as “technologies or practices that are new to a given society. They are not necessarily new in absolute terms. These technologies or practices are being diffused in that economy or society. This point is important: what is not disseminated and used is not an innovation. Dissemination is very significant and requires particular attention in low- and medium-income countries.”3
In 1989, the dti introduced the Innovation Support for Electronics (ISE) programme to fund up to 50% of specified costs incurred by electronics firms in the development of new products. The objective of the ISE programme was to promote technology development so as to assist import replacement and increased exportation of electronics. The dti appointed the IDC to administer the programme on its behalf.
In April 1993, the ISE was extended and restructured to cover all sectors of the economy, except defence, as a means to catalysing a wider range of innovation. The restructured programme was thus named the Support Programme for Industrial Innovation (SPII). Specifically, SPII was designed to promote the development of commercially viable, innovative products and/or processes and facilitate the commercialisation of such technologies, through the provision of financial assistance.
Since its inception in 1993, SPII has undergone a number of changes to streamline its processes and to increase its accessibility to South African entities and general citizenry. These changes included the introduction of the Partnership Scheme in 1999 to fund large projects by corporate entities; and the introduction of the Black Economic Empowerment (BEE) Scheme to increase accessibility for BEE companies in 2004. The BEE Scheme was revised in 2005 to broaden its mandate to include support for small, very small and micro-enterprises, and as a result was renamed the Product Process Development (PPD) Scheme. Currently, SPII offers three schemes: The PPD Scheme, the SPII Matching Scheme, and the SPII Partnership Scheme (PII). These
2 The OECD’s DAC (Development Assistance Community) criteria provide a useful framework for evaluating developmental assistance. More information is available at http://www.oecd.org/dac/evaluationofdevelopmentprogrammes/daccriteriaforevaluatingdevelopmentassistance.htm. 3 Innovation Policy: A Guide for Developing Countries – World Bank (2010)

3
schemes differ according to the size of the applicant firms, percentage of qualifying costs covered and maximum funding amount, as shown in the table below.
Table 1: Characteristics of SPII schemes Name of scheme Funding mechanism Size of applicant firm Value of grant Grant limit
PPD Non-repayable grant Small, medium and micro-sized enterprises
Between 50% to 85% Up to R2 million
Matching Non-repayable grant Small and medium enterprises
Between 50% and 75% Up to R5 million
PII Conditionally repayable grant Large companies 50% Minimum of R10
million
Financial assistance is only available for projects that have already concluded basic research; and financial assistance ends after the pre-production prototype of the product or process is complete. In 2011 SPII underwent a review process in order to better align it with IDC rules and criteria. A timeline of the major changes to SPII since its inception are presented in the figure below.
Figure 1: Timeline of SPII's evolution
The majority of SPII projects are in Gauteng, the Western Cape and KwaZulu-Natal, and SPII continues to fund a vast majority in the electronics and ICT industries.

4
1.3. METHODOLOGY
A combination of quantitative and qualitative methodologies was used in conducting the evaluation. Table 2 presents the tools used to collect data for the evaluation.
Table 2: Data collection tools Instrument Response Response rate Key informant interviews 33 interviewees 76.7% Survey of SPII applicants (approved and rejected)
230 respondents 34.5%
Case studies of SPII funded projects
20 detailed case studies (8 in Gauteng, 8 in Western Cape and 4 in KwaZulu Natal)
Completed project reporting data review
218 54.4% (of the 401 completed projects only 218 had sales data)
1.3.1. Limitations
The evaluation faced a number of constraints, including limited reporting data, a lower response rate to the survey than expected, and the refusal or unavailability of some stakeholders to participate in the evaluation. These constraints have limited the ability of the team to identify and attribute impact in certain instances and have resulted in the evaluation having a greater focus on the implementation factors that either enhance or dilute SPII’s impact. Additionally, the majority of companies interviewed received funding before 2012 and as such do not reflect the changes made to SPII post-2012. Despite this, the quality of the evaluation has not been negatively affected.
1.4. FINDINGS
The findings from the evaluation process are discussed in detail below. The findings presented draw on both the qualitative and quantitative research process.
1.4.1. Impact of SPII on South Africa’s competitiveness and broader development
objectives
The impact of SPII on South Africa’s competiveness and broader development objectives measures the extent to which SPII has directly or indirectly effected social, economic and other development indicators, be they intended or unintended.
1.4.1.1. Achievement of projects funded by SPII
Successful commercialisation is the ultimate indicator of project success. However, it must be noted that SPII has no influence on the commericialisation process of projects once SPII funding has reached completion. It must also be noted that many projects take longer than three years to reach commercialisation post SPII support; thus, the reporting data likely underestimates the number of commercialised projects. Analysis of the reporting data was therefore supplemented by survey data. When splitting this measure of success by scheme, we find that the SPII Matching scheme funded projects have been relatively more successful at achieving commercialisation than the PPD scheme. Figure 2 and Figure 3 illustrate this finding; while Figure 4 presents the time it took survey respondents to achieve commercialisation:

5
Figure 2: Was the project commercialised (absolute)
Figure 3: Was the project commercialised (relative)
Figure 4: How long it took survey respondents to achieve commercialisation4
It was highlighted by industry stakeholders and case study respondents that bridging the gap between the pre-production prototype stage and commercialisation was the most significant barrier impeding the success of innovations, and that this was exacerbated for smaller firms.
Another indicator of achievement is the return of investment (ROI) produced by the innovation. As shown in Figure 5 below, projects on the Matching scheme have been more effective at realising a positive return than those on the PPD scheme.
4 The percentage of respondents who are still in the pre-production phase are not included in the graphic
33 12 15 27 11 43 3 0 7 0
10
20
30
40
50
N/A (Still in pre-production) No Yes
Num
ber o
f pro
ject
s PPD
Matching
PII
52.38% 52.17% 23.08% 42.86% 47.83% 66.15% 4.76% 0.00% 10.77%
0.00%
20.00%
40.00%
60.00%
80.00%
N/A (Still in pre-production) No Yes
Pe
rce
nta
ge o
f p
roje
cts PPD Matching PII
3% 13% 4% 8% 12% 11% 1% 23% 15% 4% 16% 11% 9% 27% 9% 9% 0% 0% 0.00%
5.00%
10.00%
15.00%
20.00%
25.00%
30.00%
0-6 months 12-24 months 24-36 months 6-12 months More than 36months
Was nevercommercialised
Perc
enta
ge o
f res
pond
ents
Months to commercialisation
PPD SPII Matching Scheme PII
6
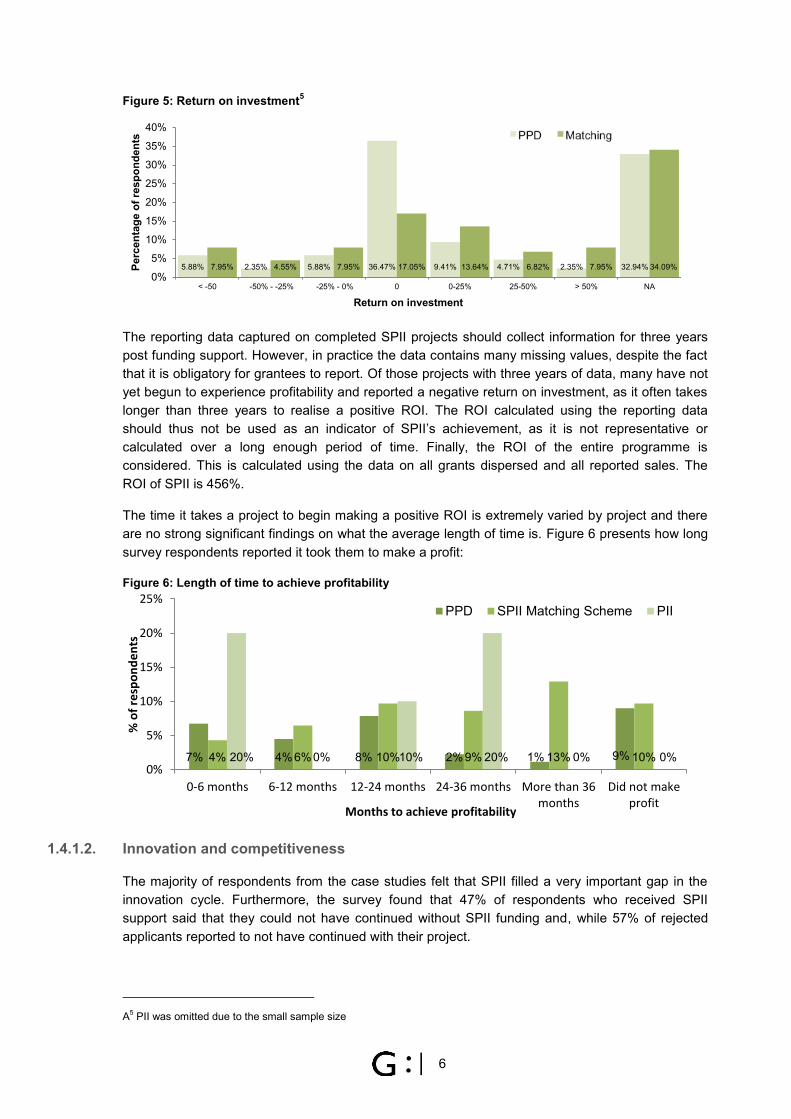
Figure 5: Return on investment5
The reporting data captured on completed SPII projects should collect information for three years post funding support. However, in practice the data contains many missing values, despite the fact that it is obligatory for grantees to report. Of those projects with three years of data, many have not yet begun to experience profitability and reported a negative return on investment, as it often takes longer than three years to realise a positive ROI. The ROI calculated using the reporting data should thus not be used as an indicator of SPII’s achievement, as it is not representative or calculated over a long enough period of time. Finally, the ROI of the entire programme is considered. This is calculated using the data on all grants dispersed and all reported sales. The ROI of SPII is 456%.
The time it takes a project to begin making a positive ROI is extremely varied by project and there are no strong significant findings on what the average length of time is. Figure 6 presents how long survey respondents reported it took them to make a profit:
Figure 6: Length of time to achieve profitability
1.4.1.2. Innovation and competitiveness
The majority of respondents from the case studies felt that SPII filled a very important gap in the innovation cycle. Furthermore, the survey found that 47% of respondents who received SPII support said that they could not have continued without SPII funding and, while 57% of rejected applicants reported to not have continued with their project.
A5 PII was omitted due to the small sample size
5.88% 2.35% 5.88% 36.47% 9.41% 4.71% 2.35% 32.94% 7.95% 4.55% 7.95% 17.05% 13.64% 6.82% 7.95% 34.09% 0%
5%
10%
15%
20%
25%
30%
35%
40%
< -50 -50% - -25% -25% - 0% 0 0-25% 25-50% > 50% NA
Perc
enta
ge o
f res
pond
ents
Return on investment
7% 4% 8% 2% 1% 9% 4% 6% 10% 9% 13% 10% 20% 0% 10% 20% 0% 0% 0%
5%
10%
15%
20%
25%
0-6 months 6-12 months 12-24 months 24-36 months More than 36months
Did not makeprofit
% o
f re
spo
nd
en
ts
Months to achieve profitability
PPD SPII Matching Scheme PII

7
Figure 7 and Figure 8 below illustrate these findings and how there appears to be a relationship between turnover size of a firm and the ability to continue without SPII funding:
Figure 7: Would you have been able to attempt your project without SPII funding?6
Figure 8: Did unsuccessful applicants continue despite lack of SPII support?
These results cannot be interpreted as SPII creating innovators, but rather that SPII helps facilitate and enable innovation, as it provides those with innovative ideas with access to finance, the absence of which represents a binding constraint on further investment in the idea.
Further analysis, using a probit model, indicates the following7:
Holding all else constant and on average, an accepted SPII application has a higher probability of success than a project that was rejected. This can be the result of two directions of causation. It could be that SPII funding assists projects to commercialise or it could be that SPII only selects projects that are likely to succeed regardless of whether they receive SPII’s funding or not. However, it is also possible that it is a combination of these, that SPII both selects good projects and assists them in getting to market.
Holding all else constant and on average, the size of a company in terms of turnover is significantly positively correlated with the probability of commercialisation.
The reporting data collected by the IDC includes a five-question survey, asking to what degree SPII contributed to the ‘significant advancement in technological expertise, job creation and retention, technical success of the project and the commercial success of the project’. The respondents are asked to rate the degree of contribution from 1 to 5. Respondents generally feel that SPII contributes to both the technical and commercial success of their projects. Figure 9 bellow illustrates this finding:
6 Number of respondents reported in brackets 7 Probit Analysis is a type of regression used with binary response variables
78% 56% 42% 20% 25% 41% 0% 9% 16% 16% 8% 9% 22% 35% 42% 64% 67% 50% 0%
10%
20%
30%
40%
50%
60%
70%
80%
90%
Zero(18)
< R1m(55)
R1m - R2m(19)
R2m - R5m(25)
R5m - R10m(12)
> R10m(22)
Perc
enta
ge o
f res
pond
ents
Turnover
No Yes Yes, but smaller scale or over longer period
57% 68% 43% 36% 43% 32% 57% 64% 0%
20%
40%
60%
80%
Zero(7)
< R1m(37)
R1m - R2m(7)
> R2m(14)
Perc
enta
ge o
f re
spon
dent
s
Turnover
No Yes

8
Figure 9: SPII’s contribution to success
1.4.1.3. Job creation and skills development
Innovation has an ambiguous direct effect on employment; it can generate jobs by creating new markets or it can lead to temporary restructuring towards methods that can replace labour inputs. However, in the medium to long term, innovation can lead to economic development and improvements to competitiveness which will in turn lead to job creation. The survey results report that on average, both the SPII funded and non-SPII funded innovation projects created jobs8. The results are displayed below in Figure 10:
Figure 10: Average job creation per project
While it is not possible to attribute increased permanent job creation for companies that are participants of SPII against companies that are not, the findings illustrate that many jobs have been created by companies on SPII.
Using the reporting data from the IDC, the average number of permanent jobs created per sector and scheme is calculated. In total we estimate that SPII funded projects have directly created or retained approximately 3000 permanent jobs9. The total number of jobs created is calculated by multiplying the average by the total number of projects in each sector and scheme (described in more detail in the full report). According to the same data ZAR 622 671 640 was received from SPII by the funded projects, which equates to approximately ZAR 207 560 per job. However, it must be noted that SPII, according to its objectives, does not aim to generate employment, but merely to stimulate innovation. It is also important to note that the job figures reported and analysed here relate to those created directly within SPII recipient companies, and does not include those created indirectly once the innovation is commercialised. It is noted that SPII records indicate approximately 23 000 jobs were created between 2000 and 2012 however; the 8 SPII does not define the characteristics or criterion for a job and therefore is a loose concept that does not necessarily equate to a fulltime equivalent. 9 This is estimated by calculating a weight for each sector and scheme using a sample of completed projects with job data and then applying this weight to the average sector/scheme.
4% 9% 19% 37% 31% 8% 13% 24% 26% 29% 0%5%
10%15%20%25%30%35%40%
1 2 3 4 5
Perc
enta
ge o
f re
spon
dent
s
Degree to which SPII assisted
Technical success of project Commercial success of project
1.6
0.9 0.8 0.8 1.0
0.8
1.7 1.3
1.0
0.00.20.40.60.81.01.21.41.61.8
Temporary positionsduring development
(Skilled)
Temporary positionsduring development
(Unskilled)
Temporary positions afterdevelopment (Semi-
skilled)
Permanent positions(Skilled)
Permanent positions(Unskilled)
Ave
rage
nu
mb
er
of
job
s

9
evaluation team is not satisfied with the accuracy and validity of these figures given our own calculations. .
Projects funded by the SPII Matching scheme have been the most successful at producing jobs, while projects funded by PII have been the least successful. The electronics sector dwarfs the other sectors in terms of job creation. However, it must be noted that the SPII scheme and the electronics sector make up approximately 60% of the funded projects.
Regarding skills development, the survey results from SPII-supported projects show that the majority of respondents trained between one and five employees for their project, while approximately 30% did not train any. The case studies suggest that in one-product companies, the entire staff is re-trained; however, this training is not necessarily technical and is product specific, such as training sales people in the knowledge of the new product.
Figure 11: Number of employees trained10
1.4.1.4. Tax revenue
Both the survey and the IDC’s reporting data had limited information on the tax revenue generated by SPII recipients. Thus the tax revenue information presented in Table 3 is unverified information from SPII’s annual reports.
Table 3: Tax revenue from April 2006 to April 2011
01 April 2010 to 31 March 2011
01 April 2009 to 31 March 2010
01 April 2008 to 31 March 2009
01 April 2007 to 31 March 2008
01 April 2006 to 31 March 2007
Taxes paid – company tax R11.1m R6.2m R35.1 million R149.3m R223.3m
Source: SPII Annual Report 2010/2011
1.4.2. Impact and relevance of SPII in the South African innovation landscape
Impact and relevance of SPII in the South African context assesses the programme’s relevance in the broader South African innovation landscape and the extent to which the programme is suited to the needs of the beneficiaries and its ability to achieve impact.
1.4.2.1. The applicability of SPII's objectives in the South African context
SPII’s mission is to “promote and assist technology development in the South African industry through the provision of financial assistance for projects that develop innovative products and/or
10 PII omitted due to small sample
39% 45% 5% 1% 4% 7% 27% 53% 11% 1% 2% 5% 0%
10%
20%
30%
40%
50%
60%
None 1 - 5 5 - 10 10 - 20 More than 20 Did not proceedwith project
% o
f res
pond
ents
Number of employees trained
PPD SPII Matching Scheme

10
processes”11. SPII administrators noted that SPII is housed within the dti, and so also aims to promote economic growth, employment and equity.
SPII has also been linked with Outcome 4 of the President’s Delivery Agreement, which is centred on job creation and decent employment. Industry stakeholders’ opinions varied around the extent to which SPII furthers these objectives. Generally respondents felt that SPII makes an indirect contribution to these objectives - innovation in itself typically creates relatively few direct jobs. However, when products or processes are successfully commercialised, a significant number of indirect jobs may be created. It was frequently noted that there should be better monitoring of these indirect impacts. Regardless, it is extremely important to note SPII was not designed to achieve these broader objectives. The Delivery Agreement and labour focus are relatively recent developments in SPII’s long history.
Industry stakeholders reported that South Africa is producing a substantial amount of research. However, very little of this is converted into commercialised products or processes. A number of stakeholders noted that SPII enabled the translation of research into working products/processes.
1.4.2.2. The relevance of SPII in the innovation process and in relation to other programmes
and funding mechanisms
SPII contributes to specific stages in the innovation cycle - specifically, SPII’s mandate covers the stages from the end of basic research to the development of a pre-commercialisation prototype. Industry stakeholders were of the opinion that SPII does fill an important role by funding these stages, as traditional funding from commercial banks is difficult to obtain at these points in the process in South Africa. Although it was felt that SPII fills an important gap, over 50% of industry stakeholders noted that the further jump to commercialisation can be significant and requires funding support, which SPII does not provide for.
Figure 12 below plots the location of these players in the innovation landscape. As this illustrates, both TIA and SPII provide funding for the purpose of prototype development. However, a number of industry stakeholders who have had experience working with TIA noted that SPII is the dominant player in this space and is the more efficient and effectively run programme12. This finding is further confirmed by the 2013 Ministerial Review of TIA13, which found that there was a distinct lack of confidence in TIA from both the public and private sector.
11 http://www.spii.co.za/SPII_intro.html 12 This may be as a result of TIA’s lack of maturity in this space and its recent changes. 13 THE REVIEW OF THE TECHNOLOGY INNOVATION AGENCY - Prepared for the Minister of Science and Technology, April 2013

11
Figure 12: South African innovation landscape 2013
Source: Genesis Analytics, 2013
1.4.2.3. The appropriateness of SPII funding
Qualifying expenditures that SPII covers were generally considered to be appropriate. However, it was noted that SPII does not cover overhead costs of employees and that in some case studies; the beneficiaries noted that although SPII covers various labour related costs, the ceiling on professional fees, which is determined by position and qualification, is prohibitive.
Whilst this exceeds the mandate of SPII, as mentioned above, a number of beneficiaries noted the need to cover tooling-up, market research and marketing costs. Industry stakeholders and the case studies confirmed this by noting that the allocated R50 000 for market research from SPII was insufficient to develop a business plan able to convince venture capitalists to invest. Moreover, PPD applicants found marketing, tooling-up, quality assurance and market analysis relatively larger than the matching fund applicants did.
There were mixed reactions as to the appropriateness of the values of SPII’s grants. Many beneficiaries noted that while they could not expect SPII to fund the full value, funding the shortfall was problematic. This was particularly true of the smaller companies that found it difficult to obtain funding from the more traditional sources such as commercial banks. However, it was generally agreed that having 100% grants opens the programme to risk and that having to put down a small contribution signals the innovators’ confidence in their product.
1.4.2.4. The impact SPII has in reducing the barriers to innovation in South Africa
The results of the survey of SPII applicants reveal that the availability of appropriate forms of financing is perceived to be the greatest barrier to innovation in South Africa. This is supported by the findings from the South African Innovation Survey conducted in 2008, where the three most-cited factors that hamper innovation were: the lack of funds within the respondent’s enterprise or group, lack of finance from sources outside of the respondent’s enterprise, and the high costs of innovation.14 This issue is compounded by the finding that the cost of innovation and the length of pay-off period associated with the innovation are the second and third greatest perceived
14 HSRC (2008). The South African Innovation Survey pg 47
Industry and business
the dti
DST
Technology Innovation Agency
Support Programme for Industry Innovation
(SPII) National Research Foundation (NRF)
THRIP Technology Venture Capital Fund
Seven statutory science councils (excl. NRF)
Universities and other research institutions
National research facilities
Research Development Commercialisation Production & Market
Macro
Meso
Micro
12
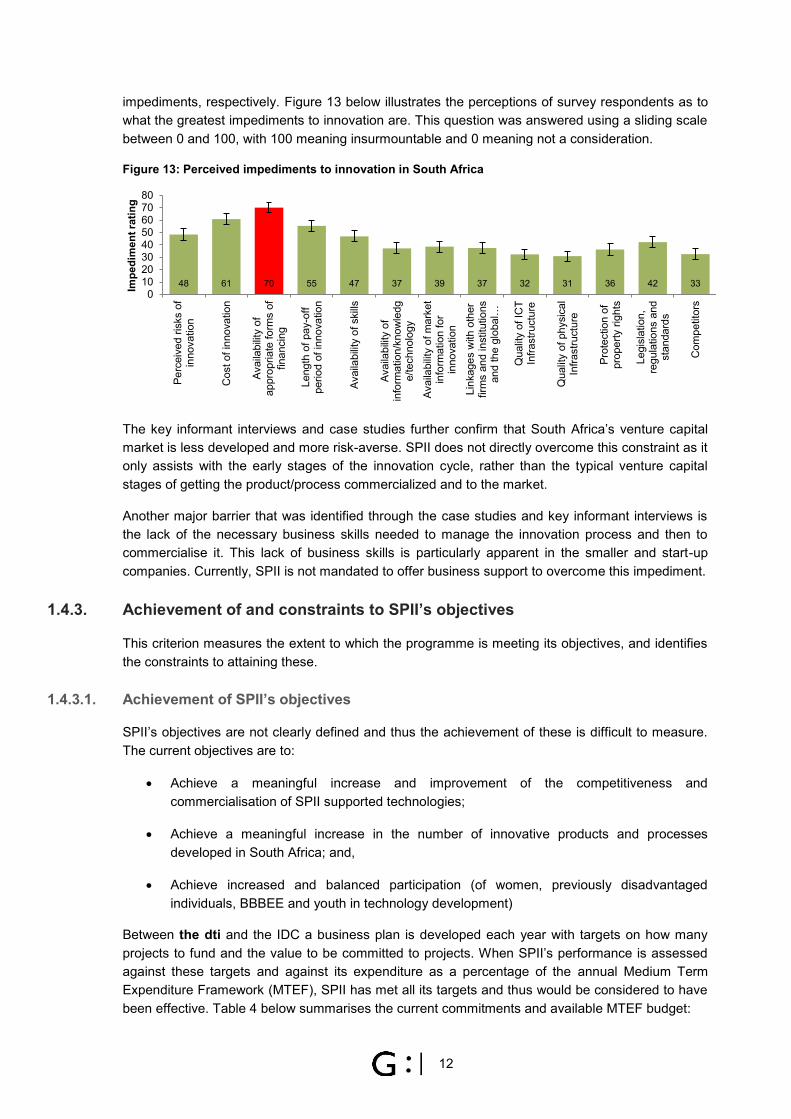
impediments, respectively. Figure 13 below illustrates the perceptions of survey respondents as to what the greatest impediments to innovation are. This question was answered using a sliding scale between 0 and 100, with 100 meaning insurmountable and 0 meaning not a consideration.
Figure 13: Perceived impediments to innovation in South Africa
The key informant interviews and case studies further confirm that South Africa’s venture capital market is less developed and more risk-averse. SPII does not directly overcome this constraint as it only assists with the early stages of the innovation cycle, rather than the typical venture capital stages of getting the product/process commercialized and to the market.
Another major barrier that was identified through the case studies and key informant interviews is the lack of the necessary business skills needed to manage the innovation process and then to commercialise it. This lack of business skills is particularly apparent in the smaller and start-up companies. Currently, SPII is not mandated to offer business support to overcome this impediment.
1.4.3. Achievement of and constraints to SPII’s objectives
This criterion measures the extent to which the programme is meeting its objectives, and identifies the constraints to attaining these.
1.4.3.1. Achievement of SPII’s objectives
SPII’s objectives are not clearly defined and thus the achievement of these is difficult to measure. The current objectives are to:
Achieve a meaningful increase and improvement of the competitiveness and commercialisation of SPII supported technologies;
Achieve a meaningful increase in the number of innovative products and processes developed in South Africa; and,
Achieve increased and balanced participation (of women, previously disadvantaged individuals, BBBEE and youth in technology development)
Between the dti and the IDC a business plan is developed each year with targets on how many projects to fund and the value to be committed to projects. When SPII’s performance is assessed against these targets and against its expenditure as a percentage of the annual Medium Term Expenditure Framework (MTEF), SPII has met all its targets and thus would be considered to have been effective. Table 4 below summarises the current commitments and available MTEF budget:
48 61 70 55 47 37 39 37 32 31 36 42 33 0
1020304050607080
Perc
eive
d ris
ks o
fin
nova
tion
Cos
t of i
nnov
atio
n
Avai
labi
lity
ofap
prop
riate
form
s of
finan
cing
Leng
th o
f pay
-off
perio
d of
inno
vatio
n
Avai
labi
lity
of s
kills
Avai
labi
lity
ofin
form
atio
n/kn
owle
dge/
tech
nolo
gy
Avai
labi
lity
of m
arke
tin
form
atio
n fo
rin
nova
tion
Link
ages
with
oth
erfir
ms
and
inst
itutio
nsan
d th
e gl
obal
…
Qua
lity
of IC
TIn
frast
ruct
ure
Qua
lity
of p
hysi
cal
Infra
stru
ctur
e
Prot
ectio
n of
prop
erty
righ
ts
Legi
slat
ion,
regu
latio
ns a
ndst
anda
rds
Com
petit
ors
Impe
dim
ent r
atin
g

13
Table 4: Summary of SPII commitments, MTEF expenditure and fees15 PPD Matching PII Committed R 62 574 713 R 111 048 718 R 6 140 338 MTEF (Surplus/deficit) (R 27 703 806) R 14 059 079 R 4 398 475 Management fee R 13 270 000
Two moratoriums on funding commitments have been drafted recently in attempts to curb the overall deficit. As mentioned above, targets are set through establishing the number of projects to be funded and the value. Currently, there are no targets set with respect to the number of projects successfully commercialised, the number of projects producing a positive return on investment, the number of (direct and indirect) jobs created, or other economically orientated measures of impact.
1.4.3.2. Constraints to SPII achieving its objectives
Case study beneficiaries and industry stakeholders were asked what they consider to be the key constraints to innovation in South Africa. The constraints consistently listed were: a lack of funding, a fragmented innovation landscape, the lack of linkage support, the lack of business expertise on behalf of innovators, and a limited skill base; each of which are described below. The lack of appropriate funding was supported by the survey findings presented in Figure 13.
Lack of funding
The South African banks and other private investors are considered to be relatively risk averse. This risk aversion restricts enterprises from entering into the innovation landscape, as they cannot obtain the necessary funding. Beyond the survey data supporting this, South Africa’s relatively low percentage of GDP invested in R&D validates this finding; South Africa invests 0.76% of its GDP in R&D16, while the average for emerging markets is 1.3%.17
Fragmented innovation landscape
The South African innovation landscape is reportedly highly fragmented, where the various agencies, including the DST, the dti, Seda, TIA, innovation hubs and SPII work in silos and their linkages with private players are limited. It was noted in the key informant interviews and the case studies that there is much confusion over the positions that TIA and SPII fill, and that there is duplication across the two funds. Should effective collaboration take place between the relevant agencies, projects could successfully transfer from one stage in the innovation cycle to the next; however, this transition is not currently facilitated because of the fragmented nature of the industry. This finding is supported by The Ministerial review (2012), which found that the national system of innovation (NSI) in South Africa is extremely fragmented; in particular, there is a lack of coordination between the different government departments that form part of the NSI.
Interviews with SPII administrators suggest that a greater collaborative effort is underway, particularly in terms of greater collaboration with TIA. If this collaboration strategy is implemented effectively over time, these perceptions may change.
Lack of linkage support
Industry stakeholders noted that South Africa operates in a “closed innovation” space whereby innovators protectively keep their ideas to themselves rather than openly sharing and learning from other innovators. This environment, in conjunction with the lack of linkage support in the innovation
15 SPII Dashboard, as of 5 February 2014 16 HSRC (2014) South African national survey of research and experimental development 17 Battelle (2014) Global R&D funding forecast
14
landscape, limits innovation in the country. The case studies consistently noted linkages support as being necessary to ensuring successful commercialisation. The type of support needed varied by company.
Respondents commonly noted the following linkages, which revolve around SPII taking on a facilitation role, as being necessary for the successful commercialisation of their project: links to other SPII projects for mentorship opportunities, introductions to international investors and/or clients through exhibitions, introductions to other government departments for procurement opportunities, links to suppliers through a trusted supplier database, and introductions to other government funding agencies or programmes. SPII does indicate that there are aspirational goals to support linkages; and have a few working partnerships in place, however, these are currently limited.
Limited skills base
The skills base in innovation is limited in two regards, the lack of experienced business people in innovation and the lack of technical skills. Innovators in South Africa are typically inexperienced business people who have creative ideas that are conducive to research and development. However, this does not always translate into the successful commercialisation of these ideas. The lack of business expertise amongst SPII recipients is so prevalent that 71% of industry stakeholders noted the need for business development support for innovators. This was further confirmed in the case studies where the smaller, start-up companies consistently commented on the need for business development support and/or mentorship.
This is not only a South African phenomenon and according to the latest OECD Science, Technology and Industry Outlook (2012), many countries are beginning to distinguish between financial measures, which includes direct funding and indirect funding, and non-financial measures, such as providing a range of services, such as provision of support services, skill development and consultancy services. There is a growing trend towards providing non-financial measures as many SMEs find this more appropriate than the former.
Additionally, complex, technical innovations require technically skilled individuals, generally with tertiary degrees. Many case studies noted that finding such employees or local subcontractors is difficult and often requires subcontracting international expertise. Both the 2007 OECD Review of Innovation Policy in South Africa and the 2012 Ministerial review noted that one of South Africa’s weaknesses in the innovation landscape was a lack of skilled human capital, particularly in the areas of mathematics, science and technology, and engineering.
1.4.4. Institutional efficiency as it relates to the impact of SPII
The efficiency of the programme is important in so much that institutional efficiency and delivery has a direct effect on the impact of the programme. Efficiency was measured by assessing the outputs of SPII in relation to the various inputs.
1.4.4.1. Application and contracting processes
On the whole, the case studies reported that the application process was efficient; however, this depended on the consultant that SPII assigned to the project to assist in the application process and the account manager assigned to the project18. Where consultants were adequately skilled and
18 In some cases these roles are separated whereas in some cases the account manager assumes the role of the consultant.
15
suited to the project, they were seen as being extremely efficient and helpful in the application process.
Most case studies suggested that the application process could be further improved by migrating it to an online platform, suggesting that over time this could extend to include the disbursement process. Furthermore, the survey results report that the smaller an enterprise is in terms of turnover, a greater number of additional costs, such as legal fees and external consultants, are incurred to complete the application process, which the case studies found to be a result of the smaller firms not having the in-house expertise or experience.
A number of the case studies noted concerns around the fact that the applicants themselves do not present their case to the investment panel, as this is rather done by the consultant/account manager responsible for each project. This can be beneficial for applicants with limited presentation skills. However, as the applicant has the greatest understanding of their proposal and project, there was consensus that he/she should at least be present to answer any questions of clarity for the investment panel.
Another policy-linked matter is that of the restrictions around intellectual property (IP), whereby it cannot be sold for a period of three years post-SPII funding. The European Commission’s research found that it is best practice to vest initial ownership of results and inventions funded by public funds to the public research organisation where the research was conducted19. However, this was said to discourage private sector partners, given that the purpose of innovation is to realise a competitive advantage, which is frequently embodied in the IP.
It was stated by SPII stakeholders that SPII’s account managers and post-investment team is small and is often overburdened. Furthermore, this team has to manage the existing projects, disbursements and reporting requirements as well.
SPII stakeholders noted that two factors are considered when evaluating an application, being economic merit and the level of innovation. These criteria are not clearly defined and are open to interpretation. Each application is evaluated against these criteria on a case-by-case basis. Other questions are asked20, but are not taken into consideration when evaluating whether the project should receive funding or not.
The records of applications from October 2000 to November 2012, supplied by the IDC, show that the average time between submission of an application to the date of rejection or approval is approximately 166 days – nearly six months, while the internal target is six weeks.21
1.4.4.2. Reporting and disbursements
The gaps in reporting data received from the IDC for this evaluation illustrates SPII’s challenges with reporting compliance. Despite these reporting requirements being obligatory, no punitive measures or incentives are in place to ensure compliance to them.
The case studies illustrated that SPII’s reporting requirements are appropriate for larger companies; however, for smaller companies they can be arduous and resource consuming.
19 European Commission (2004) Management of intellectual property in publicly-funded research organisations: Towards European Guidelines 20 These questions relate to the additionality of the project and possible other impacts, such as job creation. However, these questions are not documented and are not used consistently across applications 21 SPII Business Plan, 2013

16
It has been noted that SPII’s follow-up reporting in the three years after project completion is limited to financials and employment figures. Therefore, the data is unable to establish progress for projects that were not yet commercialised in those three years, or provide reasoning for the lack of commercialisation.
1.4.4.3. Communication
The case studies revealed mixed responses on the communication processes of SPII; this was highly dependent on timing and the nature of the process.
Regarding the marketing of SPII, it was revealed that SPII does not market itself as it is already oversubscribed. 82.8% of survey respondents claimed to have come to know about SPII through word of mouth, referral from another programme or independent research.
When case study respondents and industry stakeholders were asked about how they feel about the marketing of SPII, it was noted that marketing SPII in an open and untargeted way could open the programme up to a large number of applicants, increasing the administrative burden on a small team with a limited budget which is already well subscribed. It was suggested by a case study respondent that SPII should only market itself through existing innovation networks, such as innovation hubs and technology transfer offices.
1.4.4.4. Management and structure of the programme
The SPII team reported concerns around the arduous legal and financial processes a project must go through before being approved as this is decreasing SPII’s appetite for risk. The importance of experienced, suitable account managers was also highlighted as essential to the successful running of the programme. The case studies reported mixed experiences with these account managers, which were heavily dependent on the suitability of the account managers’ background and skills to the innovation of the case study.
The management of the SPII programme was generally noted by industry stakeholders to be better than the other innovation programmes in South Africa, with the administration of the programme and the programme’s reliability noted as differentiating factors.
In terms of structure, SPII administrators suggested that SPII should have greater collaboration with Seda and TIA. As these programmes are more focused on the commercialisation process, projects should be introduced to other institutions that focus on the next phase of the innovation cycle to improve their chance of successful commercialisation. The head of Development Finance at the IDC explained that SPII has a tentative relationship with TIA at the lower levels of implementation; however, more direction is needed from departmental level to ensure true collaboration and synchronisation.
Administrators of SPII were also asked what constraints they face in achieving the programme’s objectives. This was consistently reported to be a lack of funding. This is evidenced by the fact that two moratoriums on funding commitments have recently been implemented.
1.4.5. Sustainability
The sustainability of SPII measured the extent to which the benefits accrued from SPII were likely to continue once SPII funding ended.
17
1.4.5.1. The sustainability of SPII’s budget
SPII administrators felt that because SPII (the PPD and Matching schemes specifically) has always been a grant-based scheme, it was unlikely that other more sustainable funding mechanisms would be considered. Many industry stakeholders confirmed the importance of SPII funding being grant-based as any form of funding that requires repayment can stifle innovation, particularly in the inherently risky stages of the innovation process that SPII targets. Given that SPII is grant-based, the programme itself is not financially sustainable, nor was it designed to be.
SPII administrators raised concern around PII’s viability, value for money and sustainability. The size of these projects and the corresponding grants are so immense in comparison to the other schemes that one large project could essentially use the vast majority of SPII’s budget. PII uses repayable grants, but the low number of PII-funded projects means that this does not contribute significantly to the sustainability of the SPII programme as a whole.
1.4.5.2. The success of the projects which SPII has funded
A SPII administrator noted that the PII programme has had extremely limited success, and that there is currently a process underway to determine why these projects have not been successful. The Matching scheme was considered to be the most successful of the schemes as these projects reportedly have the highest commercialisation rate. Although the administrator noted that the PPD scheme was not as successful as the Matching scheme, these projects were considered to need funding the most.
Respondents noted that projects would likely have a greater chance of success if business development support was provided in conjunction with the SPII funding or if projects were incubated during and post-SPII funding.
1.5. ANALYSIS
1.5.1. Impact
1.5.1.1. What is the impact of SPII on the innovation activity in South Africa?
SPII is considered to be one of the stronger innovation incentive programmes in South Africa and plays an important role in overcoming what is considered to be the greatest constraint to innovation in the country – access to finance. This is particularly true given the limited and risk-averse nature of the venture capital and angel financers in South Africa, as well as the areas in the innovation cycle that SPII targets, namely basic research to pre-commercialisation prototype.
The survey data that shows the majority of successful SPII applicants would not have been able to continue their project without SPII funding, or that it would have taken longer, further indicates the important role SPII has played in increasing innovation activity in South Africa.
However, the demand for SPII funding far exceeds the amount it is allocated to commit to projects each year, thus limiting the number of projects that can be approved. This suggests that the potential exists for the programme to have a far greater impact on innovation activity, although this will also depend on the effectiveness of SPII’s marketing, applicant selection processes, linkage support and funding.
18
1.5.1.2. What impact does SPII have on economic development through technology transfer
and technology development?
An innovation project can only contribute to economic development if it is commercialised. SPII provides funding during a fundamental stage in the innovation process, but because this funding ends at the pre-commercialisation prototype phase, economic development cannot be directly attributed to SPII. One of the major themes that emerged during this evaluation was the challenge innovating firms face in bridging the gap from prototype development to commercialisation. While SPII, under its current mandate, cannot address this challenge directly, by collaborating closer with other agencies that support commercialisation, through funding and other mechanisms of support, such as mentoring, business development service provision and/or incubation, this gap could be reduced and technology transfer and development could be enhanced – thus enhancing the economic impact of the incentive. SPII does provide hand-holding support to applicants during the basic assessment stage of the application process, but this remains limited to the proposal development process, rather than throughout the funding period. SPII is also looking at establishing closer links with the TIA technology stations, with a particular focus on incubation, but this remains aspirational at this stage and is limited to a limited set of state-funded agencies. The role for private incubators and other service providers of a range of support mechanisms could be further explored.
Nevertheless, the data collected by the IDC reports that ZAR 3 459 014 309 in sales22 has resulted from SPII funded innovations since 200023 and that SPII has disbursed ZAR 622 671 640 over the same period. The sales figure is also likely to be an underestimate, as many projects have not submitted sales data and even the ones that have, have done so for a maximum of approximately four years. Furthermore, an accepted SPII application has a higher probability of success than a project that was rejected, which can be the result of either SPII funding assisting projects to commercialise or SPII only selecting projects that are likely to succeed or a combination of these.
A challenge with defining SPII’s impact on economic development is that the data on SPII-funded projects post funding is limited. SPII requires that projects report on financials and employment figures for only three years after project completion and SPII has experienced difficulties in retrieving this standard reporting data from clients. This does not allow for the monitoring and evaluation of projects that have not commercialised. This means that there is a lack of the necessary measurement and evaluation systems for rigorous evaluation and identification of determinants of success.
1.5.1.3. Do industry partners (recipients) realise a significant return on investment (ROI)
from SPII in terms of profitability, skills development, and sustainability of the
enterprise? After how long is the ROI realised?
The survey data shows that 57% of projects have not yet been commercialised, and thus have not produced a ROI. Furthermore, according to the reporting data 20.42% of the matching fund and 14.11% of the PPD supported enterprises are experiencing a negative ROI because of the time it takes to begin generating profit, with some survey respondents reporting that it took them longer than three years to generate a return.
It appears that the Matching scheme has been more effective at realising a return than the PPD scheme. The ROI of the entire programme was calculated, using the data on all grants dispersed and all reported sales, to be 456%. Because innovation and SPII funding can result in the financial or strategic repositioning of a business, it often does realise a return on investment in terms of 22 The sales figure cannot be solely attributed to the SPII funding, but to the innovation projects themselves 23 This value cannot be solely attributed to SPII’s input, as projects may have had other driving inputs.
19
enhanced competitiveness and sustainability. However, these ROI figures are highly unreliable due to the nature of the data on sales figures only being collected for three years post-funding and with many projects not even complying with this reporting requirement. We believe that SPII cannot be accurately evaluated on this indicator for that reason.
In terms of skills development, 45% of PPD- and 53% of Matching scheme-funded survey respondents have trained 1-5 employees. The majority of this is on-the-job training, rather than formalized, accredited training. Thus, the training is highly specific to the company in question.
1.5.1.4. Does South Africa realize a significant return on investment from SPII against the
cost of delivering the programme?
In total we estimate that SPII funded projects have directly created or retained approximately 3000 permanent jobs. According to the same data ZAR 622 671 640 was received from SPII by the funded projects, which equates to approximately ZAR 207 560 per job. However, one of the major findings of this evaluation is that SPII does not contribute to the above four areas directly. Only after they are successfully commercialised do SPII investments actually contribute to enterprise and economic growth, permanent job creation, tax revenues and competitiveness. This is true by definition – there is no “economic value” until commercialisation happens.
SPII, according to its objectives, does not aim to generate employment or economic growth, but merely to stimulate innovation and enhance commercialisation. SPII should therefore do what it can to facilitate and enable the development of innovation projects that will ultimately result in commercialised products/processes.
The theory of change in Figure 14 demonstrates SPII’s direct and indirect impacts. The blue block on the left illustrates where SPII is directly involved and thus the extent to which SPII can be held accountable. This emphasises the limited direct contribution of SPII to broader economic development indicators. The blue block on the left further illustrates part of what the original theory of change for SPII would have looked like had it been documented. This shows that the programme was originally focused solely on driving innovation without the broader mandate of job creation and economic growth.
Following the logic that, as reported in the survey, SPII funded projects would not have taken place or would have taken place over a longer period or on a smaller scale had they not received SPII funding, and that these same projects reported creating or retaining jobs, it follows that the SPII funding indirectly impacted on job creation or retention. However, the indirect link to these broader economic development indicators highlights the importance of improving SPII-funded projects’ chances of commercialisation and success through linkages with other funding and support mechanisms, as well through market research and business plan development.
There is not an existing logframe for SPII. As such, a skeletal logframe has been provided in Annex 3 of this report. One of the key activities of the SPII team going forward will be to populate this further.
1.5.1.5. What happens to the Intellectual Property from completed SPII projects?
Given the limited available SPII data, these impact questions are difficult to answer for the programme as a whole. The findings above shows that 42% of survey respondents’ projects that were supported by SPII have commercialised, while 44% are still in pre-production and 14% did not commercialise. The Matching scheme appears to be more successful than the PPD scheme in

20
terms of commercialisation. Whether that IP from commercialised projects has remained in the country or not cannot be determined from the data available.
However, in terms of process, a number of case study respondents cited a number of challenges with SPII’s rules related to IP. While there are mechanisms within SPII for clients to motivate the selling of their IP, there are instances of firms resigning from the programme because of the IP rules. This is particularly the case for international investors who require security for their investment and who are inherently sceptical of the extent to which the government has control over the IP. However, there are also cases where SPII’s IP restrictions have benefitted the company in question. While responses to this issue are mixed, this raises broader questions around South Africa’s industrial growth and the effect IP regulation has on foreign investment in the country, which is outside the scope of this evaluation. However, research by the European Commission regarding the management of IP from publicly-funded research found that best practice is to vest initial ownership of results and inventions funded by public funds to the public research organisation where the research was conducted24. This has been recognised by several studies and by an increasing number of countries, which have passed specific regulations to that effect.
1.5.1.6. Is SPII still relevant when considering other instruments in the innovation
landscape?
The majority of respondents to this evaluation believe that SPII is still highly relevant when considering other instruments in the innovation landscape. SPII is one of the only programmes funding projects in the pre-commercialisation prototype stage of innovation, and while TIA overlaps with SPII in this stage, industry stakeholders and one case study that had experience with both interventions reported that SPII is run more efficiently. However, it should be noted that TIA has been going through a period of redefining its role and the differences in the programmes’ mandates and structures make it difficult to compare the two programmes. Nonetheless, the synergies between SPII and TIA have been recognised and the two programmes have a memorandum of understanding and are attempting to collaborate much more closely, in terms of both the role of TIA’s technology stations and where, between the two funds, duplication can be minimised and synergies enhanced. There are a number of different types of entities in South Africa that address R&D and innovation - the purpose of having multiple entities playing in a similar space is the ability to seek synergies and harmonization to benefit from the complementarities – currently, it is not necessarily a bad thing if there are duplications that exist in the market given that there is an unmet demand.
A significant finding of this evaluation was the high level of compartmentalisation of innovation industry stakeholders and agencies in South Africa. Improving linkages and transitions between programmes could have a significant impact on innovation activity and success in the country as synergies and complementarities can be exploited in this way – in effort to benefit the innovators.
An important development in the South African innovation landscape has been the creation of the the dti’s Technology Venture Capital fund, which was originally conceived as a sister programme to SPII. The majority of TVC-funded projects have been SPII recipients as well. However, a number of stakeholders believe the trajectory for a project from SPII to TVC could be more streamlined while still retaining the independence of each programme.
24 European Commission (2004) Management of intellectual property in publicly-funded research organisations: Towards European Guidelines

Figure 14: SPII theory of change

22
1.5.1.7. What factors in the South African context enable or constrain the beneficial impact
of SPII, including the long term sustainability of those impacts?
The factors that influence the impact of SPII include:
Support gaps in the innovation landscape, particularly the gap to commercialisation The lack of business skills, particularly in small companies The lack of vocational training or education amongst the majority of the population An undeveloped risk capital market and a lack of funding for innovation in South Africa SPII lacks clearly defined objectives and targets and these are not aligned with Outcome 4
of the President’s Delivery Agreement, which indicates a certain degree of policy confusion in relation to innovation, investment, growth and employment targets.
SPII’s mandate and limited budget limits its ability to directly impact on macro- economic development indicators.
The information feedback loops within SPII have improved in recent years, and draw on client feedback and management interactions, but these are not formalised. This is combined with limited reporting data from SPII recipients for three or less years following project completion.
1.5.2. Cost effectiveness
1.5.2.1. Is the current model of delivering SPII cost effective in comparison to alternative
models?
SPII is managing approximately R340 million for over 200 projects, and the IDC’s management fees make up 3.8% of the total amount committed. SPII also receives a large number of applications, all of which are reviewed, including ineligible and rejected concepts. Upwards of 133 applications are reviewed each year, of which an average of 66 (49%) are funded. Given this, and based on national and international benchmarks, SPII is relatively cost effective in comparison to other programmes in the innovation space. However, alternative funding mechanisms, such as loans or matching grants, or processes such as competitive funding rounds, have not been explored by SPII or assessed in relation to their cost effectiveness.
1.5.3. Processes
1.5.3.1. What effect do institutional mechanisms have on the efficiency and effectiveness of
delivering programme outcomes?
The majority of case studies noted that SPII’s administrative processes are efficient relative to other programmes. In 2010 the programme underwent a number of changes, from its leadership to its processes in a move to align it more with the IDC’s strategy and processes. Anecdotal responses from case study respondents indicate that the impacts of these changes have been mixed. For example, many respondents feel that the programme became more compliance driven, which can be onerous, particularly in terms of meeting reporting requirements and application processes.
Respondents noted that the change from ex post to ex ante disbursement of funds has been positive, and that the SPII team has developed good skills internally. However, the internal account managers are sometimes inappropriately assigned to certain projects, and do not have the skill set or expertise required for projects in particular industries or sectors.
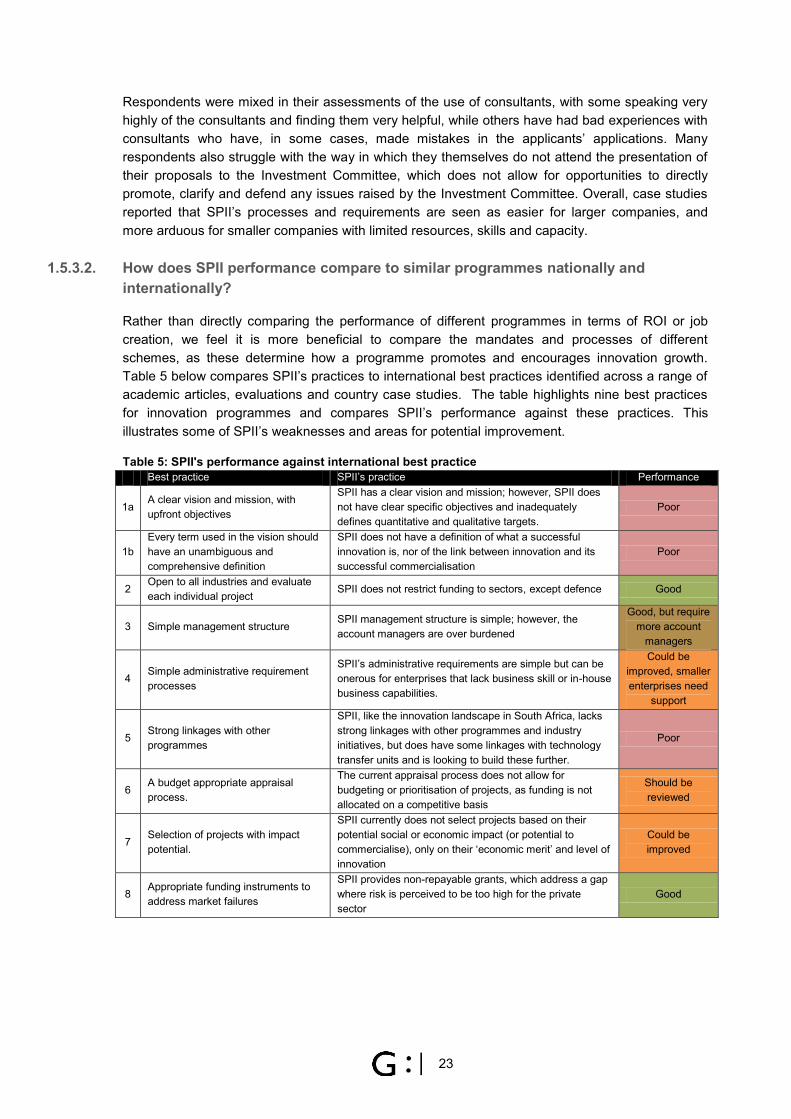
23
Respondents were mixed in their assessments of the use of consultants, with some speaking very highly of the consultants and finding them very helpful, while others have had bad experiences with consultants who have, in some cases, made mistakes in the applicants’ applications. Many respondents also struggle with the way in which they themselves do not attend the presentation of their proposals to the Investment Committee, which does not allow for opportunities to directly promote, clarify and defend any issues raised by the Investment Committee. Overall, case studies reported that SPII’s processes and requirements are seen as easier for larger companies, and more arduous for smaller companies with limited resources, skills and capacity.
1.5.3.2. How does SPII performance compare to similar programmes nationally and
internationally?
Rather than directly comparing the performance of different programmes in terms of ROI or job creation, we feel it is more beneficial to compare the mandates and processes of different schemes, as these determine how a programme promotes and encourages innovation growth. Table 5 below compares SPII’s practices to international best practices identified across a range of academic articles, evaluations and country case studies. The table highlights nine best practices for innovation programmes and compares SPII’s performance against these practices. This illustrates some of SPII’s weaknesses and areas for potential improvement.
Table 5: SPII's performance against international best practice Best practice SPII’s practice Performance
1a A clear vision and mission, with upfront objectives
SPII has a clear vision and mission; however, SPII does not have clear specific objectives and inadequately defines quantitative and qualitative targets.
Poor
1b Every term used in the vision should have an unambiguous and comprehensive definition
SPII does not have a definition of what a successful innovation is, nor of the link between innovation and its successful commercialisation
Poor
2 Open to all industries and evaluate each individual project
SPII does not restrict funding to sectors, except defence Good
3 Simple management structure SPII management structure is simple; however, the account managers are over burdened
Good, but require more account
managers
4 Simple administrative requirement processes
SPII’s administrative requirements are simple but can be onerous for enterprises that lack business skill or in-house business capabilities.
Could be improved, smaller enterprises need
support
5 Strong linkages with other programmes
SPII, like the innovation landscape in South Africa, lacks strong linkages with other programmes and industry initiatives, but does have some linkages with technology transfer units and is looking to build these further.
Poor
6 A budget appropriate appraisal process.
The current appraisal process does not allow for budgeting or prioritisation of projects, as funding is not allocated on a competitive basis
Should be reviewed
7 Selection of projects with impact potential.
SPII currently does not select projects based on their potential social or economic impact (or potential to commercialise), only on their ‘economic merit’ and level of innovation
Could be improved
8 Appropriate funding instruments to address market failures
SPII provides non-repayable grants, which address a gap where risk is perceived to be too high for the private sector
Good
24
9 Comprehensive monitoring and evaluation
SPII requires that projects report on financials and employment figures for three years after project completion. This does not allow for the monitoring and evaluation of projects that have not commercialised. Furthermore, SPII has difficulties in retrieving the standard reporting data from clients. In addition, SPII lacks the necessary measurement and evaluation systems for rigorous evaluation.
Poor
1.6. RECOMMENDATIONS
We believe that SPII should continue given the important and extremely relevant role it plays in the innovation landscape in South Africa, its direct impact on innovation and its potential indirect impact on long-term job creation and increased competitiveness. The following set of recommendations have been provided, each of which will have cost implications should they be adopted:
Policy and programme design recommendations
1. SPII should clearly define its objectives, with corresponding targets, and its achievement of these should be measured annually. These should include the number of firms supported, lead times to approval and disbursement and number of projects that reach the market. There should be clear recognition that SPII cannot be directly responsible for the short-term fulfillment of job creation, economic growth, or competitiveness targets. SPII does play an indirect role in contributing to the achievement of these outcomes - the logic explained in the detailed ‘theory of change’ provided on page 21.
2. SPII’s mandate to support and enhance innovation in business/industry should not be overwhelmed by a mandate to address direct job creation. SPII is not an enterprise development fund. Innovation can generate jobs by creating new markets or it can lead to temporary restructuring towards methods that replace labour inputs. However, the shifts in products, productivity, scale and skills requirements that typically result from successful innovation will only typically lead to job creation in the long term – and to the ultimate goal of innovation-led economic growth and improved competitiveness. This logic needs to be made explicit in SPII’s theory of change, so that the focus and implementation of the programme is not confused and compromised by potentially conflicting goals.
3. SPII needs to continue to stimulate innovation in products/services and in geographical areas where opportunities are the greatest.
Implementation recommendations:
Application and funding process
4. The application appraisal process should more rigorously assess an applicant’s prospects of successful commercialisation as a key criterion. A key component of this is market research, rather than firm level characteristics. SPII does allow for a small amount of market research to be done during the application phase, and where there is capacity, this should be enhanced. Existing institutions, such as SEDA and other incubators should also be leveraged.
5. SPII should adopt less of a one-size-fits-all approach to its application and funding processes, which should differ according to scheme (and hence size of the firm being funded).
25
Consideration should be given to the creation of specialist teams of programme managers within each scheme with specific skills sets for the types of firms they assess and fund.
Linkages with business development support organisations, particularly for smaller less-capacitated firms should be encouraged in order to improve their ability to meet application and reporting requirements.
6. In order to strategically build SPII’s project portfolio, serious consideration should be given to the following:
Applications for funding should be collectively considered at a limited number of defined points in a year. This will allow the Investment Committee to consider batches of applications on a comparative and competitive basis.
Defined funding amounts (whether indicative or set as ceilings) should be allocated to each of the three schemes per funding round. This requires strategic decision-making as to how the portfolio of SPII should be constituted across programmes (in terms of project scale, levels of risk, ROI etc).
There should be a more targeted and proactive marketing approach to inform potential applicants about SPII
7. The programme should reconsider a number of processes in order to improve its efficiency. These include assigning consultants or account managers with limited knowledge of a specific sector to projects in those sectors, as well as the current practice of preventing applicants from presenting their applications to the investment committee directly, or at least attending the presentation in person.
Linkages support
8. Greater linkages with other innovation actors and programmes should be encouraged to maximise the impact of SPII. This ensures that smaller businesses exiting the programme are afforded access to alternative sources of funding, mentorship and incubation resources that are needed to reduce the barriers to commercialisation. SPII should also look to establish linkages with private partners such as commercial banks and venture capital operations that exist beyond government’s mandated agencies (Seda, TIA, TVC etc.). Ideally, SPII should aim to serve as an effective pre-incubator of early stage innovation for review and adoption as much by commercial banks and investors as by other DFIs and state agencies.
9. SPII should consider explicitly addressing the lack of business skills amongst some of its funded projects, particularly SMEs, through improved linkages. This could include assisting with linking beneficiaries to training programmes, incubators and other competent service providers who could offer technical assistance towards the end of the funding period to review the project’s successes and challenges, to hone the necessary marketing requirements, and, overall, to map a concrete path to the commercialisation of the project.
Formalise internal learnings
10. SPII should formalise internal processes that generate lessons from applications, from successful and unsuccessful projects, and from applicants’ feedback following each funding round. This could be done through more regular Exco reports or defined time slots in each management committee meeting dedicated to discussing and documenting lessons and feedback, the minutes of which can be distributed to the whole team. This will allow on-going design and process adjustments to continue to be made which reflect the needs of the market and incorporate the cumulative learning and experience in the programme’s implementation.

26
This should include details on key success criteria for commercialisation which then serves to inform the application and selection process.
Management information system
11. A web-based platform for applications, internal appraisals and project reporting data (during and post funding) should be established. This would allow for a more systematic appraisal of applications. It would also allow for the efficiency of the SPII processes to be monitored, enabling bottlenecks and other sources of inefficiency to be quickly identified and addressed and will enable improved monitoring of the programme’s performance and impact.
Monitoring and evaluation
12. Recipients of SPII funding should have greater accountability to SPII to report progress on the funded project once the funding period has ended, which can be improved by:
Clearly stating reporting requirements in contracts Post-funding reporting requirements should not differ heavily from the reporting requirements
during funding (nothing too new or complicated should be added) Reporting should happen through an easy to understand and accessible web-based platform Automated email reminders should be sent periodically to grantees reminding them of their
contractual agreement to report, with a link to the online reporting portal attached.
13. A set of indicators for SPII itself should be determined, linked to the objectives and targets (particularly the commercialisation of approved projects) highlighted in its theory of change, and benchmarked against the scheme’s performance.
Implementing agency
14. SPII should remain a specialised innovation fund and be located within a specialised fund management institution that has access to the correct networks to serve its role as a player in the landscape and maintain a focused, flexible and opportunity driven approach.

27
ANNEXES
ANNEX 1: DETAIL OF THE METHODOLOGY
A combination of quantitative and qualitative methodologies was used in conducting the evaluation. Table 1 presents the tools used to collect data.
Table 1: Data collection tools Instrument Response Response rate Key informant interviews 33 interviewees 76.7% Survey of SPII applicants (approved and rejected)
230 respondents 34.5%
Case studies of SPII funded projects
20 detailed case studies (8 in Gauteng, 8 in Western Cape and 4 in KwaZulu Natal)
Completed project reporting data review
218 54.4% (of the 401 completed projects only 218 had sales data)
1.1. DESKTOP REVIEW
As a precursor to the development of our research tools and analysis plan, a review of relevant innovation incentives and policy literature was conducted. This included a review of:
The theory of innovation and national systems of innovation;
International practices in innovation policy frameworks and instruments;
A review of the South African innovation policy and industry landscape review;
An overview of SPII; and,
A global scan of innovation support programmes
Pertinent segments of this review have been included in the preceding sections and referenced throughout the report, where relevant.
1.2. ANALYSIS FRAMEWORK
The design of the systematic analysis framework was informed by the desktop review. The tool was categorised by the DAC criteria, which have been further refined according to the following themes, each of which had specific indicators, see Table 2 below.
Table 2: Analysis framework themes by DAC criteria DAC criteria Theme Relevance The applicability of SPII's objectives in the South African context
The relevance of SPII in the innovation process The relevance of SPII in relation to other programmes and funding
mechanisms The relevance of the expenses which SPII covers The extent to which SPII reduces the barriers to innovation in South Africa
Effectiveness Achievement of programme objectives Constraints to innovating in South Africa Achievement of innovation projects that have been funded by SPII
Efficiency Application and contracting process

28
DAC criteria Theme Reporting and disbursements Communication Management and structure of the programme
Impact Innovation and competitiveness Job creation and skills development
Sustainability SPII’s budget The success of projects SPII has funded
Additionality Effect of SPII on project continuation Catalysing private investment
As mentioned above, SPII was evaluated according to each of these criteria and their related themes in terms of whether they enhance or dilute SPII’s impact.
A multi-method approach was undertaken to collect data for each of the indicators. This included:
Document and literature review;
Online Surveys;
Data analysis;
Key Informant Interviews; and,
Case Study Interviews.
The methodology and analysis framework were approved by the steering committee through their acceptance of the Inception Report (October 2013) and Analysis Framework (November 2013).
1.3. QUANTITATIVE DATA ANALYSIS
Two sources of data were used for the quantitative research portion of the impact evaluation; namely completed project-reporting data from SPII and data generated by the survey questionnaire.
1.3.1. Project reporting data
SPII requires that every completed project submit data on sales, R&D expenditure and tax revenue for three years after completion. This data was received from IDC in 10 Excel sheets for the period from 2004 to 2013. Each sheet contains two years of data for a project, which overlaps across sheets, thus effectively providing us with data from 2003 to 2013. Genesis has matched projects using their unique identifier codes and produced a consolidated datasheet containing 401 completed projects. However, data for these projects is incomplete and sales data was limited; the following table presents the availability of sales data:
Table 6: Data availability Years of sales data Number of projects Percentage of completed At least one year 218 54% One year 95 24% Two years 60 15% Three years 46 11% Four years 17 4%

29
1.3.2. Administered survey questionnaire
Genesis Analytics developed an online survey questionnaire to ascertain additional data on all applicants of SPII. A contact list of all applicants was supplied by the IDC. The survey was only sent out to applicants who had a valid email address recorded; this amounted to 842 applicants. The email containing the link to the survey, as well as an accompanying letter from SPII/DPME/the dti, was sent out on the 28th of October. A follow up email reminding applicants to complete the survey was sent out to all 842 contacts on the 31st of October. Genesis Analytics then phoned all those on the contact list who had not yet completed the survey, reminding them to complete it.
Response rate:
Of the 842 emails sent out, 176 (21%) were returned as undeliverable due to the email address not existing. Thus, the effective sample is 666.
A response rate of 34.53% (230 responses) was achieved.
The following figures illustrate the characteristics of the responses against the original sample (those applicants with an email address recorded):
Figure 15: Sample and response by scheme
Figure 16: Sample and response by location
2% 44% 53% 6% 49% 44% 0%
10%
20%
30%
40%
50%
60%
PII PPD Matching scheme
Perc
enta
ge o
f app
lican
ts Sample Response
3% 2% 57% 8% 0% 1% 6% 0% 22% 4% 2% 50% 10% 2% 2% 3% 1% 25% 0%
10%
20%
30%
40%
50%
60%
70%
EasternCape
Free State Gauteng KZN Limpopo Mpumalanga North West NorthernCape
WesternCape
Perc
enta
ge o
f app
lican
ts Sample Response
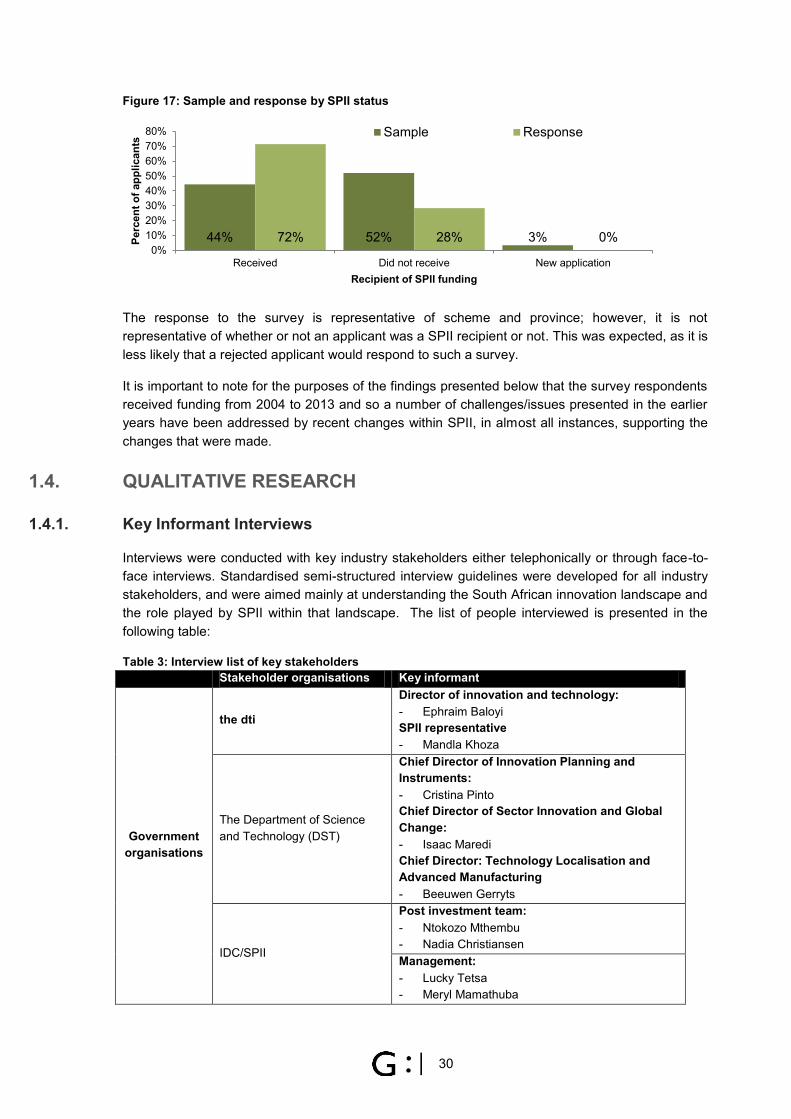
30
Figure 17: Sample and response by SPII status
The response to the survey is representative of scheme and province; however, it is not representative of whether or not an applicant was a SPII recipient or not. This was expected, as it is less likely that a rejected applicant would respond to such a survey.
It is important to note for the purposes of the findings presented below that the survey respondents received funding from 2004 to 2013 and so a number of challenges/issues presented in the earlier years have been addressed by recent changes within SPII, in almost all instances, supporting the changes that were made.
1.4. QUALITATIVE RESEARCH
1.4.1. Key Informant Interviews
Interviews were conducted with key industry stakeholders either telephonically or through face-to-face interviews. Standardised semi-structured interview guidelines were developed for all industry stakeholders, and were aimed mainly at understanding the South African innovation landscape and the role played by SPII within that landscape. The list of people interviewed is presented in the following table:
Table 3: Interview list of key stakeholders
Stakeholder organisations Key informant
Government organisations
the dti
Director of innovation and technology: - Ephraim Baloyi SPII representative - Mandla Khoza
The Department of Science and Technology (DST)
Chief Director of Innovation Planning and Instruments: - Cristina Pinto Chief Director of Sector Innovation and Global Change: - Isaac Maredi Chief Director: Technology Localisation and Advanced Manufacturing - Beeuwen Gerryts
IDC/SPII
Post investment team: - Ntokozo Mthembu - Nadia Christiansen Management: - Lucky Tetsa - Meryl Mamathuba
44% 52% 3% 72% 28% 0% 0%
10%20%30%40%50%60%70%80%
Received Did not receive New application
Perc
ent o
f app
lican
ts
Recipient of SPII funding
Sample Response

31
Stakeholder organisations Key informant
Administration team: - Nikki Gwaze - Dorcus Tsotetsi Account managers: - Sooko Mafohla - Steven Makhongela - Zandile Fuyane Investment committee - Christo Fourie - Mahomed Moolla
National Intellectual Property Management Office (NIPMO)
- Dr. Jonathan Youngleson
South African Bureau of Standards Design Institute
- Gavin Mageni
Industry Industry stakeholders Tech top 100 companies - Paul Lowther (Lowther Communications) - John O’Callaghan (FRAXION)
Programmes
Technology Venture Capital (TVC) fund
- Craig Sauls - Nelis Geyer
Technology Innovation Agency (TIA)
- Pontsho Maruping
Small Enterprise Development Agency (Seda)
- Siphiwo Soga
Science councils
Medical Research Council (MRC)
- Dr. Tony Bunn
Mintek - General Manager: Technology
Consultants Independent Consultants - Rockridge Consultants - Danie Erasmus
Groups South African Innovation Network
- Zanele Monnakgotla
University technology
transfer
University of Stellenbosch - Anita Nel
North West University - Dr. Rudi van der Walt
In addition to the approved stakeholder list, two other interviews have taken place:
A TIA recipient
A successful SPII applicant completing milestone two
1.4.2. Case Studies
The original case study sampling methodology was a mixture of intensity sampling, criterion sampling and typical case sampling. By combining these methods, a sample of firms who have received SPII assistance were selected and grouped based on their geographic, scheme type and whether the project was good, typical or bad, as well as industry classification. This method of sampling was approved in the analysis plan. The projects were selected out of the list of completed projects for the Western Cape, Gauteng and KwaZulu-Natal. Table 4 below illustrates this split.

32
Table 4: Original case study split Scheme PPD Matching PII
Sector
GO
OD
TYPI
CAL
BAD
GO
OD
TYPI
CAL
BAD
GO
OD
TYPI
CAL
BAD
Cas
e
Gauteng
Chemicals & Pharmaceuticals 1 1 1 1 4 Electrical Machinery 1 1 2 Electronics 1 1 1 3 Mechanical Machinery 1 1 1 3 Miscellaneous Manufacturing 1 1 2 Total 3 2 3 1 1 2 1 0 1 14
Western Cape
Chemicals & Pharmaceuticals 1 1 2 Electrical Machinery 1 1 Electronics 1 1 1 3 Mechanical Machinery 0 Miscellaneous Manufacturing 1 1 2 Total 2 0 2 1 2 0 1 0 0 8
KwaZulu-Natal
Chemicals & Pharmaceuticals 1 1 2 Electrical Machinery 0 Electronics 1 1 1 3 Mechanical Machinery 0 Miscellaneous Manufacturing 0 Total 1 1 1 1 0 1 0 0 0 5
However, when contacted many respondents originally selected were unable, unwilling or ineligible to be part of the study. The following reasons were noted as being the reasons why the original sampling frame was ineffective:
The industry in which the projects were located was incorrectly recorded;
PII recipients were unwilling to be part of the study due to another internal evaluation happening concurrently25; and,
The people in charge of the older SPII funded projects had left the recipient enterprises, and the enterprise was unable to give information on the project as the institutional knowledge of SPII no longer existed.
This resulted in the following response rate:
Five (out of a targeted eight) case studies conducted in the Western Cape;
Three (out of a targeted five) case studies conducted in KwaZulu-Natal; and,
Four (out of a targeted 14) case studies conducted in Gauteng.
In addition, one case study was conducted on a project that fell outside of the original sampling frame, as they had an intense experience with SPII and provided interesting learnings.
Due to this low response a decision was taken to deviate from the original methodology by opening up case study selection to firms that were outside of the original sampling frame. The new frame included any completed project from the three provinces. This deviation was included in the field report to which no objections were raised. The following split was achieved:
25 The Genesis evaluation team was not informed of this concurrent evaluation being undertaken on PII. It would have been useful to collaborate, or at least to be aware the evaluation of when communicating with the external stakeholders.
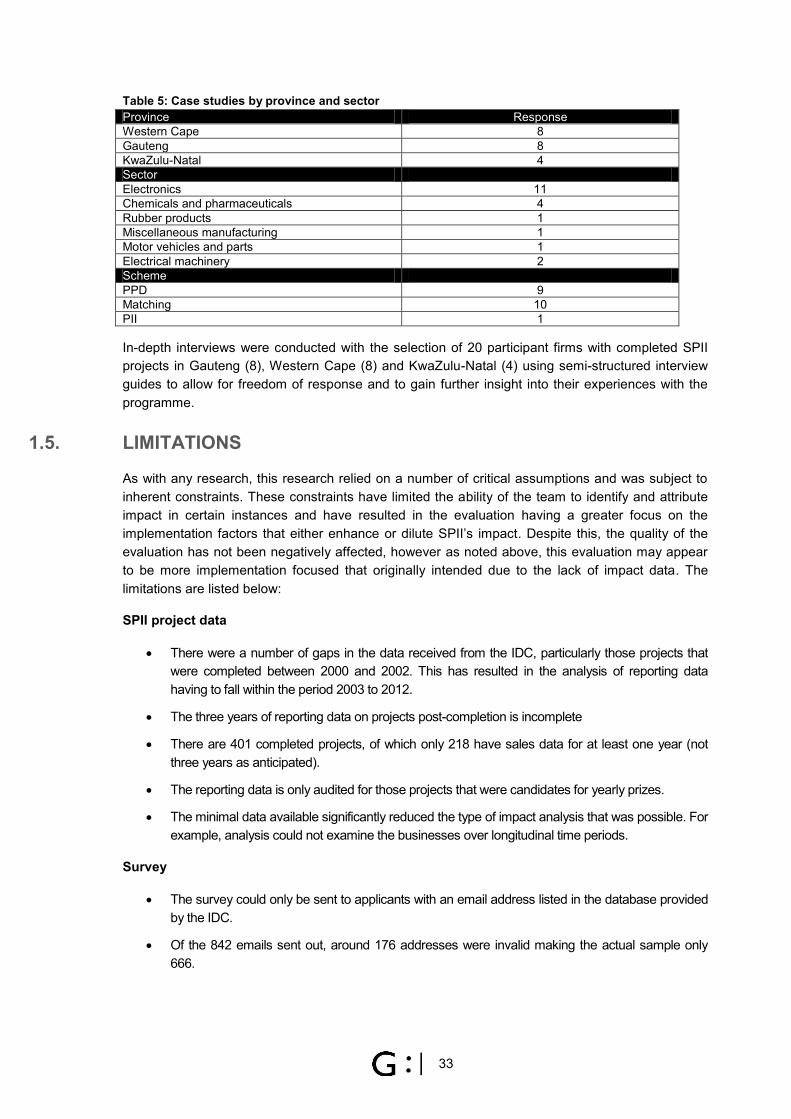
33
Table 5: Case studies by province and sector Province Response Western Cape 8 Gauteng 8 KwaZulu-Natal 4 Sector Electronics 11 Chemicals and pharmaceuticals 4 Rubber products 1 Miscellaneous manufacturing 1 Motor vehicles and parts 1 Electrical machinery 2 Scheme PPD 9 Matching 10 PII 1
In-depth interviews were conducted with the selection of 20 participant firms with completed SPII projects in Gauteng (8), Western Cape (8) and KwaZulu-Natal (4) using semi-structured interview guides to allow for freedom of response and to gain further insight into their experiences with the programme.
1.5. LIMITATIONS
As with any research, this research relied on a number of critical assumptions and was subject to inherent constraints. These constraints have limited the ability of the team to identify and attribute impact in certain instances and have resulted in the evaluation having a greater focus on the implementation factors that either enhance or dilute SPII’s impact. Despite this, the quality of the evaluation has not been negatively affected, however as noted above, this evaluation may appear to be more implementation focused that originally intended due to the lack of impact data. The limitations are listed below:
SPII project data
There were a number of gaps in the data received from the IDC, particularly those projects that were completed between 2000 and 2002. This has resulted in the analysis of reporting data having to fall within the period 2003 to 2012.
The three years of reporting data on projects post-completion is incomplete
There are 401 completed projects, of which only 218 have sales data for at least one year (not three years as anticipated).
The reporting data is only audited for those projects that were candidates for yearly prizes.
The minimal data available significantly reduced the type of impact analysis that was possible. For example, analysis could not examine the businesses over longitudinal time periods.
Survey
The survey could only be sent to applicants with an email address listed in the database provided by the IDC.
Of the 842 emails sent out, around 176 addresses were invalid making the actual sample only 666.

34
Our follow up resulted in some respondents responding negatively to the email and declined to take part in any evaluation of a government-supported programme. This was both for the case studies and survey questionnaire.
Random response from the sample population is unlikely as those who were not grant recipients would not have any incentive to participate in the evaluation, thus survey responses are likely to be biased towards those who were not rejected.
Corroborating data was not forthcoming (this was confirmed by the SPII staff as even they find it difficult to get evidence even when projects are under contract terms).
Key informant interviews
The identified patent lawyers were occupied with other business and despite assuring a response to our questions on multiple occasions, they never found time to respond.
The key informant from the Council for Scientific and Industrial Research (CSIR) did not feel they were the relevant person to speak to. Genesis was given multiple referrals to other stakeholders within the organisation; however, none of these resulted in a consultation.
Case studies
The initial sampling frame for case studies did not return a sufficient number of willing participants, thus the sampling methodology was adapted to include any projects from the three provinces of interest.
Enterprises with older SPII funded projects have lost the person responsible for the SPII funded project and were unaware of the details of the SPII funding experience.
The database of projects provided by the IDC has errors in terms of what sector the project falls in, with many of the case studies being listed in the incorrect sector.
The total number of enterprises under the PII scheme is extremely limited, with only seven PII projects ever reaching completion, thus the pool to select out of is very small. Moreover, the IDC is currently conducting an internal review of that programme resulting in the PII recipients being unwilling to take part in another evaluation. Thus, only one PII recipient was interviewed, representing 14% of the population.
The case studies have only amounted to 20 instead of the target of 27 cases, and the sector split is not what was initially proposed.
In terms of corroborating evidence some of the participants were resistant to handing over their organisation’s financial statements as they felt this was sensitive information.
The majority of companies interviewed received funding before 2012. As such many of the responses do not reflect the changes made to SPII post-2012.

35
ANNEX 2: REFERENCES
AUBERT, J. 2010. Innovation Policy for the Developing World
BATTELLE. 2014. Global R&D Funding Forecast
BURTON, D and HANSEN, K. 1993. German Technology Policy: Incentive for Industrial Innovation
DST. 2013. The Review of the Technology Innovation Agency
EUROPEAN COMMISSION. 2004. Management of Intellectual Property in Publicly-Funded Research Organisations: Towards European Guidelines
HSRC. 2008. The South African Innovation Survey
IDC. 2009. The study on commercialisation of locally developed technologies
JOFFE, A., KAPLAN, D., KAPLINSKY, R., LEWIS, D. 1995. Improving Manufacturing Performance in South Africa.
LEDERMAN, D. 2009. The Business of Product Innovation International Empirical Evidence
MOSES, C,. ET AL. 2012. The state of innovation in South Africa: Findings from the South African National Innovation Survey
OECD. 2013. Innovation and Inclusive Development
OECD. 2013. Reviews of Innovation Policy: South Africa
POURIS, A. 2006. Review and Impact assessment of THRIP and SPII for the Department of Trade and Industry:
SHARMA, S. 2007. Financial Development and Innovation in Small Firms
SOUTHERN AFRICA INNOVATION SUPPORT PROGRAMME. 2013. Assessing Innovation Priorities in Partner Countries
STENBERG, L. 2004. Government Research and Innovation Policies in Japan
THE DTI. 2012. A Guide to the dti Incentive Schemes 2012/13
THE DTI. 2012. Ministerial Review on the Science, Technology and Innovation Landscape in South Africa
THE SCIENCE AND TECHNOLOGY COMMITTEE APPOINTED BY THE UK HOUSE OF COMMONS. 2013. Bridging the valley of death: improving the commercialisation of research.
TRAJTENBERG, M. 2005. Innovation Policy for Development: an Overview
UNCTAD. 2008. The role of capacity-building for supporting pro-poor science, technology and innovation policies
UNCTAD. 2010. Key components of entrepreneurship and innovation policy frameworks
UNCTAD. 2011. Pro-poor technology, innovation and entrepreneurship policies

36
UNCTAD. 2012. Technology and Innovation Report 2012
WORLD BANK. 2007. An Assessment of the Investment Climate in South Africa,
WORLD BANK. 2010. Innovation Policy: A Guide for Developing Countries.
ZHANG, H. 2012. National Innovation System: South Africa & China Compared

ANNEX 3: PROPOSED LOGFRAME
Narrative summary Performance indicators Means of
Verification Assumptions
Indicator Baseline 2010/11
Target 2011/12
Target 2012/13
Target 2013/14
Impact
I1:Taxable revenue increases Value of South Africa’s tax revenue
Excluding SPII’s contribution to tax revenues, South Africa’s tax revenue remains constant
I2:Economic growth South Africa’s Gross Domestic Product
Excluding SPII’s contribution to GDP, South Africa’s GDP remains constant
I3:Improved employment South Africa’s employment rate
Excluding SPII’s contribution to employment, South Africa’s employment rate remains constant
I4:South African industries become more competitive
South Africa’s score on the Global Innovation Index
Excluding SPII’s contribution to competitiveness, South Africa’s competitiveness remains constant
Outcome
OC1:Enterprise generates revenues from sales Value of enterprise’s revenue The innovation is commercialised
OC2:Enterprise becomes more competitive Value of enterprise’s exports The innovation is commercialised
OC3:Enterprise becomes more sustainable
Status of the enterprise’s cash flow (positive/negative)
The innovation is commercialised
OC4:Creation/retention of permanent jobs
Number of permanent jobs created/sustained by the enterprise
The innovation is commercialised
OC5:Employees/contractors receive experience and on the job training
Number of employees/contractors that receive training
The innovation is commercialised
Outputs
O1: Innovator develops project to pre-production prototype stage
Number of pre-production prototypes developed
Innovator has secured funding for expenses which are not covered by SPII.

Narrative summary Performance indicators Means of
Verification Assumptions
Indicator Baseline 2010/11
Target 2011/12
Target 2012/13
Target 2013/14
O2:Innovator builds business plan
Number of business plans developed
Market research has been conducted and indicates that a market exists for the innovation.
O3: Innovation receives funding from private investors
Value of private investment received by companies
Market research has been conducted and indicates that a market exists for the innovation and that a feasible business plan has been developed.
O4:Innovator employs subcontractors and opens temporary and permanent positions
Number of temporary and permanent jobs created
Market research has been conducted and indicates that a market exists for the innovation and the project requires additional staff members
O6: Innovation product is commercialised
Number of products commercialised
Market research has been conducted and indicates that a market exists for the innovation and the innovator has subsequently entered into mass-production.
SPII’s activities to achieve the outputs
Activities unlinked to outputs in the logframe
A1: SPII develops application criteria A2: SPII evaluates applications A3: SPII draws up contracts with the applicants
O1: Innovator develops project to pre-production prototype stage
SPII disburses funds for qualifying prototype development costs
O2: Innovator builds business plan
SPII provides R 50 000 for market research


