Embed Size (px)
Citation preview

IMPACT OF EUROPEAN UNION SUGAR SUBSIDIES ON THE
MANUFACTURING & AGRICULTURE SECTOR OF PAKISTAN

Many WWF projects in Pakistan focus on freshwater and toxics and require funding.For up-to-date information on funding requirements and for details onWWF’s Freshwater and Toxics Programme (FTP), please contact:
Hammad Naqi Khan: Director Freshwater and Toxics Programme, WWF - Pakistan
Coordinated & Reviewed: Dr. Nasir Mahmood Nasir, Freshwater and Toxics Programme, WWF - Pakistan
Conducted: Centre for Policy & Development Alternatives, Lahore - Pakistan
Cover Page Design: Communications Division WWF - Pakistan
Published April, 2005 by WWF - Pakistan, Ferozepure Road, Lahore - 54600, Pakistan
Opinions expressed in this publication do not necessarily reflect the views of WWF and its members.All written material in this report may be reprinted, provided the source is credited to WWF - Pakistan

IMPACT OF EUROPEAN UNION SUGARSUBSIDIES ON THE MANUFACTURING
AND AGRICULTURE SECTOR OF PAKISTAN
WWF - PAKISTAN

TABLE OF CONTENTS
Contents Page No.List of tables 3List of graphs 5List of annexes 7Acronyms 9Executive summary 11
Chapter No. 1: Introduction and Methodology 1. Introduction 151.2 Methodology 16
Chapter No. 2: Development of Sugar Sector 2.1 The Sugar Industry 182.2 Installed Capacity 192.3 Raw Material 222.4 Marketing of Sugarcane 252.5 By-Products of Sugar 26
Chapter No. 3: Domestic and World Balance Sheet of Sugar3.1 Domestic Demand and Supply Position 283.2 Recovery Level 283.3 Consumption of Sugar 303.4 Domestic Price Situation 323.5 Cost of Sugar Production 333.6 Excise and Other Taxes 353.7 Import Duties and Restrictions 353.8 World Supply, Demand, Stocks and Trade Positions 363.9 International Prices 37
Chapter No. 4: The International Sugar Policies4.1 EU's Sugar Policies 38 4.1.1 Export Subsidies 394.1.2 Market Access 404.1.3 Domestic Support 404.1.4 Special Safeguard Measures 404.1.5 Tariff Rate Quotas 414.1.6 Case Against EU Sugar Dumping 414.1.7 The DSB Decision 424.1.8 Possible EU Policy Reforms 434.1.9 Proposed Reforms of EU Sugar Sector (3 Scenarios) 434.2 USA Sugar Policies 444.3 Japanese Sugar Policies 454.4 Developing Countries' Sugar Policies 46
1

Chapter No. 5: EU Sugar Policies' Impact on Pakistan's Sugar Sector5.1 Impact of EU Reforms on Pakistan's Sugar Imports 475.2 Impact of EU Imported Sugar 565.3 Impact of EU on Export of Sugar 575.4 Impact of the DSB Decision on Pakistan's Sugar Export 57
Chapter No. 6: Sugar Sector's Impact on Environment6.1 Impact of Water Scarcity on Sugarcane and Environment 596.2 Soil Erosion, Agricultural Chemicals, Silt Run-off from Sugarcane Farms 606.3 Silt Run-off 616.4 Use of Pesticides 616.5 Use of Chemical Fertilisers 616.6 Suffocation 616.7 Burning of Sugarcane Fields 626.8 Mechanization in Sugarcane Cultivation 626.9 Impact of Sugarcane Processing Plants on Environment 62
Chapter 7: Recommendations for Sustainable Sugar Production in thePresent and Future Scenario 64
Bibliography 69
2

List of Tables
Title of Table Page No.
Table No. 1: Province-wise No. of Sugar Mills 18
Table No. 2: Crushing Capacity of Pakistan Sugar Mills 19
Table No. 3: Operating Efficiency of Sugar Mills 20
Table No. 4: Utilisation of Sugarcane and Production of Sugar 21
Table No. 5: Area, Production and Yield of Sugarcane 1990-91 to 2002-03 24
Table No. 6: Provincial Shares in Area and Production of Sugarcane Average of 2000-01 to 2002-03 25
Table No. 7: Domestic Balance Sheet of Sugar 28
Table No. 8: Sugar Production and Recovery Level 29
Table No. 9: Per Capita Consumption of Sugar 31
Table No. 10: Support Price of Sugarcane and Retail Price of Sugar 32
Table No. 11: Cost of Sugar Production Analysis 33
Table No. 12: Excise and Other Taxes on Sugar Industry 35
Table No. 13: Sugar Imports Duty Structure 36
Table No. 14: World Balance Sheet 36
Table No. 15: International Prices of Sugar 37
Table No. 16: Pakistan's Imports from the EU and the World 48
Table No. 17: Comparison of CIF of EU Imported Sugar and Domestic Market Prices 49
Table No. 18: Price Differential of Imported Sugar fromOther than EU Countries and Domestic Market Price. 50
Table No. 19: Ratio of Imports to Local Production and Consumption 51
Table No. 20: Revenue Loss to Sugar Sector in Pakistan 52
Table No. 21: Sugar Export to the World 52
Table No. 22: Ratio of Pakistan's Total Export to Local Production 53
Table No. 23: Comparison of Cost of Production with fob Prices 54
Table No. 24: Production, Consumption and Exportable Surplus 54
3

List of Graphs
Title of graph Page No.
Graph No. 1: Number of Sugar Mills in Pakistan 19
Graph No. 2: Number of Mills and Crushing Capacity 20
Graph No. 3: Comparison of Estimated and Actual Crushing of Sugar Mills 21
Graph No. 4: Sugarcane Production, Crushing and Sugar Production 22
Graph No. 5: Area of Sugarcane in Pakistan 22
Graph No. 6: Yield of Sugarcane in Pakistan 23
Graph No. 7: Production of Sugarcane in Pakistan 24
Graph No. 8: Provincial shares of Area under Sugarcane Cultivation 25
Graph No. 9: Sugarcane Production and Sucrose Recovery Level 29
Graph No. 10: Per Capita Consumption of Sugar 31
Graph No. 11: Support Prices of Sugarcane and Retail Prices of Sugar 32
Graph No. 12: International Prices of Sugar 37
Graph No. 13: Comparison of EU and World Cif Prices of Imported Sugar to Pakistan 48
Graph No. 14: Comparison of EU Cif Prices of Imported Sugar toPakistan Domestic Market Prices 49
Graph No. 15: Comparison of Other than EU Cif Prices andDomestic Market Prices of Sugar 50
Graph No. 16: Share of Imported Sugar in Domestic Production and Consumption 51
Graph No. 17: Difference between Cost of Production andFob Prices of Pakistan's Exported Sugar 54
Graph No. 18: Production, Consumption and Deficit/Surplus of Sugar 55
5

List of Annexes
Title of Annex Page No.
Annex No. 1: Area, Yield and Production of Sugarcane 1992-93 to 2002-03 71
Annex No. 2: Highly Protected Tariff Structure of Sugar Exporting Countries 72
Annex No. 3: Imports of Sugar in Pakistan 73
Annex No. 4: Pakistan's Major Markets of Sugar Export 1995-96 to 2003-04 75
Annex No. 5: Export of Sugar from Pakistan (fob price for different destination) 76
Annex No. 6: Leading Sugar Exporting Countries of the World 77
Annex No. 7: Questionnaires and agenda of consultative meeting 78
7
ACRONYM
ACP African Caribbean Pacific Countries AFTA Asian Free Trade AgreementAoA Agreement on AgricultureASEAN Association of South East Asian NationsCAP Common Agriculture PolicyCCC Commodity Cash CreditCMO Common Market OrganizationCPR Cash Price ReceiptDCDS Double Carbonation Double SulphitationDR Defecation RemeltDSB Dispute Settlement BodyEIA Environment Impact Assessment EU European Union FAOSTAT Food, Agriculture Organization StatisticsFBS Federal Bureau of Statistics GDP Gross Domestic ProductionHMC Heavy Mechanical Complex TexilaIMF International Monetary FundKSEW Karachi Shipyard Engineering WorksMFN Most Favored Nation TreatmentMT Metric Tonmt Million TonMINFAL Ministry of Food, Agriculture and LivestockNAFTA North America Free Trade AgreementNFA National Food, Authority of Philippines NWFP North West Frontier ProvincePSMA-SZ Pakistan Sugar Mills Association - Sindh ZonePSSI Pakistan Sustainable Sugar InitiativesSCM Subsidy and Countervailing MeasuresSRI Sugarcane Research InstitutesSTRV Short Term Raw ValueTCD Tonnes Crushed Per DayTCP Trading Corporation of PakistanTRQ Tariff Rate QuotasUSDA United States Department of AgricultureWTO World Trade OrganizationWWF World Wide Fund for Nature
9

EXECUTIVE SUMMARY
The study is divided into seven chapters including introduction and recommendations. In the first chapter,introduction and objectives of the study have been explained. Chapter 2 explains the details of developmentand progress of sugar sector in Pakistan. Sugar sector means establishment of sugar factories, supply andmarketing of raw material and production of by-products. Chapter 3 is about domestic and world balancesheet of sugar, cost of sugar production in Pakistan and analysis of domestic and international sugar prices.The objective of writing this chapter is to give a full picture of Pakistan's domestic sugar scenario so that itcould be understood that Pakistan's sugar industry is meeting the domestic sugar requirements and deficit orsurplus situations of sugar. Cost of production has been explained in view of checking feasibility of export ofsugar from Pakistan. In Chapter 4, sugar trade policies of developed and developing countries have beenexplained in detail. Recent decision of WTO's Dispute Settlement Body (DSB) has been explained. PossibleEU reforms have also been mentioned thoroughly. In Chapter 5, keeping in view one of the objectives of thestudy, impact of EU policy, DSB decision and possible EU reforms have been discussed. It has been ana-lyzed that Pakistan's sugar industry would be competitive in international sugar market and what would bethe impact of domestic sugar production and import in the country. It has been checked that production ofsugar in Pakistan viable or not. Chapter 6 explains the most important objective of the study in which impactof Pakistan's sugar sector performance on socio-economic and environmental issues have been analyzed.To realize the actual impact of sugar sector on these issues, a survey has been conducted and a consulta-tion meeting was held of all stake holders of sugar sector. Based on the findings of survey and consultationmeeting, the impact on socio-economic environmental issues of sugar sector has been assessed. In Chapter7, comprehensive recommendations have been made to overcome deficiencies of the sugar sector inPakistan. In the following paragraphs short summary of each chapter is stated.
Chapter One: Introduction and methodology
This study was conducted to understand and appraise the impact of European Union sugar policies onPakistan's sugar sector and to offer a differentiated overview as a basis for decisions affecting the develop-ment of sugar market-liberalization strategies in Pakistan.
As a result of WTO Dispute Settlement Body (DSB) decision and future restructuring of the EU sugarmarket, gradual liberalization in the world sugar market may take place and sugar producing and exportingcountries would likely to adjust their policies of domestic sugar production and international trade regime.This policy shift may have an impact on every country's economic, social and environmental sectors.
One of the objectives of the study was to assess not only the economic impacts but, above all, ramifica-tions in terms of human rights as well as social and ecological implications. A key aspect of this approachwas the involvement of the actors concerned, with a special emphasis on particularly vulnerable groups(landless, farm workers and other marginalised population groups).
WWF started Pakistan Sustainable Sugar Initiative (PSSI), with the ultimate aim of influencing sugarcanecultivation and processing practices at the appropriate levels (i.e. in the field, through influencing businessdecisions, via government policies). WWF also aims to encourage the sugar sector to reduce other adverseenvironmental impacts and to deliver more benefits to people.
Multiple methods were used to understand the environmental and economic impact of European Unionpolicies on the sugar sector of Pakistan. In order to incorporate manufacturers and sugarcane growers' pointof view on the said issues, a country wide survey was conducted. A meeting was also held at Lahore whereall the stakeholders of sugar sector were assembled. The purpose of that meeting was to get the final feedback of the growers, manufacturers and traders on various aspects of the research. Findings of the surveyresearch and consultation meeting are incorporated into different chapters of study.
Chapter Two: Development of Sugar Sector
This chapter contains the information about sugar mills such as, the number of mills, their crushing capacity and their location. In Pakistan, two major production processes are used in sugar plants. The double carbonation double sulphitation (DCDS) process and the defecation remelt (DR) process. The DR process is preferred because of its lower operating cost.
Among 105 sugarcane growing countries, Pakistan is the 5th largest country in the
11

world in terms of area under sugarcane cultivation, 11th by production and 60th in yield. Sugarcane is grownon about one million hectares. Sugarcane is a high delta crop and requires 80 to 90 acre inches of water inSindh and about 64 acre inches water in the Punjab. Water is too crucial to production and productivity ofsugarcane crop but is a scarce resource.
It is quite visible that there is an upward trend in area, production and yield apart from a rare decline infew years. In Pakistan yield is perhaps the lowest among all major sugarcane growing countries in the worldhowever, Pakistan has all the essential ingredients to produce high yield sugarcane.
Farmers normally sell their sugarcane directly to sugar mills but some contractor and middlemen havealso been involved in this business. Sugarcane is not a profitable crop, it hardly covers input cost but all thetime there is no other option.
Chapter Three: Domestic and World Balance Sheet of Sugar
In Pakistan, almost 99% sugar is extracted from sugarcane. Sugar production of the last three years onaverage gives an operational efficiency of about 80%, leaving 20% idle capacity. The sugar productioncapacity of these mills is above five million tons of sugar. The mills require about 65 million tons of sugar-cane to run on full capacity. Pakistan was a sugar importing country as demand outstripped supply for mostof the part of 1962 to 2000. However, situation has since changed. Country produced surplus sugar, whichhas created huge closing stocks from year 2000 to 2003. Sucrose recovery level in Pakistan is very lowbecause sugarcane takes about 4-5 days after harvesting to the point of mill gate. This leads not only toreduction in weight by about 2 percent but also affects recovery of sugar by 0.1 percent for each day in tran-sit. Mill inefficiency in juice extraction is another reason. Cane is also mixed with trash that affects the millefficiency.
International Sugar Organisation has forecast global production of sugar in 2003-04 at 146.99 milliontons, and consumption at 145.62 million tonnes. End year stocks are projected at 64.51 million tonnes.
The support price of sugarcane is the amount which farmer gets on delivery of the crop to the factorygates; higher support price encourages farmers to increase production. Support prices have increased in thepast three decades except for a decrease in 2003. The retail price of sugar has also increased in the pastthree decades. After 1985 world international prices remained between US$ 200 to 397 US$ / ton. The risingcost of production which was contrasted by plummeting prices of sugar proved awful, disastrous of sugarindustry.
Chapter Four: The International sugar policies
Protection is a major problem in sugar trade. The world sugar market has long been recognized as one ofthe most distorted global commodity markets. It is the disruptive policies of the European Union (EU), theUnited States (US) and Japan that cause most of these distortions. Policies offer very high rates of protec-tion to domestic producers by imposing severe import restrictions and by providing other measures such asexport subsidies or production quotas designed to help raise domestic prices above the world price. And it'son the rise and very damaging to exporters. The level of trade protection has risen in recent years as theworld price of sugar has fallen.
Chapter Five: EU Sugar Policies Reforms Impact on Pakistan's Sugar Sector
Pakistan regularly imports sugar from the world. The European Union is the major supplier of refined sugarto Pakistan, which captured 98% share in quantity and value during 1995-96. In 1996-97 its share declinedto 7.5%, after that it reached 34.4% in term of quantity and 39.5% in terms of value. Pakistan was successfulin finding other cheaper sources of supply. As a result of this shift, EU share in Pakistan's total importdeclined to 10% in term of quantity and 12.8% in term of value in 1999-00 and to the lowest point ever at4.9% in 2000-01. In 2001-02 the share of EU again increased to 7.7% in term of quantity and 8.6% in termof value. In the last 2 years EU dominated Pakistan sugar market and shared 61.8% to 66.8% in term ofquantity and 63.6 to 68.5% in term of value respectively.
Price differential i.e. gap between the cif prices including 10% incidental charges of imported sugar fromthe EU and Pakistan's domestic market prices is too wide which means imported sugar
12

could have been available in the local market at low price compared with domestic price of sugar. This sup-ports an argument that the domestic prices could have been higher in the absence of EU sugar. The EUsugar imports have played an important role in maintaining stability in domestic prices. Similarly price ofimported sugar particularly from other than EU countries were also low and price differential i.e. gap is alsosame as in case of imported sugar from EU. There will be an opportunity for sugar industry to produce sugarin a more efficient way and supply at low price than the border prices in the domestic market.
EU imported sugar is not replacing much of local production. The share of EU imported sugar inPakistan's total imports and domestic production and consumption in 1990s was approximately 30 % ofdomestic consumption. To restrict EU sugar dumping government should increase import duty and giveincentives to local producers so that they could produce at low cost and sell at cheap rates other wise thereis no way to restrict EU dumping.
The impact of EU reforms on Pakistan sugar sector depends on what reforms in the EU policy encom-passes and how the modalities of WTO new framework particularly on agreement on agriculture take shape.
Pakistan is a sporadic exporter of sugar, as it does not have surplus sugar every year. Since 1995-96 to2003-04, Pakistan has exported only a limited quantity of sugar to a few countries. This proves that Pakistanis in no competition with any major sugar exporting country even if there are major policy changes in the EU.Pakistan's fob price does not cover the cost of production and it is difficult to compete in the highly sub-sidised world trade regime. It is evident that fob prices are lower than the cost of production for three years.It is not sensible to export sugar below cost of production to protected market of other countries. Besides,buyers are not likely to import expensive sugar from Pakistan when much cheap sugar is available else-where. Pakistan sugar industry is not much efficient to produce sugar efficiently and to reduce the cost ofproduct through economy of scale by maintaining environmental standards.
Pakistan's sugar industry is not much hopefull with DSB decision. Pakistan's sugar industry would contin-ue to be affected adversely because of high in-put cost compared with other countries as they are producingsugar relatively at a lesser cost of production. Pakistan does not export sugar regularly because no subsidyis provided to exporters. The government is not helping the sugar sector of Pakistan to sort out this problem.
Viability and progress of sugar industry in Pakistan depend on regular supply of raw material at affordableprice. Due to limited supply of sugarcane and under utilization of existing crushing capacity, there is notmuch future for sugar industry. On strictly economic grounds sugar industry is not viable because there isnot enough sugarcane production nor is there any potential for increasing either the area under crop or theproductivity.
Chapter Six: Sugar Sector Impact on Environment
Sugarcane is a high delta crop and uses up to 9% of total fresh water. Practically in Pakistan it requires25/30 irrigation waters in a season. Due to water crises fresh water is not available for rural population, livingcreatures and wildlife. This has an environmental effect.
Due to scarcity of canal water major source of water is tube well. Drastic changes have been observed insoil composition because brackish water of tube well is not good for cultivation/soil. Sugarcane would remainshorter and thin due to the scarcity of water. As with monoculture, sugarcane cultivation is highly susceptibleto soil erosion through wind and water. Sugarcane crop prevents silt run-off. Use of pesticide in sugarcanearea is discouraged. Sugarcane crop almost never requires spray of pesticides hence impact of chemicalpoisoning and silt run-off is never observed but herbicides are used. Excessive water application blocks thesalinity while it may cause of water logging. Scientists reported that suffocation is never found in sugarcanefields. Pesticides spray produce suffocation for few minutes in the sugarcane crop. The fields in sugarcane-growing areas are burned off after harvesting. In mechanical cutting sugarcane is separated from the foliage,which in turn suffocates the sugarcane plants. Waste-water is mostly generated during the washing of sugar-cane contaminated with agrochemicals. Modern plants use closed water-circulation systems and have multi-stage waste-water treatment Plants.
It has been investigated through a survey that shortage of water has negative effect on soil and quality ofsugarcane crop. On the other hand, fresh water is also no more available for consumption of rural popula-tion, forest, wildlife and living creatures.
Chapter Seven: Recommendations
Sugar trade at world market prices below the cost of production is an important issue. The
13

EU dumping has depressed world prices and led to foreign exchange losses to the sugar exporting develop-ing countries. Sugar export market environment at global spectrum holds characteristic of extreme competi-tion in price. As a result, all the sugar-exporting countries invariably arrange subsidy for success in exports.Pakistan's sugar sector is suffering with dumping of EU sugar export and without domestic support subsidiesis unable to compete in the international market at the time of sugar surplus. It is true that government ofPakistan has neither extended similar support in sugar export nor protected sugar industry from dumpedimport from abroad. The dilemma of sugar industry is characterized as: sugar production not on a steadyupturn, cost of sugar production represented a rising trend, sugar industry's plight is attributable to high inci-dence of sugarcane price in cost of sugar production and high incidence of sales tax. Inconsistency domi-nates sugarcane crop cultivation and sugar production and trade. The sugarcane is the basic and only rawmaterial of producing sugar as sugar beet is not cultivated in Pakistan at large scale. The raw materialrequirement of sugar industry comprising 76 sugar mills, with crushing capacity of about 350 thousandtonnes per day can be met through expanding acreage under sugarcane. Monetary gains of sugarcane cropcan be achieved through enhancement in sugarcane yield. Sugarcane yield and sugar recovery of Pakistanhave not been up to mark. Australia obtains 5 tonnes of sugar per acre against 1.7 tonnes of Pakistan.Potential to improve sugar recovery to 10/11% by rich varieties of sugarcane also exists. Higher yield andrecovery on the given 1000 thousand hectares would impressively increase sugarcane and sugar productionvolume. A careful planning preceding each season on sugar production is sine-quo-non for smooth market-ing of sugarcane as well as sugar.
14

CHAPTER ONE: INTRODUCTION AND METHODOLOGY
1.1 Introduction
1. The World trade has been changed after the emergence of World Trade Organisation (WTO). New tradepolicies are profoundly affecting economic as well as political policies of the developed and developing countries. The traditional concept of sovereignty is no more applicable in the new situation. All sugar producing countries are trying to be competitive in the world market and to adjust their production and trade policies according to new WTO trade regime.
2. Pakistan's experience in industrialization is not unique and is consistent with the experience of the developing countries in the region. Public sector played a significant role in the beginning and later on the private sector received all the patronage from the State including high tariffs protection against imports, multiple exchange rates favoring the sugar industry, export bonus scheme and loans on concessional rates. Data on investment in the manufacturing sector during the 1950s is not available though it is assumed to be a small percentage of the GDP. It reached the maximum of 5% in the 1960sbut declined by the 1970s to 3.3%. It was mainly on account of public sector investment in various industries including sugar, Fertiliser and engineering that in man ufacturing appeared strong. The 1980ssaw the lifting of price control from almost all the products including sugar, liberalization of foreign exchange and withdrawal of sub sidies and tariff protection including tax holidays etc.
3. After the emergence of WTO the sugar industry of Pakistan with the process of globalization has to stand on its own feet. WTO rules do not provide the process of protection to an inefficient industry. Comparative advantage will determine the survival of an industry. As a result of WTO Dispute Settlement Body (DSB) decision and future restructuring of the EU sugar market, gradual liberalization in the world sugar market may take place and sugar producing and exporting countries would likely to adjust their policies of domestic sugar production and international trade regime. This policy shift may have an impact on every country's economic, social and environmental sectors.
4. This study has been conducted to understand and appraise the impact of European Union sugar poli-cies on Pakistan's sugar sector and to offer a differentiated overview as a basis for decisions affecting the development of sugar market-liberalization strategies in Pakistan.
5. Concern about externalities is no more confined to the developed world. People of the developing worldequally suffer from environmental hazards due to the development efforts. One of the objectives of this study is to investigate the nature of environmental problems being created by sugar sector and to ana-lyze the economic, social and ecological consequences of liberalized market access for Pakistan's sugar sector.
6. A range of international and bilateral trade policies influence the profitability of the Pakistan sugar indus-try. WTO rules, domestic support for sugar producers as well as export subsidies and overall trade polices of the US, European Union and Japan all influence the world price of sugar and the opportunitiesfor Pakistan to sell its sugar globally. These factors in turn play a role in determining the economic sus-tainability of the Pakistan sugar industry and the environmental impacts of sugar sector in the country. Understanding the impacts of current global sugar policies and likely future reforms on the Pakistan envi-ronment is one component of the approach which World Wildlife Fund is taking to improve the environ-mental performance of the industry.
7. WWF recently started Pakistan Sustainable Sugar Initiative (PSSI), with the ultimate aim of influencing sugarcane cultivation and processing practices at the appropriate levels (i.e. in the field, through influ-encing business decisions, via government poli cies).
8. In a preparatory phase of the PSSI, six sugarcane studies were conducted to identify the issues regard-ing socio-economic and environmental impacts of sugarcane cultivation and processing and themarketing policy issues relating to the sustainable development of sugarcane and sugar in Pakistan. The development of these reports involved all the sugar stakeholders.
15
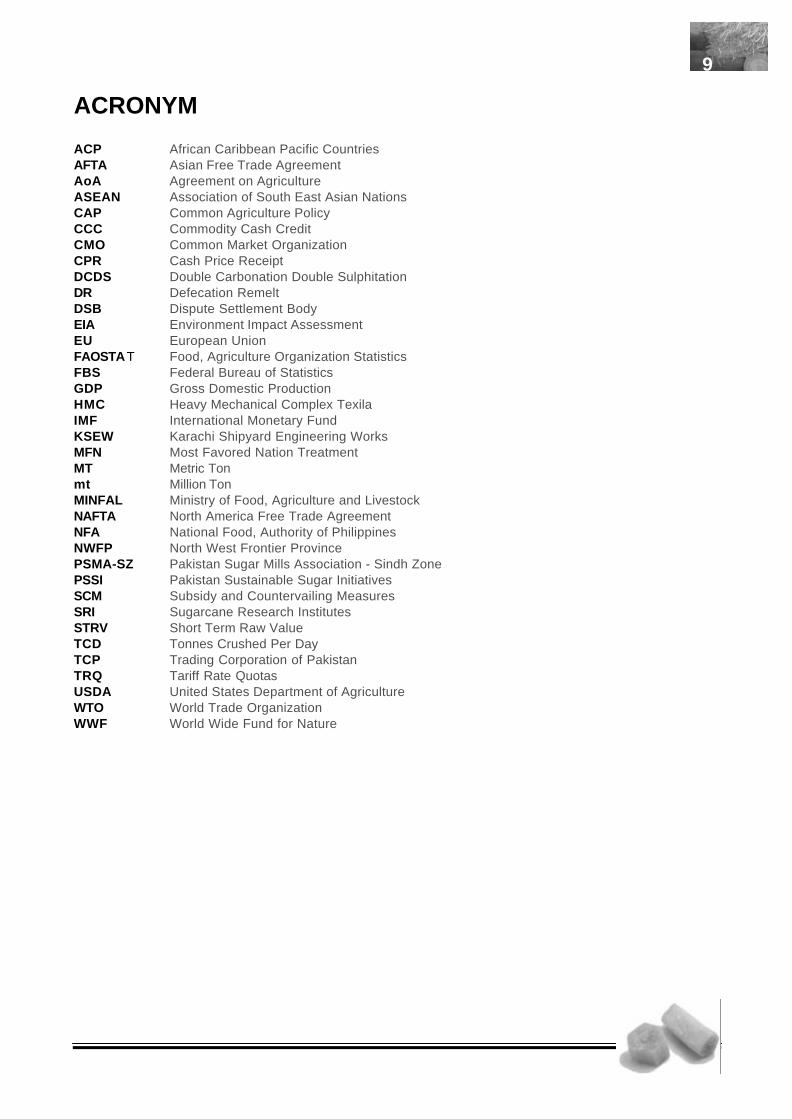
9. Many of the current sugar growing and processing practices in Pakistan may result in a range of envi-ronmental impacts, including agrochemical runoff, silt runoff, nutrient leaching from the fields, salinity and water logging problems. The effects include damage to ecosystems via chemical poisoning and ecosystem smothering due to the volume of silt running off from the farms. Additional impacts on the environment include habitat loss due to expansion of farm in order to acquire land for sugarcane cultiva-tion, threats to species bio diversity and wider energy-related uses. This study has tried to investigate any of these effects on Pakistan's environment.
10. The world is facing a water crisis and agriculture is by far the biggest user of water; 70% of world's freshwater withdrawals are for agriculture, rising to more than 90% in Pakistan. Land-use changes brought about by farming, whether irrigated or rain fed, influence the quantity, quality and distribution of water that is collected, stored and released into the environment. Without a natural hydrological bal-ance, rivers which flow all year round become seasonal or diverted, lakes and wetland dry up, pollutantsin the water become more concentrated and salt water may seep in to replace abstracted fresh water turning farmland into infertile wastelands. This water crisis may have long lasting effects on environmentof Pakistan.
11. There is a limit to the amount of water available in Pakistan's Indus Basin. Only about 30 per cent of thewater reaches the crop roots. Poor management practices both on sugarcane farms and sugar industry underlie the poor state of affairs. Pakistan's soils have several deficiencies which make it difficult to move from subsistence to high yields of sugarcane. One issue is organic matter deficiency. Inadequate cultural practices, such as poor seed bed preparation in clay soils, broadcast sowing, improper Fertiliserapplication, and watering by turns rather than on crop demand contribute to the low yields. However, themost serious constraints are neither physical nor technical but sociological. Absentee landlordism, iniq-uitous tenancy rights, fragmentation of landholding and poor help from the State have combine to produce an inefficient low yield sugarcane crop. Better Management Practices can reduce the impacts of sugar cane farming and processing on water quantity, water quality, ecosystems, species and ecosys-tem function as well as to provide better access to other water users in the catchments or basins.
12. "WWF aims to enable the sugar sector to use less water and to ensure that water saved from better practices delivers more benefits to people and nature. WWF also aims to encourage the sugar sector toreduce other adverse environmental impacts".
13. One of the objectives of the study is to assess not only the economic impacts but above all, ramifications in terms of human rights as well as social and ecological implications. A key aspect of this approach is the involvement of the actors concerned, with a special emphasis on particularly vulnerable groups (landless, farm workers and other marginalised population groups).
14. The structure in this sector of Pakistan's economy is complex. Sugar production has been one of the most important economic undertakings since independence. Key political measures to provide incentive as political bribe and growing domestic consumer markets, have brought far-reaching changes in sugar sector of Pakistan.
15. The study starts by looking at the way in which sugarcane cultivation, that is to say sugar production, have evolved and how they are structured today. It also includes a survey of the latest economic devel-opments in all key areas of cultivation such as Punjab and Sindh which has been targeted by sugar fac-tories.
1.2 Methodology
16. Multiple methods have been employed to understand the environmental and economic impacts of European Union policies on the sugar sector of Pakistan. In order to incorporate manufacturers and sugarcane growers' point of view on the said issues, a country wide survey was conducted and detailedquestionnaires were designed for all stakeholders of the sugar sector. Another questionnaire was also designed for an envi ronmental specialist to know his position on the issue. Sugar traders were not left
16

designed for an envi ronmental specialist to know his position on the issue. Sugar traders were not left out from this process. At the second stage, as per requirement of the research design, growers and crushers from Punjab, Sindh and NWFP were interviewed in order to collect primary data. From the totalof five growers, two growers were approached in Punjab, two in Sindh and one in NWFP. Similarly, one manufacturer was interviewed from each of the three provinces. Two traders, one from Lahore and one from Karachi were interviewed to apprise the trading side of the matter. It was considered useful to dis-cuss the issue with a scientist to assess the impact of sugar production and cultivation process on environment.
17. In addition to the data collected from surveys, discussions with representatives of companies, trade unions, social movements, non-governmental organisations and research institutes were held. Account must be taken of the fact that the data obtained from different sources does not always tally. Parallel to this field research, theoretical side of the matter was also thrashed out.
18. Finally, a meeting was held at Lahore where all stakeholders of sugar sector were assembled under oneroof to share the finding of theoretical and field research. The purpose of that meeting was to get the final feed back of the growers, manufacturers and traders on various aspects of the research to make it more rigorous and comprehensive. In order to make the research study more accurate and comprehen-sive, findings of the survey research and consultation meeting have been incorporated into different chapters of the study. In chapter seven comprehensive recommendations have been presented to over-come the deficiencies of the sugar sector.
17
CHAPTER TWO: DEVELOPMENT OF SUGAR SECTOR
2.1 The Sugar Industry
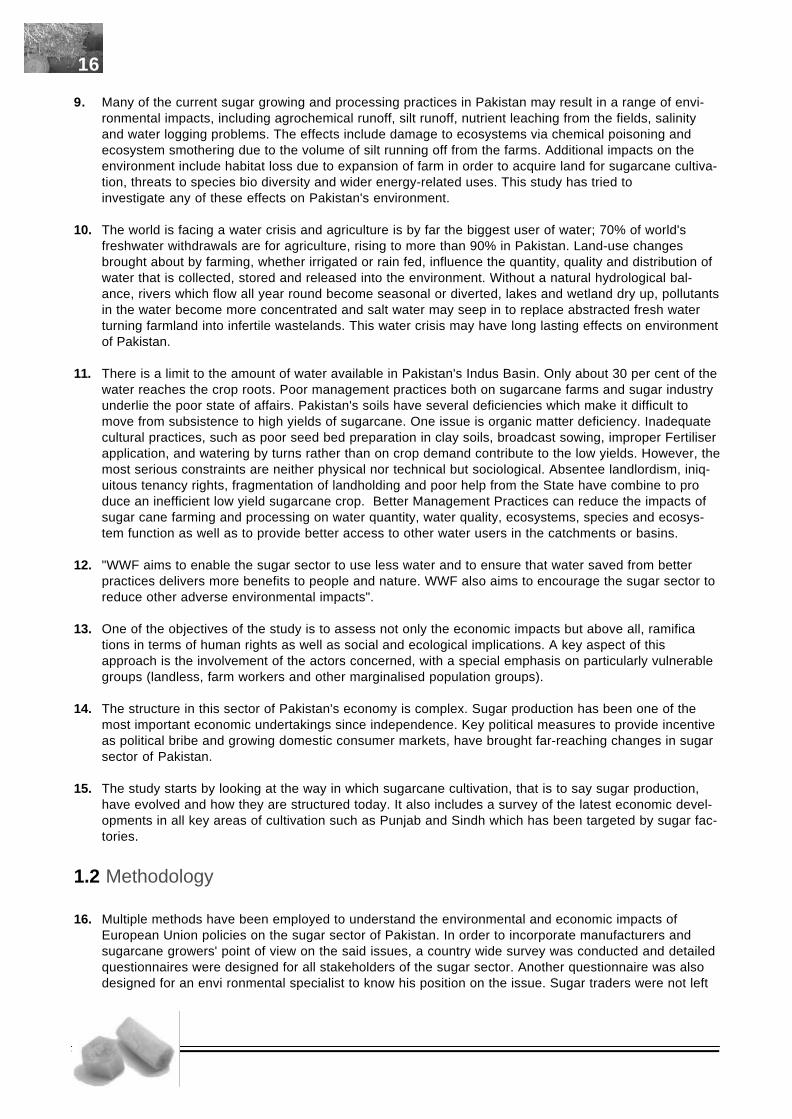
1. At the time of Independence in 1947, the country had two sugar mills built in 1936-38, one in NWFP and one in Punjab, each crushing 300-400 tonnes of cane a day. Since then, the sugar industry has emerged as a major processing industry. In the early 50s, three more sugar mills were established. In the meantime, the area under sugarcane increased almost by 100% and reached 397 thousand hectares in 1959-60. The addition of 13 more units in next ten years further expanded the sugarcane cultivation to 620 thousand hectares in 1969-70. Thereafter, 14 more mills were installed up to 1981-82. Simultaneously, the cultivation of sugarcane expanded reaching 947 thousand hectares. Sugar-manufacturing capacity grew rapidly during the 1980s, when liberal sanctioning and credit regimes, coupled with a generally pro-business policy environment, helped to create conditions conducive for private investment in the industry. Major growth in capacities was witnessed in late 80's and early 90's, when industrial sector was fully opened for private investment. During 2003-04, 76 sugar mills were in operation having a crushing capacity of 350,000 tonnes a day. Consequently, about 77 per cent of the total cane produced in the country was crushed for manufacturing white sugar producing 3.9 million tonnes of sugar. Area of sugarcane expanded to more than 1.2 million hectares producing 55 million tonnes of sugarcane. Table below shows the progress of sugar industry in the 1990s.
2. The above table represents the rise in sugar mills since 1990-91 to 2003-04. It indicates that the num-ber of sugar mills increased by 50% over the period. During the period of 1996-97, the number increased to 69. It was at the maximum level that is 73 in the year 1998-99. Then there was a declining trend in the next four years as the number of mills was reduced to 69. After that, there is also an upwardtrend as the number reached 76 in the year 2003-04. Sugar industry is supposed to play an enhanced role of being a catalyst in growth and development of the national economy. By virtue of its being whollyagro-based-cum-rural- in totality, as each sugar mills is designated to remain in the deep rural landmass. Sugar industry is also bound to play a greater role in socioeconomic upswing of the rural sector and contribute further in accelerating development of Pakistan. The Graph below shows progressive growth of sugar factories in the country.
Table 1: Province-wise No. of Sugar Mills
Year Punjab Sindh NWFP Pakistan 1990-91 24 22 5 51 1991-92 25 22 5 52 1992-93 32 24 5 61 1993-94 33 24 6 63 1994-95 36 24 6 66 1995-96 37 24 6 67 1996-97 37 27 5 69 1997-98 39 28 5 72 1998-99 39 29 5 73 1999-00 37 25 5 67 2000-01 35 25 5 65 2001-02 37 27 5 69 2002-03 38 28 5 71 2003-04 39 31 6 76
Source: Annual Report 2003 Pakistan Sugar mills Association Sindh Zone
18

Graph 1
2.2 Installed Capacity
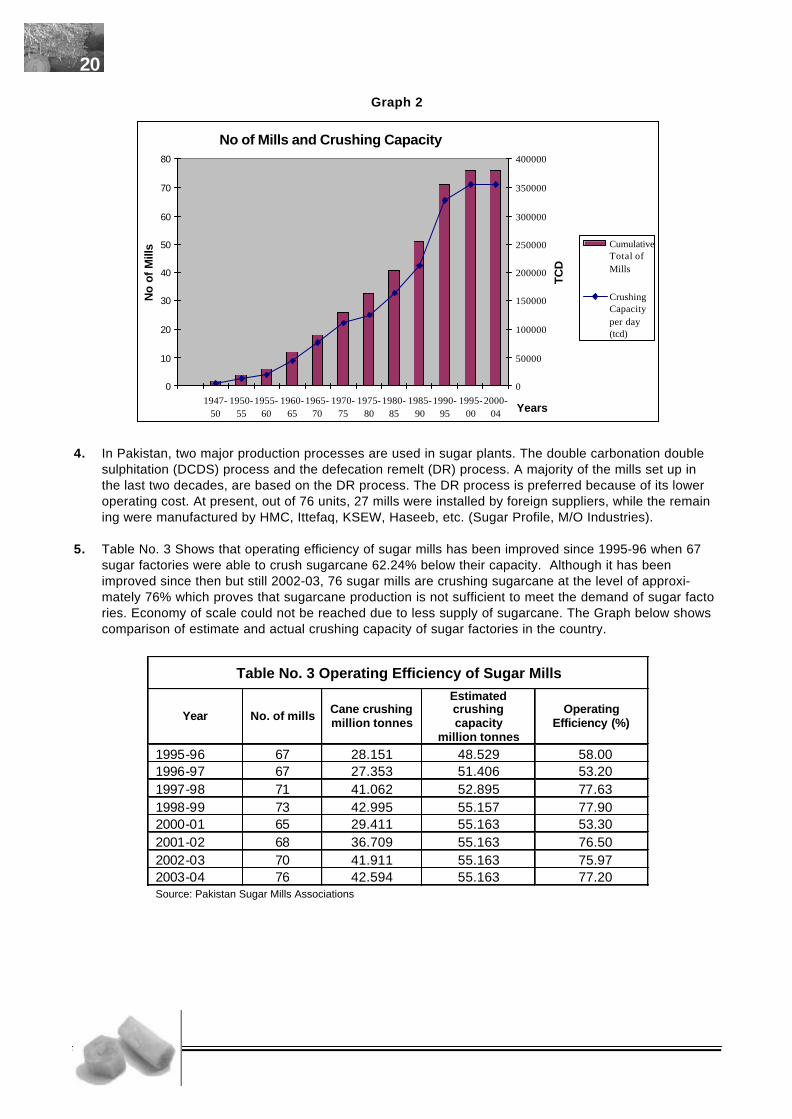
3. Table 2 represents the crushing capacity of Pakistan sugar mills. In 1947, it was 5020 tonnes crushing per day (tcd) for two mills. It rose slowly and reached 18,220 (tcd) from six mills during 1955-60. Then there is a rapid rise. During 1960-65 it was 44,050 (tcd) from twelve mills. In the years 1970-75, it reached the level of 109,350 (tcd). It continued to rise and reached 211,850 (tcd) from 51 mills in 1985-90. During the years 1990 to 2000, it reached its maximum level of 355,150 (tcd) from a total of 76 mills.The total estimated crushing capacity of 76 sugar mills is 5.3 million tonnes per annum. This has been worked out on the basis of 150 operating days. Out of the 76 mills, 39 mills have capacity of 171,000 (tcd) are located in Punjab, 31 with capacity of 154,600 (tcd) in the Sindh and 6 with capacity of 29,500 (tcd) in NWFP. Out of present 76 units, 25 units have the capacity ranging between 6000-9000 tcd, 29 units between 4000-6000 and 22 units have capacities under 4000 tcd (Sugar Profile, M/O Industries). The Graph below also shows progressive growth of crushing capacity sugar factories in the country.
Table 2: Crushing Capacity of Pakistan Sugar Mills
Years No. of Mills Installed
Cumulative Total of Mills
Crushing Capacity per day (tcd)
1947-50 2 2 5,020 1950-55 2 4 12,020
1955-60 2 6 18,220
1960-65 6 12 44,050 1965-70 6 18 76,550
1970-75 8 26 109,350 1975-80 7 33 125,950
1980-85 8 41 164,850 1985-90 10 51 211,850
1990-95 20 71 326,650
1995-00 5 76 355,150 2000-04 0 76 355,150
Source: Sugar Profile, Expert Advisory cell M/O Industries
0
10
20
30
40
50
60
70
80
1990-91
1991-92
1992-93
1993-94
1994-95
1995-96
1996-97
1997-98
1998-99
1999-00
2000-01
2001-02
2002-03
2003-04
Years
No
of M
ills NWFP
Sindh
Punjab
Pakistan
19
Graph 2
4. In Pakistan, two major production processes are used in sugar plants. The double carbonation double sulphitation (DCDS) process and the defecation remelt (DR) process. A majority of the mills set up in the last two decades, are based on the DR process. The DR process is preferred because of its lower operating cost. At present, out of 76 units, 27 mills were installed by foreign suppliers, while the remaining were manufactured by HMC, Ittefaq, KSEW, Haseeb, etc. (Sugar Profile, M/O Industries).
5. Table No. 3 Shows that operating efficiency of sugar mills has been improved since 1995-96 when 67 sugar factories were able to crush sugarcane 62.24% below their capacity. Although it has been improved since then but still 2002-03, 76 sugar mills are crushing sugarcane at the level of approxi-mately 76% which proves that sugarcane production is not sufficient to meet the demand of sugar factories. Economy of scale could not be reached due to less supply of sugarcane. The Graph below shows comparison of estimate and actual crushing capacity of sugar factories in the country.
No of Mills and Crushing Capacity
0
10
20
30
40
50
60
70
80
1947-50
1950-55
1955-60
1960-65
1965-70
1970-75
1975-80
1980-85
1985-90
1990-95
1995-00
2000-04 Years
No
of M
ills
0
50000
100000
150000
200000
250000
300000
350000
400000
TCD
CumulativeTotal ofMills
CrushingCapacityper day(tcd)
Table No. 3 Operating Efficiency of Sugar Mills
Year No. of mills Cane crushing million tonnes
Estimated crushing capacity
million tonnes
Operating Efficiency (%)
1995-96 67 28.151 48.529 58.00 1996-97 67 27.353 51.406 53.20 1997-98 71 41.062 52.895 77.63 1998-99 73 42.995 55.157 77.90 2000-01 65 29.411 55.163 53.30 2001-02 68 36.709 55.163 76.50 2002-03 70 41.911 55.163 75.97 2003-04 76 42.594 55.163 77.20 Source: Pakistan Sugar Mills Associations
20

Graph 3
6. Table 4 indicates the production and cane crushed by the sugar mills since 1993-94 to 2003-04. According to the table, production of sugarcane increased from 44 millions tonnes to 55 million tonnes till 1998-99 while the cane crushing increased from 34 million tonnes to 43 million tonnes. The increasefrom 76.93% to 77.9% is only marginal during six years from 1993-94 to 1998-99. The quantity of sugar produced increased from 2.901 million tonnes to 3.531 million tonnes in the same six years. However, recovery rate has decreased from 8.48% to 8.21% during the same time period. During the next three years from 1998-99 to 2001-02 production of sugarcane decreased from 55.2 millions tonnes to 48.0 million tonnes while cane crushing has decreased from 43 million tonnes to 36 million tonnes. After that Sugarcane production reached 52.6 million tonnes and cane crushed to 42.6 million tonnes. Sugar production increased to 3.6 million tonnes. The graph interprets the table number 4 and proves that mills have not fully utilized whole production of sugarcane and maximum sugar was produced in 1998-99.
Comparison of Estimated and Actual Crushing of Sugar Mills
0
48.529
51.406
52.895
55.157
55.163
55.163
55.163
28.151
27.353
41.062
42.995
29.411
36.709
41.911
1995-96
1996-97
1997-98
1998-99
2000-01
2001-02
2002-03
Yea
rs
Crushing of Sugarcane
Cane crushing million tons Estimated crushing capacity
Table No. 4 Utilisation of Sugarcane and Production of Sugar
Year No. of mills Production Million Tonnes
Cane crushed Million Tonnes
Percentage crushed
Sugar produced Million Tonnes
Recovery Rate %
1993-94 63 44.427 34.182 76.93 2.901 8.48 1994-95 66 47.168 34.194 75.49 2.983 8.72 1995-96 67 45.230 28.151 62.24 2.450 8.7 1996-97 67 42.000 27.353 64.65 2.379 8.86 1997-98 71 53.104 41.062 77.29 3.549 8.64 1998-99 73 55.191 43.000 77.9 3.542 8.21 1999-00 67 46.697 29.000 62.07 2.429 8.33 2000-01 65 43.608 29.411 66.69 3.016 8.38 2001-02 68 48.042 36.709 76.41 3.249 8.71 2002-03 70 52.050 41.911 80.52 3.677 8.74 2003-04 76 52.585 42.594 81.00 3.944 9.16 Source: Pakistan Sugar Mills Associations,
21

Graph 4
2.3 Raw Material
7. Among 105 sugarcane growing countries, Pakistan is the 5th largest country in the world in terms of area under sugarcane cultivation, 11th by production and 60th in yield. The yield in Pakistan is about 4 tonnes of sugar per hectare against a potential of 10.5 (Farming Outlook 2004). Sugarcane is the main raw material for the production of sugar. Since independence, the area under sugarcane cultivation has increased more rapidly than any other major crop. It is one of the major crops in Pakistan cultivated over an area of around one million hectares. Accounting for 5 per cent of the total cropped area, sugarcane contributes 15 per cent to the value added of major crops. The sugar industry, the second largest agro based industry is dependent on sugarcane farming for the supply of raw material. Sugarcane farm-ing and sugar manufacturing contribute significantly to the national exchequer in the form of various taxes and levies. Sugar manufacturing and by products have contributed handsomely towards the earn-ing of foreign exchange, previously through import substitution and recently through export.
8. Sugarcane is grown on around one million hectares. For the last six years from 1997-98 production has ranged between 46 and 55 million tonnes. Yield, on average is 47.5 tonnes per ha. However, some indi-vidual farmers obtain higher yield up to 100 tonnes per hectare. Cane is also used for non-centrifugal sugar (gur) and seed and the amount of crop harvested for centrifugal sugar each year is around 2/3rd of the total. The contribution of the Punjab in the total cane production is around 60 per cent, Sindh about 30 per cent and NWFP 10 per cent (Farming Outlook). The graph depicts that area of sugarcane did not increase smoothly. There was a cycle of four years. Particularly in 1998-99 it started declining but after that it increased in 2002-03.
Graph 5
Sugarcane Production and crushed and sugar production
0
10
20
30
40
50
60
1993
-94
1994
-95
1995
-96
1996
-97
1997
-98
1998
-99
1999
-00
2000
-01
2001
-02
2002
-03
2003
-04
Years
Can
e p
rod
uce
d a
nd
cr
ush
ed
0
0.5
1
1.5
2
2.5
3
3.5
4
4.5
Su
gar
Pro
du
ctio
n
CaneProducedmilliontonnes
Canecrushedmilliontonnes
Sugarproducedmilliontonnes
Sugarcane Production, crusing and sugar production
Area 000 Hectare
100
300
500
700
900
1100
1990-91
1992-93
1994-95
1996-97
1998-99
2000-01
2002-03
Years
Are
a in
000
Hec
tare
Area000Hectare
22

9. Despite manifold increase in the area under cultivation and production, per hectare yield has not shown any significant improvement. The average yield over ten-year period 1993-2003 shows a comparatively high in the province of Sindh followed by NWFP and the Punjab (Annex I). Sugarcane is a high delta crop and requires 80 to 90 acre inches of water in Sindh and about 64 acre inches water in the Punjab. Water is a scarce resource as Pakistan is an arid country where sustainable availability of water cannot be assured. Water is too crucial to production and productivity of sugarcane crop.
10. In Pakistan yield is perhaps the lowest among all major sugarcane growing countries in the world (Sugar Profile M/O Industries). Sugarcane yield in Pakistan compared with countries of the world in terms of average yield during 2001 was 47.5 tonnes per hectare compare to the world average of 65.2, Asia 65.4, China 77.1, India 70.6, Philippine 92.6, Thailand 57.7 and Australia 75.5 (Farming Outlook 2004). Pakistan has all the essential ingredients to produce high yield sugarcane. Despite manifold increase in the area under cultivation, per hectare, yield has not shown any significant improvement and remained the same. Colombia had the highest yield of 117.9 tonnes/hectare, fol-lowed by Australia (99.2), Egypt (89.0) (Ministry of Industries). Thus, sugarcane production presents a dilemma. As shown in the graph below yield could not increase more than 50 tonnes per hectare.
Graph 6
11. Area under cultivation, production and yield of sugarcane in the country are given in Table-5. it indicatesthat the area, production and yield all registered an increase. It is quite visible that there is an upward trend in all three fields apart from a rare decline in few years. In the year 1990-91, the area was 883.8 hectares, production was 35,988.7 tonnes and the yield was 40.7 tonnes per hectare. It increased in thecoming years but the rate of increase was very slow and that was the reason of Pakistan's lowest yield among all major sugarcane growing countries of the world. The rise continued although there were decline again in few years. There were declining trends from 1991-92 to 1992-3 and from 1999-00 to 2000-01 in all three. As a result of such slow progress, the end result after the year 2003-04 was that the yield could not increase more than 50 tonnes per hectare which was very little. While area under thecrop increased over the period by 19%, production increased by 46% and the yield by 26%. The graph below presents a picture of production of sugarcane growth which also proves that there is a cycle of four year according to fluctuations in the production.
Yield of Sugarcane
20
25
30
35
40
45
50
55
1990-91
1992-93
1994-95
1996-97
1998-99
2000-01
2002-03 Years
Yie
ld to
n / h
a
YieldTons/Hectare
23

Graph 7
12. In consultative meeting manufacturers acknowledged the fact that mill owners have invested money on new automatic machinery but hardly try to help sugarcane farmers. They emphasized that Pakistan is one of the leading manufacturers of sugar in the world but its per acre yield is poorest in the world. Small per acre yield triggers a chain reaction that renders growers and crushers helpless. Growers get meager returns on their investment while sugar mill owners fail to use their crushing capacityadequately and effectively. Only by increasing per acre yield grievances of growers and manufacturers could be redressed (Consultation meeting).
13. Table 6 represents average provincial shares in area and production for 2000-01 to 2002-03. According to this table, Punjab is the leading province in area and production followed by Sindh. NWFP occupies third position.
Production 000 Tons
200002500030000350004000045000500005500060000
1990-91
1992-93
1994-95
1996-97
1998-99
2000-01
2002-03
Years
Production000 Tons
24
Table 5: Area, Production and Yield of Sugarcane 1990-91 to 2002-03
Years Area 000 Hectare
Production 000 Tonnes Yield Tonnes/Hectare
1990-91 883.8 35988.7 40.7 1991-92 896.1 38864.9 43.4 1992-93 884.6 38058.9 43.0 1993-94 962.8 44427.0 46.1 1994-95 1009.0 47168.4 46.7 1995-96 963.1 45229.7 47.0 1996-97 964.5 41998.4 43.5 1997-98 1056.2 53104.2 50.3 1998-99 1155.1 55191.1 47.8 1999-00 1009.8 46323.6 45.9 2000-01 960.8 43606.3 45.4 2001-02 999.7 48041.6 48.1 2002-03 1099.6 52055.8 47.3 2003-04 1050.8 52584.6 50.0
Source: APCom , Ministry of Food, Agriculture and Livestock, Pakistan
Production000 Tonnes
Production 000 Tonnes

Graph 8
14. Achievement in all the three provinces and in all three operational dimensions sharply surpasses the targets set by the MINFAL. Target fixing is a ritual regularly followed by the Government to set a high bench mark for the growers to reach without any control over the factors of production or without provid-ing conducive environment. The system of estimation is rough and as such, cannot be accepted as reli-able. Area under sugarcane crop in the country was expanded to 1050.8 thousand hectares against tar-get of one thousand hectares. Sugarcane production rose to 52.585 million tonnes while the target was 45.635 million tonnes. Yield was higher at 50.0 tonnes/hectare against the target of 46.02 tonnes/hectare.
15. Over achievement of the targets, underscores the system of estimation as being skewed and weak. Deviations need not be beyond the standard, admitted at five percent. Appropriate comparison in this background would have to be the actual for the previous season. What was achieved in the 2002-2003 compared with the preceding season also gives similar reading.
16. As a consequence, the sugar industry cannot plan its working on sound track. Such an ad hoc system, if not uncertain and un-secure cannot give well measured. Sugar industry has as such fallen prey to uncertainties.
2.4 Marketing of Sugarcane
17. A mini field survey was conducted for this study to know the first hand information of sugarcane market-ing because three years ago farmers faced problem of payments from the sugar mills which are still pending and government has intervened to solve the problem. Unfortunately, farmers are now reluctant to grow sugarcane. Farmers normally sell their sugarcane directly to sugar mills rather than contractor or middleman. However, there are several small farmers, who sells their crop to middleman due to the misbehavior of factory representative/cane clerk because they demand Rs. 100/200 as bribe for accept-ance of sugarcane. Sometime farmers prefer to sell crop to middle man to avoid such kind of corruption even though middleman gives low price but deal in polite manners. Mills start crushing (almost on 15 to 20 November) and mill administration gives out the permits to farmers. In the mean while farmers also start harvesting of sugarcane to supply it on daily basis. So no time period is required
Provincial Shares Area of Sugarcane
Punjab, 1663, 66%
Sindh, 598, 24%
NWFP, 255, 10%
Punjab
Sindh
NWFP
Provincial Shares in Production of Sugarcane
Punjab, 31313, 64%
Sindh, 11616, 24% Punjab
Sindh NWFP
NWFP, 5805, 12%
Table 6 Provincial shares in Area and Production of Sugarcane Average of 2000-01 to 2002-03
Area Production Country/ Province Hectares in
000 Acres in 000 Percent (%) 000 tonnes Percent (%)
Pakistan 1019 2518 100 47769 100 Punjab 673 1663 66 31313 66 Sindh 242 598 24 11616 24 NWFP 103 255 10 5805 10 Source: Agricultural Prices Commission.
25

for marketing. However, if a sugarcane trolley/truck stays outside the mill for one week, it looses 25 to 30 % of its weight. At the same time, mill authorities habitually deceive the farmers through their tricky weigh bridges. In this way, farmers lose another 10 % of sugarcane.
18. Sugarcane is not a profitable crop. Sometime it hardly covers input cost but all the time there is no otheroption. Farmers are not cultivating sugarcane on 100 % land and just growing on 50% or less than50 % area. Cultivation of sugarcane is an arduous activity that takes almost eighteen months for proper growth of the sugarcane crop. The cost of cultivation per acre is Rs19,000 and it is sold at Rs 26,000. The profit of Rs 6000 in sixteen months is not sufficient enough a reason to cultivate sugarcane. On top of it small growers were deceived at various stages, told the growers. Mill owners keep growers waiting for weeks outside the factory before offloading the sugarcane. This tedious and deceitful process that reduces the size of the crop and as a consequence, tells heavily on the growers. Similarly, growers in general and small growers in particular, voiced their reservations about the weighing processes. Growers feel that administration of sugar mills discriminate in this process by using unfair practices (field survey and consultation meeting).
19. The price of sugarcane is fixed by the Government. Mills pay the price according to the flow of supply. There is no payment schedule. In case of excessive production of sugarcane, mill administration cre-ates trouble for small farmers and don't issue permit easily. If one is a big land holder and bit influential, he would get his money within fifteen days otherwise the process of payment takes at least one month. In the days of shortage, they pay immediately to the farmers otherwise they give money within a month or 1 ½ month and release the payments to farmers/growers in the form of Cash Price Receipt (CPR) not cash. Whenever sugarcane production decreases, mill authorities pur-chase sugarcane from middleman at high price but they don't like to purchase it from farmers. The situation may be different in coming years because sugarcane production is already decreased and mill administration is going around and requesting to the farmers for sugarcane supply. If the price remains the same and the administration of mill does not change their behaviors then sugarcane production willreduce up to 40 %, within next two or three years. Growers demanded that if the mills cannot pay the cash price then they should release the payments, at least within a week (field survey 2004)
20. In consultation meeting grievances of small farmers were more evident. Their representatives from NWFP, Sindh and Punjab unanimously castigated manufacturers for paying low prices in comparison to the big landholders. Big farmers, representatives of the sugarcane growers told the participants that they got Rs 70 per mound whereas small farmers were offered Rs 35 in 2002-03. In the year 2003-04 official price was Rs 45 per mound but small growers could hardly fetch Rs 35 (consultation meeting)
21. Mill owners often give the impression that they provide financial help to the growers to cultivate sugar-cane. Delegates from Sindh categorically denied this impression. Sugar mill owners, according to them, charge interest on each penny they provide to the growers for sugarcane crop. Twenty years ago, mills were involved in training but now they don't provide any kind of training/guidance. Fertiliser, seeds and medicines, credit were granted by the mill authorities and later on they got 14 % interest on actual money. Generally farmers are not getting any financial support from the industry. Soft term loans were granted to the farmers and the money was deducted from next year's CPR but now there is nothing except business dealing and exploitation. Sometime mills experts visit farms to provide guidance in sowing, application of Fertilisers and pesticides. Few mills have set up a laboratory to keep the crop friendlyworms. Mill administration opposes the spray of pesticides/insecticides and provides crop friendly worms to control the diseases. Farmers have no knowledge about the WTO trade regime (field survey and consultation meeting).
2.5 By-Products of Sugar
22. Proper utilization of the by-products is necessary for the development of the sugar industry. The cost of sugar production is continuously growing, due to non- utilization of the by-products. If the by-products are properly utilized, the cost of production of sugar may go down by 20% to 25%. The mainby-products of the sugar industry are:
26

27
A. MOLASSESB. BAGASSEC. FILTER CAKE OR PRESS MUD
23. Besides sugar, the industry produces molasses, industrial alcohol which is exported and earns handsome foreign exchange. Sugar industry by its strategic placement in rural heartland is the best suited fordevelopment and growth. Bagasse is used in electricity generation on which sugar plants operate and are in a position to provide power to national grid network in winter season when hydel power genera-tion capacity tends to trim. Bagasse is also used in making of paper and boards, latter having multiple uses as packing material. Medium fibre density wood is also being manufactured by putting into service improved technology of utilizing bagasse. Molasses is uncrystallised syrup extracted from raw sugar during the refining process. Globally, about 75% of molasses is obtained from sugarcane (Saccharum officinarum) and the remainder comes from sugar beet (Beta vulgarise), citrus fruits, corn and sorghum.
24. Availability of molasses in Pakistan has increased from 1.330 million tonnes in 1992-93 to 2.1 million tonnes in 1998-99. It decreased to 1.397 million tonnes in 1999-2000 due to decline in Sugar productionin the country and again increased to 2.004 million tonnes in year 2002-2003. As the commercial utiliza-tion of molasses in the country is very limited, major portion of the commodity is exported. The export ofmolasses has remained between 1.029 million tonnes to 1.835 million tonnes.

CHAPTER THREE: DOMESTIC AND WORLDBALANCE SHEET OF SUGAR
3.1 Domestic Demand and Supply Position
1. In Pakistan, almost 99% sugar is extracted from sugarcane. Sugar production has increased since 1987-88 except for a couple of years to reach the peak of 4.0 million tonnes during 2003-04. Beet and sugarcane production has been 3.226 million tonnes (2001-02), 3.684 million tonnes (2002-03) and 4.02million tonnes (2003-04). Sugar production of the last three years on average at 3.61million tonnes gives an operational efficiency of about 77%, leaving 23% idle capacity (Ministry of Industries). The sugar production capacity of these mills is above five million tonnes of sugar. The mills require about 65 million tonnes of sugarcane to run on full capacity. There exits a mill to-mill competition for acquiring more sugarcane (Farming Outlook).
2. Pakistan was a sugar importing country as demand outstripped supply for almost every year. However, situation has since changed. Country produced surplus sugar, which has created huge closing stocks from year 2000 to 2003 ranging from 600,000 tonnes to 700,000 tonnes. The production, import, export and consumption trends from 1998-99 to date are given in Table-7.
3. During the last season (2003-04), sugar industry rolled out record sugar output at 3994 (3677) thousandtonnes in (2002-03), increased up to 8.70%, showing higher efficiency of sugar production. Opening stocks as of 1st October 2003-04 were 759.3 thousand tonnes, while small quantity of special sugar i.e.7.6 thousand tonnes had also been imported in to the country. Hence total availability of sugar, includingdomestic production, carry over inventory and imports remained at 4761.3 thousand tonnes (Ministry of Industries).
4. The domestic balance sheet proves that Pakistan has never been a regular exporter however, it imported sugar regularly. Size of the industry shows that potential is there but viability of sugar industry depends on several other reasons like availability of sugarcane, cost of sugar production, export opportunities viz a international sugar trade regime.
3.2 Recovery Level
5. Table-8 depicts the trend of cane production, cane available for sugar industry, sugar production and recovery of sucrose contents. The Graph Given below interprets the table no. 8.
28
Table 7. Domestic Balance Sheet of Sugar (000 tonnes)
Years Opening Stocks
Production Imports
Total Availability
/Supply
Domestic Consumption Exports Carry over
Stocks
1998-99 513.0 3542.0 04.0 4059.0 3040.0 648.0 371.0 1999-00 371.3 2429.0 421.0 3221.3 3171.9 22.2 27.2 2000-01 27.2 3016.0 633.0 3676.2 3054.4 - 621.8 2001-02 620.8 3249.0 27.5 3897.3 3252.1 8.0 637.2 2002-03 637.1 3677.0 9.0 4323.1 3482.8 81.0 759.3 2003-04 759.3 3994.4 7.6 4761.3 3812.8 121.5 827.0
Source: Pakistan Sugar Mills Association Annual Reports. (Figures are rounded off). Agricultural Prices Commission Sugar Policy 2004-05. Ministry of Industry for 2003-04
29
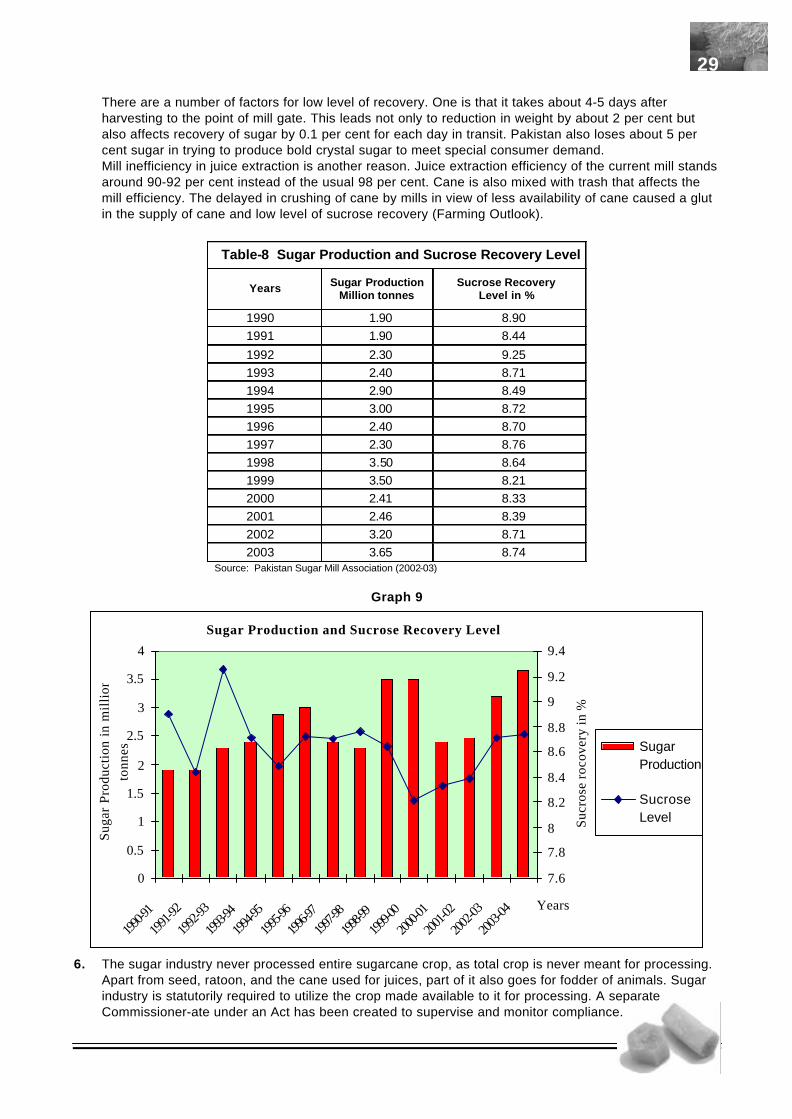
There are a number of factors for low level of recovery. One is that it takes about 4-5 days afterharvesting to the point of mill gate. This leads not only to reduction in weight by about 2 per cent but also affects recovery of sugar by 0.1 per cent for each day in transit. Pakistan also loses about 5 per cent sugar in trying to produce bold crystal sugar to meet special consumer demand.Mill inefficiency in juice extraction is another reason. Juice extraction efficiency of the current mill standsaround 90-92 per cent instead of the usual 98 per cent. Cane is also mixed with trash that affects the mill efficiency. The delayed in crushing of cane by mills in view of less availability of cane caused a glut in the supply of cane and low level of sucrose recovery (Farming Outlook).
Graph 9
6. The sugar industry never processed entire sugarcane crop, as total crop is never meant for processing. Apart from seed, ratoon, and the cane used for juices, part of it also goes for fodder of animals. Sugar industry is statutorily required to utilize the crop made available to it for processing. A separate Commissioner-ate under an Act has been created to supervise and monitor compliance.
Sugar Production and Sucrose Recovery Level
0
0.5
1
1.5
2
2.5
3
3.5
4
1990-9
1
1991-9
2
1992-9
3
1993-9
4
1994-9
5
1995-9
6
1996-9
7
1997-9
8
1998-9
9199
9-00
2000-0
1
2001-0
2
2002-0
3
2003-0
4 Years
Suga
r Pr
oduc
tion
in m
illio
n to
nnes
7.6
7.8
8
8.2
8.4
8.6
8.8
9
9.2
9.4
Sucr
ose
roco
very
in %
SugarProduction
SucroseLevel
Table-8 Sugar Production and Sucrose Recovery Level
Years Sugar Production Million tonnes
Sucrose Recovery Level in %
1990 1.90 8.90 1991 1.90 8.44
1992 2.30 9.25 1993 2.40 8.71 1994 2.90 8.49 1995 3.00 8.72 1996 2.40 8.70 1997 2.30 8.76 1998 3.50 8.64 1999 3.50 8.21 2000 2.41 8.33 2001 2.46 8.39 2002 3.20 8.71 2003 3.65 8.74
Source: Pakistan Sugar Mill Association (2002-03)

Under-utilization of capacity by sugar industry is due to crop size. In order to improve capacity utilizationthere is need to accelerate sugarcane production, so as to attain optimum utilization of the existing capacity (Iskandar M Khan, former Chairman, PSMA). But that is in the realm of wishful thinking.
7. New sugar mills were mushrooming, mostly by the same sponsors. Against only two small units in 1947,as many as 76 today (29 units) were established in the last decade at an exponential rate. The installed capacity of 10,000 metric tonnes at the time of independence has increased by now to 355,150 metric tonnes. Some companies are so fond of making losses that they work hard to increase them every year.There is no known method where any industry, having over 45% excess capacity and not being able to compete in the export market because of much higher cost of production, can be made viable and prof-itable. The patronage and of mushrooming of the sugar industry by very influential and resourceful peo-ple suggests that the poor health of the industry is on account of excess capacity created for political considerations to bribe crony capitalists.
8. There are various reasons for high cost of production in Pakistan. Besides the low recovery and ineffi-ciency of processing, the byproducts such as molasses and cake are not properly utilized. Further, the extra power generated by the mills is not supplied for domestic or commercial use (Dr. Umer Khan).
9. In favorable years, there is more sugar production than the requirements and in adverse years the country falls short of target figures in imports. The government of Pakistan takes care to ensure stable per kg price to the consumer by regulating duty structure while there is no ban on export of sugar. The problems arise in case of surplus or short production of sugar in the country. In case of surplussituation, such as during 2001-02 and 2002-03, the competition in the international market, including India did not allow export because of high cost of production. The ex-mill price of sugar in Pakistan is around Rs 18-19 per kg compared with Rs. 12-14 per kg in the international market. Thus, stocks build up with mills.
3.3 Consumption of Sugar
11. During 1962, the total domestic consumption of sugar was 0.162 million tonnes, which increased to 1.76million tonnes in 1987, and 3.484 million tonnes in the year 2003. Per capita consumption of sugar was 3.4 kg in 1962, which increased to 17.5 kg in 1987 and 23.85 kg in the year 2003. Trend of per capita domestic consumption of sugar as well as GUR is given in Table-9. The graph below indicates that consumption by sweetshops, bakeries and sugar confectionary industry is more than per capitaconsumption of individuals.
12. Up to 1983, per capita consumption of sugar was low mainly due to rationing while consumption of GURwas high. De-rationing of sugar in 1983 resulted in a steep rise in the per capita consumption of sugar. It increased to 17.5 kg. in 1987 from 9.1 kg. in 1980. The consumption of GUR decreased simultane-ously to 11.1 kg. At present, the consumption of sugar is 23.85 kg. and that of GUR 1.39 kg. per capita. On the basis of per capita consumption, the monthly requirement of sugar in the country is around 296.758 thousand tonnes to 300.000 thousand tonnes. Sugar production during last three years exceeded domestic demand. After meeting domestic demand, it was left with a surplus of 637.149 thousand tonnes in 2001, 759.103 thousand tonnes in 2002 and 759.000 thousand tonnes in 2003. However, sugar industry has been unable to export the surplus sugar due to the very high cost of its production. Though the sugar production trend can be termed exciting however, it has not reached the desired level of scale of economies. This is mainly due to under utilization of the installed production capacity (Ministry of Industries).
30

Graph 10
13. Trend forecast per capita sugar consumption comes to 22.08 kgs in 2003-04 accordingly, domestic requirements for 2003-04 for a mid year population of l48 million (as on 1 April 2004) work out to 3.812 million tonnes. In view of the foregoing supply and demand situation, the country would have substantialsurplus stocks of sugar.
14. Sugar availability not simply persisted in excess but bounced to set a new record, due to consistently carryover of surplus for the past three years, its impact in terms of steep fall in sugar prices and increased financial cost of carrying higher inventory for a long period, pushed cost of sales up.
15. In consultation meeting, representatives of the sugar mills were bitter about the inconsistent policies of the government. The government of Pakistan, without taking growers and manufacturers intoconfidence, wastes no time in importing sugar. Similarly, without much consideration, state machinery is eager to control sugar price, which is not an essential food item. Surge in the sugar prices would decrease its consumption, which again was a positive sign for the general health of the people, maintained sugar mill owners. Anxiety about the sugar price hike is baseless, was the chiefargument of the manufacturers. Sugar producers solicited that the government ought
Table-9 Per Capita consumption of Sugar
Total Domestic Consumption of Sugar
Per Capita consumption
of Sugar
Per Capita consumption of Gur
Per Capita* Sweetener
Consumption
Years
(Million tonnes) (kg.) (kg.) (kg.) 1962 0.162 03.40 18.00 21.40 1970 0.455 07.60 24.70 32.30 1980 0.744 09.10 23.90 33.00 1987 1.764 17.50 11.10 28.60 1990 2.200 19.90 08.70 28.60 1995 2.722 21.86 06.64 28.50 2000 3.236 22.69 03.66 26.35 2001 3.050 21.38 04.54 25.92
2002 3.252 22.28 02.42 24.70
2003 3.554 23.85 01.39 25.25
Note:* Per capita sweetener is consumed by sweet shops, sugar confectionaries and bakeries Source: Pakistan Sugar Mills Association Annual Reports
Per Capita Consumtion of Sugar
0
5
10
15
20
25
30
35
1962
1970
1980
1987
1990
1995
2000
2001
2002
2003 Years
Kgs
Per Capita consumption ofSugarPer Capita consumption ofGurPer Capita SweetenerConsumption
31
to change its mindset concerning sugar sector because of its forward and backward linkages (Consultation Meeting).
3.4 Domestic Price Situation
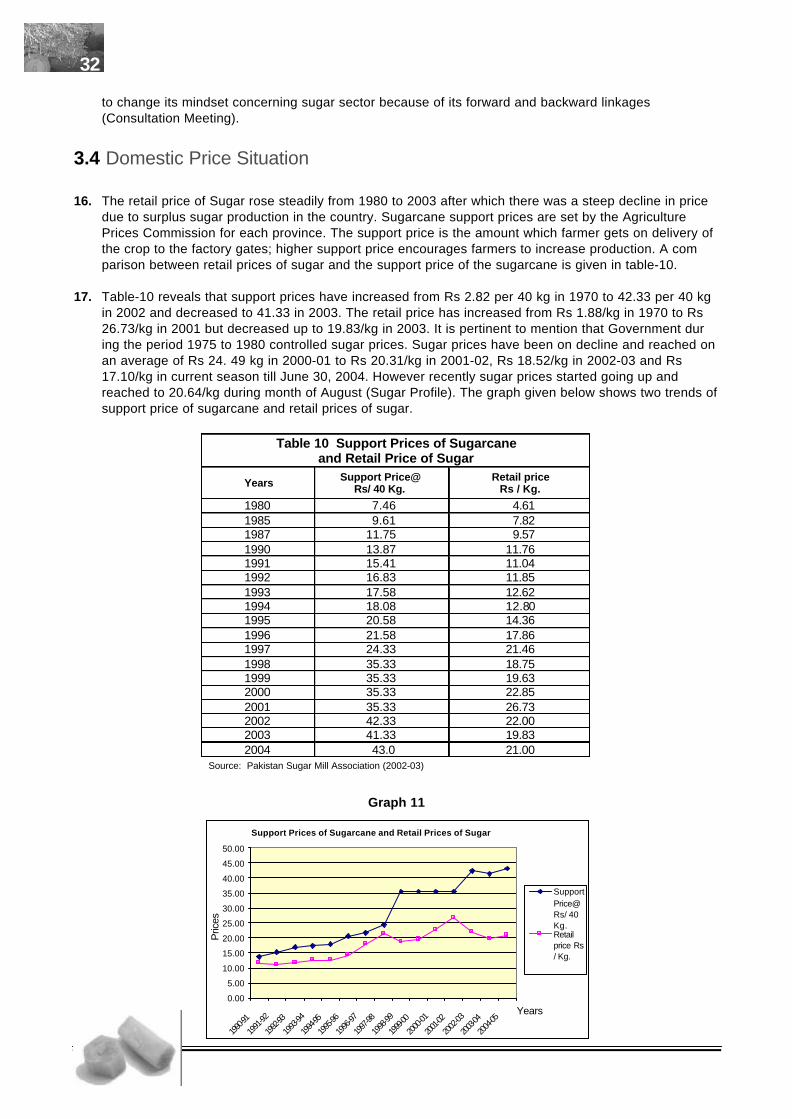
16. The retail price of Sugar rose steadily from 1980 to 2003 after which there was a steep decline in price due to surplus sugar production in the country. Sugarcane support prices are set by the Agriculture Prices Commission for each province. The support price is the amount which farmer gets on delivery of the crop to the factory gates; higher support price encourages farmers to increase production. A comparison between retail prices of sugar and the support price of the sugarcane is given in table-10.
17. Table-10 reveals that support prices have increased from Rs 2.82 per 40 kg in 1970 to 42.33 per 40 kg in 2002 and decreased to 41.33 in 2003. The retail price has increased from Rs 1.88/kg in 1970 to Rs 26.73/kg in 2001 but decreased up to 19.83/kg in 2003. It is pertinent to mention that Government during the period 1975 to 1980 controlled sugar prices. Sugar prices have been on decline and reached onan average of Rs 24. 49 kg in 2000-01 to Rs 20.31/kg in 2001-02, Rs 18.52/kg in 2002-03 and Rs 17.10/kg in current season till June 30, 2004. However recently sugar prices started going up and reached to 20.64/kg during month of August (Sugar Profile). The graph given below shows two trends ofsupport price of sugarcane and retail prices of sugar.
Graph 11
32
Table 10 Support Prices of Sugarcane and Retail Price of Sugar
Years Support Price@ Rs/ 40 Kg.
Retail price Rs / Kg.
1980 7.46 4.61 1985 9.61 7.82 1987 11.75 9.57 1990 13.87 11.76 1991 15.41 11.04 1992 16.83 11.85 1993 17.58 12.62 1994 18.08 12.80 1995 20.58 14.36 1996 21.58 17.86 1997 24.33 21.46 1998 35.33 18.75 1999 35.33 19.63 2000 35.33 22.85 2001 35.33 26.73 2002 42.33 22.00 2003 41.33 19.83 2004 43.0 21.00
Source: Pakistan Sugar Mill Association (2002-03)
Support Prices of Sugarcane and Retail Prices of Sugar
0.00
5.00
10.00
15.00
20.00
25.00
30.00
35.00
40.00
45.00
50.00
1990-9
1
1991
-92
1992-9
3
1993
-94
1994-9
5
1995
-96
1996
-97
1997
-98
1998
-99
1999-0
0
2000
-01
2001-0
2
2002
-03
2003-0
4
2004
-05Years
Pric
es
SupportPrice@Rs/ 40Kg.Retailprice Rs/ Kg.

18. The support price of sugarcane has been on the quantity of cane and not on the quality of cane. This leads to spreading of cane varieties with more weight and low recovery. To offset this, the government introduced a quality premium system in 1994. Under this system if the average recovery of mill stands above bench mark, recovery of 8.5 percent in the Punjab and 8.7 percent in Sindh), the grower waseligible for an additional amount at rate of Rs.0.27 for 1994-96, 0.32 for 1996-97 and 0.50 for in 1997-2002 per 40 kg of cane recovery. 0.1 per cent increase over and above the bench mark recovery. However, this system has not worked. The payment cane on the basis of weight also encouragedplanting of some imported cane varieties like COJ 1148 in the Punjab, which had low recovery. The Government has considered linking of sugarcane price with recovery and to do away with the support price system in sugarcane crop. But this system has yet to be finalized (Farming Outlook).
19. Sugarcane support price is fixed by the government, on average constituting 65 to 77 per cent of the production cost. Similarly, wages, utilities and other costs of production process have been about 16 percent. Variable costs aggregate to 87 per cent and this 'minimum' is determined by the government while the industry has no say in it. Sugar industry claims that price fetched by the industry could not cover costs of production and as a result, sugar industry stands devastated despite its sterlingperformance evinced by production trend. Sugar industry seeks either free market for both cane and sugar, or price support for both. It is absolutely inappropriate to fix price of raw material, leaveend-product free and place them diametrically opposed! Due to this sugar industry has become oppressed, to say the least. Statutorily, sugar industry is required and compelled to process entire cane crop available. The industry's demand for flexibility to process sugarcane volume to the extentproducing sugar adequate for domestic demand is yet to receive consent (PSMA-SZ Report).
20. By applying dynamics research and development in sugarcane crop, yield could have been doubled and that would have given maximum utilization of the capacity and emerging economies of it could haveovercome the problems now being faced. Expansion in sugarcane processing capacity was carried out with reasonably fair projections. Sugarcane crop yield trailing behind candid estimations prevented sugar industrial potentials from a fine flourish.
3.5 Cost of Sugar Production
21. Cost of sugar production represented a rising trend. The major critical component in it has been the price of sugarcane, compounded by effective high at 18% rate of sales tax. On these counts, the sugar industry had no control to contain cost of production. Sugarcane price influence on the cost of sugar production and trend of wholesale price of the sugar vis-à-vis its adverse influence on economic viabilitycan be gauged from the representative data of the past six years. Cost of sugar production per tonduring the past five years, 1997-98 to 2002-2003, ranged from Rs.11,467 to Rs.20,332 i.e. an average increase of 12.88%. In the same period, cost of sugarcane fluctuated from Rs. 9.09 to Rs. 11.68, an average increase by 5.69%. Cost of other components in sugar production could be contained by the sugar industry to a limited extent due to various factors, including inflationary trend in the nationaleconomy (PSMA-SZ Report).
Table –11 Cost of Sugar Production Analysis AVERAGE %
A. VARIABLE COST (RS IN 000) Raw material consumed 879,899 78 Stores consumed 22,890 Total (A) 902,789 80.7
B. FIXED COSTS (RS. IN 000) Manufacturing Expenses 146,793 13.1 Admin and Selling Expenses 42,246 3.7 Financial charges 26,932 2.4 Total (B) 215,971 19.3 Total (A+B) 1,118,760 Molasses sales / transfer 49,992 Total cost 1,068,768
Average production of 8 selected units 67,835 Cost of production/ ton 15,755
Source: Pakistan Sugar mills Associations.
33

22. Average wholesale sugar price excluding sales tax was in the ranged between Rs.14,840 to Rs.20480 per ton. However, the price has registered steep declining trend as can be seen from the given figure. Fall in prices escalated and in three years at a stretched dropped from Rs.20,480/ton of 2000-01 to Rs.15,510/ton for 2002-03 by Rs.4.970/ton. The rising cost of production which was contrasted by plummeting prices of sugar proved awful, disastrous situation. Sugar industry's distress, based on analysis, is attributable to high incidence of sugarcane price in cost of sugar production plus high incidence of sales tax, besides deterrent to proportionate compensatory increase in prices of sugar to absorb such spirals. Representatives of sugar industry argue that as a result, the sugar industry suffered a lot. They suggest that sugar industry's sustainable economic performance depends on sugarcane price, its linkingwith sugar price and supportive mechanism to sustain fairly integrated functioning. Sugar price ought to reflect a proportionate increase in line with cost of production instead of suppressing it by excessive inventory afloat and hanging sword of imports at lower tariffs. If it is not to the government liking, sugar-cane price can be brought down proportionately enabling sugar industrial economies operate on equi-table basis. Sugar production costs during 2003 have been estimated on the basis of average cost of eight selected Sugar Mills in the three provinces (PSMA-SZ Report). These estimates are presented in Table-11.
23. Based on the average figures of 8 major units, the ex-factory average cost of production is around Rs 15,755/tonne or Rs 15.755/kg. Variable cost accounts for 80.6% of the total cost of production (before molasses sale), while fixed cost is only 19.3% (PSMA-SZ Report)
24. Average cost of per ton sugar production, collected from mills, during the survey is different then that of collected through secondary source like PSMA-SZ. Main cost element is sugarcane price. Any change regarding in-put price affects the sugar cost ultimately. It is now Rs. 18000/ton excluding government taxes for the year 2004 but it may increase in the next year while Mill gate price increase further. Brazil is producing sugar at 6 rupees/kg while Thailand producing at 11 rupees/kg, comparing to these suppli-ers, it is not possible for Pakistan to compete in the international market.
25. Manufacturers suggested measures to minimize the cost of production to remain competitive in interna-tional markets. 1) To decrease sugarcane price, government should pay attention on the improvement ofquality of the crop, through increase in sugarcane yield. 2) Agriculture department should introduce new varieties of sugarcane with more sugar contents and lesser weight. This would lead to reduce produc-tion cost of sugar and the industry would be able to remain competitive in international markets. 3) Water is an expensive source and off course is life line for agriculture. Government should initiate a project for land leveling because in Sindh, canal and fields levels are different from each other. Pavement of water channels will lead to development of agri-economics. 4) Government should allocatefunds for research and development especially for biological control as well as subsidy on Fertilisers.
34

3.6 Excise & other taxes
26. Table 12 shows the average excise duties in last three decade.
27. The government from an excise duty on sugar production derives substantial revenues. The manner in which this duty has been applied has varied over time. Originally a levy on actual production was charged in 1966 on production capacity of each mill. Later on the Central Board of Revenue on the basis of an average recovery rate determined it for each Province and a 160-day crushing period. In 1978 the duty was charged again on actual production. Sales tax is imposed on sugar @ 15% on pre-vailing selling price since November 1999. Before that sales tax was imposed @ 15% on Rs 13,000 perton, a price fixed for this purpose which was raised to Rs 14000 per month afterwards.
3.7 Import Duties and Restrictions
28. Up to early 1980s, only Government could import sugar and imports were made through Trading Corporation of Pakistan. In 1983, sugar was placed on the "free list" of importable commodities and the private sector allowed to import directly. At the same time, the government imposed a prohibitive import duty of Rs 6.50 per kilogram on refined sugar. The import duty on sugar was subsequently reduced to Rs 5 per kilogram in July 1985 and Rs 4 per kilogram in February 1986. The government sought to encourage imports by the private sector in order to alleviate upward pressure on domestic sugar price due to production falls. Private importers are currently required to register with Chief Controller, import and exports, who issues licenses, which enable them to apply to the State Bank of Pakistan for foreign
exchange. Details of import duty are depicted in table 13.
35
Table 12 Excise and Other Taxes on Sugar Industry
Year Excise duty Rs/Kg Sales Tax
1970 0.28 - 1971 0.28 - 1974 0.82 - 1976 1.35 - 1982 2.15 - 1985 2.15 - 1986 2.15 - 1992 2.15 - 1995 2.15 - 1996 2.10 - 1997 2.10 - 1998 0.40 12.5% 1999 0.15 15% 2000 - 15% 2001 - 15% 2002 15% 2003 15%
Source: Sugar Profile Ministry of Industries

3.8 World Supply, demand, stocks and trade
29. The data on world balance sheet of sugar (raw equivalent), for the period of 2001-02 to 2003-04 arepresented in Table 14. World sugar production during 2002-03 is estimated at 147.91 million tonnes an alltime record and 10.47 million tonnes (7.62 percent) more than that of 2001-02. Accounting for openingstocks of 62.79 million tonnes, global supply of sugar in 2002-03 was reported at 210.70 million tonnes, upby 12.19 million tonnes (6.14 per cent) over the corresponding supply of 198.51 million tonnes in 2001-02.The world consumption reported at 141.55 million tonnes in 2002-03 is 6.59 million tonnes (4.88 per cent)higher than that of previous year. End year stocks in 2002-03 are estimated to have increased to 64.58 mil-lion tonnes. International Sugar Organisation has forecast global production of sugar in 2003-04 at 146.99million tonnes, and consumption at 145.62 million tonnes. End year stocks are projected at 64.51 milliontonnes.
36
Table 13: Sugar Imports Duty Structure
NATURE OF DUTY TOTAL DUTY DATE FROM DATE UP TO
Zero duty 0 - 17.10.90 5% Iqra, 10% import surcharge 15 18.10.90 28.01.91 5% Iqra, 10% import, 10% custom duty 20 29.01.91 06.05.91 5% Iqra, 10% import, 10% custom duty 25 07.05.91 23.09.91 5% Iqra, 10% import 15 24.09.91 26.1.91 5% Iqra, 10% import, 10% custom duty 25 27.11.91 6.01.92 5% Iqra, 10% import, 20% custom duty 35 27.01.92 17.08.92 5% Iqra, 10% import, 15% custom duty 30 18.08.92 30.06.93 5% Iqra, 10% import, 5% custom duty 20 01.07.93 28.08.93 5% Iqra, 10% import 15 29.08.93 08.09.93 5% Iqra, 10% import, 15% custom duty 30 09.09.93 30.06.95 10% Iqra, 15% import 25 01.07.95 24.07.95 Zero duty 0 25.07.95 30.06.96 10% custom duty 10 01.07.96 19.08.97 10% Regulatory, 10% custom duty 20 20.08.97 31.03.99 35% Regulatory, 10% custom duty 45 01.04.99 22.05.2000 25% custom duty 25 23.05.2000 13.07.2000 15% custom duty 15 14.07.2000 17.06.2001 10% custom duty 10 18.06.2001 16.09.2001 20% custom duty 20 17.09.2001 29.11.2001 30% custom duty 30 30.11.2001 13.06.2002 25%custom duty 25 14.06.2002 To date (2004)
Table-14: World Balance Sheet
S.No. Item 2001-02 Actual
2002-03 Estimated 2003-04 Forecast
Million Tonnes 1. Opening stocks 61.07 62.79 64.58 2. Production 137.40 147.91 146.99 3. Total supply (1+2) 198.51 210.70 211.57 4. Disappearance (consumption) 134.96 141.55 145.62 5. Stock Adjustment * (-) 0.76 (-) 4.57 (-) 1.44 6. Ending stocks (3-4+5) 62.79 64.58 64.51 7. Trade (export) 39.84 40.77 41.30 8. Trade (import) 39.08 40.02 39.86

3.9 International Prices
30. As evident from the graph and table no. 15 that International Sugar prices are unstable because the world sugar market is "thin". There are relatively small number of buyers & sellers. Any change in demand & supply position of a country has an immediate effect on International Sugar prices. Brazil a major sugar producer having 28.7% share in world sugar exports, play a vital role both in the event of surpluses or shortages of sugar. Table-15 depicts sugar prices from 1960 to 2003. During last 40 years, there have been two "roller coaster" price movements. The first peak occurred in 1974 when prices averaged US$ 653.9/ton and declined to US$ 172.0/ton by 1978. The second peak occurred in 1980, when prices reached to US$ 632.0/ton and then fell to US$ 90.2/TON IN 1985. The downward trend after 1980 was due to increasing world stocks as consumption increased at slower rate then the produc-tion increased. After 1985 world international prices remained between US$ 200 to 397 US$ / ton (Sugar Profile). The graph indicate that sugar prices were valatle through out from 1960 to 2003.
Graph 12
Table-15 International Prices of Sugar
International Sugar Prices Per Tonne
Year US $ Year US $
1960 69 1991 296
1963 183 1992 273
1964 127 1993 282
1965 45 1994 346
1969 71 1995 397
1972 160 1996 367
1973 208 1997 315
1974 653 1998 255
1976 255 1999 200
1979 213 2000 221
1980 632 2001 241
1984 115 2002 205
1985 90 2003 214
INTERNATIONAL PRICES OF SUGAR IN ($US)
0
100
200
300
400
500
600
700
1950 1960 1970 1980 1990 2000 2010
Years
Pric
es
Prices US $
37

CHAPTER FOUR: THE INTERNATIONAL SUGAR POLICIES.
1. Protection is a major problem in sugar trade. The world sugar market has long been recognized as one of the most distorted global commodity markets. It is the disruptive policies of the European Union (EU),the United States (US) and Japan that cause most of these distortions. Policies offer very high rates of protection to domestic producers by imposing severe import restrictions and by providing othermeasures such as export subsidies or production quotas designed to help raise domestic prices above the world price. And it's on the rise and very damaging to exporters. The level of trade protection has risen in recent years as the world price of sugar has fallen.
2. Protection is much higher than for most other agricultural commodities. Recent work using the Global Sweetener Markets model reveals that nominal levels of protection have climbed to around. 400 per-cent in Japan (compared with around 160 per cent for agriculture on average); 225 per cent in the EU (compared with around 67 per cent for agriculture on average); and 150 per cent in the US (compared with around 30 per cent for agriculture on average). Were all protection removed by 2012, model resultsindicate that the world price would increase by around 60 per cent relative to the average world price of the last four year, rising from around US 6-8c/lb to US 11.5-13.5c/lb. Protection costs efficient sugar exporting nations dearly, making it the single biggest issues confronting exporters.
3. Various policy instruments are used to achieve the high levels of protection. Instruments include quotas and tariffs which limit market access, domestic supports that increase producer prices and export subsi-dies that allow producers in protected countries to dump surpluses on the world market. In many cases these instruments work together to raise producer and consumer prices, although some are operated relatively independently.
4.1 EU Sugar Policies
4. The European Union (EU) is the largest exporter of white sugar in the world, accounting for 30% of 1997/1998 world exports. The EU has been providing high level of support to its sugar sector among all the member countries of the World Trade Organization (WTO). The EU uses export subsidies (export refunds) to bridge the gap between the high internal EU market price and the significantly lower world market price. The EU internal market is insulated from the world sugar market through a system of import duties and export refunds. The Common Market Organization (CMO) of sugar supports producer prices at levels above world market prices, stimulating production in the EU and resulting in exportable surpluses.
5. According to Huan-niemi and Minna, EU has been distorting trade flows by subsidizing the disposal of sugar surpluses to the world market.
6. The Uruguay Round Agreement on Agriculture (AoA) has established a set of completely new and oper-ational rules for agriculture in order to reduce agricultural export subsidies, create new rules for agricul-tural import policy, shift domestic support of agriculture away from practices that affect production and trade flows, and agree on disciplines for sanitary and phytosanitary trade measures. The AoA imple-mented over a six-year period ended in marketing year 2000/2001. As a follow-up to the Uruguay Round, a new round of trade liberalization negotiations was launched under WTO regime in March 2000for agricultural trade. The Next WTO Round will likely increase market access and affect further reduc-tions in the AoA commitments for export subsidies and domestic support (Huan-niemi and Minna).
7. The EU had made the following commitments under the Uruguay Round Agreement on Agriculture (AA) for sugar from marketing year 1995/1996 to 2000/2001:
? to convert variable import levies into binding standard tariffs, to reduce by 20 percent these standard tariffs over a period of 6 years, and to impose additional duties by invoking the "Special Safeguard Provisions;"
38

? to maintain current access for sugar imports at 1.3 million tonnes (white sugar equivalent) from the African, Caribbean Pacific (ACP) countries and India and 82,000 tonnes (white sugar equivalent) of MFN sugar;
? to reduce the volume of subsidized sugar exports by 21 percent over a period of 6 years, excluding the "re-export" of ACP preferential sugar with export subsidies; and
? to reduce the value of export subsidies by 36 percent over a period of 6 years, excluding export subsi-dies given to the ACP preferential sugar is excluded (ISO, 1999).
4.1.1 Export subsidies
8. The EU's export subsidy commitments for sugar were calculated from a 1986-90 base period. Sugar included HS codes of 1701 (sugar), 1702 (other sugars including isoglucose), 2106 90 (flavoured or coloured sugar syrups), and chapter 20 (sugar added to products falling within this chapter). Thecommitments are only for the export of EU's A and B quota sugar 2. The commitments neither include the "re-export" of ACP preferential sugar (about 1.6 million tonnes per year) nor sugar exported asfood aid. The commitments do not cover C sugar (produced in excess of the A and B quotas) because itis exported to the world market without any export subsidies (ISO, 1999).
9. Sugar is classified into quota and non-quota sugar. Non-quota sugar is known as C sugar. The sugar regime provides for the reclassification from quota to C sugar and from C sugar to quota sugar. Sugar classified, as C sugar cannot be disposed of in the EC market. Brazil, Thailand and Australia particularlyconcerned at the subsidies provided by the EC for "C sugar" exports under the EC sugar regime. Underthe regime, producers of C sugar are able to sell C sugar on the world market at below the totalaverage cost of production through cross-subsidization of C sugar from quota sugar profits. By financingpayments on the export of C sugar, the EC exceeds its export subsidy reduction commitments under theWTO Agreement on Agriculture.
10. A production quota system was established to limit the total quantity eligible for price support. The EU sugar producers (growers and processors jointly) are responsible for paying the full costs to the EU Budget of surplus quota sugar disposal through the producer levies. There are two types of quota: A and B. The major difference between A and B quota sugar is the level of imposed producer levies. Only quota sugar can be sold in the EU and is eligible for price support through the intervention mechanism and export refunds (with the exception of "preferential sugar"). Sugar produced in excess of the A and Bquotas is called C sugar and cannot be marketed in the EU. C sugar has to be sold on the world marketwithout the support of export refunds. Thus, the quota system limits the supply of sugar in the EUinternal market (CAP MONITOR).
11. The EU uses export refunds (export subsidies) to bridge the gap between the high internal EU market price and the significantly lower world market price for EU manufacturers and traders to exportsurpluses of quota sugar (A and B). The export refunds apply not only to the main products covered by the sugar regime, but also to the export of processed products containing sugar. In practice, the EU's use of export refunds is the way in which it supports its domestic market prices for sugar, as it grantsrestitution on whatever quantity of sugar it judges to be surplus to internal needs. As a result, there is hardly any intervention buying in the sugar regime (NEI, 2000).
12. The required reduction in the volume of exports and budgetary outlays for export subsidies did not cause any difficulties for the EU at the beginning of the AoA implementation period. The requiredreduction of 338,520 tonnes in the volume of exports was not difficult at the beginning of theimplementation period because the actual level of exports by 1995 had already fallen considerably below the levels of the mid to late 1980s, which were the years used as the base period for reduction. However, the export subsidy commitments have become binding by the end of the AoA implementation period. In order to stay within the commitments, there is a cut in the total A and B sugar quotas. The total sugar production quotas for marketing year 2000/2001 were reduced by 498,800 tonnes from a total of 15,218,586 tonnes to 14,719,786 tonnes (DG AGRI, 2000).
39

4.1.2 Market access
13. The EU internal market is insulated from the world sugar market through a system of import duties and export refunds. Before the AoA, the EU fixed a minimum import price or threshold price for sugar. Sugarimports were charged a variable import duty equal to the difference between the CIF import price and the threshold price. Preferential sugar imports were exempted from this import duty. In practice, this sys-tem of variable import duties made the importation of non-preferential sugar financially unattractive. Consequently, there was hardly any importation of non-preferential sugar (NEI, 2000).
14. Under the AoA, the EU was obliged to replace the ad valorem import duties into fixed standard tariffs with a gradual reduction of standard tariffs by a total of 20 percent in six years. These standard tariffs were fixed at a high base level due to the methods of converting the equivalent of non-tariff barriers intofixed standard tariffs. In reality, the special safeguard provisions for sugar have been constantly in oper-ation since 1995 because of the low world market prices for sugar. The fixed tariffs and the additional import duties have made imports of non-preferential sugar uneconomic. Import tariffs for sugar are pro-hibitive (Michael Roberts). The AoA has not improved the market access for non-preferential sugar into the EU internal market, and thus, the EU has been able to prevent competition from imported sugar thatis outside its preferential trade agreement.
15. The minimum access provisions under the AoA had little implication for the EU as it was importing morethan 10 percent (well above the 5 percent requirement of the AoA by year 2000/2001) of consumption under its preferential trade agreement with the ACP countries and India. Therefore, the AoA commit-ments under minimum access have not increased sugar imports to the EU (Huan-niemi and Minna).
16. There is guaranteed access to the EU market for sugar from ACP countries and India. "Preferential sugar" is the term used to describe cane sugar imported under the provisions of Protocol No. 8 of the Lomé Convention from the ACP countries and the agreement with India. The Common Market Organization of sugar established minimum support prices for sugar guaranteed by an intervention pur-chase system.
4.1.3 Domestic Support
17. The EU was not required to reduce its internal price support specifically for sugar under the AoA because domestic support is measured as the Aggregate Measurement of Support (AMS), aggregated across all commodities and policy instruments. In other words, the total reduction of 20 percent over a period of six years for domestic support commitments refer to the total levels of support, but not to individual commodities. Overall, the sector wide domestic support for sugar has been high compared to the other agricultural commodities in the EU (Huan-niemi and Minna).
18. Implementation of the AoA in the sugar sector has not resulted in any major changes in the world sugar trade regime. Probably more important for the future of the EU's sugar regime has been the renewal until 2008 of the Sugar Protocol with ACP states and the progressively more stringent limits on the volume exports that the EU can export with the assistance of export subsidies.
4.1.4 Special Safeguard Measures
19. Furthermore, since July 1, 1995, a system of additional duties proportionate to the increase in differencebetween the world import price and the trigger price has been in place. The rationale for this system hasbeen the special safeguard clause allowed under the tariffication process. The EU notified to the WTO the trigger prices below which an additional duty may be imposed. Additional duties currently (effective March 30, 2001) applicable to imports of sugar are EUR 4.01/100 kgs for raw cane sugar for refining and EUR 7.82/100 kg for white sugar (Michael Roberts).
40

4.1.5 Tariff Rate Quotas (TRQ)
20. To ensure that levels of current access were maintained after the tariffication process, the EU agreed to establish a "current access" TRQ. In allocating the quota, the EU did so, on the basis of its existing scheme privileging suppliers from the ACP countries. The vast majority of third world country's sugar shipped to the EU is imported under special import quotas. Preferential sugar can be imported at zero duty. The total duty-free import quota amounts to 1.3 million tonnes (white sugar equivalent), of which 10,000 tonnes for cane sugar originating in India and 1.29 million tonnes for cane sugar originating in the countries listed as beneficiaries of Protocol 8 of the Lome Convention (Barbados, Belize, the Republic of the Congo, Fiji, Guyana, Ivory Coast, Jamaica, Kenya, Madagascar, Malawi, Mauritius, Suriname, St. Christopher & Nevis, Swaziland, Tanzania, Trinidad & Tobago, Uganda, Zambia, Zimbabwe).
21. Upon the expiration of the Lome Convention, the trading arrangements with the ACP countries were reconfirmed in the ACP-EU Partnership Agreement, signed in Cotonou in June 2000. The purchase price for Preferential Sugar is negotiated annually between the EU and the ACP states. In practice, this price has been equivalent to the derived intervention price for raw sugar in the U.K. Preferential imports provide a guaranteed income to ACP states, the EU being committed to buy at the guaranteed price through the Intervention agencies has not occurred to date.
22. The European Community has also undertaken to open on an annual basis (during the period July 1, 1995-June 30, 2001) a special tariff quota (in 2 tranches) for the imports of raw cane sugar for refining which originates in certain ACP sates (same as above) or in India. These imports are often referred to as "Special Preferential Imports". A special reduced rate of duty applying to these imports is fixed on an annual basis. For the marketing year 2000/01, the reduced rate of duty is set at EUR 54.10/MT of standard quality raw sugar. EU refiner which want to participate in this special reduced duty system must pay a minimum purchase price to the countries of origin concerned of EUR 49.68/100 kg of standard quality raw sugar. Only 4 EU member states are authorized to import under the quota: Finland, continental France, mainland Portugal, and the United Kingdom (Michael Roberts)
23. Two separate trances of import quotas have been opened during 2000/01, totalling 294,000 MT of whitesugar equivalent. The first quota covered the period July 1, 2000-February 28, 2001, for a volume of 210,000 MT originating in India. The second quota, for 84,000 MT, was opened for the period March 1-June 30, 2001. The exact level of the quota depends on the supply needs of the refineries. Maximum Supply Needs (MSN) has been established through Commission Regulation 2073/2000. As of 2000/01 MSN amount to 1,770,635 MT white sugar equivalent with 59,718 MT for Finland, 295,603 MT forcontinental France, 290,627 MT for mainland Portugal, and 1,124,687 MT for the U.K. The MSNs have to be met by imports from the French overseas departments, the Preferential Imports, and imports under the MFN quota. Any balance remaining after these imports, must be met by "Special Preferential Imports" (Michael Roberts).
24. In addition to preferential and special preferential imports, the Commission also sets an annual tariff quota, called "MFN quota" for the supply of raw cane sugar to Community refineries. Following the accession of Finland, the EU has undertaken to import, as from January 1, 1996, a quantity of raw canesugar from third world countries intended for refining at a reduced duty of EUR 98/MT. For the Period July 1, 2000 to June 30, 2001, the quota was fixed at 85,463 MT of "tel Quel" raw cane sugar. The quota allocation by country of origin is as follows: Cuba 58,969 MT, Brazil 23,930 MT, other thirdcountries 2,564 MT.
4.1.6 Case against EU Sugar Dumping
25. Brazil, the world's largest sugar producer and exporter, along with Australia and Thailand challenged theEU sugar subsidies at the WTO. These countries requested for a Dispute Settlement Body (DSB) in early 2002. These countries also requested consultations with the European Communities (EC)pursuant to Article 4 of the Understanding on Rules and Procedures Governing the Settlement of
41

Disputes (DSU), Article XXII:1 of the General Agreement on Tariffs and Trade 1994 (GATT 1994), Article19 of the Agreement on Agriculture and Articles 4 and 30 of the Agreement on Subsidies and Countervailing Measures (SCM Agreement) with respect to the EC's Common Organization of the Markets in sugar and its application and implementation. The request was circulated to Members on 1st October 2002 in document number WT/DS265/1. Consultations were held on 21st and 22nd November 2002 but unfortunately did not result in resolution of the dispute. Consequently, thesecountries requested the establishment of a Panel in accordance with Article 7, Article 4.7 and Article 6 ofthe DSU, Article XXIII:2 of GATT 1994, Article 19 of the Agreement on Agriculture and Articles 4.4 and 30 of the SCM Agreement.
26. The EU measures which include subsidies provided by the EC in excess of its reduction commitment levels on sugar and sugar containing products including sugar cane and sugar beet, processed and unprocessed cane and beet sugar and chemically pure sucrose in solid form, molasses resulting from the extraction of refining of sugar, isoglucose, insulin syrup and the other products listed in Article 1 of Council Regulation (EC) No 1260/2001 of 19 June 2001 on the European Communities' Common Organization of the markets in sugar sector (Official Journal of the European Communities, 30 June 2001, L178/1-45).
27. The European sugar subsidy policy was challenged on two fronts: first, it was claimed that the EU unfairly favours raw sugar imports from ACP nations; and secondly the EU sugar export quota system violates WTO rules and unfairly supports European sugar exports that drive down world prices. It was also pointed out that EU subsidized exports of sugar equivalent to the quantity of sugar it imported from ACP countries with preferential tariff access without including these subsidies in its reductioncommitments under WTO accords.
28. Subsidies provided by the EC through these various instruments referred to as "the EC sugar regime" are contained in a number of EC regulations including Council Regulation No 1260/2001 and related ECregulations, administrative policies, rules, decisions and other instruments including instruments pre-dating the above regulation, and their implementation. In addition to setting down the conditions attaching to imports of sugar, the EC sugar regime provides conditions attached to the production,supply and exports of sugar, including domestic support and export subsidies.
29. These complaints also concern the provisions of the EC sugar regime which accords direct subsidies contingent on export performance for quantities of approximately 1.6 million tonnes of sugar which are additional to the budgetary outlays and quantities of subsidized exports notified by the EC to the Committee on Agriculture under the provisions of Article 18.2 of the Agreement on Agriculture. In the application of those provisions, the EC significantly exceeds its budgetary outlays and quantitycommitments for export subsidies on sugar under the Agreement on Agriculture.
30. By granting export subsidies within the meaning of Articles 1.1(a)(1)(i), 1.1(a)(1)(iv), 1.1(a)(2) and 1.1(b)of the SCM Agreement that are not permitted by the Agreement on Agriculture, the EC also actsinconsistently with its obligations under Articles 3.1(a) and 3.2 of the SCM Agreement.
31. Brazil, Thailand and Australia consider that the provision of the above subsidies and the relevant elements of the EC sugar regime are inconsistent with the EC's obligations under the followingprovisions:
? Articles 3.3, 8, 9.1(a), 9.1(c), and alternatively, 10.1 of the Agreement on Agriculture;? Articles 3.1(a) and 3.2 of the Agreement on Subsidies and Countervailing Measures.
4.1.7 The DSB Decision
32. In an interim report released by WTO Panel on 4, August 2004, it decided as follows:
? EU exports of around 2.7 million tonnes of non-quota or 'C' sugar contravene WTO rules. The EU
42

claims that there are no subsidies attached to these exports but the panel found that they are in fact cross-subsidized by the high guaranteed prices paid for quota sugar.
? The EU also subsidizes the re-export of 1.6 million tonnes of sugar - the equivalent of imports from the ACP countries and India. These subsidized exports further exceed amount permitted under WTO rules.
? The panel ruling does not affect the right of the EU to import sugar from the ACP and India onpreferential terms.
33. This ruling is a triumph for developing countries including Pakistan and a death knell for unfair EU sugarexport subsidies, which undermine poor farmers' livelihoods and deny them the chance to trade their way out of poverty. The EU exports up to 5 million tonnes of sugar each year despite committing as partof the Uruguay round of trade talks to reduce its subsidized exports to just over one million. Commenting on the decision of DSU Mr Lead beater of Oxfam said "The EU may claim that this ruling goes against developing countries' interests by threatening their preferential imports, but in actual fact there is nothing here to stop the EU from continuing to import developing country sugar," The onus is onthe EU to act now to reform the regime so that the poorest countries benefit. Unfair rich-countryagricultural subsidies are toppling as a result of justified protest from developing countries.
4.1.8 Possible EU Policy Reforms
34. In the light of DSB decision EU has now suggested policy proposals highlighting the implications of three possible reform scenarios for the EU's sugar sector in a paper called Extended Impact Assessment (EIA) for open discussion. Simultaneously, EU has appealed in the DSB for a revise decision.
35. This EIA describes the three main policy options. In the first option, the present regime would be extended beyond 2006 (referred to in Chapter Three). The necessary reduction of quotas, tariffs and prices would be made within the current common market organization (CMO). The second option would involve the phasing out of production quotas and the EU internal price would be allowed to adjust itself to the price of the non-preferential imports. This price reduction scenario has been analyzed elsewhere with regard to its impact on world trade patterns, and includes the possibility of allowing sugar producersto benefit from the decoupled single farm payment. Finally, a complete liberalization from the current sugar regime has been considered as the third option. Producers would be integrated into the Single Farm Payment system. In this scenario the impact on the EU sugar market of the complete removal of import tariffs and quantitative restrictions on imports has been assessed. With these proposals the EU Commission has fulfilled its undertaking to report in 2003 on the EU sugar regime and its prospects.
4.1.9 Proposed reform of EU's sugar sector (3 scenarios)
36. Each of the three EIA options are discussed below.
a) An extension of the present regime beyond 2006 This would consist of keeping intact the current CMO, based on flexible quotas and price intervention. The EU market would be open to import quantities, according to the various international commitments already agreed or to be agreed in the future. Custom duties, internal prices and production quotas would be reduced. The EIA also addressed the impact of a request by the Everything But Arms (EBA) countries to implement that agreement through a fixed quota system.
b) A reduction in the EU internal price In this scenario, once the levels of imports and production are stabilized, production quotas would be phased out. The internal market price would be allowed to adjust itself to the price of non-preferential imports. However, lowering the level of the EU internal price would make the EU market less attractive for less competitive sugar producing countries. The impact of this policy option on the world trade pat
43
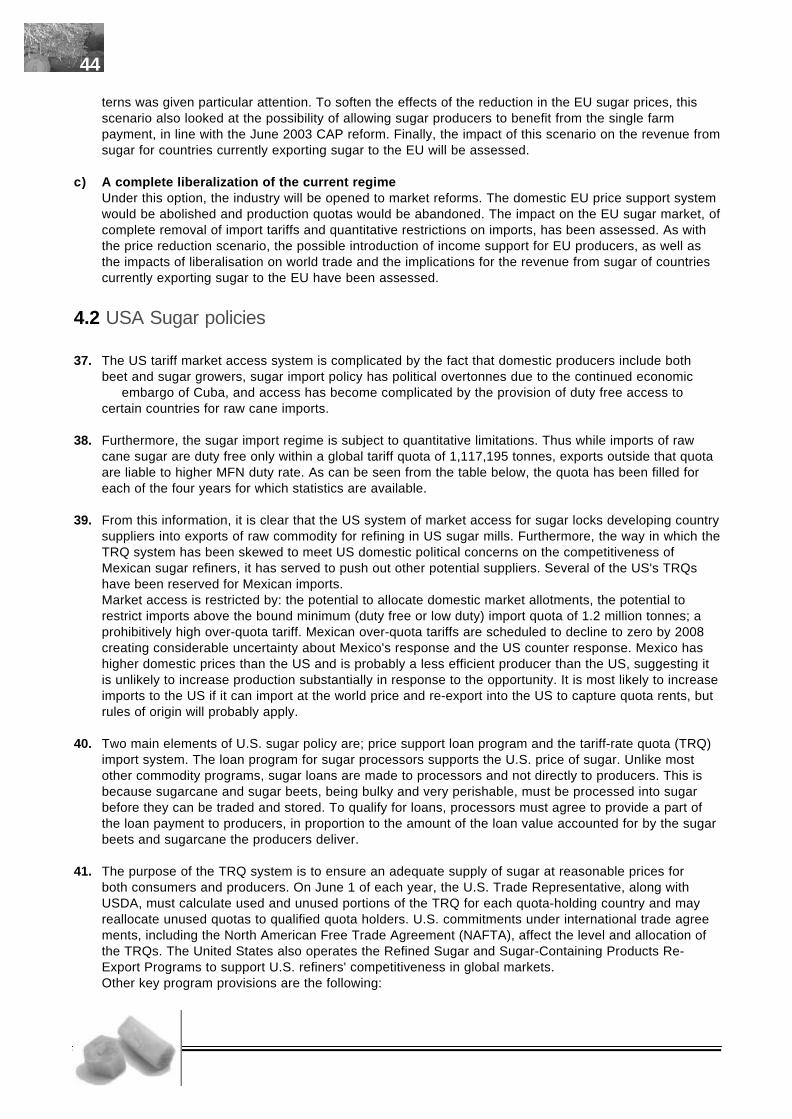
terns was given particular attention. To soften the effects of the reduction in the EU sugar prices, this scenario also looked at the possibility of allowing sugar producers to benefit from the single farmpayment, in line with the June 2003 CAP reform. Finally, the impact of this scenario on the revenue fromsugar for countries currently exporting sugar to the EU will be assessed.
c) A complete liberalization of the current regime Under this option, the industry will be opened to market reforms. The domestic EU price support systemwould be abolished and production quotas would be abandoned. The impact on the EU sugar market, ofcomplete removal of import tariffs and quantitative restrictions on imports, has been assessed. As with the price reduction scenario, the possible introduction of income support for EU producers, as well as the impacts of liberalisation on world trade and the implications for the revenue from sugar of countries currently exporting sugar to the EU have been assessed.
4.2 USA Sugar policies
37. The US tariff market access system is complicated by the fact that domestic producers include both beet and sugar growers, sugar import policy has political overtonnes due to the continued economic
embargo of Cuba, and access has become complicated by the provision of duty free access tocertain countries for raw cane imports.
38. Furthermore, the sugar import regime is subject to quantitative limitations. Thus while imports of raw cane sugar are duty free only within a global tariff quota of 1,117,195 tonnes, exports outside that quota are liable to higher MFN duty rate. As can be seen from the table below, the quota has been filled for each of the four years for which statistics are available.
39. From this information, it is clear that the US system of market access for sugar locks developing countrysuppliers into exports of raw commodity for refining in US sugar mills. Furthermore, the way in which theTRQ system has been skewed to meet US domestic political concerns on the competitiveness of Mexican sugar refiners, it has served to push out other potential suppliers. Several of the US's TRQs have been reserved for Mexican imports. Market access is restricted by: the potential to allocate domestic market allotments, the potential to restrict imports above the bound minimum (duty free or low duty) import quota of 1.2 million tonnes; a prohibitively high over-quota tariff. Mexican over-quota tariffs are scheduled to decline to zero by 2008 creating considerable uncertainty about Mexico's response and the US counter response. Mexico has higher domestic prices than the US and is probably a less efficient producer than the US, suggesting it is unlikely to increase production substantially in response to the opportunity. It is most likely to increaseimports to the US if it can import at the world price and re-export into the US to capture quota rents, but rules of origin will probably apply.
40. Two main elements of U.S. sugar policy are; price support loan program and the tariff-rate quota (TRQ) import system. The loan program for sugar processors supports the U.S. price of sugar. Unlike most other commodity programs, sugar loans are made to processors and not directly to producers. This is because sugarcane and sugar beets, being bulky and very perishable, must be processed into sugar before they can be traded and stored. To qualify for loans, processors must agree to provide a part of the loan payment to producers, in proportion to the amount of the loan value accounted for by the sugarbeets and sugarcane the producers deliver.
41. The purpose of the TRQ system is to ensure an adequate supply of sugar at reasonable prices for both consumers and producers. On June 1 of each year, the U.S. Trade Representative, along with USDA, must calculate used and unused portions of the TRQ for each quota-holding country and may reallocate unused quotas to qualified quota holders. U.S. commitments under international trade agreements, including the North American Free Trade Agreement (NAFTA), affect the level and allocation of the TRQs. The United States also operates the Refined Sugar and Sugar-Containing Products Re-Export Programs to support U.S. refiners' competitiveness in global markets. Other key program provisions are the following:
44

42. The 2002 Farm Act continues the rate for loans to processors of domestically grown sugarcane at 18 cents per pound and the rate for loans to processors of domestically grown sugar beets at 22.9 centsper pound for refined sugar. Processors may obtain loans for "in-process" sugar and syrups at 80 percent of the loan rate. The processor cannot be required to notify USDA of the intention to forfeit the sugar under loan.
43. Flexible marketing allotments are determined by subtracting the sum of 1.532 million short tonnes, raw value (STRV) and carry-in stocks of sugar (including CCC inventory), from USDA's estimate of sugar consumption and reasonable range of carryover stocks at the end of the crop year. USDA is required to estimate factors affecting allotment quantities no later than August 1 before the beginning of each crop year, through 2007. USDA is required to re-estimate these factors as necessary, but "no later than the beginning of each of the second through fourth quarters of the crop year. The overall marketingallotment quantity is divided between refined beet sugar (54.35 percent) and raw cane sugar (45.65 percent). For cane sugar, Hawaii and Puerto Rico are jointly allotted 325,000 STRV. Allocations for mainland cane sugar producing States are assigned based on past marketing of sugar, the ability to market sugar in the current year, and past processing levels. Beet sugar processors are assigned allotments based on their sugar production for the 1998-2000 crop years. The 2002 Farm Act provides for a number of contingencies that could require reassignment of allotments during the crop year.
44. USDA's authority to operate sugar-marketing allotments is suspended if USDA estimates that sugar imports for domestic human consumption will exceed 1.532 million STRV. This will have the effect of reducing the overall allotment quantity. Marketing allotments would remain suspended until imports havebeen restricted, eliminated, or otherwise reduced to, or below, the 1.532-million level. Flexible marketing allotments are likely to provide more effective price support throughout the marketing year. When allotments are in effect, processors who have expanded marketing in excess of the rate of growth in domestic sugar demand will have to postpone sale of some sugar and either store it at their own expense or sell it for uses other than domestic food use. Without allotments, price support comes from forfeiting sugar under CCC loan in the fourth quarter (July-September) of the fiscal year. The forfeiture withdraws sugar from the market, thereby reducing excess sugar supply and helping to support the market price of sugar.
45. Cost of storing excess production is shifted from the Government to the industry. 2002 Farm Act requires that CCC establish a sugar storage facility loan program to assist processors who want toconstruct or upgrade storage and handling facilities. Under the Act, USDA efforts to reduce sugar production have proved to be effective. USDA has authority to exchange CCC-owned sugar for reductions in acreage prior to planting. Previously, USDA relied on "cost-reduction options" under the 1985 Farm Security Act with authority to implement payment-in-kind diversion programs that withdrew already-planted area from harvest. Because the loan forfeiture penalty was eliminated, the support price was effectively increased, and this could increase the likelihood of forfeitures. Elimination of the loan forfeiture penalty and of marketing assessments could increase returns to growers and processors.
46. Much attention should be paid to potential sugar imports entering from Mexico at the high-tier tariff rate under NAFTA. Although the May 2002 USDA projection of these imports is only 10,000 STRV in fiscal year 2003, there are strong economic incentives for additional imports from Mexico. World raw sugar futures prices (No. 11 New York Contract) for 2003 are in the range of 6 cents per pound, and the NAFTA high-tier tariff on raw sugar dropped to 7.56 cents per pound on January 1, 2003. Assuming other normal marketing costs, it is likely that Mexicans would find the US market attractive when U.S. raw sugar prices are at or above 17 cents per pound.
4.3 Japanese Sugar Polices
47. Japan sugar market access is restricted by monopoly buying and selling activities of a government agency which raises consumer and producer prices -- high import levies and surcharges. Domesticsupport is achieved by price setting by the activities of the monopoly buying and selling agency; cross-subsidising domestic producers using funds raised through import levies and
45

surcharges on imports: cane prices are set at US $ 1660/ton in sugar equivalents; beet prices are set atUS $ 894/ton in sugar equivalents; domestic wholesale white sugar prices are set at around US $ 800/ton.
4.4 Developing Countries Sugar Policies
48. Although not a food security staple in the same manner as rice, sugar is a sector subject to major policyintervention in developing countries. Asian countries are no exception. Annex III shows tariff bindings onsugar cane imports in India, Indonesia, Singapore and Thailand. From the Annex it is clear that India opted for a ceiling binding of 150% along with Bangladesh (150%). Sri Lanka's bound tariff rate on allcommodities drops to 50% by the end of the implementation period in 2004.
49. Applied tariffs have been quite different - the ceiling bindings of India and Bangladesh allow bothcountries significant freedom in policy intervention. For example, in India, since February 2000, thegovernment has raised the import tariff to 60 per cent, increased the countervailing duty to Rs. 850/ton and subjected imported sugar to levy procurement and monthly releases. The sum of these measures has effectively precluded any possibility of sugar imports into India.
50. Among countries in the region, Indonesia has been applying a relatively liberal import regime in terms ofits applied tariff regimes. Under pressure from the IMF, Indonesia has liberalized its import tariff policy and opened up its sugar market. However, domestic producer groups that have repeatedly called for a dramatic increase in the sugar import tariff oppose this liberalization. In order to enact a tariff increase, though, the government would have to receive approval from the IMF. This is unlikely to occur without a long negotiation and up until now, the government has resisted pressure to change the import tariff. Within ASEAN, Indonesia has proposed that sugar be included in the Highly Sensitive List under the ASEAN Free Trade Agreement (AFTA) in 2002. Should this proposal be accepted, the zero levy for sugar will be postponed until 2010.
51. Another country suffering from the tug-of-war between the IMF and domestic producer groups is the Philippines. In the Uruguay Round it bound its tariff rate at 100% but committed to cutting this in half by the end of the implementation period in 2004. The tariff rate was the result of the tariffication process and as such allows the government to apply a TRQ and the special safeguard provisions of Article 5 of the AoA.
52. The tariff rate quota set out in the schedule of commitments provides for an initial quota of 38,400 tonnes rising to 64,500 tonnes by the end of the 2004 - and a tariff rate of 50%. The problem for the Philippines is that domestic production fluctuates wildly. Besides that, a large portion of imports is in smuggled without duty. USDA attaché in Manila reports that 100,000 MT smuggled sugar was seized bythe Government of Philippines and resold through the National Food Authority (NFA) of Philippines, the state trading entity in the Philippines, in 2000. Because of these problems, in January 2000, the Philippines submitted to the WTO a request for modifications in its sugar tariff concessions. The requestentails a re-negotiation of the MFN out-of-quota tariff rate and final bound rate up to 80%.
46

HAPTER FIVE: EU SUGAR POLICY IMPACT ON PAKISTAN'S SUGAR SECTOR
5.1 Impact of EU Reforms on Pakistan's Imports
Sugar is produced in all Member States of the EU-15 with the exception of Luxembourg. The EU-15 sugar production fluctuates between 15 and 18 million tonnes, in refined equivalents. However, theproductivity of sugar production varies significantly across Member States. Germany and France account for more than half of the EU-15 sugar production, followed by the United Kingdom and Italy(8% each). Among the ten new Member States, six manufacture about 3 million tonnes, with Poland accounting for two thirds.
2. With the ten new Member States sugar production is expected to increase by 15 %. In the EU-15, there are 135 sugar processing plants and 6 refineries. Sugar beet provides for 1.6 to 1.8 % of the EU's agricultural output and is grown on 230,000 farms. Generally, sugar beet holdings are larger than average and yield a better income.
3. The EU-15 both imports and exports sugar, but in net terms it is an exporter. On average for themarketing years 1999/2000 to 2001/02, exports amounted to 5.3 million tonnes versus 1.8 million tonnes for imports. Net exports represent on average 20% of sugar production and 2 to 3.5% of the EU-15 exports of agri-food products, according to the Uruguay Round definition.
4. The EU is a key player on world sugar markets but remains far behind Brazil, which dominates exports. The EU-15 shares 13% of production, 12% of consumption, 15% of exports and 5% of imports of the world. Its share in world production, consumption and exports has declined, whereas Southern Hemisphere countries have registered an increase. EU being big player in the world market of sugar is a price setter in the world market. If there will be any change in the EU policy on phasing out of export subsidies and reduction of domestic support to sugar beet farmers under WTO regime that may affect Pakistan sugar trade regime favourably.
5. Pakistan regularly imports sugar from the world markets in spite of having the second largest number ofunits. Annex IV shows that Pakistan imported refined sugar from many countries. The maximumquantity imported during 2000-01 was 1.455 million tonnes value of which was $ 389.3 million. The minimum quantity imported in 1995-96 was 7 thousand metric tonnes value of which was $ 3.2 million. During the last two years i.e. 2002-03 and 2003-04 imported quantity ranged 12.5 to 16.5 thousand metric tonnes, value of which was $ 4.0 and 4.8 million.
6. Table no. 16 shows that the European Union is the major supplier of refined sugar to Pakistan, which captured 98% share in quantity and value during 1995-96. In 1996-97 its share declined to 7.5%, after that it reached 34.4% in term of quantity and 39.5% in terms of value. In the coming years Pakistan wassuccessful in finding other cheaper sources of supply. As a result of this shift, EU share in Pakistan's total import declined to 10% in term of quantity and 12.8% in term of value in 1999-00 and to the lowest point ever at 4.9% in 2000-01. In 2001-02 the share of EU again increased to 7.7% in term of quantity and 8.6% in term of value. In the last 2 years EU dominated Pakistan sugar market and shared 61.8% to 66.8% in term of quantity and 63.6 to 68.5% in term of value respectively. Quantity, value and cif price details of imported sugar from all countries are presented in Annex IV.
47

7. It is evident from the graph that there is no big difference between the EU and world prices. Maximum gap of $ 61 / ton because EU cif price was $ 284 / ton and World cif price was $ 223 / ton witnessed in 1999-00. In this year Pakistan imported a limited quantity of sugar. In spite of the fact that EU is selling at the lowest than any other sugar exporting country Pakistan imported sugar at very high price.
Graph 13
8. Table 17 shows the cif price of imported sugar from European Union during the period under review ranged between $ 282 (2000-01) and $ 456 (1995-96). After accounting for import incidentals at the rateof 10% on an average, cif price of EU sugar ranged between $ 310 (2000-01) to 500 (1995-96). However, domestic prices during the same period ranged from $ 500 (1995-96) to $ 738 (2000-01). Table further explains that price differential i.e. gap between the cif prices including 10% incidental charges of imported sugar from the EU and Pakistan's domestic market prices is too wide which means imported sugar could have been available in the local market at low price ranged between $ 158 to $ 420 compared with domestic price of sugar. This supports an argument that the domestic prices could have been higher in the absence of EU sugar. The EU sugar imports have played an important role in
maintaining stability in domestic prices.
48
Table 16 Pakistan's Imports from the EU and World Quantity in 000 MT
Value in million $ Price Difference in $
Year Imports from World Imports from EU only Ratio of Imports from EU
to Pakistan's Total Imports
Quantity Value Cif Price Quantity Value Cif
Price Quantity Value Price differ.
1 2 3 4 5 6 7 8 9 10 (4 – 7)
1995-96 6.9 3.2 464 6.8 3.1 456 98.4 98.3 8.00 1996-97 811.3 294.1 363 60.6 22.1 364 7.5 7.5 -1.00 1997-98 147.5 51.9 352 18.5 6.7 362 12.6 13.0 -10.0 1998-99 10.7 3.2 300 3.7 1.3 352 34.4 39.5 -52.0 1999-00 66.7 14.9 223 6.7 1.9 284 10.0 12.8 -61.0 2000-01 1455. 389.3 268 70.7 19.9 282 4.9 5.1 -14.0 2001-02 85.7 24.1 281 6.6 2.1 318 7.7 8.6 -37.0 2002-03 12.5 4.0 320 8.4 2.8 333 66.8 68.5 -13.0 2003-04 16.5 4.8 291 10.2 3.1 304 61.8 63.6 -13.0 Source : Federal Bureau of Statistics
Comparison of EU and World Cif Prices of Imported Sugar by Pakistan
050
100150200250300350400450500
1995-96
1996-97
1997-98
1998-99
1999-00
2000-01
2001-02
2002-03
2003-04 Years
Price
$ /
Tonn
e
EU Cif Price
World CifPrice

9. Graph presented below depicts that gap between EU cif imported price and domestic market price of sugar is too wide which is more than double. The reason given by marketing experts is that in the year 2000-01 sugarcane crop was short compared with previous three years, secondly crisis of delaypayments by mills to growers was at peak and government was unable to solve it amicably.
Graph 14
10. Table 18 also reflects that cif price of imported sugar particularly from other than EU countries were alsolow. After accounting for import incidentals at the rate of 10% on an average, cif price of other than EU countries ranged between $ 238 (1999-00) to 560 (1995-96). However, domestic prices during the sameperiod ranged from $ 500 (1995-96) to $ 738 (2000-01). Table further shows that price differential i.e. gap between the cif prices including 10% incidental charges of imported sugar from other than EU countries and Pakistan's domestic market prices is also too wide which means imported sugar could have been available in the local market at the low price ranged between $ 131 to $ 444 compared with domestic price of sugar.
Table 17: Comparison of CIF of EU Imported Sugar and Domestic Market Prices
Quantity in 000 MT Value in million $
CIF in $/MT Imports from EU Price of
Year Quantity Value Cif price Difference
Imported Sugar +
Incidentals Domestic
Sugar 1 2 3 4 5 6 7
1995-96 6.8 3.1 456 500 500 0.00 1996-97 60.6 22.1 364 400 597 197 1997-98 18.5 6.7 362 398 516 118 1998-99 3.7 1.3 352 387 545 158 1999-00 6.7 1.9 284 312 638 326 2000-01 70.7 19.9 282 310 738 420 2001-02 6.6 2.1 318 350 612 262 2002-03 8.4 2.8 333 366 571 205 2003-04 10.2 3.1 304 334 510 176
Source : Federal Bureau of Statistics
Comparison of EU Cif Prices of Sugar imported by Pakistan and Domestic Market Prices
0
100
200
300
400
500
600
700
800
1995
-96
1996
-97
1997
-98
1998
-99
1999
-00
2000
-01
2001
-02
2002
-03
2003
-04Years
Pric
e $
/ ton
ne
EU CifImportedPrices +Incidentals Domestic SugarPrices
49

11. Following graph also explains same situation as briefed earlier that gap between cif prices of other than EU sugar exporting countries to Pakistan and domestic market prices is more wide than EU cif prices because cif prices of other than EU countries were less than EU cif prices. Maximum gap witnessed in the year 2000-01 because of 79.1% of Pakistan total import came from and freight charges compared with EU market were negligible. In this year import from EU was just 8% of Pakistan's total import.
Graph 15
12. The question arises that why consumers were forced to pay more to local industry when they can get sugar at lower prices from abroad. Since the EU is a major supplier of sugar to Pakistan and providing huge export subsidy to sugar exporters and domestic support to sugar beat farmers, its fob prices are lower than the world price. It is explained in Chapter III and detailed in Annex III that EU and other sugar exporting countries are providing huge subsidy to the export of sugar on the one hand and strongly protecting their sugarcane and beet farmers and industry on the other. An important point to be noticed is that Pakistan imported expansive sugar from EU when cif price of other exporting countries toPakistan were lower.
50
Table 18: Price differential of imported Sugar from Other than EU Countries and Domestic Market Price.
Price $/tonne Quantity 000MT Value Million $
Year Quantity Value Cif Price + Incidentals
Market Prices Difference
1 2 3 4 5 6 1995-96 0.108 0.055 560 500 -60 1996-97 750.74 271.958 398 597 199 1997-98 128.922 45.121 385 516 131 1998-99 7.0 1.939 308 545 236 1999-00 60.013 12.964 238 638 400 2000-01 1384.824 369.362 294 738 444 2001-02 79.016 22.034 307 612 305 2002-03 4.172 1.269 334 571 237 2003-04 6.283 1.754 307 510 203 Source: Federal Bureau of Statistics
Comparison of EU and Other than EU Countries' Cif Prices and Domestic Market Prices of Sugar
0
100
200
300
400
500
600
700
800
1995-96
1996-97
1997-98
1998-99
1999-00
2000-01
2001-02
2002-03
2003-04
Years
Pric
e $
/ Ton
ne Other Than EUCountries Cif Price+ IncidentalsDomestic Market Prices

13. Average cif price during the last nine years was EU ($ 339), USA ($ 318), and others ($ 316). Within EU, Italy has the lowest price at $ 284 per ton while Ireland is the highest at $ 467. African countries have the lowest cif price. If there will be any improvement in the price of EU after policy change then it would be appropriate for Pakistan to rely on other suppliers subject to condition that price of imported sugar remains lower than domestic price. In the light of provisions available in the WTO Agreement on Agriculture tariff is the only form to restrict dumped sugar from EU in Pakistan and this option can be used at any time. If there will be a change in the EU sugar trade regime as proposed by the EU Commission then world prices of sugar will move upward and the EU sugar will become costly due to increase in its fob and cif prices. Pakistan will not be able to import much quantity from the EU and there will be an opportunity for sugar industry to produce sugar in a more efficient way and supply at low price than the border prices in the domestic market.
14. Table 19 explains ratio of imported quantity to local production and consumption. Pakistan imported onlya fraction of local production except in two years i.e. in 1996-97 and 2000-01 when 34.1% and 59.0% oflocal production was imported respectively. In remaining years imported quantity was not more than 4% of local production. Similarly, ratio of imported quantity to consumption was almost same i.e. 29.4% in 1996-97 and 45.89% in 2000-01. In these two years sugarcane crop was not up to the mark.
15. In graph, ratio of imported sugar to domestic production and consumption has benn presented below. It is evident that domestic production was short of domestic consumption only in three years. In the rest ofyears, the production was sufficient to meet the requirement of domestic consumption.
Graph 16
Table 19 Ratio of Imports to Local Production and Consumption
Quantity in 000 MT Ratio in %
Year Imported Quantity
Domestic Production
Domestic Consumption
Ratio of Import to Local
Production
Ratio of Import to Local
Consumption
1 2 3 4 5 6 1995-96 6.896 2449.598 1762.700 0.28 0.39 1996-97 811.330 2378.752 2759.100 34.11 29.41 1997-98 147.464 3548.960 2605.200 4.16 5.66 1998-99 10.673 3530.932 3107.300 0.30 0.34 1999-00 66.679 2414.746 3077.400 2.76 2.17 2000-01 1455.568 2466.788 3171.900 59.01 45.89 2001-02 85.654 3197.745 3050.400 2.68 2.81 2002-03 12.549 3662.050 3252.100 0.34 0.39 2003-04 16.461 3994.378 3483.800 0.41 0.47 Source : 1 Federal Bureau of Statistics 2. Ministry of Industries 3. Pakistan Sugar Mills Association
51
0
5001000
15002000
2500
30003500
4000
Qua
ntity
in 0
00To
nnes
1995-96
1996-97
1997-98
1998-99
1999-00
2000-01
2001-02
2002-03
2003-04
Years
Share of Imported sugar in Domestic Production and Consumption
ImportedQuantityDomesticProductionDomesticConsumption

16. Table 20 shows the ratio between the values of imported sugar to the values of local production. Since Pakistan imported only a fraction of local production except in 1996-97 and 2000-01 when the value of imported sugar was 24.61% and 37.2% to the value of local production respectively. In the remaining years value of imported sugar was not more than 3.65%. Imports were insignificant in relation to demand. During the period, under review, Pakistan imported sugar from EU member countries. Other suppliers were Dubai, Malaysia, India, China Brazil and USA. Since value of imported sugar compared with value of local production is negligible hence there is no big loss to national revenue.
17. Pakistan is a sporadic exporter of sugar, but it does not have surplus sugar every year. Since 1995-96 to 2003-04, Pakistan exported only a limited quantity of sugar to few countries. In 1996-97 and 2000-01 Pakistan could not export a single kg of sugar. In 1998-99, it exported maximum quantity of 906.547 thousand tonnes, value of which was 0.239 million dollars. Afghanistan was the main destination of sugar. There were other 23 countries where sugar was exported. Table 21 gives minimum andmaximum quantity of exported sugar. Only in the year 2003 country was successful in exporting sugar to Germany (EU)
Table 21 Sugar Export to the World
Year Quantity in MT
Value in 000 $ Fob Price $ / Tonne
1 2 3 4 A) To Others Countries
1995-96 29134 10428 358 1997-98 210632 67084 318 1998-99 906547 230716 254 1999-00 30487 9441 310 2001-02 3800 1249 329 2002-03 32230 7575 235 2003-04 116175 30212 260
B) Export to EU (Germany) 2003-04 2400 657 274
C) Pakistan Total Exports 2003-04 118575 30869 260
aD) Ratio of export to the total 2003-04 2.02% 2.12%
Source: Federal Bureau of Statistics
52
Table 20 Revenue Loss to Sugar Sector in Pakistan Quantity in MT
Value in 000 Rs
Year Imports from World Local Production Revenue Loss
Quantity Value Quantity Value 5 % of 6 1 2 3 4 5 6
1995-96 6.9 107.4 2.5 41128.8 0.26 1996-97 811.3 11724.5 2.4 47646.4 24.61 1997-98 147.5 2240.0 3.6 61432.5 3.65 1998-99 106.7 160.4 3.5 64545.4 0.25 1999-00 66.7 769.9 2.4 51675.6 1.49 2000-01 1455.6 22749.6 2.5 61127.0 37.22 2001-02 85.7 1480.9 3.2 65681.7 2.25 2002-03 12.5 235.5 3.7 70164.9 0.34 2003-04 16.5 277.3 4.0 67536.1 0.41 Source : Federal Bureau of Statistics, Ministry of Industries and Agricultural Prices Commission

18. Table 22 below gives the ratio of Pakistan's total exports to local production. In 1998-99, maximum quantity of sugar i.e. 26% of local production was exported. In 1997-98 and in 2003-04 only 6% and 3%of local production was exported. Annexe 6 indicates 15 major sugar-exporting countries of the world in which Pakistan's rank is 55th. Pakistan's fob price increased from $ 306 in 2000 to $ 322 in 2001 and to$ 338 in 2002. Pakistan's has the 3rd highest fob price after EU ($ 403) and Belarus ($ 369) in 2002. The lowest price was $ 171 of Brazil. Average fob price of major exporting countries except EU, Belarusand Pakistan in 2002 was less than $ 260 per ton. This proves that Pakistan would not be incompetition with any major sugar exporting country even if there are major policy changes in the EU. Pakistan has charged highest fob price from Afghanistan only. Otherwise major exporting countries do not provide marketing space to Pakistani sugar.
19. To Dubai sugar was exported for four years, to India, Yemen and Sri Lanka for three years and Saudi
Arabia, Canada and Iran 2 years while two other countries only in one year. In EU, Germany was the only country where sugar 116.175 thousand tonnes, (value $ 0.03 million) was exported in 2003-04. Ratio of exported sugar to EU was 2% in value and quantitative term. The fob price of sugar charged from Germany was $ 274 per ton. Annexe 5 and 6 shows country wise exported quantity, value and fob price of Pakistani sugar since 1995-96 to 2003-04. An average fob price of Pakistan sugar was Rs. 291 per ton. The maximum fob price charged was 369 per ton from South Korea.
20. Table 23 reflects comparison of Pakistan's fob prices with the cost of production. Fob price does not cover cost of production and it is difficult to compete in the highly subsidised world trade regime. It is evident that fob prices have been lower than the cost of production for the last three years. In 1998-99, fob price was $ 254 compared with cost of production of $ 259. In 2002-03 it was $ 225 against $ 359 and in 2003-04 it was $ 260 against $ 412. In the remaining years, fob price was little over than the costof production. It is reported by Ministry of Industries that no subsidy was provided to private sugar exporters. This is simply not true. Cost of production is so high that whenever surplus was exported it was with the help of huge subsidy at the cost of taxpayer. This task was assigned to Tradition Corporation of Pakistan (TCP), which was not much successful to market surplus sugar at the fob price,which could cover cost of sugar production plus incidentals. It is not sensible to export sugar below costof production to protected markets of other countries. Besides, buyers are not likely to import expensive sugar from Pakistan when much cheap sugar is available elsewhere.
Table 22 Ratio of Pakistan's Total Export to Local Production
Quantity in Tonnes Ratio in %
Year Production Quantity
Export Quantity
Ratio of Export to Local Production
1 2 3 4 1995-96 2449598 29134 1.19 1996-97 2378752 - - 1997-98 3548960 210632 5.94 1998-99 3530932 906547 25.67 1999-00 2414746 30487 1.26 2000-01 2466788 - - 2001-02 3197745 3800 0.12 2002-03 3662050 32230 0.88 2003-04 3994378 116175 2.98
Source: Federal Bureau of Statistics, Ministry of Industries for 2003-04
53

Graph 17
21. Table 24 below shows in which year Pakistan has surplus or deficit in sugar production and how much quantity was imported or exported. It is strange to note that since 1995-96 sugar was imported every year in spite of surplus stocks. Liberal economists would say that there should be no restriction on the trade of sugar but it is evident from Annex III that all sugar-exporting countries provide protection to theirindustries even by taking non-price measures. EU's example can be quoted in this regard. There could be several reasons of import of sugar, but country's trade regime should be more transparent. If local industry is not efficient to compete in the international market then at least high tariff protection should be provided so that dumping from abroad like from EU can be avoided. If other countries protect their industry by adopting tariff and non-tariff measures, then why should not Pakistan? Local industry isentitled in equal measure to similar protection so as to overcome the deficiencies and improveproduction and marketing efficiencies.
54
Table 23 Comparison of Cost of Production with fob Prices
Year Quantity in MT
Value in 000 $
Fob Price $/MT
Cost of production
$/MT Difference $/MT
1 2 3 4 5 6 1995-96 29134 10428 358 354 4 1997-98 210632 67084 318 287 31 1998-99 906547 2E+05 254 259 -5 1999-00 30487 9441 310 282 28 2001-02 3800 1249 329 303 26 2002-03 32230 7575 225 359 -134 2003-04 118575 30869 260 412 -152 Sources: 1) Federal Bureau of Statistics, 2) Pakistan Sugar Mills Association 3) Agriculture Prices Commission
Difference between Cost of Production and Fob Prices of Pakistani Exported Sugar
0
50
100
150
200
250
300
350
400
450
1995-96 1996-97 1997-98 1998-99 1999-00 2000-01 2001-02 2002-03 2003-04
Years
Pric
e &
Cos
t $/to
nne
Cost ofproduction
Fob Price

22. It is evident from the graph below that Pakistan does not have surplus sugar every year and is not a regular exporter. However in the years 1995-96, 1999-00 and 2000-01, Pakistan was deficient and imported sugar from abroad. It does not mean that Pakistan's sugar industry has no potential inexporting sugar.
Graph 18
23. Annex VII shows that fob prices of refined sugar is highest among leading sugar-exporting countries. Pakistan faces tough competition with Brazil, Australia Thailand and India in international sugar markets.In the presence of sugar subsidy provided by EU and the US, Pakistan's fob prices cannot becompetitive. There is little scope for Pakistan to compete in the world market if the EU and the US were to withdraw all export subsidies and domestic support to sugarcane and beet farmers. There are varioustypes of tariffs and non-tariff restrictions in the world markets particularly in the EU and the US. Pakistanis continuously pressurising EU and the US to phase out all export subsidies on sugar. In the current negotiations under the aegis of WTO particularly as part of Agreement on Agriculture, a framework has been decided and modalities are being negotiated. It is not a significant loss of profitability due to EU sugar subsidy in different markets because Pakistan's fob prices are quite high compared with other major exporting countries. Pakistan will be able to compete in the international market if sugar industry will be able to produce at low price and its fob export price should be equal to other sugar producing developing countries.
24. Pakistan sugar industry is not much efficient to produce sugar efficiently and to reduce cost of product through economy of scale by maintaining environmental standards. Producing high cost of sugar is not an appropriate phenomenon. There are several
Table 24 Production, Consumption and Exportable Surplus Quantity in Tonnes
Year Production Consumption Deficit/surplus Actual Export
Actual Imports
1 2 3 4 5 6 1995-96 2449598 2759100 -309502 29134 6896 1996-97 2378752 2605200 -226448 - 811330 1997-98 3548960 3105300 +443660 210632 147464 1998-99 3530932 3077400 +453532 906547 10673 1999-00 2414746 3171900 -757154 30487 66679 2000-01 2466788 3050400 -583612 - 1455568 2001-02 3197745 3252100 -54355 3800 85654 2002-03 3662050 3483800 +178250 32230 12549 2003-04 3994378 3812754 +181624 131156 16461
Source: Federal Bureau of Statistics Pakistan Sugar Mills Association-SZ, Ministry of Industries
Production, Consumption and Deficit / Surplus of Sugar
-1000000
0
1000000
2000000
3000000
4000000
5000000
1995-96
1996-97
1997-98
1998-99
1999-00
2000-01
2001-02
2002-03
2003-04
Years
Qua
ntity
in M
T
Production
Consumption
Deficit/surplus
55

deficiencies and problems being faced by the sugar industry of Pakistan. It may be appropriate that production of sugar should be stopped without analysing viability of sugar industry and fining the solution offinancial, economic social and environmental effects.
25. The impact of EU reforms on Pakistan sugar sector depends on what reforms in the EU policy encompasses and how the modalities of WTO new framework particularly on agreement on agriculture take shape. There are chances of improvement in world prices of sugar if meaningful reforms take place in the EU. Since Pakistan's cost of production is very high so as fob prices it may not be possible for Pakistan's sugar industry to gain benefit from the prospective policy change. EU sugar has played a rolein maintaining stability in our domestic price of sugar. If imports continue, prices in the domestic market will be reduced and that will be a serious challenge to our local industry. If prices will continue for a longperiod then production will contract and the capital from the sugar industry will shift to another sector.
26. In the markets of less developed countries there will be competition between the potential sugarsuppliers; however, they are not bound to reduce tariff and quota barriers. Their trading systems are not complex and their regime will not suffer due to EU trade reform policies. If subsidies are with drawn, international prices of sugar will increase but even though Pakistan's sugar industry would not becompetitive to capture a little share of international markets. As a result of modalities to be settled underthe WTO new frame Work of Agreement on Agriculture there is little scope that world sugar market will be open as desired by the sugar producing developing counties. Sugar is a sensitive product for EU and they will try to protect it as much as possible.
27. Viability and progress of sugar industry in Pakistan depend on regular supply of raw material ataffordable price. Due to limited supply of sugar cane and under utilization of existing crushing capacity, there is not much future for sugar industry. On strictly economic grounds sugar industry is not viable because there is not enough sugar cane production nor is there any potential for increasing either the area under crop or the productivity. Sugar industry, which owes its existence to political patronage, isliving of the taxpayer's money. When it fails to sell its sugar at a price it has set for the consumers, it runs to the government to bail it out through state purchase. It has so much influence on thegovernment that it almost dictates when the sugar should be released from the government stocks so that the market is not depressed to the industries disadvantage. The farmers may shift to cotton crop, which needs less water and other resources and is more profitable cash crop. Over and above to this it would be difficult for the sugar industry of the region to exist and sell sugar below the cost of production.
5.2 Impact of EU Imported Sugar
28. In response to the question of a field survey about EU sugar trade regime, Pakistan's Merchants repliedthat developed countries are subsidizing their local industry and providing subsidy to their sugar exporters who are dumping their surplus sugar to the world market. EU sugar available in their own market in 650 - 700 $/ton while they exporting their sugar at the fob price of 180 $ to 230 $/ton. Similarly Chinese subsidized sugar is available in the market for 115 $/ton while Pakistani sugar's outlayis 230 $/ton because no subsidy is given by the government. Merchants are expecting that developed countries governments' involvement would be not be withdrawn in the light of DSB decision and eventually it would not be beneficial for the industry and exporters who cannot subsidize their exports tocompete in the international markets (Survey Report).
29. About the impact of EU imported sugar on local production traders claim that EU imported sugar is not replacing much of local production. On the question that does the EU imported sugar replacing cheap import from other sources and how much it is costly to the country, traders informed that there was shortage of local sugar in the 1990s and at that time the EU sugar was comparatively cheap [this statement is contrary to date collected from secondary sources like FBS]
30. Commenting on the share of EU imported sugar in Pakistan's total imports and domestic production andconsumption traders stated that in 1990s our national consumption of sugar was approximately 3.0million tonnes/year; therefore country imported 6 to 7 lac ton sugar to overcome shortage. It
56

represented 30% of domestic consumption. To restrict EU sugar dumping traders said government should increase import duty and give incentives to local producers so that they can produce at low cost and sell at cheap rates other wise there is no way to restrict EU dumping. Sugar merchants informed that import of EU sugar has been reduced because local industry has plentiful production in last two years sufficient for local consumption. Consequently, Pakistan has now exporting sugar to other countries. Government has procured sufficient quantity from local industry (Survey Report).
5.3 Impact of EU on Export of Sugar
31. Pakistan does not export sugar regularly because no subsidy is provided to exporters. Whenever there have been excess stockpile TCP (Trading Corporation of Pakistan) got involved in the business of sugarexport. Pakistan's per annum consumption is approximately 3.6 million ton while production was around 4.2 million ton. TCP purchased and exported 467 lac ton of sugar and private traders exported aquantity of 200,000 to 400000 tonnes of sugar to Afghanistan during last three years which was 10% of total production. Last time sugar was sold to Afghanistan at the highest price of 240 $ to 288 $/ton. In case of Afghanistan it reflects production cost. In response to receiving export subsidy from government, traders reported that no export subsidy except waiver in 15% sales tax is provided by the government (Survey Report).
32. Pakistan's sugar may be competitive in the following markets: 1. Middle East 2. Indonesia 3. Yemen 4. Afghanistan. 5. Central Asian States. Pakistan's major competitors in these markets are 1. Brazil 2. India3. Thailand 4. Australia. These countries are enjoying export subsidy from their governments, for example India is providing freight subsidy to sugar industry (Survey Report).
33. Responding to question about dumped sugar from EU, US or Japan in destination of Pakistani sugar Merchants reported that in the presence of EU subsidized sugar, Pakistani sugar cannot compete because our cost of production is as high as 40 $/ton. So there is no comparison in terms of export cost and price. European Governments are subsidizing sugar as they have an agreement with their mill owners. They have fixed export rate at 200 $/ton while their local rate is about 700 $/ton. In this way they filled the gap of 500 $ in their local markets. Comparing the European Union sugar prices with world prices in recipient countries traders' observation is that there is unbelievable difference between EU sugar price and world price. Traders estimated that there is a loss of 20 to 30 $/ton if Pakistani sugar does not compete in international markets. Pakistani traders would ultimately be the looser because of high cost of production. To counter competition in export destinations with EU dumped sugartraders suggested that cost of production should be reduced 40 $/ton (Survey Report)
34. In response to a question that what are the restrictions on exports i.e. tariffs, fix quotas and differential tariffs on processed sugar and raw sugar in export destination of Pakistani sugar traders said Pakistan cannot counter competition in international market, until elimination of EU subsidy. Government should reduce taxes on sugar mills to lessen the production cost. In case of reforms in EU/WTO agreements, exporters would try to win the international markets ultimately there would be positive impacts on Pakistan's sugar industry. If subsidies are not removed then situation would be worsened and sugar industry of Pakistan would not be able to facilitate sugarcane growers and employees of industry would become unemployed (Consultation Meeting Report).
5.4 Impact of DSB Decision on Pakistan Sugar Export
35. Responding to field survey conducted exclusively for this study manufacturers reported that they are aware about the decision of Dispute Settlement Body (DSB) of WTO in the favour of Brazil, Australia and Thailand against sugar subsidy provided by EU. Manufacturers think that WTO will not impose any restriction on EU / USA at the beginning of 2006 (new transition period of AoA). Pakistan's sugar industry is not much hopeful with DSB decision. They think Pakistan's sugar industry would continue to be affected adversely because of high in-put cost compared with other countries as they are producing sugar relatively at lesser cost of production. In 2003-04, small quantity of sugar was exported to
57

58
international markets in spite of excessive production and lesser consumption in the country but the Trading Corporation of Pakistan experienced a financial deficit. Until or unless, developed countries withdraw export subsidies, Pakistani sugar would not be competitive in international markets especially in terms of price. Hopefully, an increase in international price would lead to sustainability in future if WTO succeeds to eliminate subsidy of European countries and USA. Then Pakistan's sugar industry will come out of crucial phase of un competitiveness (Survey Report and Consultation Meeting Report).
36. There are several countries in the world, which are self-sufficient in sugar production. In the coming period, the requirement of sugar would increase. In China, all land has been utilized for the cultivation ofgrains and other crops. Thailand or Brazil could compete in international market. Manufacturers informed that government is not providing any production or export subsidy to remain competitive in the international markets. Moreover, government is also not pleading its case at the international forums such as EU or WTO. Government is not taking safety measures for the protection of local industry. Manufacturers suggested that government should provide freight subsidy to reduce cost of export incidentals to minimize fob price. Government can again revive rail-freight subsidy as was provided ten year ago. At that time there was uniformity in rail-freight all over Pakistan. Manufacturers demanded thattariff protection measures should be taken to restrict EU sugar dumping in the country. There should notbe reduction in custom duty from 25 % (Survey Report)

CHAPTER SIX: SUGAR SECTOR IMPACT ON ENVIRONMENT
6.1 Impact of Water Scarcity on Sugarcane
1. Pakistan has suffered from a prolonged drought over the past 4-5 years. The rainfall has been erratic and scanty. The water in dams have reached dead levels. The March and April are the most crucial months when sugarcane is cultivated. Irrigation network in Pakistan diverts 106 MAF of surface water. This system results in huge delivery losses both in canals and in watercourses. The net water supply at farm gate on an average is 62 MAF. The total irrigated area of sugarcane in Pakistan is little over to onemillion hectares. Most of this area is in the Indus basin. Sugarcane is a high delta crop and uses up to 9% of total fresh water.
2. There is shortage of water in the country due to changes in the ecological system. The snowmelt is nominal or non-existent during winter. As a result, the size of rivers has shrunk to mere creeks and many of them have dried up. Deltas are dry. The surface water flows during winter months is only 18% of the annual flows. With this type of flow system, the sugarcane cultivation in Pakistan is largely confined to times of high rainfall/river flows and only through an artificial irrigation network of link canals.
3. The irony is that the availability of water during sugar cultivation period from the reservoirs is generally low and is mainly dependent on surface water flows which are the lowest during cultivation of sugarcane. Major dependence has perforce shifted to exploitation of subsurface irrigation water to meet shortages, mainly in sugarcane growing areas of Punjab and Sindh. Pakistan exploits about 48 MAF of subsurface water aquifer. This is at a huge cost in the shape of investments in energy (electricity/diesel bills). This increase in cost of sugarcane is not generally compensated properly through increase in output returns. This makes the growing of sugarcane crop under such irrigation scheme, a fragile and marginalized farming practice.
4. The recent drought exposed the vulnerability of the vast Indus Basin Irrigation System and underlined environmental issues in lower rivers and the delta areas. Supply options are increasingly approaching their physical limits. Among the supply options, ground water development is already nearing its practical limits.
5. Theoretically, it requires 15 to 20 irrigation waters but reality is different and sugarcane crop requires 25/30 irrigations waters in a season. It requires one hour watering over six acres of land at least after every 15 days. Sugarcane needs irrigation throughout the year thrice a month (Survey Report). In summer season (May to August), watering is required after every ten to fifteen days. Only in case of rain, farmer can skip one watering. Due to scarcity of canal water, this requirement can not be fulfilled. During a field survey farmers reported that major source of water is tube well. Ground water is now about 100 to 150 feet but it is not fit for agriculture and farmers irrigate their fields with a blend of ground and canal water. Even in canal irrigated area, if water is not sufficient for cultivation or due to warabandi farmers have to irrigate their land with the combination of tube well and canal water sources.Farmers have no alternative except to extract water from ground. Without tube wells, irrigation ofsugarcane is not possible (Consultation Meeting Report). Non availability of required water affects the quantity and quality of sugarcane crop and reduces its yield. Director Sugarcane Research Institute, Faisalabad informed that 25% yield is reduced by reduction of 16 inches of water. Tube well water produces the salinity in the soil and within 4/5 years it becomes infertile. During the last decade, sugarcanecultivation remained only 2%. Moreover, drastic changes have been observed in soil composition because brackish water is not good for cultivation/soil (Survey Report). Farmers also informed that they have observed certain type of hardness in the soil and white ash on its surface due to brackish water. Inthe absence of canal water every farmer has put in four to six tube wells in a single murraba (25 acre), so water logging is out of question now. Drought has caused salinity, nutrient leaching and waterlogging. Quality and quantity of sugarcane depends on how much quantity of urea and DAP, farmer puts
59

in his fields. Even after the application of Fertilisers and weeding, farmers cannot give water to almost half crop due to scarcity. Sugarcane would remain shorter and thin due to its scarcity of water. Ground water requires additional doses of Fertilisers. Hence, shortage of water has negative effects on theenvironment of Pakistan.
6. All farmers cannot install tube wells because of high price of electricity and diesel. Moreover, farmers are not getting the required amount of water through canal sources because officials demand bribe to provide canal water. As explained above as there is water crises in the country so it has becomeexpensive. It is priced and farmers have to pay abiana (tax) regularly. The Government has fixed water charges for total amount of landholding, even though farmers are not cultivating the whole land but they have to pay the abiana/tax which is now Rs. 300 to 500 / Acre (including all taxes, local fund). Farmers are getting poison even after spending money on tube well water (Survey Report).
7. Without tube wells, irrigation of sugarcane crop is not possible for a long time. If a farmer was cultivating110 acres few years ago, now he cannot cultivate even 10 acres if he depends upon only his share of canal water. Ultimately, farmers will turn towards wheat because it necessitates two or three waters in a season while to irrigate sugarcane throughout the year water is required twice or thrice a month. Most probably, there would be drastic changes in the cropping pattern in sugarcane area due to water crises and within next couple of year farmers would prefer to grow other crops instead of sugarcane. Farmers have reported to shift sugarcane area to short term crops like maize or pulses, vegetables as alternate crop because in this way they can grow two crops in a single year while sugarcane requires extra water and takes maximum time (18 month) for maturity. In the cotton belt area farmers have concentrated on cotton crop in stead of sugarcane. Few farmers in Sindh and NWFP said that they will continuecultivation of sugarcane, despite water crises as the crop has a fixed price and developed a sense of security among farmers. Its market value in Sindh is better, farmers may get high price but not less thanfixed price. In other crops, there is lot of uncertainty because farmers have to sell their crops tomiddleman. Advantage of sugarcane crop is that it can not be stolen otherwise in Sindh, people steal cotton and wheat from the fields (Survey Report).
8.Demand management through efficiency, productivity, pricing is the only alternative. Waterconservation may be able to add about 10-15% to total supply through improving efficiency of existing irrigation system which is reported to be 40%. As a result of water crises farmers' preference may change in the coming years. His social cost will be unbearable; there will be huge unemployment, rural urban migration and poverty enhancement. Even, if there is a policy change in the world sugar scenarioit will be very difficult for Pakistan to take any advantage. Water is also no more available for the consumption of wildlife forests and living creatures.
6.2 Soil erosion, agricultural chemicals, Silt Run-off from Sugarcane Farms
9. Erosion combined with chemical results in substantial soil loss, followed by seepage of agro -chemically contaminated sediments into bodies of surface water. This is one of the main reasons why the flood plains, rivers and mangrove forests have silted up in the Punjab and Sindh. Wetland drainage, serves to expand monoculture cropping areas at the expense of natural ecosystems. In wetlandssugarcane cultivation, the drastic decline in biodiversity can be attributed to agro chemically contaminated sediments and bodies of surface water and to the unchecked discharge into fields of othercrops of contaminated water.
10. Another aspect, having a far reaching impact on the ecology of bodies of surface water, is the speed with which agro-chemicals and Fertilisers find their way into natural bodies of water.
11. Pakistan counts as one of the largest consumers of agrochemicals worldwide. But in sugarcanecultivation its use is limited to weedicides only. It is pertinent to mention here the impact on environmentoriginating from use of chemical Fertilisers (NPK, special Fertilisers with trace elements such as iron, zinc, manganese, sulphur, boron etc.) and pesticides for weed and pest control (roundup, atrazine Gesapax Cambi etc.) Pesticides are also endangering flora and fauna, especially in zones where they
60

are limited to small areas. Last but not the least, it is essential to point out the precarious situation of theplantation workers who often do not receive adequate instruction in the use of chemicals or the requisiteprotective clothing.
6.3 Silt Runoff
12. Sugarcane crop prevents silt run-off. However, few farmers report hardness in the soil or white ash on the surface. After harvesting, it becomes difficult to grow another crop immediately afterwards. Salt will come out creating salinity and solidity in the soil and ultimately making it barren. Unless use of pesticidein sugarcane area is discouraged, plants and trees are natural barriers for silt run-off (Survey Report).
6.4 Pesticides Uses
13. Scientists don't recommend use of pesticides and weedicides because the chemicals remain in the soil for 45 days. However, small quantity of weedcides is used at initial stages of cultivation to eliminate weeds from sugarcane farms. One time granule application to kill other insects, while spray ofpesticides depends upon situation of the crop if attacked by a disease. At the time of pesticides spray, its elements fly with the wind and damage human health. These elements also absorb in the fodder for domestic animals and indirectly go into human body.
14. Excessive use of water, pesticides and insecticides may cause depletion of soil minerals but it can be stopped with judicious use of water with recommended practices. On the other hand, farmers don't haveenough knowledge about the impact of chemical poisoning on eco-system and they never experienced any kind of silt run-off from sugarcane field as plants and trees are natural barriers for silt run-off. Sugarcane crop almost never requires spray of pesticides hence impact of chemical poisoning and silt run-off is never observed. All farmers reported that they don't spray the pesticides and insecticides but use weedicides in initial phase of the crop (usually one or two times). They use pesticides if the crop is attacked by a disease (Field Survey Report).
6.5 Chemical Fertilisers
15. Chemical Fertilisers affect on the quality of soil. Farmers don't spread natural Fertilisers/animal waste intheir fields because it is not available in the required quantity. Organic Fertiliser is more effective but application of chemical Fertilisers is generally practiced. Consequently, the potential of soil is diminisheddue to excessive use of Fertiliser. It is lessening the productivity of sugarcane. For example, if two bags of chemical Fertiliser are spread in fields for two years then after that period three bags would be required and the following two years Fertiliser quantity will have to increase up to four. It means thefertility of the soil is gradually lessening each year. So only way to overcome the issue of infertility is organic Fertiliser. Moreover fertility is reducing gradually but farmers are trying to apply farmyard and green manuring techniques in maximum capacity. Due to limited application of chemical Fertilisers, its impact is negligible and the sugarcane crop blocks the slit run-off. Hence nutrients do not leach in considerable amount.
16. Now farmers have realized that too much use of chemical Fertilisers has negative effects on quality of soil and ultimately on environment, but they have no choice except to apply organic Fertiliser to overcome the issue of infertility.
6.6 Suffocation
17. Sugarcane crop releases oxygen and consume carbon dioxide, so there is no chance of suffocation. Moreover, labor goes into the fields of sugarcane in winters for sowing, weeding and harvesting and thecrop keep them warm. Even though, farmers take some safety measures while spraying pesticides, for instance, they provide meal before sending them to the fields and provide plastic
61

gloves. In case of carelessness at the time of pesticides/insecticides spray, chemical elements impinge on human body otherwise it does not have any effect on environment and population. Living creatures have been adversely affected because of chemicals used in pesticides and insecticides.
18. Scientists reported that suffocation is never found in sugarcane fields. Chemicals are applied in very small amount and there is no threat of chemical effects or suffocation in sugarcane area. Sugarcane crop does not release the an-noxious gases, it releases oxygen and absorb carbon dioxide so there is no chance of suffocation in sugarcane fields (Survey Report). There is not a single incident ofsuffocation in any surveyed village. Pesticides spray produce suffocation for few minutes in thesugarcane crop. No medical facility is available in the villages although the farmers have a first aid box.Government's Basic Health Unit (BHU), is located away from the village. No road or paved track goes tothe BHU and they never found a doctor or paramedic in the facility (Survey Report).
6.7 Burning of Sugarcane field
19. The fields in sugarcane-growing areas are burned off after harvesting. This causes about 80 to 95% of the foliage to be removed, thus greatly facilitating cutting the stubbles by hand and minimizing cost. Burning of trash and stubbles is helpful for the control of pests for next crop but is a direct loss oforganic matter and even have environmental concern. The large-scale burning of fields initially means heavy smoke and ash causing pollution for the people living in the surrounding areas. Numerousstudies point out the relationship between respiratory tract illnesses and carcinogenic substances in smoke etc. Negative impacts on fauna, including micro-organisms in soils, and the threat to stocks of natural vegetation must also not be forgotten. Sugar cultivation itself is hampered too because, on net balance, the soils suffer a loss of nutrients so the burning of sugarcane fields has a negative impact on the environment.
6.8 Mechanisation in Sugarcane
20. Mechanization is portrayed as a form of ecological modernization. The issue of mechanization is closelylinked to the issue of burning. However, the use of the 17-tonne machines also causes agro-ecological problems, such as soil compaction, impairment of soil, reduced water uptake, increased surface water run-off and strain on the environment as a result of fuels and machine oils as well as water and airpollution.
21. Soil compaction resulting from Mechanization causes particular damage to the roots of the sugarcane plant and hinders the formation of new buds. According to a survey, the plant cycle is shortened from five to three years as a consequence. In contrast to the widely held belief that mechanization helps lower costs, it is about 15% more expensive than manual harvesting.
22. In mechanical cutting sugarcane is separated from the foliage, which in turn suffocates the sugarcane plants. Tests have been carried out in introducing additional step into the process where the plants are uncovered. This offers various advantages in terms of soil ecology. The remaining foliage acts as a moisture-retaining which alleviates soil compaction when vehicles repeatedly drive over the ground.
23. Another use for foliage is to burn it together with the bagasse to generate energy for the processing industry. This solution has aroused increasing interest since the emergence of energy crisis because of the huge energy potential involved.
6.9 Impact of Sugarcane Processing Plants on Environment
24. The most conspicuous problem besetting the processing of sugarcane is the burning of bagasse togenerate energy, as this leads to heavy smoke and soot pollution in the areas surrounding the factories.This air pollution and the smoke produced by burning in the fields use high level of respiratory tract
62

diseases in children in the sugarcane centres. Modern plants have been able to achieve considerable improvements in this respect through new combustion technologies and filter installations. However, there are still a large number of old plants.
25. A great deal of bagasse is produced in sugar manufacturing (residue of sugarcane extraction). Many factories use their boilers as refuse-incineration plants to dispose of the bagasse but without harnessingthe energy released. The 2001 energy crisis has created a strong lobby pushing for greater use of bagasse to generate electricity and thus enhance energy efficiency levels in the production process.
26. Although much progress has been achieved in terms of environmental protection in day-to-dayoperation, the industrial process continues to cause environmental problems. For example, the process water at a high temperature is often pumped into the nearby farms.
27. Production process of sugar discharges four major components like waste water, bagasse, filter cake (mud) and molasses. There are several other methods of utilization of bagasse but mills burn it in the kiln and shifts to furnace for energy production. Mud is a very precious element and source to restore fertility of soil. Unfortunately, some mill owners sell it to brick line and they burn it off. Few Sugar Mills are intended to convert it in composed Fertiliser. Mud (filter cake) to the farmers is a powerful organic Fertiliser for their farms. Waste water disposed off for irrigation purposes. It irrigates the surrounding area and no chemical elements are found in the water. The process releases smoke through smokestack but mills has installed ash-arrester in the chimneys. Mills have taken safety measures to avoid effects of waste / hazards such as water treatment and proper burning of elements. Mills consider as industrial by-products because bagasse can be used in the production of ply wood, chip board and other furniture accessories. Molasses does not create any kind of environmental pollution. Some of the mills sell it to their down stream industries for the production of alcohol in distilleries. Distillery plants effluent is stillage that is rich in plant nutrient i.e. potassium and micronutrient but if not managedproperly it creates lot of pollution. Filter cakes are used to enrich the soil as organic Fertilisers. Smoke produces the carbon dioxide and ash while plants and trees absorb the carbon dioxide and other ash contents. So there are insignificant environmental hazards.
28. Mills always quantify the waste and provide the statistics to the government every year. During the season waste can be quantified as Waste Water: 0.25 cusic/ hour and 0.01 cusic/ hour. In off season mills vend rest of the wastages. The process produces bagasse 30 - 32% and mud 3% of total cane. Mills reported that there are no environmental effects because the mills release the smoke after appropriate burning of all elements. For instance, burning of bagasse produces carbon dioxide and it plays an important role in weather warming. The carbon dioxide is a considerable stimulant for sugarcane crop. In short, waste of sugar industry makes a substance biological cycle. Sale of by-products depends uponmarket rate but it contributes 3.5 to 5% per annum in the overall income of the mill (Survey Report).
29. Mills are well aware of the environmental issues. They claim that it is not due to mills but because of other reasons. The cities are expanding to an alarming rate even to the out skirts of the cities. In this way the mills which already exist there come in close proximity with the residential areas. Thus people are forced to bear pollution created by the mills. The biggest reason is the expansion of cities in the adjoining areas. Sugar mills always played a vital role in the socio-economic uplift of the area. The paceof economic growth is surprisingly increased, wherever the sugar mills are located. Farmers, mechanics, labour, oil merchants and other professionals of the area, have directly/ indirectly benefited from the economic activities of the mill.
30. The Government collects a) Market Committee fee, b) Road Development Cess but not providing any kind of facility. Growers and manufacturers both pay surcharge for Road Development Fund. Now the District Government has taken its up management. The Sugarcane Development Cess Fund was introduced in 1964 and its rules were declared. It was written in its act that funds will be used especially for plant protection purposes. If the crops in the area are attacked by some widespread disease then it is not possible control the disease. There are several techniques to control the disease like biological, chemical and mechanical control. Therefore cess fund can be used for these purposes. Unfortunately, the funds are never utilized for the approved functions, particularly to control environmental hazards.
63

CHAPTER SEVEN: RECOMMENDATIONS FORSUSTAINABLE SUGAR PRODUCTION IN THE PRESENT AND FUTURE SCENARIO
1. According to FAOSTAT data base of United Nation Food and Agriculture Organisation (FAO), more thanone hundred countries produce and export sugar. The government of each country intervenes in domestic markets and industries in a way suited to its situation. Some interventions relate to price-neutral, others distort demand-supply equation of the world market. These practices strike disequilibrium between cost of production and global prices, encouraging dumping of unwanted surpluses. As a result,normal demand-supply interaction setting price line gets outmatched. Sugar trade at world market pricesbelow the cost of production is an important issue. Firstly, countries wholly dependent on imports can buy their sugar cheaply and have no reason to complain. Secondly most countries that are fully self-sufficient or not shield their industries from low world prices by high trade barriers are suffering fromdumping. Thirdly, producers in some countries with surplus production enjoy export subsidies, mitigatingthe problem. Hard hit by low world prices are those with small domestic markets, without access topreferential markets and without export subsides.
2. Export subsidies remained the most distorting practice in world sugar trade and were mostly paid in high-cost countries, which created exports that would otherwise not be profitable. Many governments evidently value the welfare of producers more than the welfare of consumers and taxpayers. It isevident from the EU existing trade policy regime that the EU is illegally dumping millions of tonnes of
subsidized sugar on world markets and destroying the livelihoods of poor farmers of developingcountries. One the other hand, inefficient EU sugar producers receiving three times the price compared with the farmers of developing countries are distorting the world market in the process. The EU exports up to 5 million tonnes of sugar each year despite commitment as part of the Uruguay round of trade to reduce its subsidized exports to just over one million ton. The EU dumping has depressed world prices and led to foreign exchange losses to the sugar exporting developing countries. Sugar export market environment at global spectrum holds characteristic of extreme competition in price. As a result, all the sugar-exporting countries invariably arrange subsidy for success in exports. In this pursuit all theleading sugar producers, such as the European Union (EU), USA, Brazil, Cuba, Thailand, and India are involved. Pakistan sugar sector is suffering from dumping of EU sugar export and domestic support subsidies, and is unable to compete in the international market at the time of sugar surplus.
3. It is true that the government of Pakistan has neither extended similar support in sugar export norprotected sugar industry from dumped import. However, on international front Pakistan is member of G 20 countries and pressurizing EU and US for complete elimination or phasing out of export subsidy, reduction in domestic support and expansion in market access through reducing tariff peaks and tariff escalations. New frame work of WTO agreement on Agriculture has been agreed and modalities yet to be decided. It is suggested that Pakistan should ask for the following measures to be taken by EU and US.
a) The EU should reduce protection by increasing its import quotas, lowering its intervention price; phase out its exports subsidies. Double its import quota by 2012 that would increase the representative world price by 3.0%; decrease the EU producer price by 9.2 per cent; and decrease 2.4 million tonnesproduction quotas.
b) The US should reduce protection by increasing its import quota; lower its loan rate; decrease market allotments. Doubling of its import quota by 2012 would increase the representative world price by 4.6%; decrease the US producer price by 8.7% or require forfeitures to the Commodity Credit Corporation; or a 1.2 million ton decrease in market allotments.
c) Japan should decrease protection by lowering its import levies and surcharges; and lower deficiency payments to growers. A halving of Japan import charges by 2012 would increase the world by an estimated 3.7% and decrease the Japanese refined sugar producer price by around 35%.
64

4. Sugar import ought to be restrained during the processing period, that precise shortfall should be assessed in consultation with the sugar industry, enabling identifiable volume and its time sequence for import. This is important as sugar exporters provide huge subsidy. This means obviously dumping by the major players. In this area developed countries are taking advantage as they can afford and adopt both liberalism and liberty to resort to such practice which they resist and ask from developing countriesto stop. Sugar exports are invariably managed through subsidy in order to enter export field, have a firmfoothold and persistently put up perfect performance in its highly competitive sphere, prudent policy framework, extending support by structural network must be put in place. Pakistan has been an unpredictable player in the global sugar trade arena. Despite holding potential to produce more sugar involume than its domestic requirement, it has been a net importer of sugar. Pakistan must create a predictable situation of surplus sugar so as to meet demand of regional countries. Attractive potential existsin the adjacent countries of South, East and Central Asia to which it has an easy access.
5. Unfortunately, Pakistan's sugar industry has been griped and grinded by complexity of problemsemanating from apathy and overlook at the one end by the government and on the other by the industryitself. The dilemma of sugar industry is characterized as:
a) Poor quality and lower volume of sugarcane,b) Under utilisation of industrial capacity,c) Sugar production not on a steady upturn,d) Marginalizing the scope of economies of scale,e) Problems persisting in all 'seasons' by shortfall or surplus sugar production, andf) Dominant cost/price disequilibrium in domestic and export markets.g) No built in safeguards to prevent disruptive impact on the national sugar economy in events of surplus
or shortage.
6. In fact absence of a definite policy framework disrupted the whole sugar sector in the country. A precise policy format in managing the national sugar industry on lines to ensure a sustainable future needs to be formulated. There is a potential in national sugar industry which needs to be explored and itsoptimum achievement needs fine tuning of the policy framework, with enabling supportive structure. Combining of the two is prerequisite for the efficient outcome. Its result would prove duly rewarding, by accelerating economic growth of Pakistan. High potential and inconsistent trend in its achieving arefairly evident from the sugarcane processing capacity vis-à-vis actual utilization and sugar production over the past decade. This gives an unsatisfactory reading.
7. Fluctuations in operating efficiency scale underscore casual treatment to the sugar sector. Thistendency requires attention so as to address intricacies and get solution online ensuring steady upswingperformance. The crushing capacity figures given in first chapter represents an unstable trend anddefy course to be of distinctly steady growth which is imperative for to compete in the internationalmarket. Situation in Pakistan fared the worst, particularly over the past three year, being lowestoperating efficiency. The potential of sugar industry deserve for self assessment to achieve economic rate of return, operate at reasonable level, leaving no capacity idle.
8. Cost of sugar production represented a rising trend. Major critical component in it has been the price of sugarcane, compounded by effective high at 18% rate of sales tax. On these counts, the sugar industry had no control to contain. Sugarcane price influence on the cost of sugar production and trend of wholesale price of the sugar industry vis-à-vis its adverse influence on economic viability gauged from the representative data of the past six years.Cost of sugar production per ton during the past five years, 1997-98 to 2002-2003, ranged from Rs.11,467 to Rs.20,332 i.e. an average increase of 12.88%. In the same period, cost of sugarcanefluctuated from Rs.9.09 to Rs. l 1.68, an average increase by 5.69%. Cost of other components in sugarproduction could be contained by the sugar industry to a limited extent due to various factors, including inflationary trend in the national economy.
9. Average wholesale sugar prices, excluding sales tax in the range of Rs. 14,840 to Rs.20480 per ton. However, the price has steeply declining trend. Fall in prices escalated and in three years at a stretched dropped by Rs.4970/ton from Rs.20,480/ton of 2000-01 to
65

Rs.15510/ton for 2002-03. Sugar industry's plight is attributable to high incidence of sugarcane price in cost of sugar production plus high incidence of sales tax.
10. The key issue is potential of increasing sugarcane through yield as it will enhance operating efficiency of the sugar industry. Inconsistency dominates sugarcane crop cultivation and sugar production and trade. As a result, Pakistan faced contrasting trends, of short and excessive or some time low sugar production during the past decades.
11. The sugarcane is the basic and only raw material of producing sugar as sugar beet is not cultivated in Pakistan at large scale. The raw material requirement of sugar industry comprising 76 sugar mills, with crushing capacity of about 350 thousand tonnes per day has been met through expanding acreage under sugarcane. This demand-led horizontal expansion in cane production, which not only resulted in extension of sugarcane cultivation to marginal areas but also aggravated the water shortage. Sugarcanea high water delta crop poses serious competition to other important crops: cotton, rice, wheat, etc. Thus, further expansion in sugarcane area already spanning over one million hectares, given therecurring water shortages and the increasing demand for water from other crops and non farm uses is no more a viable option. With the increasing requirements of other food and cash crops to meet the ever expanding demand from burgeoning population, it is of utmost importance to increase theproductivity of resource use in agriculture through all the possible means.
12. Monetary gains of sugarcane crop can be achieved through enhancement in sugarcane yield. It isfarmers' domain to excel and serve its own and national interests. Sugarcane yield and sugar recovery of Pakistan has not been up to the mark. On the basis of available evidence, there exists a vast scope for the improvement in yield of cane and its sucrose contents through improved crop management as well as its processing. Exploiting the scope at best shall be corrected and a rational approach to secure gains should be adopted. Pakistan at present does not compare favorably on both these counts with other cane producing countries. In terms of average cane yield, Pakistan ranks 15 in the world.
13. National sugarcane yield for the past one decade fared between 43 to 48 tonnes per hectare. Theprogressive cane farmers in Pakistan usually harvest around 45 tonnes of sugarcane per acre while theaverage farmers do not go beyond 20 - 25 tonnes. This sits at the lowest rung among the mainsugarcane cultivating countries. The potential of existing cane varieties under optimal conditions of inputs use is 50 tonnes or so. Australia obtains 5 tonnes of sugar per acre against 1.7 tonnes of Pakistan. Research people are positive on achieving average yield of 72 tonnes/hectare by supervised cultivation. Yield can be raised further to 90/110 tonnes per hectare by varietals development.
14. Potential to improve sugar recovery to 10/11% by rich varieties of sugarcane also exists. Higher yield and recovery on the given 1000 thousand hectares would impressively increase sugarcane and sugar production volume. Imaginative plan for sugarcane production by supervised and well-managedcultivation culture is a challenge that must be resolutely responded. A mid-term plan to attain reasonablyincreased sugarcane yield be devised. Syndrome of high cost of sugar production, a legacy of theexisting structure, needs to be addressed by evolving a result-based strategy.
15. The development of new varieties of sugarcane is a lengthy process requiring primarily the sugarcane fuzz either through its local production or imports from abroad. The poor infrastructural support for breeding work and climatic conditions in the country except in few areas not permitted the former. Moreover, the cane breeding programme has been quite limited and confined to a few centres. Theprogramme is also constrained due to insufficient funds and land resources. Considering the financial constraints of Sugarcane Research Institutes, the Sugar Board in its 39th meeting held on 17th August 1992 decided that provincial governments should set aside 5 per cent of the cess fund for research and development of sugarcane. Since then ECC of the Cabinet in its annual meetings for sugarcane has been directing the provincial governments for the implementation of the above decision but except release of a few lacs of rupees by the government of NWFP allocation of cess fund for cane research development has been confined to paper work. It is also suggested that the research stationsconcerned with varietal development should be strengthened and their research programmes monitoredand reviewed periodically.
66

16. Importance of research and development in sugarcane crop and its multiple benefits have beentrumpeted for a long time. It is high time to create committed structure and get it click to yield 72 tonnes/hectare and sugar recovery at 11 %. This key work deserves to be taken up expeditiously. Sugarcane production in the country during the past seven years denotes fluctuations, defeating designs in stability and sustainable growth. Measures have not given outcome matching with thepotentials. Increasing yield consistently has been elusive in effect.
17. Efficient institutional network for sugarcane research be set up in each division. Board of each such institute may consist of three representatives, one each of sugarcane growers organization, PSMA and government functionary, each having inclination for sugarcane research and development. Coordination among Sugarcane Research Institute (SRIs) be arranged to prevent overlapping of functions and topromote sharing of experiences and know-how by process of mutual consultations. Working by the SRIs(Sugarcane Research Institutes) in coordination with sugarcane growers and sugar mills in each province will break the grounds better and reap the results rapidly.
18. Sugarcane cess fund accounts of their past collection and the balances are shared with its contributing entities. Proper research work is bound to improve yield which shall propel more fund generation in the process. Sugarcane growers and sugar industry would have no hesitation in making the contribution, once it is proved to be serving their economic interest.
19. A careful planning preceding each season on sugar production is sine-quo-non for smooth marketing of sugarcane as well as sugar. It has become crucial due to (a) four month short sugarcane processing campaign contrasted by (b) long duration of sales and supplies of sugar for a year and above, (c) sugar surplus countries subsidizing exports liberally, (d) inability of developing countries like Pakistan to resist dumping, lest that be eliminated, and (e) need to strike proper equation in cost of sugarcane and sugar production and their sale prices, which can serve national economic interests and is also profitable for the stakeholders.
20. It is one of the main cash crops of Pakistan and has a large impact on the well being of ruralcommunity. Due to perishable nature, it cannot be stored after its harvesting and has to be processed into sugar by the sugar mills. Farming community cannot pay much attention to improve yield of sugarcane only because of resource constraints. Due to the liquidity problem of the sugar industry farmers were not paid price of their produce and that is why they are unable to improve farm managementpractices through judicial use of farm inputs. Their purchasing capacity of inputs was restricted due to delayed payments.
21. In the beginning of the season, the payments are generally made within two weeks but as the season progresses to the end, the payments are delayed by months and in some cases by seasons. The mills are of the view that this happens due to liquidity problem. Thus, there is a need to enhance the liquidity of the sugar mills by lifting sugar at a certain pre-determined price by the public sector and after that if payments are not made then penalties on late payments as laid down in the Sugar Factories Control Actshould be imposed.
22. It has been noticed that mills are making deductions on the plea that poor quality cane with high trash elements is being brought by the farmers. In some places, these deductions go up to 10 per cent. For the betterment of the situation, the growers are needed to properly clean the trash before supply to mills, on one hand and to put some check by the Cane Commissioners against such high undue deductions, on the other hand.
23. The presence of middlemen is considered necessary in marketing the agricultural produce. But sincemanufacturing of sugar is a chemical process, the presence of middlemen in sugarcane supply to the mills causes delay and hence reduction in sugar recovery. The middlemen, therefore, in sugarcanemarketing do harm to the mills and the growers. Thus, the elimination or involvement of middlemen in sugarcane supply needs to be channalised in proper marketing form.
24. Since some of the mills delay the payments, the growers are compelled to sell the Cash Price Receipt (CPR) at discount ranging from Rs 2 - 5 per 40 kgs of cane price. This practice causeshuge losses to the growers. Therefore, it needs to be stopped altogether or margin
67
68
should be restricted to Rs 1 per 40 kgs only. Moreover, the mills should also be compelled to make payments within two weeks after cane delivery as laid down in the Sugar Factories Control Act so that the need for selling the CPRs is minimized.
25. The provincial governments collect and maintain the accounts of sugarcane cess funds. The cess fund is to be utilized for the construction of new roads and improvement of the existing ones and link roads including other infrastructure in the area. The fund can also be utilized for research and development of sugarcane crop. The provincial governments are known to have accumulated huge amounts of cess funds which need to be properly used on construction of infrastructure and evolvement of new varieties of sugarcane.
26. The under weighment of cane is a common phenomenon on the part of mills and their agents and the private purchase centres. The scales and weighbridges installed at the procurement centres do not record the correct weight. The extent of under weighment varies from place to place and for each mill. The growers have alleged that under weighment was upto the extent of 10-20 per cent of weight or about 40-50 maunds per trolley load of 350-450 maunds. The district governments may install their own weighbridges to solve this problem and ban the use of temporary weighbridges at purchase centres.
27. The sugar mills function under the provisions of the Sugar Factories Control Act, 1950. Many changes have occurred in cane marketing after de-zoning and the functioning of the Act has become lesseffective. So there is a need that the Act may be amended in accordance with the current needs,especially the promotion of the provisions of the contract system between growers and the mill and the removal of provisions regarding prohibition of gur making and zoning etc. The bonds of bindings, brokenby poor pursuit of de-zoning of 1988, needs to be rebuilt, if not on other extreme of zoning then by a balanced measure of some sound arrangement in between the two extremes. Modalities for it can be worked out by meticulous, meaningful and material consultations.
28. 28 In view of the falling trend in the world prices of sugar and large-scale investments in the domestic sugar industry,y it is imperative to improve the efficiency of resource use in sugarcane production and its processing. For improving productivity in sugarcane cultivation a number of steps have been discussed in this Report. For improving the productivity in sugar processing the requirement is not only to improve the efficiency but also value addition through vertical integration. It is understood that sugar hasbecome a by-product in many of sugar producing countries as the revenue accumulated from the sale of other products manufactured from the molasses and bagasse have out paced the revenue from the sale of sugar. In the wake of fast approaching globalization and WTO requirements the sugar industry ofPakistan which relies on sugar manufacturing only and has not paid much attention to the production of other value added products, would also have to go into value adding business. The likely products which can be manufactured form the molasses include alcohol, citric acid, lysine, monosodium glutama,liquid sugar, yeasts etc. While bagasse can be used in the production of chipboard, paper compressed fiber and even electricity.

Bibliography
1. Annual Report, 2003: Pakistan Sugar Mills Association .Islamabad.
2. Annual Report, 2003: Pakistan Sugar Mills Association .Sindh Zone.
3. Annual Report, January 2004: Price policy for sugarcane 2004- 05 crop.Agricultural Prices Commission, Government of Pakistan, Islamabad.
4. Annual Report, March 1999: Price policy for sugarcane 1999-02 crop.Agricultural Prices Commission, Government of Pakistan, Islamabad.
5. Report, October 1995: Cost of production of sugar. Agricultural Prices Commission, Government of Pakistan, Islamabad.
6. Report, June 2003: Sugar and Sweetener “Situation Outlook Yearbook” USDA.
7. Report, October 2002: Economic, social and ecological impacts on Brazil of accelerated liberalization of the European Sugar Market, FIAN International.
8. Brief, August 2004: Sugar Stock’s Position and Production Estimates for the year2003-04 and 2004-05Ministry of Industries, Government of Pakistan, Islamabad
9. Brief, 2004: Sugar Sector ProfileExport Advisory Cell, Ministry of Industries Government of Pakistan, Islamabad.
10. Ellen Haun Niemi, and MinnaTeivonen. Pressure for Reforms in the EU Sugar Regime due to the next WTO round on Agriculture and the enlargement of EU,
Economic Research (MTTL) August 17th 2001 Helsinki.
11. Iskander M Khan, July 2004: Sugar Industry Position Clarified Dawn EBR
12. Dr. Omar Khan, 20th May 2003: Over Protected Sugar Industry , Dawn EBR.
13. Syed Shahid Husain, August 17th 2004: Government Acing as Sugar Industries Marketing Board,Dawn EBR
14. Press Information Oxfam and WWF Sugar Media Briefing, July 13th 2004.
15. Elizabeth Guttenstein, August 4th 2004: EU Sugar Subsidies Ruled Illegal by WTO Panel.
16. Laurance Frost, August 3rd 2004: European Sugar Producers Brace for Ruling by WTO on Export Subsidies, Associated Press.
17. FAO, 2003: World Sugar Production Report
18. Press Brief, 2003: EU Commission open discussion to Reform EU Sugar Regime.
19. Press Brief, 2004: US DA Sugar Policy.
69

20. Press Brief, February 2004: Sugar European Union Regime
21. Press Brief, August 2004; EU’s Sugar policy not best for Environment
22. Jeremy Smith, August 26, 2003: Article, EU to tackle sugar subsidies,
Data Sources
1. Federal Bureau of Statistics for various years.
2. Pakistan Sugar Mills Association Annual Report.
3. Pakistan Central Board of Revenue.
4. Pakistan Sugar Mills Association Sindh Zone Annual Report.
5. Pakistan Economic Survey 2002-2003.
6. Agriculture Sense Organization.
7. Agriculture Prices Commission.
8. Export Advisory Cell.
9. European Commission Directorate General for Agriculture.
10. Statistical Bulletin, International Sugar Association (ISA).
11. European Sugar Journal.
12. Food and Agriculture Organization (FAO).
13. Pakistan Sugar Journal.
70

Annex I: Area, Yield and Production of Sugarcane
Years Punjab Sindh NWFP Balochistan Pakistan
Area (000 Hectares)
1993-94 596.2 265.8 100.3 0.5 962.81994-95 656.7 249.7 102.1 0.5 10091995-96 605.6 254.4 102.5 0.6 963.11996-97 604.2 251.2 108.4 0.7 964.51997-98 685.3 261.6 108.6 0.7 1056.21998-99 780.3 270.8 103.3 0.7 1155.11999-00 672.1 230.6 106.3 0.8 1009.82000-01 615.5 238.8 105.9 0.6 960.82001-02 656.8 240.7 101.5 0.7 999.72002-03 735.3 258.6 104.9 0.8 1099.62003-04 686.3 259.9 104.2 0.4 1050.8
Yield (Tones per Hectare)
1993-94 41.1 58.0 44.6 50.2 46.11994-95 43.0 57.3 44.7 55.8 46.71995-96 44.4 54.0 44.7 49.2 47.01996-97 39.7 52.2 44.7 51.4 43.51997-98 46.9 61.2 45.6 53.6 50.31998-99 42.8 63.0 45.7 54.4 47.81999-00 40.3 62.0 46.3 54.3 45.92000-01 43.4 50.5 45.2 53.7 45.42001-02 48.4 47.4 47.2 50.0 48.12002-03 45.1 53.4 48.1 50.8 47.32003-04 48.5 54.7 48.5 47.5 50.0
Production (000 Tones)
1993-94 24510.8 15421.0 4470.1 25.1 44427.01994-95 28268.0 14310.3 4562.2 27.9 47168.41995-96 26880.0 13737.2 4583.0 29.5 45229.71996-97 24010.2 13110.6 4841.6 36.0 41998.41997-98 32110.6 15999.6 4956.5 37.5 53104.21998-99 33382.8 17050.7 4719.5 38.1 55191.11999-00 27081.3 14290.8 4917.1 43.4 46332.62000-01 26740.0 12049.7 4784.4 32.2 43606.32001-02 31803.1 11416.3 4787.2 35.0 48041.62002-03 33168.6 13797.6 5049.0 40.6 52055.82003-04 33297.2 14218.3 5050.1 19.0 52584.6Source: Agricultural Prices Commission, MINFAL, Pakistan
71

Annex 2: Highly Protected Tariff Structure in Sugar Exporting Countries
Crop year (a) 95/96 96/97 97/98 98/99 99/00 00/01 01/02 02/03 03/04 04/05
ARGENTINATariff, sugar ARS/t 35 35 35 35 35 35 35 35 35 35BRAZILTariff, raw sugar % 55 52.8 50.6 48.3 46.1 43.9 41.7 39.4 37.2 35Tariff, white sugar % 80 75 70 65 60 55 55 45 40 35CANADATariff, raw sugar CAD/t 27.7 27 26.3 25.5 24.8 24.1 24.1 24.1 24.1 24.1Tariff, white sugar CAD/t 40.6 39.6 38.5 37.5 36.5 35.4 35.4 35.4 35.4 35.4CHINATRQ sugar kt 1,680 1,680 1,680 1,680 1,680 1,680 1,680 1,764 1,852 1,954Tariff, in-quota, raw sugar % 20 20 20 20 20 20 20 20 20 15Tariff, in-quota, white sugar % 30 30 30 30 30 30 30 30 30 20Tariff, over-quota % 75 75 75 75 75 75 75 75 75 50EU Intervention price, white sugar Euro/t 632 632 632 632 632 632 632 632 632 632Total quota, white sugar (c) kt rse 17,241 17,241 17,241 17,241 17,241 16,675 17,110 15,742 15,498 15,742from A quota kt rse 13,053 13,053 13,053 13,053 13,053 13,053 13,053 13,053 12,929 12,929from B quota kt rse 4,187 4,187 4,187 4,187 4,187 3,622 4,057 2,688 2,569 2,813Subsidised export limits EU15 kt rse 1,556 1,499 1,443 1,386 1,330 1,274 1,274 1,274 1,274 1,274EU15 000 Euro 733,100 686,300 639,500 592,700 545,900 499,100 499,100 499,100 499,100 499,100EU10 kt rse 334 294 260 225 191 157 157 157 157 157EU10 000 Euro 49,157 46,391 43,625 40,859 38,092 35,326 32,560 32,560 32,560 32,560Tariff, raw sugar Euro/t 410 396 382 368 354 339 339 339 339 339Tariff, white sugar (b) Euro/t 507 489 472 454 437 419 419 419 419 419INDIAIntervention price, sugar cane INR/t 425 459 485 527 561 595 620 645 750 750INDONESIATariff, white sugar % 108.5 107 105.5 0 0 25 25 25 25 25JAPANMinimum stabilisation price, (RS) JPY/kg 140 143 146 143 152 152 152 152 152 152Tariff, raw sugar JPY/kg 82.4 80.3 78.1 76 73.9 71.8 71.8 71.8 71.8 71.8Tariff, white sugar JPY/kg 118.3 115.2 112.2 109.2 106.1 103.1 103.1 103.1 103.1 103.1KOREATariff % 23.1 22.6 22 21.4 20.9 20.3 19.7 19.1 18.6 18MEXICOMexico common external tariff, (RS) MXN/t .. .. .. .. 3,328 3,209 3,689 3,809 4,247 4,341Mexico common external tariff, (WS)MXN/t .. .. .. .. 3,517 3,376 3,689 3,809 4,247 4,341RUSSIATariff, raw sugar (d) % 7.1 6.6 6.2 5.7 5.3 40 40 60 114.3 153.6Tariff, white sugar % 28.2 26.4 24.6 22.8 21 40 40 50 108.5 144.2TRQ, raw sugar kt rse .. .. .. .. .. 3,650 3,650 3,650 3,950 0UNITED STATES (b)Loan rate, cane sugar USD/t 397 397 397 397 397 397 397 397 397 397Loan rate, white sugar USD/t 504.9 504.9 504.9 504.9 504.9 504.9 504.9 504.9 504.9 504.9TRQ, raw sugar kt rse 2,145 2,075 1,578 1,143 1,113 1,117 1,117 1,117 1,117 1,117TRQ, refined sugar kt rse 22 22 22 22 22 22 22 22 22 22Raw sugar high tier tariff , over quotaUSD/t 388 379 369 359 349 339 339 339 339 339White sugar high tier tariff , over quotaUSD/t 410 400 389 378 368 357 357 357 357 357a) Beginning crop marketing year - see the Glossary of Terms for definitions. b) Price based special safeguard actions apply. c) Includes the 10 new member countries from May 2004. d) Assumes a wholesale price target of USD 470 per tonne as the basis for setting the floating tariff duty. The source for tariffs (except United States and Russia) is AMADThe source for Russia and United States tariffs is ERS, USDA.
72

Annex 3: Import of Sugar in Pakistan
Quantity in MT, Value in 000 $
UV in $/MT
Country 95-96 96-97 97-98 98-99 99-00
Q V UV Q V UV Q V UV Q V UV Q V UV
Total EU 6788 3145 463 60590 22108 365 18542 6737 363 3674 1265 344 6666 1908 286Austria (6) 3299 1525 462 366 130 354 39 14 367
Belgium (8) 327 153 469 3194 1270 398 24 9 365 21 8 395 0 0
Denmark (2)
France (6) 862 380 441 19591 6561 335 3377 1233 365 176 61 346 161 45 278
Germany (9) 2165 1022 472 6960 2927 421 4398 1743 396 3298 1128 342 4585 1377 300
Ireland (1) 51 24 467
Italy (3) 12 3 259
Netherlands (7) 44 22 498 2323 811 349 1403 302 215
UK (8) 40 18 461 30833 11347 368 8054 2811 349 179 68 382 478 169 355
Total Other 108 55 510 750740 271958 362 128922 45121 350 6985 1933 277 60013 12964 216
Australia (1) 323 114 354
Bangladesh (1) 1 340
Brazil (4) 152607 57292 375 12500 4023 322
Central America NS (1)China (4) 110986 44028 397 63877 22674 355 38554 8252 214
Dubai (9) 108 55 510 6695 2510 375 861 326 379 501 115 230 21414 4696 219
Guinea (1)
Hong Kong (2) 2893 1113 385
India (5) 374036 129488 346 36685 12896 352 6379 1779 279
Indonesia (1) 21 8 393
Lebanon (1)
Malaysia (7) 26 10 368 63 23 369 45 15 338
New Zealand (1) 20 8 385
Poland (1) 6500 2381 366
Saudia Arabia (1) 93 35 380
Sharjah (1)
Singapore (20 2000 735 367
South Africa (2) 1050 366 349
Swaziland (1)
Switzerland (1)
Thailand (3) 94930 34376 362 13600 4710 346
USA (4)
Japan (4) 14 5 362
Total World 6896 3200 464 811330 294066 362 147464 51858 352 10673 3204 300 66679 14872 223Source: Federal Bereau of Statistics Page 1
73

Annex 3: Import of Sugar in Pakistan
Quantity in MT, Value in 000 $UV in $
Country 00-01 01-02 02-03 03-04Q V UV Q V UV Q V UV Q V UV Average
Total EU 70744 19934 282 6638 2075 313 8377 2757 329 10178 3066 301 339
Austria 10 4 370 24 7 298 944 312 331 364Belgium 11398 3367 295 22 7 309 215 85 396 279 112 403 379
Denmark 212 56 265 350 119 341 303
France 974 262 269 339Germany 15872 4588 289 5242 1651 315 6134 2003 327 8390 2519 300 351
Ireland 467
Italy 495 144 290 473 143 302 284
Netherlands 6809 2002 294 1000 290 290 86 21 246 339 96 283 311
UK 35469 9652 272 503 192 381 697 195 280 356Total Other 1384558 369256 267 78823 21932 278 4070 1241 305 6169 1733 281 316
Australia 354
Bangladesh 340
Brazil 374467 100765 269 500 117 234 300
Central America NS 21000 6083 290 290
China 203936 49577 243 302Dubai 168466 44643 265 10391 2985 287 3877 1170 302 6148 1726 281 316
Guinea 500 129 257 257
Hong Kong 7680 1993 259 322India 323927 92593 286 67722 18752 277 308
Indonesia 393
Lebanon 345 87 252 252
Malaysia 436 141 323 210 78 372 193 71 370 21 7 325 352
New Zealand 385
Poland 366
Saudia Arabia 380
Sharjah 69 18 257 257Singapore 2500 770 308 338
South Africa 128820 34031 264 306
Swaziland 3000 732 244 244Switzerland 24700 6255 253 253
Thailand 124712 31441 252 320USA 161 48 295 191 102 532 100 26 263 114 21 181 318
Japan 105 58 552 2 1 366 2 1 709 498
Total World 1455568 389296 267 85654 24109 281 12549 4026 321 16461 4820 293 318Source: Federal Bereau of Statiistics Page 2
74
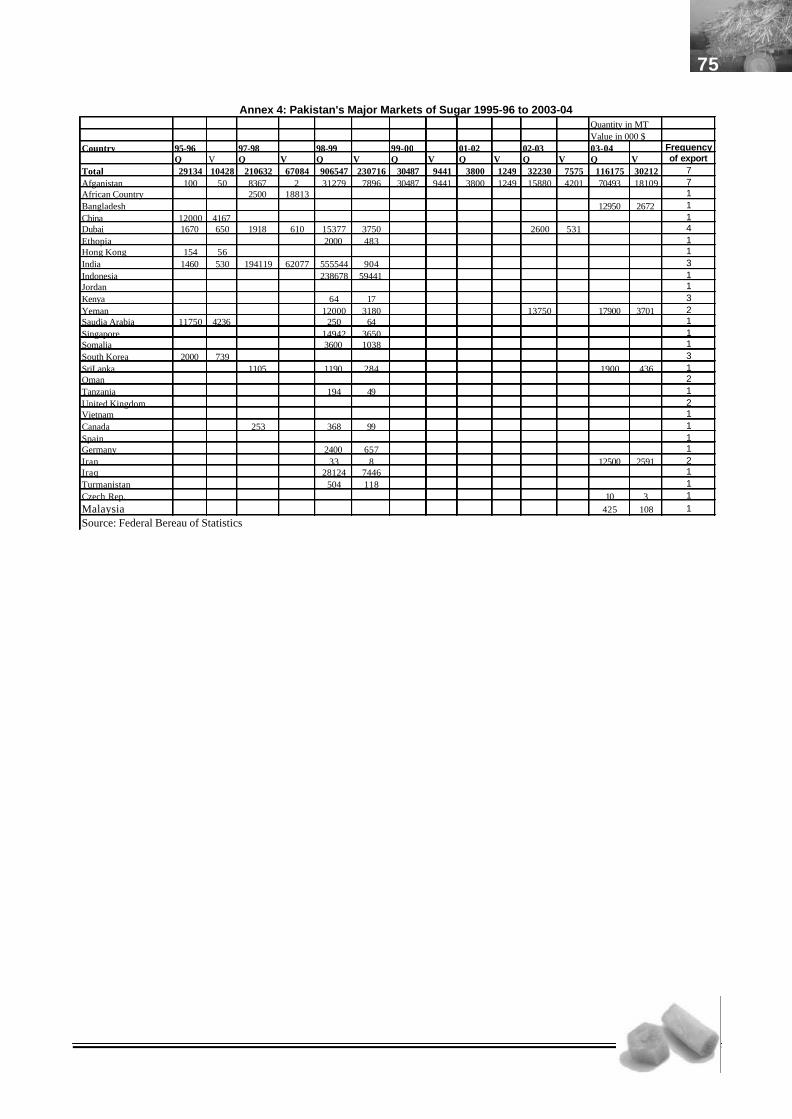
Annex 4: Pakistan's Major Markets of Sugar 1995-96 to 2003-04Quantity in MTValue in 000 $
Country 95-96 97-98 98-99 99-00 01-02 02-03 03-04 FrequencyQ V Q V Q V Q V Q V Q V Q V of export
Total 29134 10428 210632 67084 906547 230716 30487 9441 3800 1249 32230 7575 116175 30212 7Afganistan 100 50 8367 2 31279 7896 30487 9441 3800 1249 15880 4201 70493 18109 7African Country 2500 18813 1Bangladesh 12950 2672 1China 12000 4167 1Dubai 1670 650 1918 610 15377 3750 2600 531 4Ethopia 2000 483 1Hong Kong 154 56 1India 1460 530 194119 62077 555544 904 3Indonesia 238678 59441 1Jordan 1Kenya 64 17 3Yeman 12000 3180 13750 17900 3701 2Saudia Arabia 11750 4236 250 64 1Singapore 14942 3650 1Somalia 3600 1038 1South Korea 2000 739 3SriLanka 1105 1190 284 1900 436 1Oman 2Tanzania 194 49 1United Kingdom 2Vietnam 1Canada 253 368 99 1Spain 1Germany 2400 657 1Iran 33 8 12500 2591 2Iraq 28124 7446 1Turmanistan 504 118 1Czech Rep. 10 3 1Malaysia 425 108 1
Source: Federal Bereau of Statistics
75

Annex 5: Export of Sugar from Pakistan (FOB Price for different Destination)Fob Price $/Ton
Country 95-96 97-98 98-99 99-00 01-02 02-03 03-04 Average
Average 384 301 256 310 329 225 233 291Afganistan 496 295 252 310 329 265 257 315African Country 277 277Bangladesh 206 206China 347 347Dubai 389 318 244 204 289Ethopia 242 242Hong Kong 365 365India 363 320 257 313Indonesia 249 249Kenya 260 260Yeman 265 207 207 226Saudia Arabia 361 255 308Singapore 244 244Somalia 288 288South Korea 369 369SriLanka 305 238 230 258Tanzania 255 255Canada 293 270 281Germany 274 274Iran 256 207 232Iraq 265 265Turmanistan 234 234Czech Rep. 271 271Malaysia 253 253Source: Federal Bureau of Statistics, Government of Pakistan.
76

ANNEX 6: LEADING SUGAR EXPORTING COUNTRIES OF THE WORLD
Q in MTValue in 000 $UV in $/ton
2000 2001 2002
Rank Country Quantity Value Unit Value Quantity Value Unit Value Quantity ValueUnit Value
1 Brazil 2,158,348 437,633 203 4,083,343 878,232 215 5,274,009 982,301 172
2 EU 15 6,570,180 2,256,898 344 6,447,173 2,231,651 346 5,648,219 2,275,188 403
3 Thailand 1,765,741 309,682 175 1,027,472 236,182 230 1,969,828 383,064 194
4 India 129,631 36,587 282 1,073,149 284,684 265 1,469,875 322,235 219
5 Columbia 336,253 71,860 214 261,771 66,245 253 484,829 102,077 211
6 Malaysia 262,884 64,440 245 282,868 76,165 269 394,311 99,252 252
7 UAE 384,200 95,000 247 178,200 52,900 297 372,838 84,323 226
8 South Africa 676,244 108,447 160 278,792 72,355 260 333,715 78,214 234
9 China 410,229 82,541 201 189,477 53,297 281 317,205 75,892 239
10 Belarus 256,000 79,500 311 244,696 87,788 359 313,296 115,544 369
11 South Korea, 303,404 71,672 236 308,394 86,451 280 304,917 75,778 249
12 Mexico 197,840 36,480 184 43,154 15,632 362 296,444 77,133 260
13 Argentina 88,867 21,433 241 56,560 15,095 266 228,460 44,574 195
14 Russian Federation153,596 37,332 243 136,123 37,130 273 213,920 49,255 230
15 Poland 368,004 78,916 214 246,984 68,684 278 203,358 49,288 242
55 Pakistan 10,272 3,139 306 90 29 322 3,800 1284 338Source: UN Food and Agriculture Organisation.
77
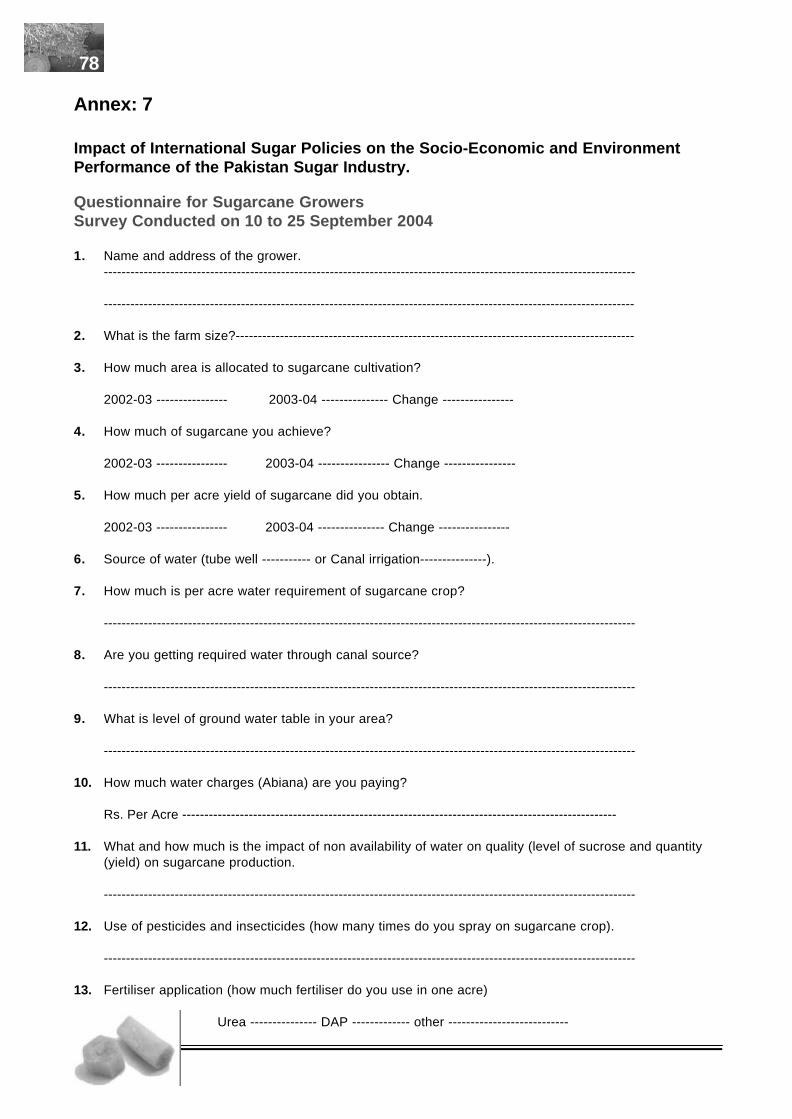
Annex: 7
Impact of International Sugar Policies on the Socio-Economic and EnvironmentPerformance of the Pakistan Sugar Industry.
Questionnaire for Sugarcane GrowersSurvey Conducted on 10 to 25 September 2004
1. Name and address of the grower.------------------------------------------------------------------------------------------------------------------------
------------------------------------------------------------------------------------------------------------------------
2. What is the farm size?------------------------------------------------------------------------------------------
3. How much area is allocated to sugarcane cultivation?
2002-03 ---------------- 2003-04 --------------- Change ----------------
4. How much of sugarcane you achieve?
2002-03 ---------------- 2003-04 ---------------- Change ----------------
5. How much per acre yield of sugarcane did you obtain.
2002-03 ---------------- 2003-04 --------------- Change ----------------
6. Source of water (tube well ----------- or Canal irrigation---------------).
7. How much is per acre water requirement of sugarcane crop?
------------------------------------------------------------------------------------------------------------------------
8. Are you getting required water through canal source?
------------------------------------------------------------------------------------------------------------------------
9. What is level of ground water table in your area?
------------------------------------------------------------------------------------------------------------------------
10. How much water charges (Abiana) are you paying?
Rs. Per Acre --------------------------------------------------------------------------------------------------
11. What and how much is the impact of non availability of water on quality (level of sucrose and quantity (yield) on sugarcane production.
------------------------------------------------------------------------------------------------------------------------
12. Use of pesticides and insecticides (how many times do you spray on sugarcane crop).
------------------------------------------------------------------------------------------------------------------------
13. Fertiliser application (how much fertiliser do you use in one acre)
Urea --------------- DAP ------------- other ---------------------------
78

14. Did you find any changes in soil due to water shortage, excessive use of pesticides, and chemical fertilizer in sugarcane area?
------------------------------------------------------------------------------------------------------------------------
------------------------------------------------------------------------------------------------------------------------
15. Did you find any changes in sugarcane productivity (yield and sucrose) due to water shortage,excessive use of pesticides, and chemical fertiliser in sugarcane area?
------------------------------------------------------------------------------------------------------------------------
------------------------------------------------------------------------------------------------------------------------
16. What are the impact of chemical poisoning on eco-system and silt runoff from sugarcane field on eco-system
------------------------------------------------------------------------------------------------------------------------
17. What are the impacts of agro-chemical run-off, silt runoff, nutrient leaching from the sugarcane field, salinity and water logging on sugarcane crop.
------------------------------------------------------------------------------------------------------------------------
------------------------------------------------------------------------------------------------------------------------
18. How you counter suffocation in sugarcane farm particularly on labour(men, women children).
------------------------------------------------------------------------------------------------------------------------
19. What are the safety measures to avoid suffocation and other chemical effects? For example any medical facility in the village.
----------------------------------------------------------------------------------------------------------------------
------------------------------------------------------------------------------------------------------------------------
20. Is there any Extension Services provided by any Govt. Organization.
------------------------------------------------------------------------------------------------------------------------
21. What farm machinery do you use in sugarcane cultivation?
------------------------------------------------------------------------------------------------------------------------
22. If water crisis continues would you continue to grow sugarcane crop?
------------------------------------------------------------------------------------------------------------------------
23. Why are you producing sugarcane and not other crops, is it profitable compared with other crops?
------------------------------------------------------------------------------------------------------------------------
24. Which alternate crop would you grow, Sugar beet ------------- other ----------
79

25. How much is average per acre cost of production of sugarcane?
Rs. / Acre ------------ OR Rs. ton ---------------------
26. Are you selling sugarcane to sugar mill ------- or gur producer ------- ?
27. How much is the distance from farm to mill gate. Do you think transportation of sugarcane createsenvironment problem for general people?
------------------------------------------------------------------------------------------------------------------------
28. Market approach do you sale through mill contractor ------- or middlemen --------
29. Time period required for marketing (hand over). Hours or Days? ----------------
30. How much is the loss of sugarcane weight due to stay out side the mill?
------------------------------------------------------------------------------------------------------------------------
31. What is payment schedule by mill No of days ---------------
32. What is mode of payment Cash --------------- OR CPR -------------?
33. What are the other marketing problems do you face and how these can be removed ?
a. -----------------------------------------------------------------------------------------------------b. -----------------------------------------------------------------------------------------------------c. -----------------------------------------------------------------------------------------------------d. -----------------------------------------------------------------------------------------------------
34. Is the mill provide any training and guidance for farm management practices?If yes, which type. -------------------------------------------------------------------
35. Do you know about WTO Trade regime?
------------------------------------------------------------------------------------------------------------------------
36. If government will not fix or announce sugarcane support price what would be your reaction in case of increase or decrease of market price?
------------------------------------------------------------------------------------------------------------------------
37. Did you receive any financial support from industry?
80

Impact of International Sugar Policies on the Socio-Economic and EnvironmentPerformance of the Pakistan Sugar Industry.
Questionnaire for Sugar manufacturers Industry Survey Conducted on 10 to 25 September 2004
1. Name and Location or address of the Mill.
------------------------------------------------------------------------------------------------------------------------
2. How much is sugarcane crushing capacity? ----------------------------------------
3. Size of farm owned by the mill? -----------------------------------------------------
4. Number of Labour employed by mill? (permanent ------------, seasonal -----------)
5. Level of Skill of the labour unskilled -------- semiskilled --------- skilled ----------
6. What is average wage rate of labour in your sugar mill for?
unskilled -------- semiskilled --------- skilled ----------?
7. Do you have social security system
Health --------, education ---------, insurance ----------------, transport ----------
8. Do you follow labour laws? -----------------------------------------------------------
9. Do you provide training facilities provided to labour -------- or farmers ----------
10. Do you provide credit to farmers? -------------------------------------------------
11. Do you have contract with growers for the purchase of sugarcane?
-----------------------------------------------------------------------------------------
12. Do you pay quality premium to growers? Yes OR No if yes how much?
13. Are you satisfied with the use of Cess fund for betterment of environment?
-----------------------------------------------------------------------------------------
14. How much sale of by products contributes in the overall income of the mill?
------------------------------------------------------------------------------------------------------------------------
15. Are you aware about the environment effects of waste water, smoke and burning of sugar wastage?
Yes ?? or No ?
16. What safety measures have you taken to avoid effects of these hazards?
------------------------------------------------------------------------------------------------------------------------
17. What is the payment schedule to growers? --------------------------------
18. How much is the average cost of per ton sugar production? Rs/ton --------
81

19. What is the mill gate price of per ton sugar. -----------------------------------
20. How much is the profitability margin in per ton sugar sale in domestic market.
------------------------------------------------------------------------------------------------------------------------
21. What you would suggest to minimize the cost of production to remain competitive in the international markets?
------------------------------------------------------------------------------------------------------------------------
22. Are you aware about the decision of Dispute Settlement Body (DSB) of WTO in favour of Brazil, Australia and Thailand on the case of sugar subsidy provided by EU?
------------------------------------------------------------------------------------------------------------------------
23. What impact do you foresee of this decision on Pakistan's sugar industry now and at the beginning 2006. (New transition period of AoA)
------------------------------------------------------------------------------------------------------------------------
24. Are you satisfied with GOP policy regarding sugar sector in WTO and at multilateral forum like EU.
------------------------------------------------------------------------------------------------------------------------
25. How and what export incidentals can be minimized for a minimum fob price.
------------------------------------------------------------------------------------------------------------------------
26. Are you enjoying any production or export subsidy provided by the government to remain competitive inthe international market?
If yes in what form and how much ---------------------------------------------------- If not would you demand in what form and how much? ---------------------------
27. What effective tariff protection or non tariff measures would you suggest to restrict sugar dumping in thecountry at the beginning of 2006? ------------------------------------------------------------------------------------------------------------------------
28. How much surplus sugar you can export each year. ------------------------------
29. In which market do you thing your exports are competitive
1. .................. 2. ................... 3. .................... 4. ..................... 5. .....................
30. Which countries' are Pakistan's major competitors to different markets.
1. .................. 2. ................... 3. .................... 4. ..................... 5. .....................
31. What type of export subsidy they are enjoying form their governments?
82

Impact of International Sugar Policies on the Socio-Economic and Environment Performance of thePakistan Sugar Industry.
Questionnaire for Sugarcane MerchantsSurvey Conducted on 10 to 25 September 2004
1. Name and address of the Merchant (exporter, importer and whole seller)?
---------------------------------------------------------------------------------------------------------------
2. What do you know about WTO and EU sugar trade regime?
---------------------------------------------------------------------------------------------------------------
3. How much EU subsidized sugar enters in Pakistan and at what price?
----------------------------------------------------------------------------------------------------------------
4. Does this lower the domestic price, if yes how much?
----------------------------------------------------------------------------------------------------------------
5. Is the imported sugar from the EU replacing any local production? If so how much, what value.
----------------------------------------------------------------------------------------------------------------
6. Is EU imported sugar replacing cheap import from other sources in Pakistan if yes - how much and what is the cost to the country?
----------------------------------------------------------------------------------------------------------------
7. What proportion of total imports and domestic production and consumption do these imports represent?
----------------------------------------------------------------------------------------------------------------
8. How this dumping by EU can be restricted?
----------------------------------------------------------------------------------------------------------------
9. What effective tariff protection or non tariff measures do you suggest to restrict sugar dumping?
----------------------------------------------------------------------------------------------------------------
10. Does Pakistan regularly export sugar if yes how much, what value?
----------------------------------------------------------------------------------------------------------------
11. What proportion of Pakistan production is exported?
----------------------------------------------------------------------------------------------------------------
12. Does the export price reflect production costs?
----------------------------------------------------------------------------------------------------------------
83

84
13. Do you receive export subsidy from government? If yes how much per ton?
---------------------------------------------------------------------------------------------------------------- 14. Which countries are the major destinations of Pakistani sugar?
----------------------------------------------------------------------------------------------------------------
15. Which countries' are Pakistan's major competitors in these destinations?
1. .................. 2. ................... 3. .................... 4. ..................... 5. .....................
16. Does Pakistan sugar compete with dumped sugar from EU, US or Japan in these destinations?
----------------------------------------------------------------------------------------------------------------
17. How much EU sugar exporters receiving direct export subsidies to compete in international market?
----------------------------------------------------------------------------------------------------------------
18. How would you compare European Union sugar prices with world prices in these countries?
----------------------------------------------------------------------------------------------------------------
19. At present how much is the profitability margin in per ton sugar sale in international markets?
-----------------------------------------------------------------------------------------------------------------
20. Has there been loss of profitability due to European Union sugar competing in other countries?
-----------------------------------------------------------------------------------------------------------------
21. How much value is lost to the sugar sector because of lost revenue if sugar does not compete with others in case exports?
--------------------------------------------------------------------------------------------------------------
22. How can you counter competition in export destinations with EU dumped sugar?
----------------------------------------------------------------------------------------------------------------
23. What are the restrictions on exports i.e. tariffs, fix quotas a year and differential tariffs on processed sugar and raw sugar in export destination of Pakistani sugar?
-----------------------------------------------------------------------------------------------------------------
24. How and what export incidentals can be minimized to lower fob price.
------------------------------------------------------------------------------------------------------------------
25. Do you want export subsidy from government to remain competitive in the international market. If yes in
what form and how much --------------------------------------------------------------------------------?
26. Are you aware of the decision of Dispute Settlement Body (DSB) of WTO in favour of Brazil, Australia and Thailand in the case of sugar subsidy provided by EU.
----------------------------------------------------------------------------------------------------------------

27. What impact do you foresee of this decision and EU subsidy on Pakistan's sugar sector?
----------------------------------------------------------------------------------------------------------------
28. If there would be reforms in the EU sugar trade regime what impacts of these reforms on Pakistan sugar exports?
-----------------------------------------------------------------------------------------------------------------
29. What could be the fate of sugar if tariff and quota barriers from developed countries are removed?
-----------------------------------------------------------------------------------------------------------------
30. Would production expand, contract, shift?
-----------------------------------------------------------------------------------------------------------------
31. What would be the likely socio-economic and environmental impacts of these changes on Pakistan's sugar sector?
-----------------------------------------------------------------------------------------------------------------
32. What are the marketing problems in the domestic market do you face and how these can be removed?
----------------------------------------------------------------------------------------------------------------- ----------------------------------------------------------------------------------------------------------------- ----------------------------------------------------------------------------------------------------------------- -----------------------------------------------------------------------------------------------------------------
33. Are you satisfied with GOP policy regarding sugar sector in WTO and at multilateral forum like EU. -
-----------------------------------------------------------------------------------------------------------------
85

Impact of International Sugar Policies on the Socio-Economic and EnvironmentPerformance of the Pakistan Sugar Industry.
Questionnaire for ScientistsSurvey Conducted on 10 to 25 September 2004
1. Name and institution of Scientist.
--------------------------------------------------------------------------------------------------------------------
2. Area of Research ----------------------------------------------------------
3. What and how much is the impact of non availability of water on quality (level of sucrose and quantity (yield) on sugarcane production.
--------------------------------------------------------------------------------------------------------------------
4. How many doses of pesticides do you suggest to avoid any residual effects on sugarcane and sugar
--------------------------------------------------------------------------------------------------------------------
5. How much use of fertilizer do you suggest on per acre of sugarcane farm?
Urea --------------- DAP ------------- other ---------------------------
6. Did you find any changes in soil due to water shortage, excessive use of pesticides, and chemicalfertilizer in sugarcane area?
------------------------------------------------------------------------------------------------------------------------
------------------------------------------------------------------------------------------------------------------------
7. Did you find any changes in sugarcane productivity (yield and sucrose) due to water shortage,excessive use of pesticides, and chemical fertilizer in sugarcane area?
-------------------------------------------------------------------------------------------------------------------
-------------------------------------------------------------------------------------------------------------------
8. What are impacts of chemical poisoning on eco-system and silt runoff from sugarcane field on eco-system
--------------------------------------------------------------------------------------------------------------------
9. What are the impacts of agro-chemical run-off, silt runoff, nutrient leaching from the sugarcane field, salinity and water logging on sugarcane crop.
-------------------------------------------------------------------------------------------------------------------- 10. How you counter suffocation in sugarcane farm particularly on labour
(men, women children).
--------------------------------------------------------------------------------------------------------------------
11. What are the safety measures to avoid suffocation and other chemical effects?
----------------------------------------------------------------------------------------------------------------------------------------------------------------------------------------------------------------------------------
86

12. If water crisis continues which crop would you suggest replacing sugarcane?
--------------------------------------------------------------------------------------------------------------------
13. What are the causes of depletion of soil mineral due to sugarcane crop and how it can be stopped andrecovered?
--------------------------------------------------------------------------------------------------------------------
14. What are the effects on an-noxious gases released by sugarcane and their impact on environment
--------------------------------------------------------------------------------------------------------------------
15. What is chemistry of the wastages of the sugar industry and its impact onenvironment?
--------------------------------------------------------------------------------------------------------------------
16. What is chemical composition of the smoke and its impact on environment and human health?
--------------------------------------------------------------------------------------------------------------------
17. Do you think that sugar industry and sugarcane grower should pay more attention on environment hazards?
--------------------------------------------------------------------------------------------------------------------
18. Any research facility for the sugar industrialist and the growers in your institution.
------------------------------------------------------------------------------------------------------------------------
19. Any Scientific suggestion for reducing impact on environment due to sugarcane and sugar production.
-----------------------------------------------------------------------------------------------------
87

Agenda for the Meeting held on 5 October 2004 at Holiday Inn Lahore on the Impactof International Sugar Policies on the Socio-economic and environment perform-ance of the Pakistan sugar Industry
In a case filed by Brazil, Thailand and Australia against the EU, the Dispute Settlement Body of WTO hasruled that European exports, up to four times the permitted amount of subsidized sugar each are illegal. Dueto this illegal dumping millions of tonnes of subsidized sugar on the world market and the EU is destroyingthe livelihood of poor farmers in the developing countries. EU dumping has depressed world prices and ledto foreign exchange losses in the developing countries. However, until now it is not known that how muchEU sugar dumped to Pakistan and to what extent it has negatively influenced the Pakistan's sugar sector.The WTO ruling is trump for developing counties and a death toll for EU export subsidies which underminepoor farmers' livelihoods and deny them the chance to trade their way out of poverty. It is expected that theEU would now act to reform the regime in a way that benefits poor countries.
The Centre for Policy & Development Alternatives (CPDA), on behalf of World Wildlife Fund is conductinga study to assess an impact of current global production and trade policies on the socio economic and envi-ronmental performance of the Pakistan sugar sector. Another objective is to asses the likely impact of possi-ble reforms in the existing policies of the EU. However, these impacts could be positive or negative onPakistan's sugar sector. To assess these effects views and comments of all stakeholders are invited on thefollowing agenda items.
1. Development of Pakistan's Sugar Industry compared with requirements. Contribution of sugar sector to national economy, locations of sugar factories, availability of sugarcane etc.
2. Current Domestic Sugar production and Trade Scenario particularly domestic sugar production and trade problems etc.
3. Socio-economic and environmental performance of Sugar Sector like number of growers/workers, in a sugar mill wage rates/earnings from sugar, level of skills amongst industry, access to resources- land, water, capital, extension services, etc of sugar workers and growers. Environmental issues surrounding sugar industries.
4. International Sugar Policies Subsidies given by EU, Japan US and other countries on sugar andsugarcane to farmers and what are the global impacts of price suppression, export dumping etc.
5. Impacts of EU reforms on Pakistan's Domestic Sugar Production and imports. How much subsidized sugar particularly from EU entering in Pakistan and at what price? Does this lowering the price in Pakistan? And what is the cost to the country? What proportion of total imports and domestic productionand consumption do these imports represent? Are imports replacing local production? How this dumpingand cheap import can be restricted.
6. Impacts of EU reforms on Pakistan's domestic sugar production and export. Under this agenda item there is a need comments on the question that does Pakistan can exports to the European Union like India and ACP countries? Does Pakistan exports to other countries if yes how much, and at what fob price? Does it would reflect production costs? What proportion of Pakistan production can be exported? Do the sugar industry or sugar exporters need production and export subsidies? If not does Pakistani sugar can compete with dumped sugar from EU, US or Japan in international markets.
7. Competition in International markets. Is Pakistan fob price comparable to world prices and EU sugar prices in international markets. What are the tariffs, fix quotas and differential tariffs on processed sugar and raw sugar in case of access to the markets of other countries and European Union? What is the response of Pakistan's sugar industry to depressed world prices and dumped sugar in Pakistan and/or in third countries? Is the industry increasing production to retain value by either expanding the area and/or intensifying production. Lowering costs to retain profitability by either reducing environmental standards and/or improving the efficiency of resource use?
88

8. Chances of stopping sugar production? or moving into other commodities?
9. Impact of International Reforms on Pakistan's Sugar Production and Environment What might be the impacts of EU sugar reforms on the industry in Pakistan? Would production expand, contract, shift? How the fob price of sugar behave? What would be the likely socio-economic andenvironmental impacts of these changes? How could implementation of WTO rules impact the Pakistan sugar industry and sugarcane farmers.
10. Impact of International Sugar Reforms on Pakistan's Sugar Environment Would you please comments on likely positive impacts of international sugar reforms like improvingefficiency of resource use and negative impacts like lowering environmental standards. Direct impacts like expanding the area under sugarcane and indirect impacts like moving out of sugar into a different commodity - some better some worse for the environment).
11. Recommendations for sustainable sugar production in the present and future scenario.
89

Our Mission
WWF aims to stop the degradation of the planet’s natural environmentand to build a future in which humans live in harmony with nature, by:
? conserving the world’s biological diversity? ensuring that the use of renewable natural resources is sustainable? promoting the reduction of pollution and wasteful consumption
WWF - PAKISTAN OFFICES
Everyday the burden on ourenvironment grows heavier.Increasing pollution, decreasingnatural resources and habitatdestruction affect the quality oflife for all living things.Become a part of the solutionby becoming a Corporate orIndividual member of WWF -Pakistan. Members areregularly updated onconservation issues and haveaccess to WWF resources andactivities.WWF - Pakistan, 2005
C/o Soan Valley Development ProjectMardwal ChowkNowsheraDistrict KhushabTel: +92 454 610037
Eidgah, AstoreTel: +92 5817 58060
Imit, Karambar ValleyTel: (inform WWF - Gilgit Office)
C/o Divisional Forest OfficeZhob, BalochistanTel and fax: +92 822 413376
Jiwani, Tehsil JiwaniDistrict GwadarTel: +92 866 310008
Wetland CentreOpp Hut # 103 NSandspit, KarachiTel: +92 21 2353741-3
Mochi Dhara, NathiagaliDistrict AbbotabadTel and fax: +92 992 355210E-mail: [email protected]
PAMP OfficeAirport RoadBalach, ChitralTel: +92 933 413159, 412659Fax: +92 933 413683
Head OfficeFerozepur Road, PO Box 5180Lahore - 54600Tel: +92 42 5862360, 5869429UAN: 111-WWFPAK (993725)Fax: +92 42 5862358E-mail: [email protected]
IslamabadHouse # 60, Bazar RoadSector G/6-4 IslamabadTel: +92 51 2829456Fax: +92 51 2820469E-mail: [email protected]
KarachiMarketing Unit, 12th FloorSidco Avenue Centre, 264-R A LinesStratchen Road, Karachi - 74200Tel: +92 21 5689604/5674881/5Fax: +92 21 5680476/5689604E-mail: [email protected]
Conservation Unit, Room 606-6076th Floor, Fortune Centre, Block 6 PECHSShahrah-e-Faisal, KarachiTel: +92 21 4544791-92 Fax: +92 21 4544790E-mail: [email protected]
Peshawar34-D-2, Sahibzada Abdul Qayyum RoadUniversity Town, PeshawarTel:+92 91 841593 Fax: +92 91 841594E-mail: [email protected]
GilgitNLI Colony, Near Imamia Eid GahShahrah-e-Quaid-e-AzamJatial, GilgitTel: +92 572-55658Fax: +92 57255688E-mail: [email protected]
QuettaKilli Gishkori, Sabzal Road, QuettaTel: +92 81 452250Fax: +92 81 452251E-mail: [email protected]
Muzaffarabad, AJKHouse # B-72, Chattar Housing SchemeUpper Chattar, MuzaffarabadAzad KashmirTel: +92 58810 32149E-mail: [email protected]
PROJECT OFFICES